Download as ODP, PPTX
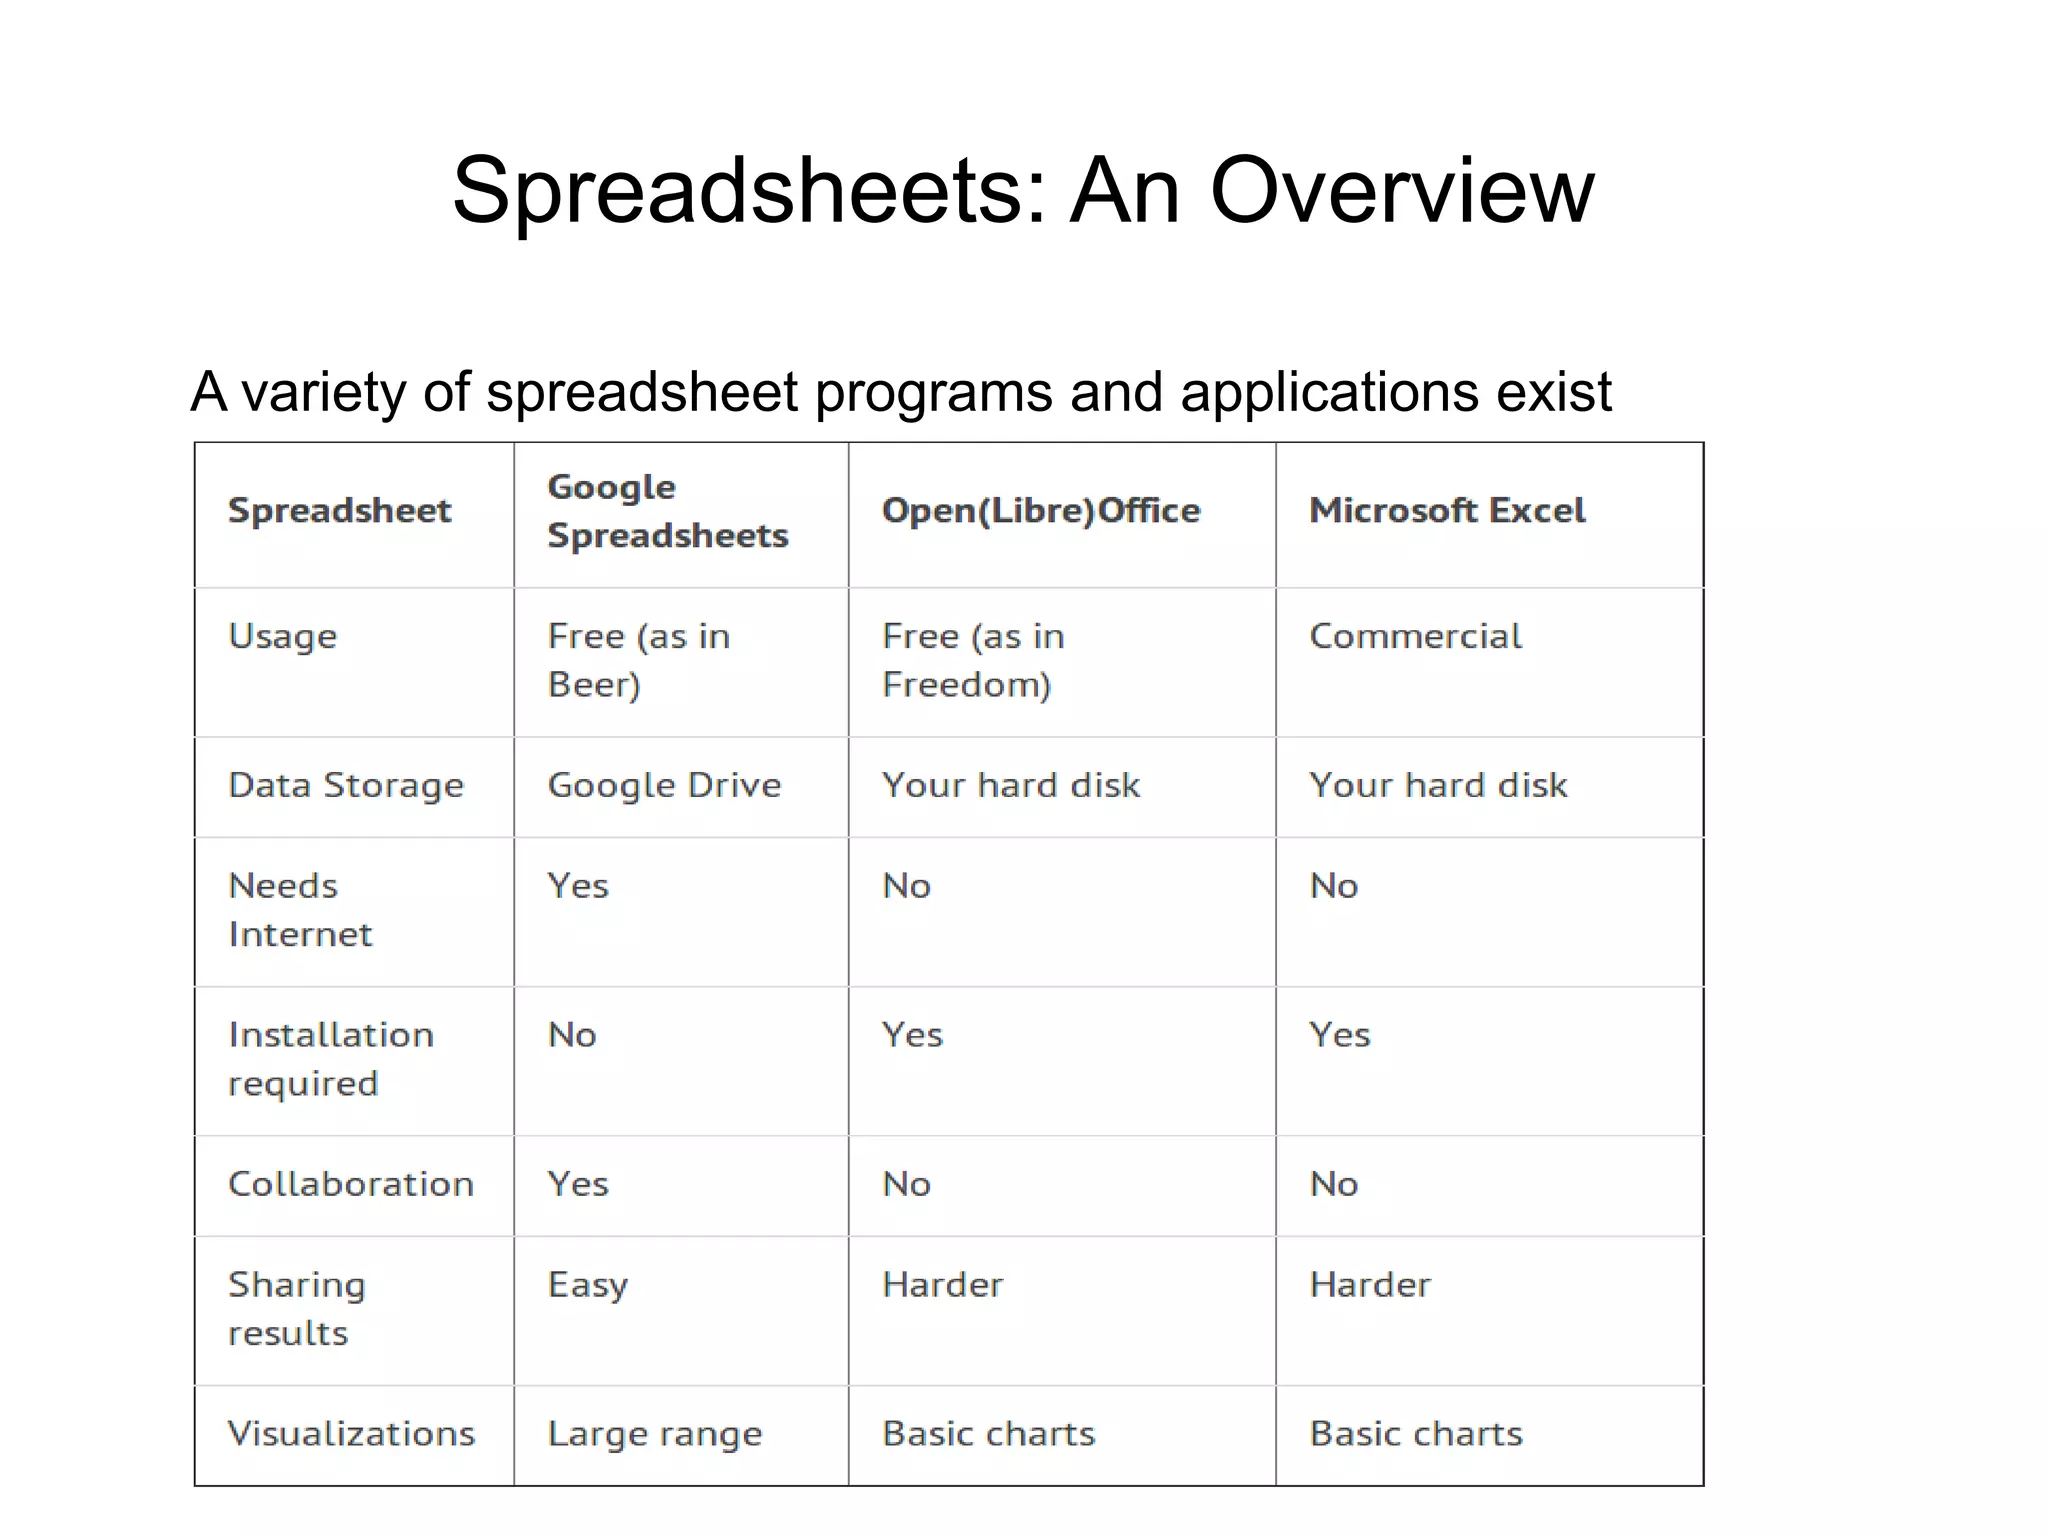

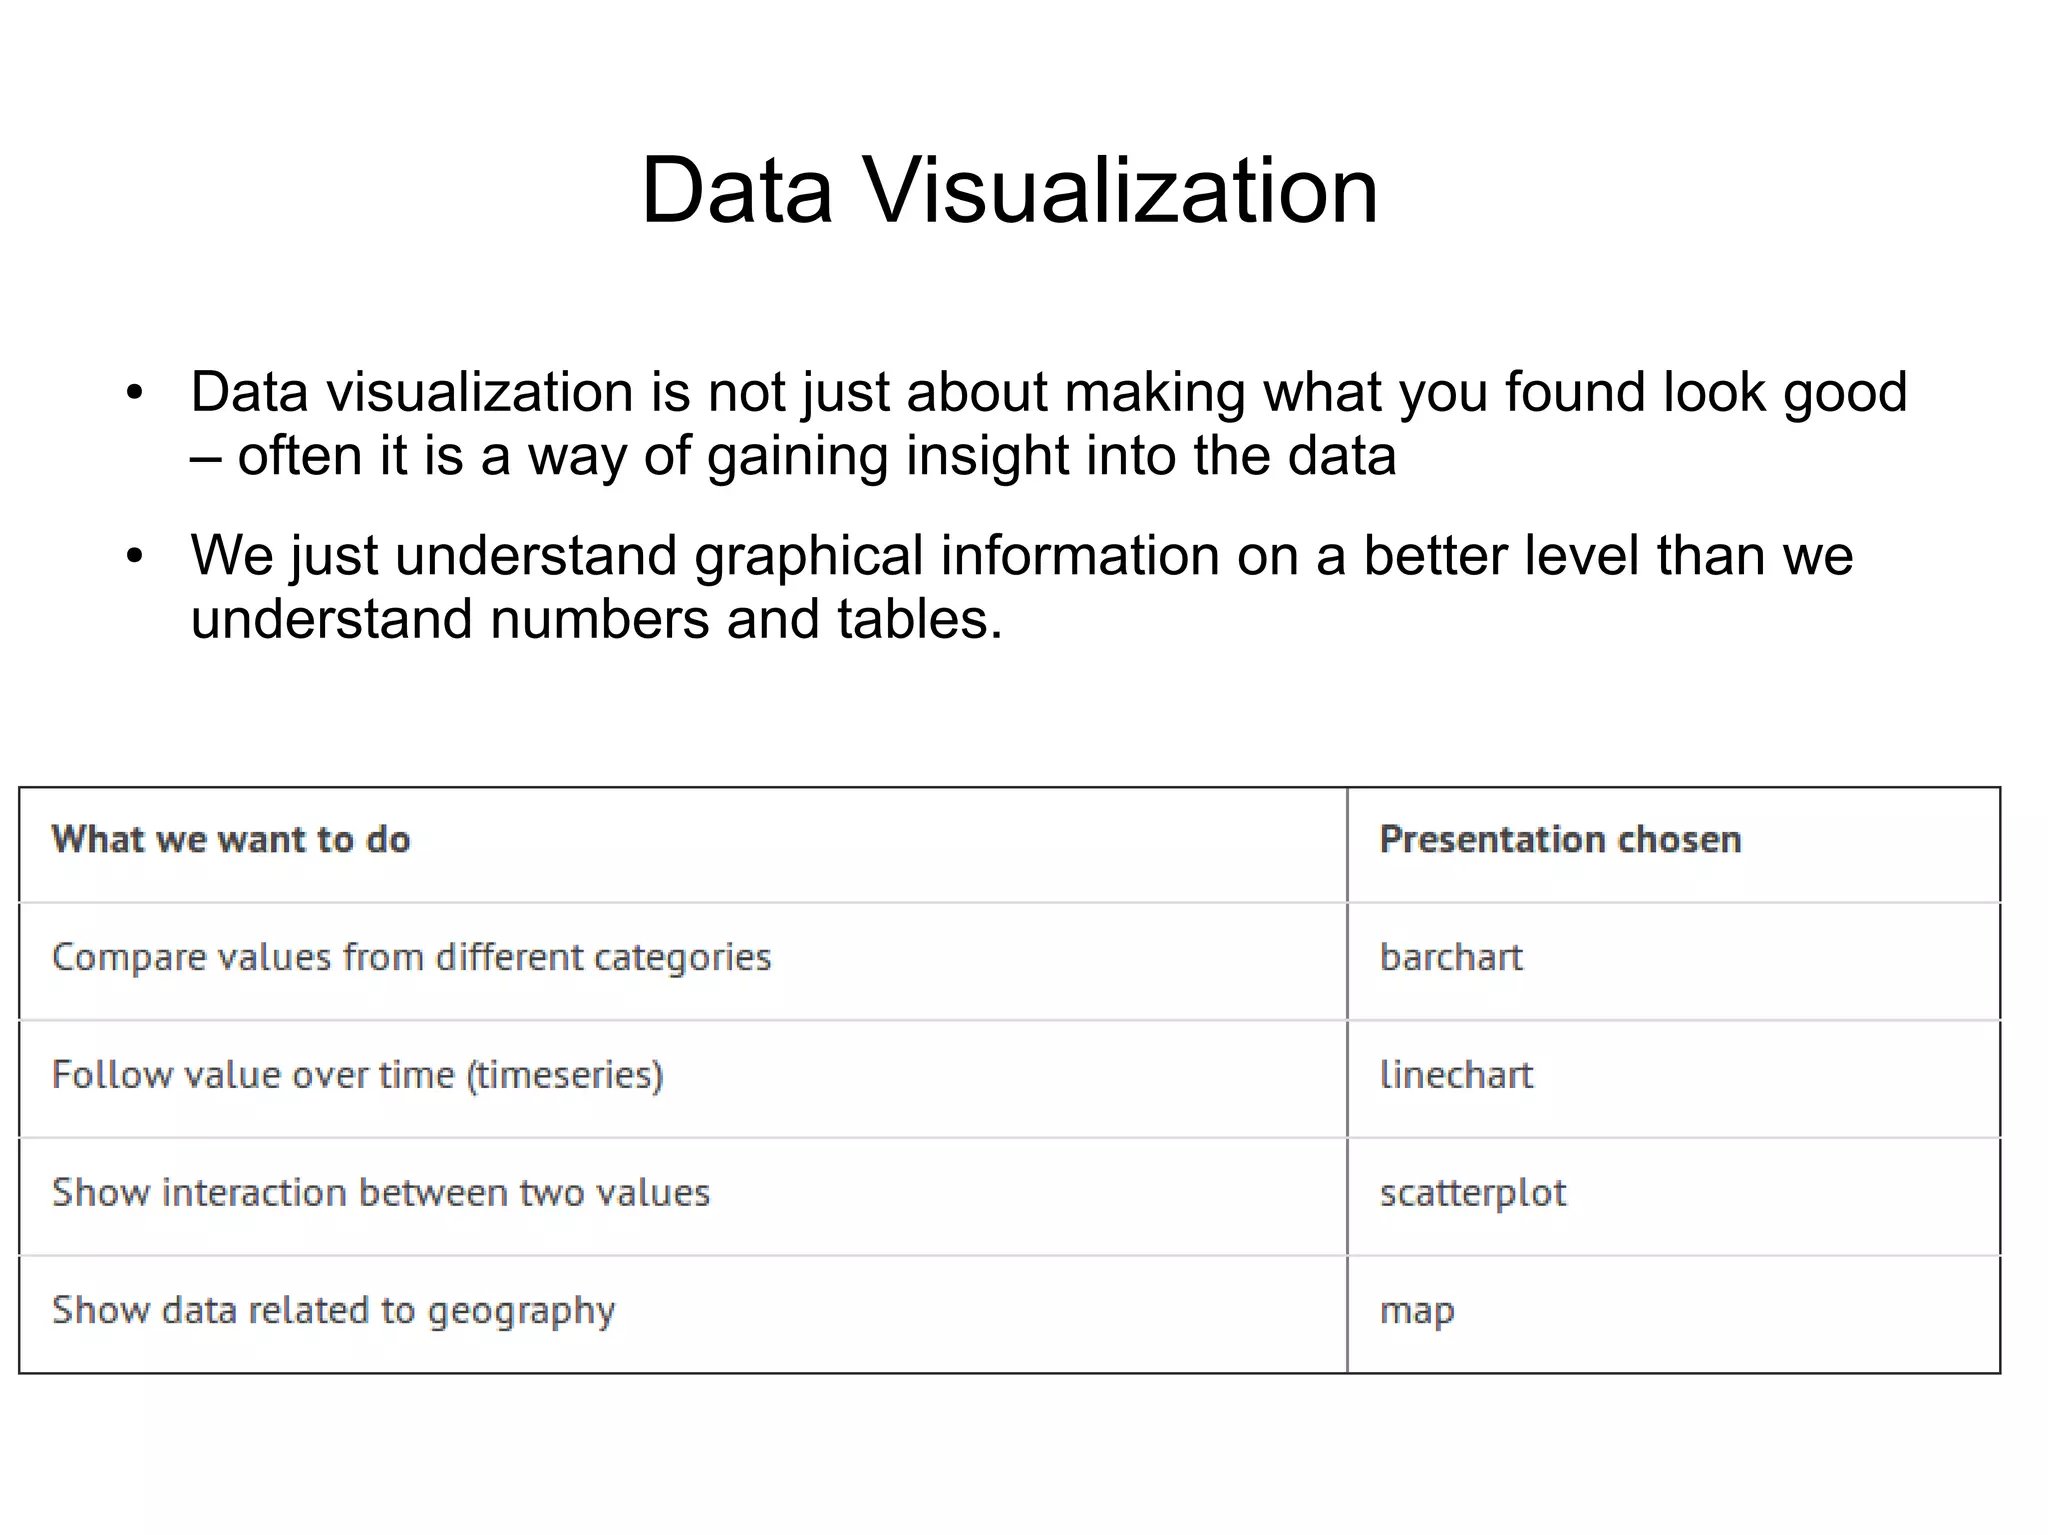


Spreadsheets are a basic tool for organizing and analyzing data. They allow users to sort data into logical order, filter out unwanted values, and visualize data through graphs and charts. This helps users gain insights from datasets by orienting themselves to extremes, focusing on relevant values, and understanding trends in a graphical format rather than just numbers. The document demonstrates these spreadsheet functions through examples to show how they are commonly used to wrangle and better understand data.


![Cyber Unions, Web 2.0 [Using New Technology to Organize]](https://cdn.slidesharecdn.com/ss_thumbnails/usingtechnology-ncell-130221014933-phpapp01-thumbnail.jpg?width=640&height=640&fit=bounds)


