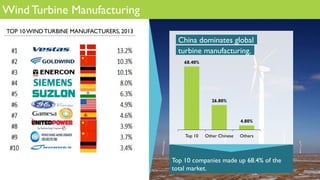
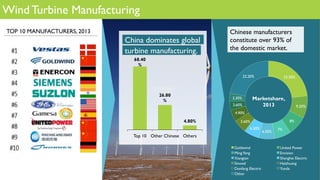
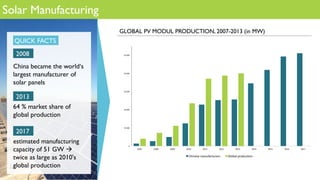
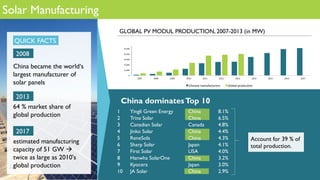
Download as PDF, PPTX


![The Government‘s Agenda for Change
2005 2020
Carbon Dioxide
Emissions
per unit of GDP
40% - 45%
[CAT
EGO
RY
NAM
E]
[VAL
UE]
[CAT
EGO
RY
NAM
E]
85%
Total Consumption
of Primary Energy
in 2020
An ambitious plan](https://image.slidesharecdn.com/solarenergychina-170805114828/85/Solar-energy-china-7-320.jpg)
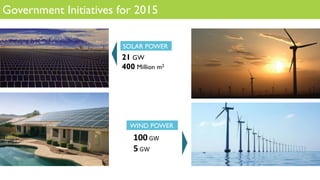
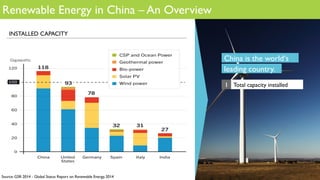
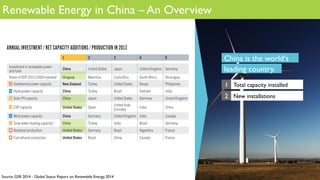
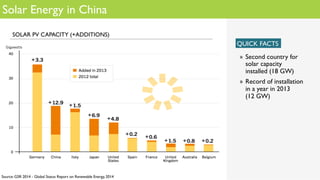
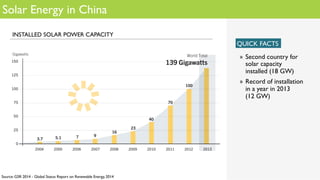
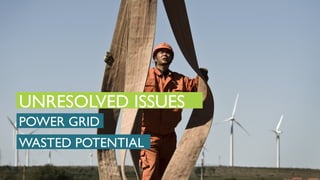
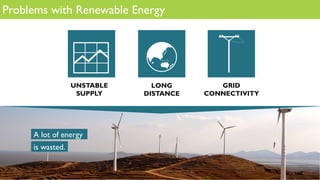
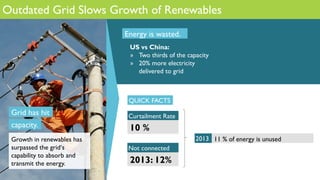

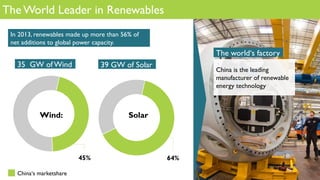


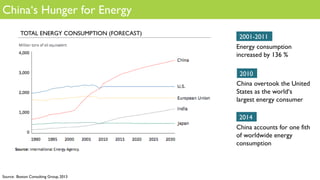
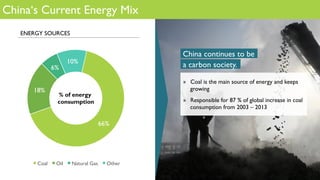
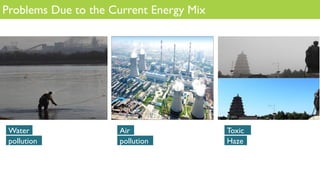
China has significantly increased its total energy consumption in recent decades and now accounts for one-fifth of worldwide energy use, relying heavily on coal which accounts for 66% of its energy mix. However, air and water pollution from coal have spurred government plans to increase renewable energy sources such as solar and wind power. China leads the world in installed renewable capacity and added more renewable energy than any other country in 2013. It is also the top manufacturer of renewable technologies, dominating the global market for solar panels and wind turbines. However, China still faces challenges integrating renewable energy onto its grid and transmitting power from renewable sources far from demand centers.


