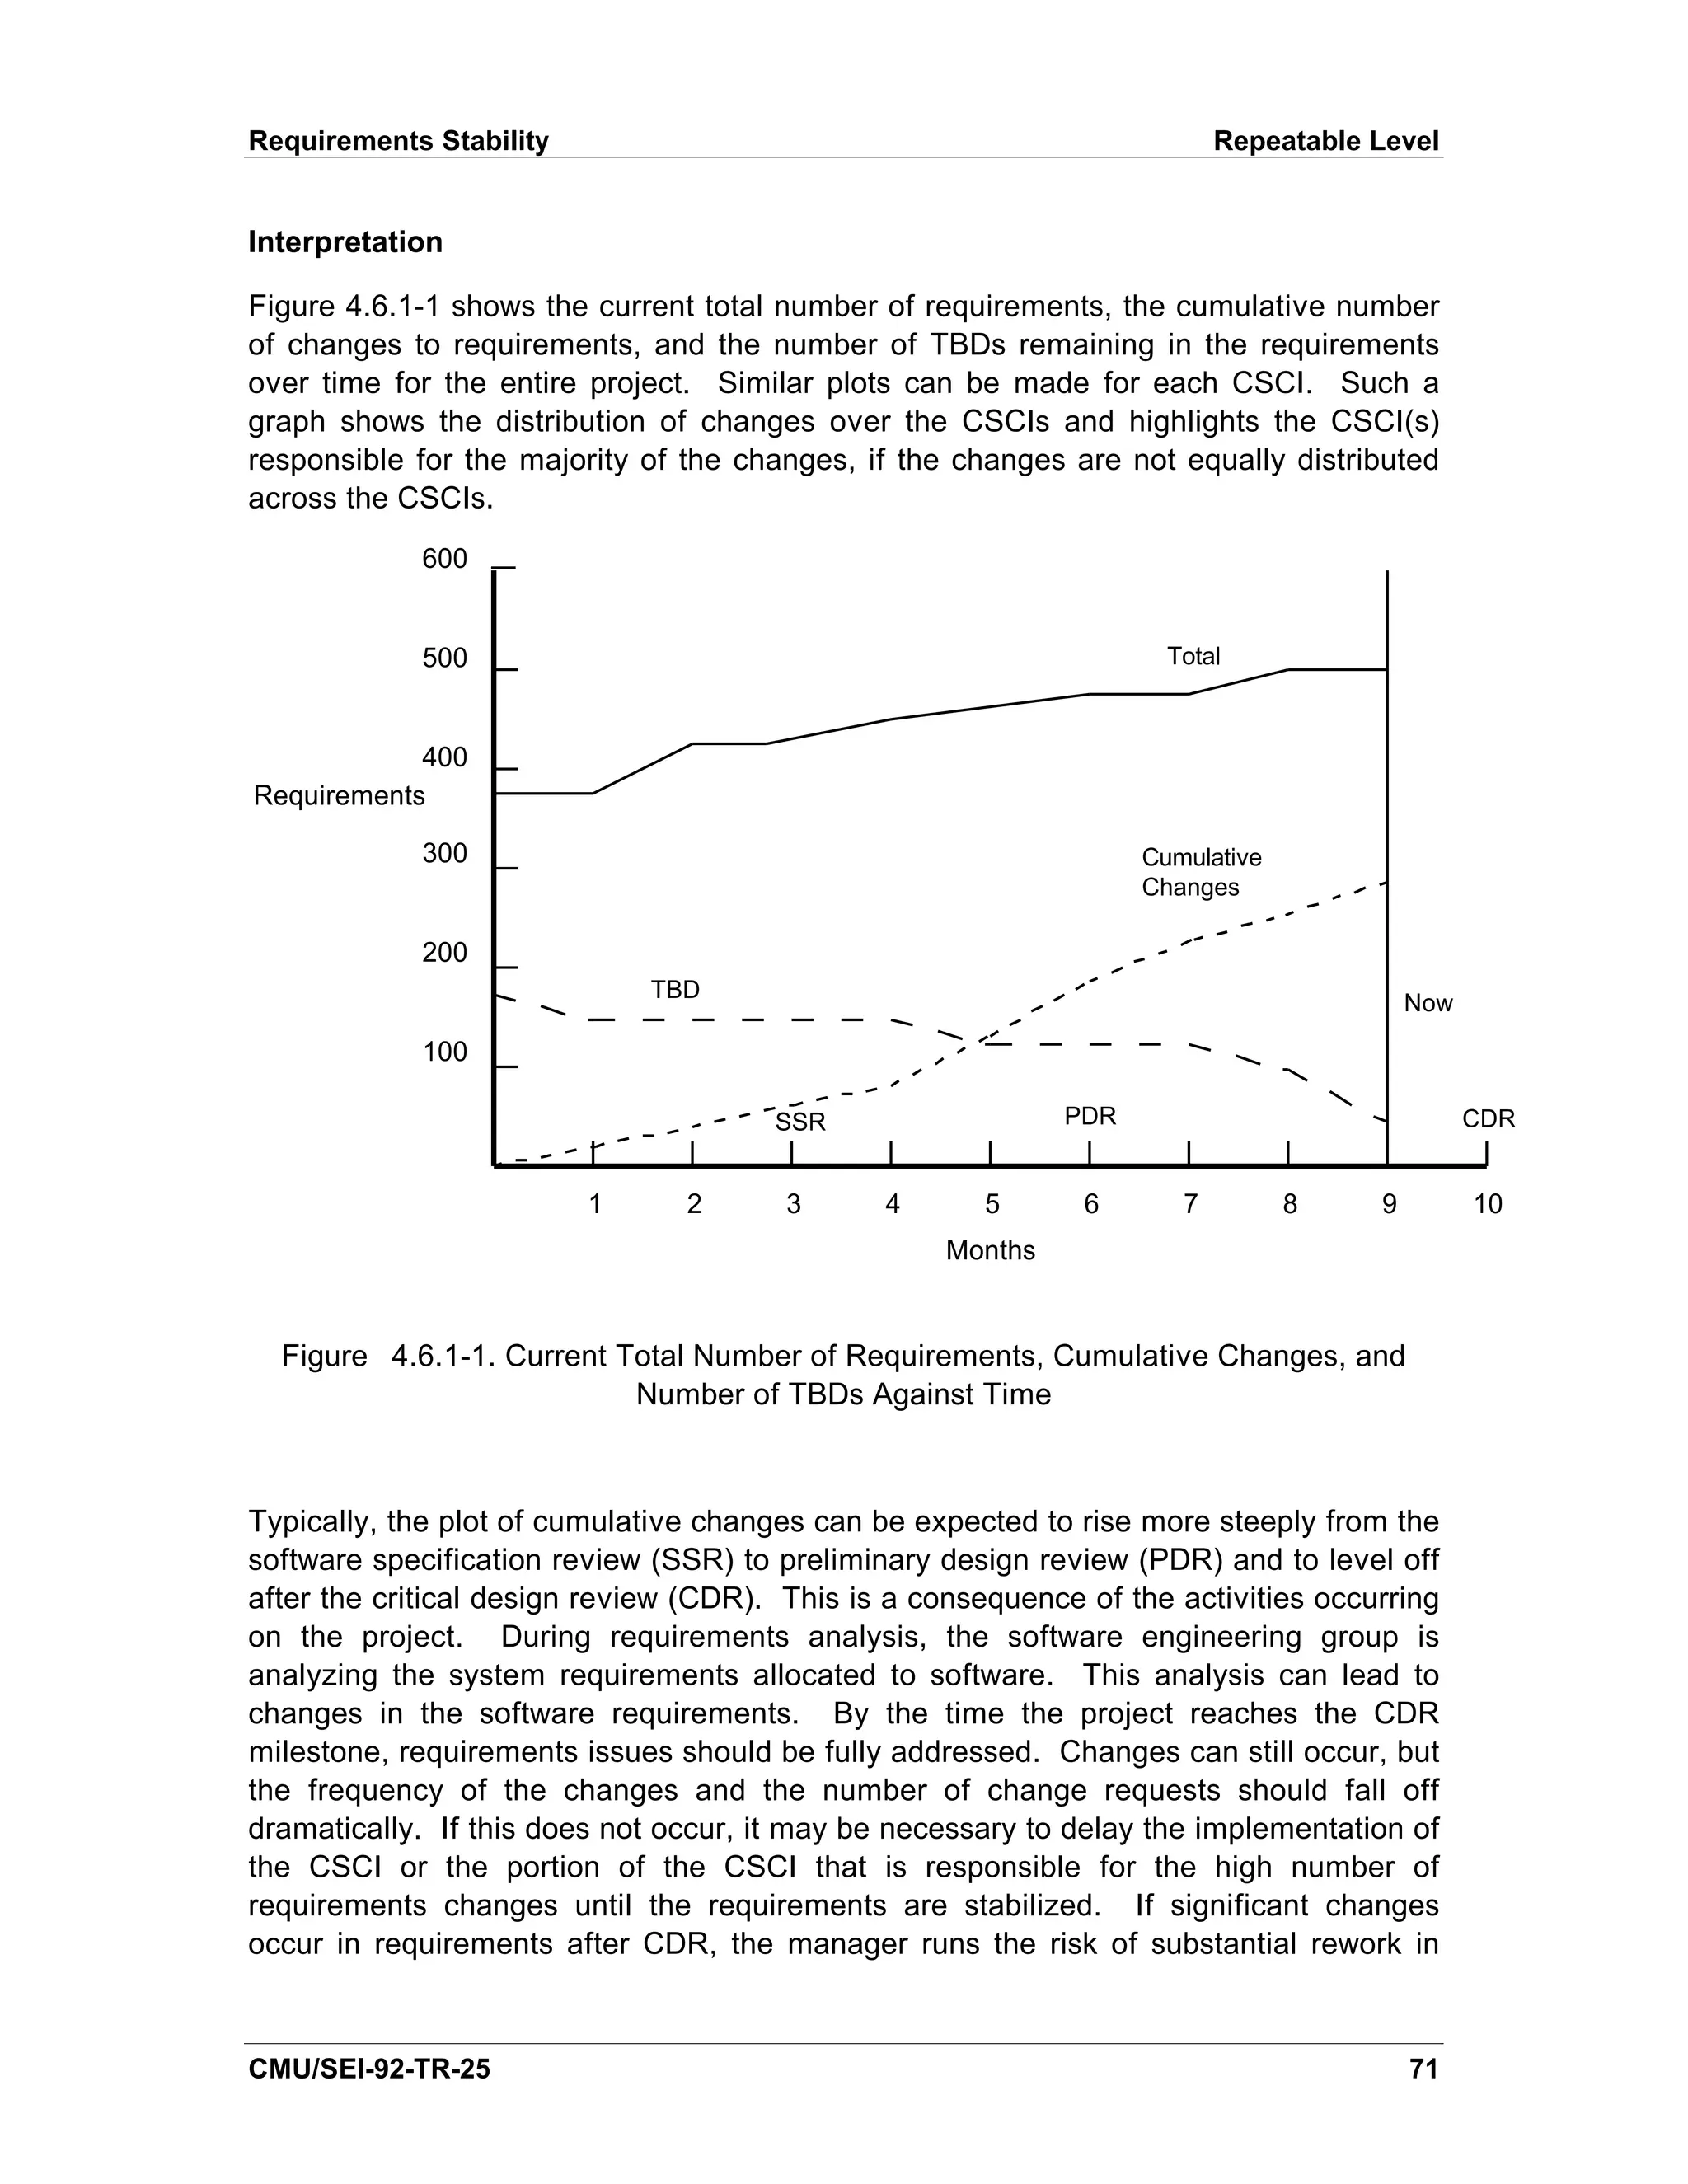
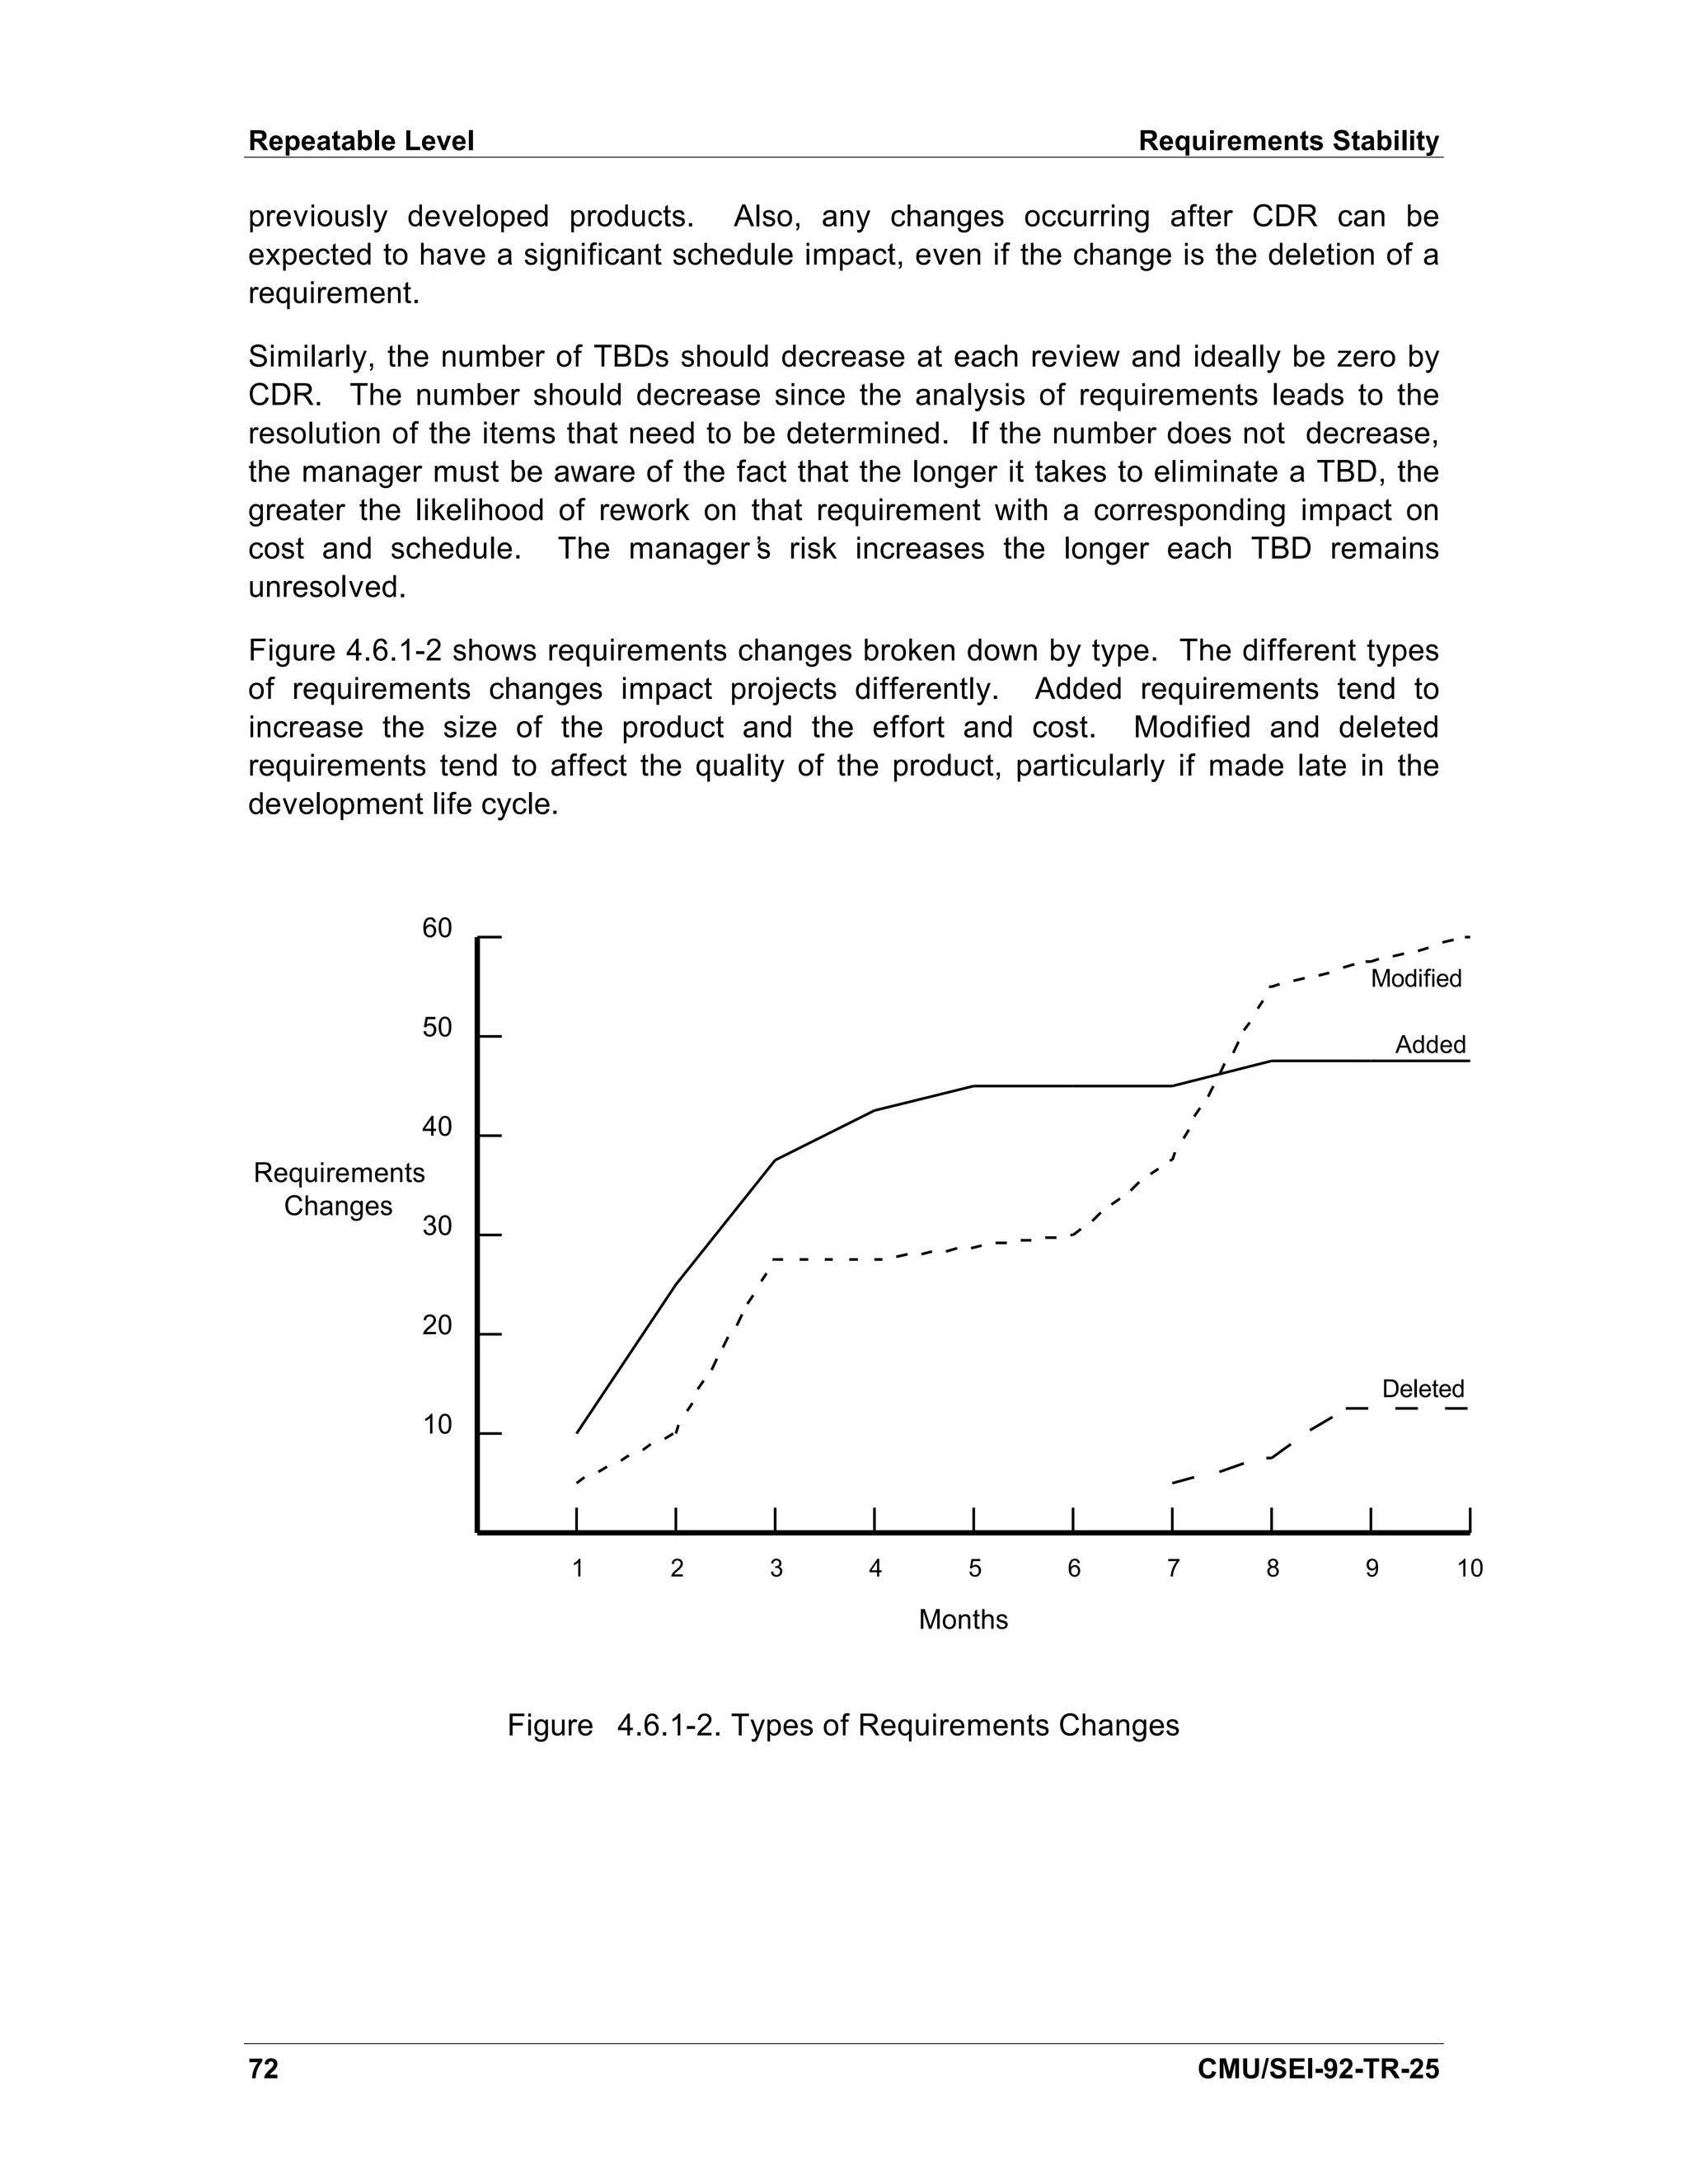
Download to read offline


![Software Measures and the Capability Maturity
Model
Abstract. This document describes a set of software measures that are
compatible with the measurement practices described in the Capability
Maturity Model for Software. These measures, in the form of software
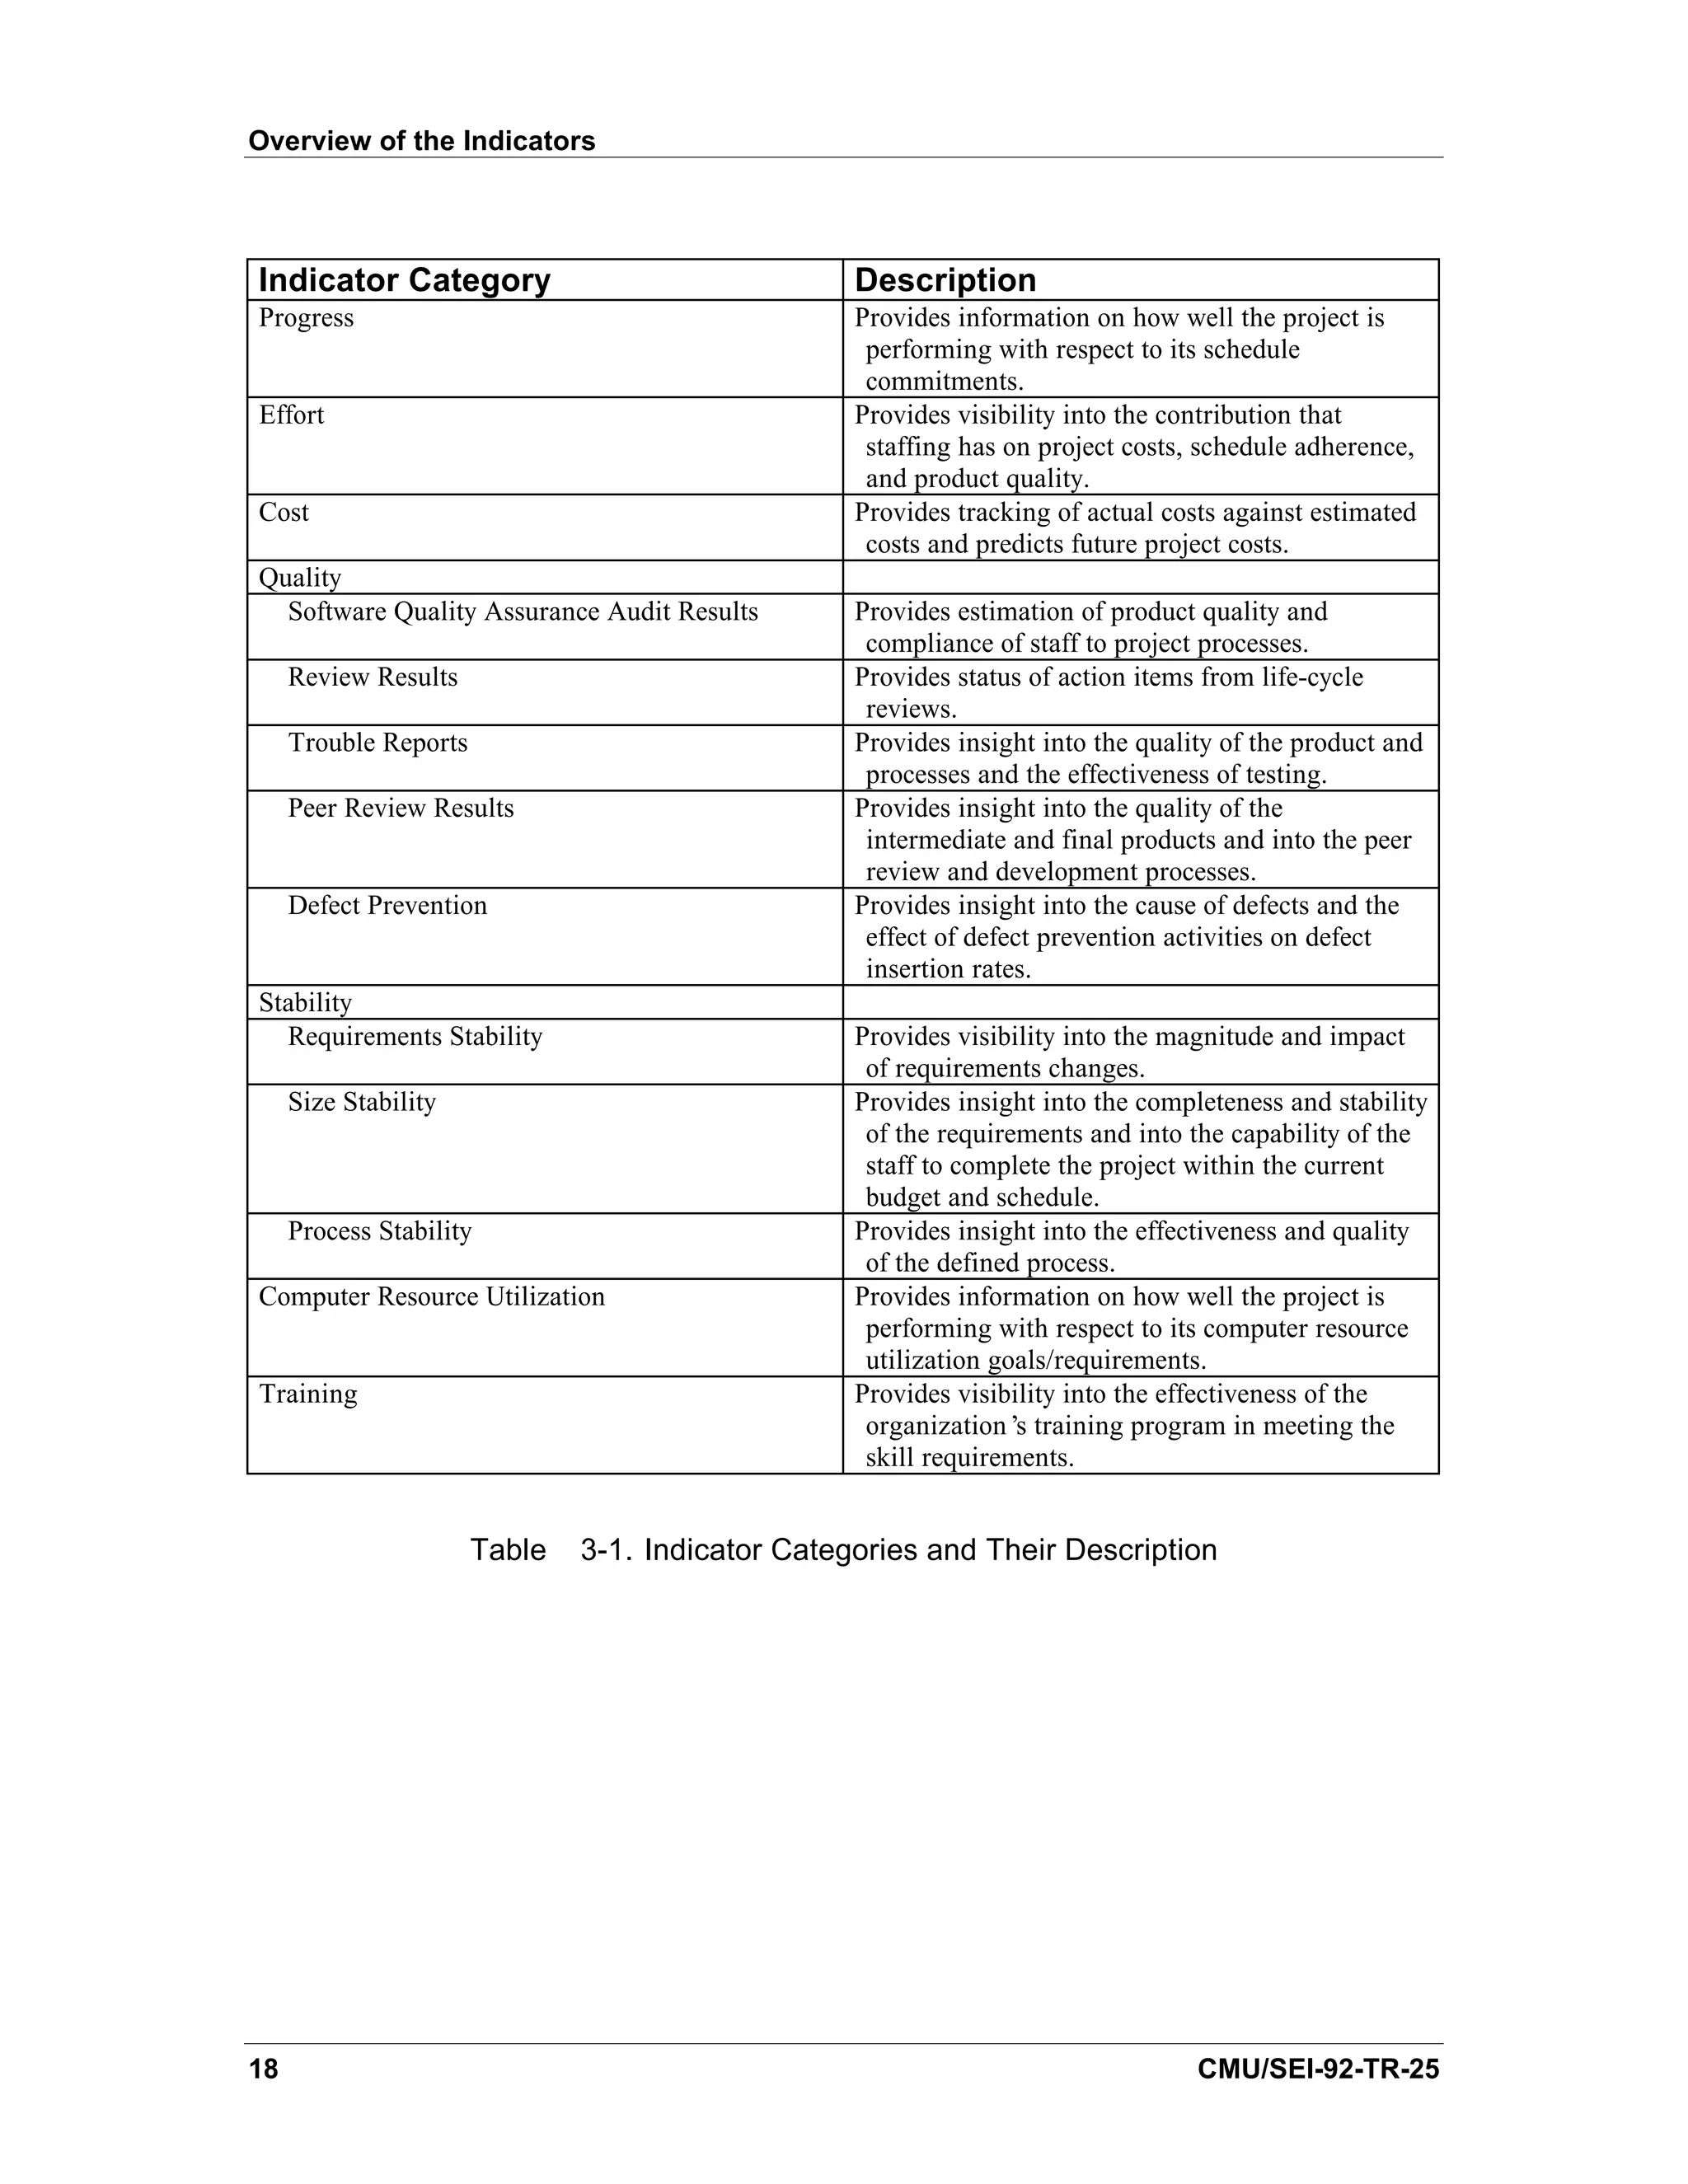
indicators, cover thirteen different categories that include progress, effort,
cost, and quality. Each indicator category contains example figures which
illustrate behavior that may occur on a project. The text provides users with
tips on how to use these figures or similar ones on their projects. Project
software managers and software engineering process groups can use these
indicators during the software development life cycle to gain insight into the
software development process and software process improvement activities.
The indicators chosen have been successfully used on projects in the
software industry.
1. Introduction
The Software Process Measurement Project at the Software Engineering Institute (SEI)
promotes the use of measurement in improving the management of software
development and the acquisition of software. The project has worked and continues to
work with representatives from industry, government, and academia to develop basic
definitions of software measures and a measurement process that can be used to
systematically and repeatedly measure software development progress, products, and
processes. Four documents that describe these measures have been released [Florac
92], [Goethert 92], [Park 92], and [Rozum 92]. This document complements these
documents by providing a set of software measures in the form of indicators that are
compatible with the measurement practices of the Capability Maturity Model for
Software (CMM) [Paulk 91], [Weber 91]. In this document, indicator is used to mean a
representation of measurement data that provides insight into software development
processes and/or software process improvement activities. A measure quantifies a
characteristic of an item; an indicator may use one or more measures. For example, an
indicator may be the behavior of a measure over time or the ratio of two measures.
1.1. Objectives
The goal of this document is to provide a comprehensive and cohesive set of indicators
that is consistent with the key practices in the CMM. This document describes and
serves as a reference manual for that set of software indicators.
CMU/SEI-92-TR-25 1](https://image.slidesharecdn.com/softwaremeasuresandthecapabilitymaturitymodel-1992johnh-baumertsei-110103031855-phpapp02/75/Software-measures-and-the-capability-maturity-model-1992-john-h-baumert-sei-19-2048.jpg)
![Introduction
The implementation of a broad-scale measurement program is also not discussed.
Such suggestions can be found in a number of sources [DeMarco 82], [Grady 87],
[Jones 91], [Pfleeger 89], [Kuntzmann 92]. The number of indicators and sample
graphs in this document is relatively large and can discourage an organization from
establishing a measurement program. An organization needs to weigh its
measurement goals against its resources to determine the structure and content of its
measurement program. Then it can select indicators from this document or develop its
own that satisfy those goals.
1.3. Audience
This document is written for the project software manager and the software engineering
process group (SEPG). The example graphs and interpretations discussed in this
document provide information that is useful to a project software manager or an SEPG.
Others may use the same or similar graphs but with a different focus and interpretation.
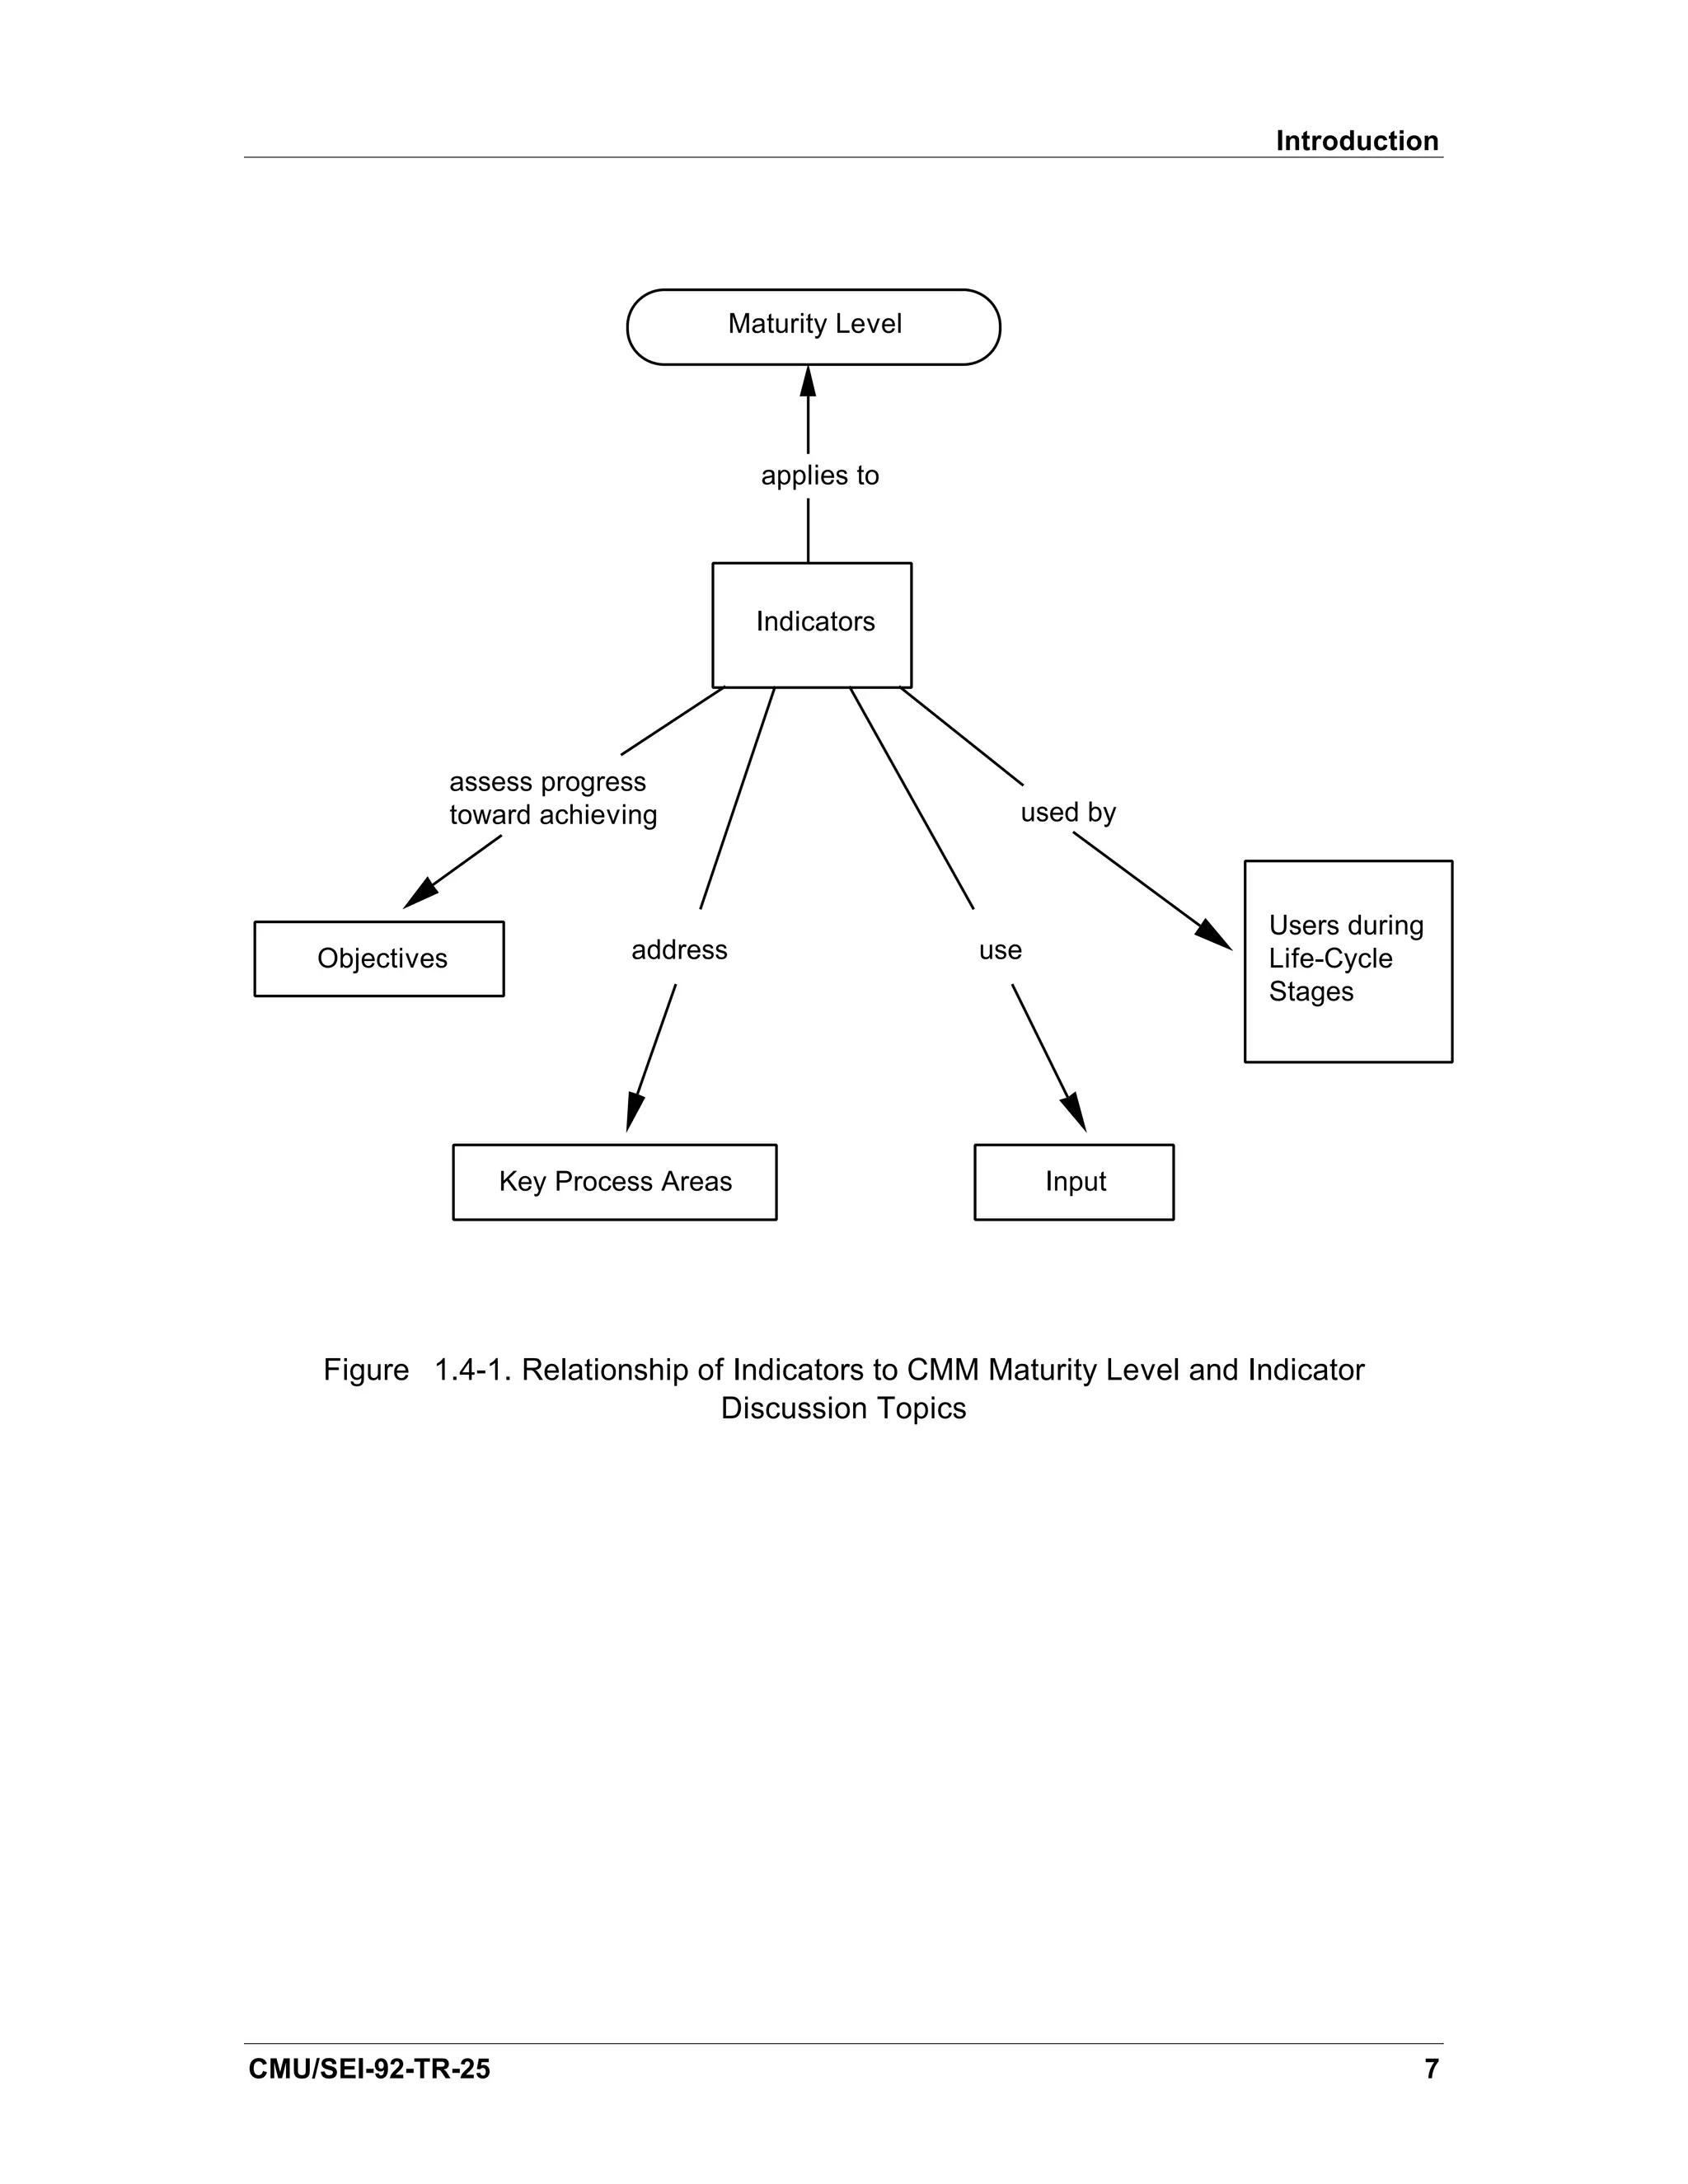
Figure 1.3-1 shows potential users of these software indicators.
Senior
SW Project
Management
Management
Visibility
Planning & Control
Customer
SEPG Software
Tracking
Indicators
Improvement
Research
Community
Research
Internal Line of External
Communication
to Information Flow
to
Project Project
Figure 1.3-1. Software Measurement Users
CMU/SEI-92-TR-25 3](https://image.slidesharecdn.com/softwaremeasuresandthecapabilitymaturitymodel-1992johnh-baumertsei-110103031855-phpapp02/75/Software-measures-and-the-capability-maturity-model-1992-john-h-baumert-sei-21-2048.jpg)
![2. Background and Approach
This chapter provides background information that serves as a basis for the integration
of the software measures and the Capability Maturity Model for Software (CMM) and
describes the approach used in the integration of the two.
2.1. Software Measurement
Organizations with successful measurement programs report the following benefits:
• Insight into product development
• Capability to quantify tradeoff decisions
• Better planning, control, and monitoring of projects
• Better understanding of both the software development process and the
development environment
• Identification of areas of potential process improvement as well as an objective
measure of the improvement efforts
• Improved communication
However, many of the potential benefits that an organization can derive from a sound
measurement program is often not achieved due to a half-hearted commitment by
managers to a measurement program. The commitment cannot be just a policy
statement; it must be total commitment. The policy must be followed with the allocation
of resources to the measurement program. This includes allocating staff as well as
tools.
It is important that an individual or group be assigned responsibility for the
measurement program. This group identifies the measures to be collected, establishes
training in measurement, monitors the consistency of the measures across the projects
and throughout the organization, and can help projects initiate measures. This group
can also provide composites of historical data that managers can use in planning and
monitoring of projects.
The human element in a measurement program should not be taken lightly. Success
and failure are tied to people. All staff members need to see the benefits of the
measurement program and understand that the results will not be used against them.
The focus of any measurement program is on the process and the product, not people.
Jones has a section, entitled “The Sociology of Software Measurement,” in the book in
which he discusses data confidentiality, the use of data for staff performance targets,
measuring one-person projects, management information systems vs. systems
software, and measurement expertise [Jones 91].
Grady and Caswell discuss their experiences in establishing a measurement program
at Hewlett-Packard [Grady 87]. All aspects of measurement are discussed: what to
CMU/SEI-92-TR-25 9](https://image.slidesharecdn.com/softwaremeasuresandthecapabilitymaturitymodel-1992johnh-baumertsei-110103031855-phpapp02/75/Software-measures-and-the-capability-maturity-model-1992-john-h-baumert-sei-27-2048.jpg)
![Background and Approach
measure, how to convince management and staff of the benefits, validity of data, the
need for a database, training and tools, and so forth. Their practical experience is
invaluable.
Rifkin and Cox summarize the current state of measurement practice in eleven
divisions of eight organizations that have the reputation of having excellent
measurement practices [Rifkin 91]. They describe the patterns that emerged at a
consolidated lessons-learned level but also provide informative material in the individual
case studies.
2.2. The Capability Maturity Model
The CMM is designed to provide organizations with guidance on how to gain control of
their process for developing and maintaining software and how to evolve toward a
culture of software excellence. It does this by serving as a model against which an
organization can determine its current process maturity and by identifying the few
issues most critical to software quality and process improvement.
This section provides a high-level overview of the CMM and its structure. Details are
provided by Paulk and Weber [Paulk 91], [Weber 91]. Additional information on
maturity levels and software process is given by Humphrey [Humphrey 89].
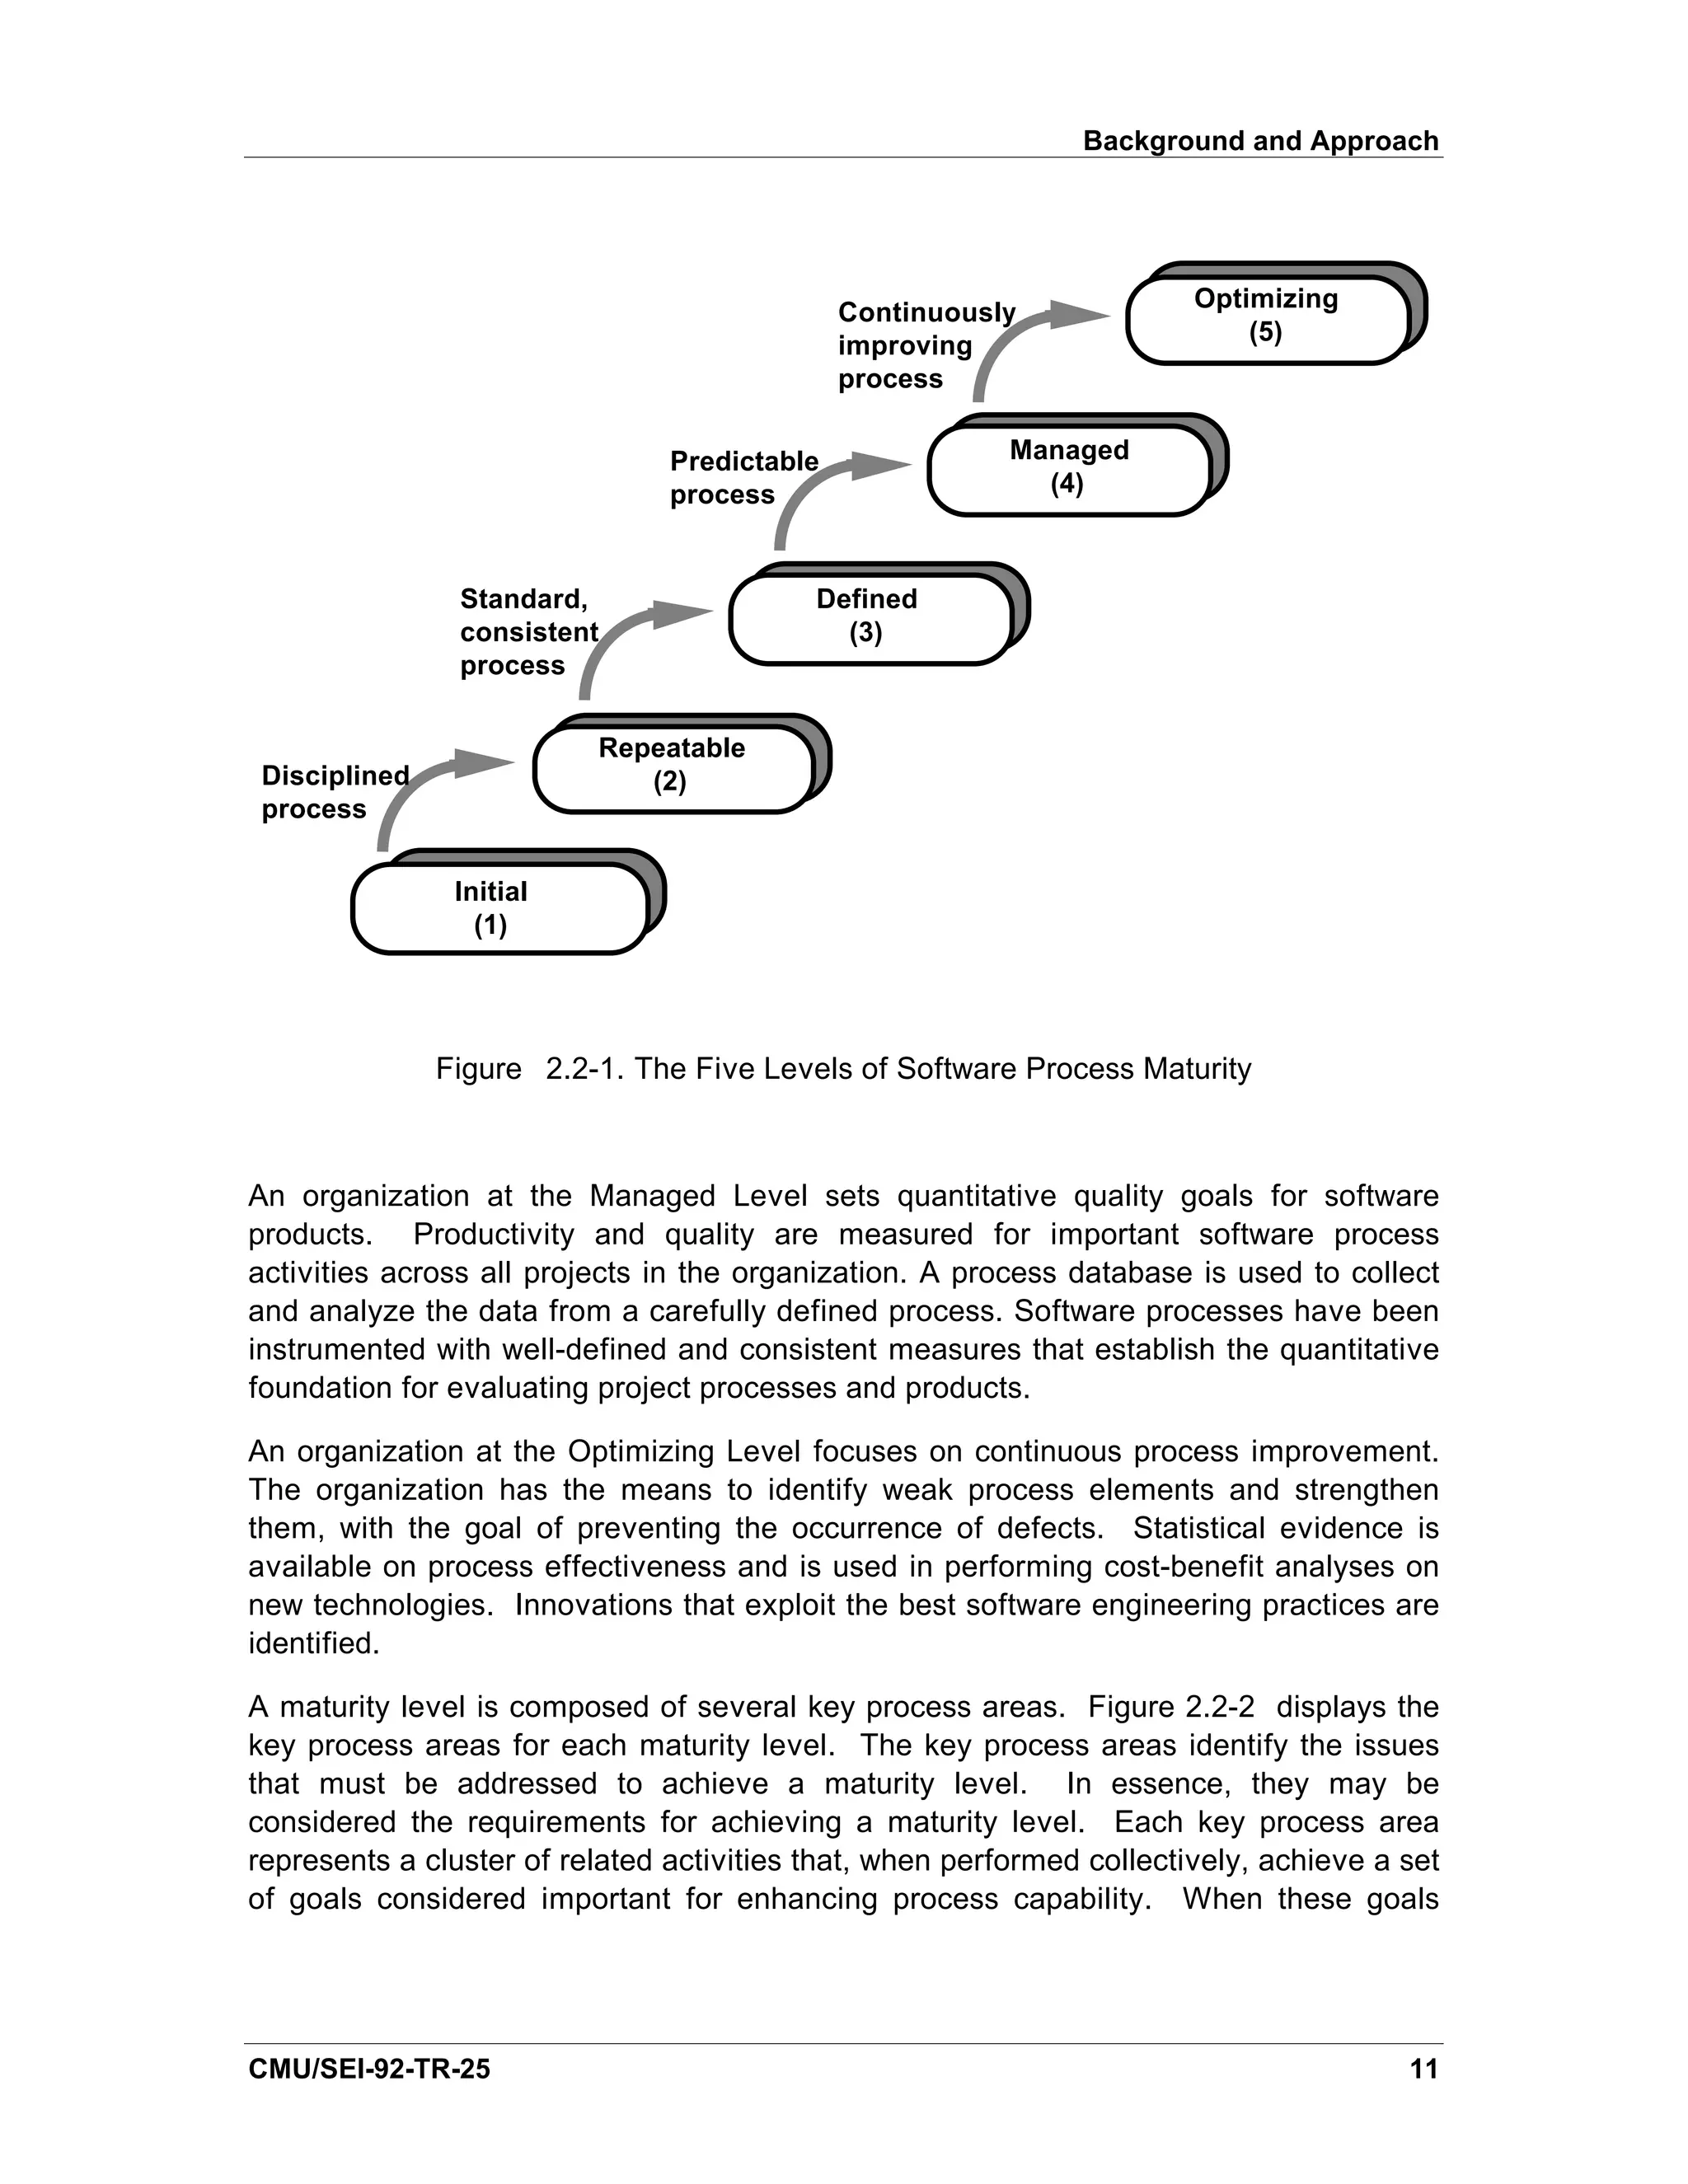
The CMM contains five levels of software process maturity: Initial, Repeatable,
Defined, Managed, and Optimizing (see Figure 2.2-1). An organization at the Initial
Level is characterized as one without a stable environment for developing and
maintaining software. Few stable software processes are in place, and performance
can only be predicted by individual, rather than organizational, capability.
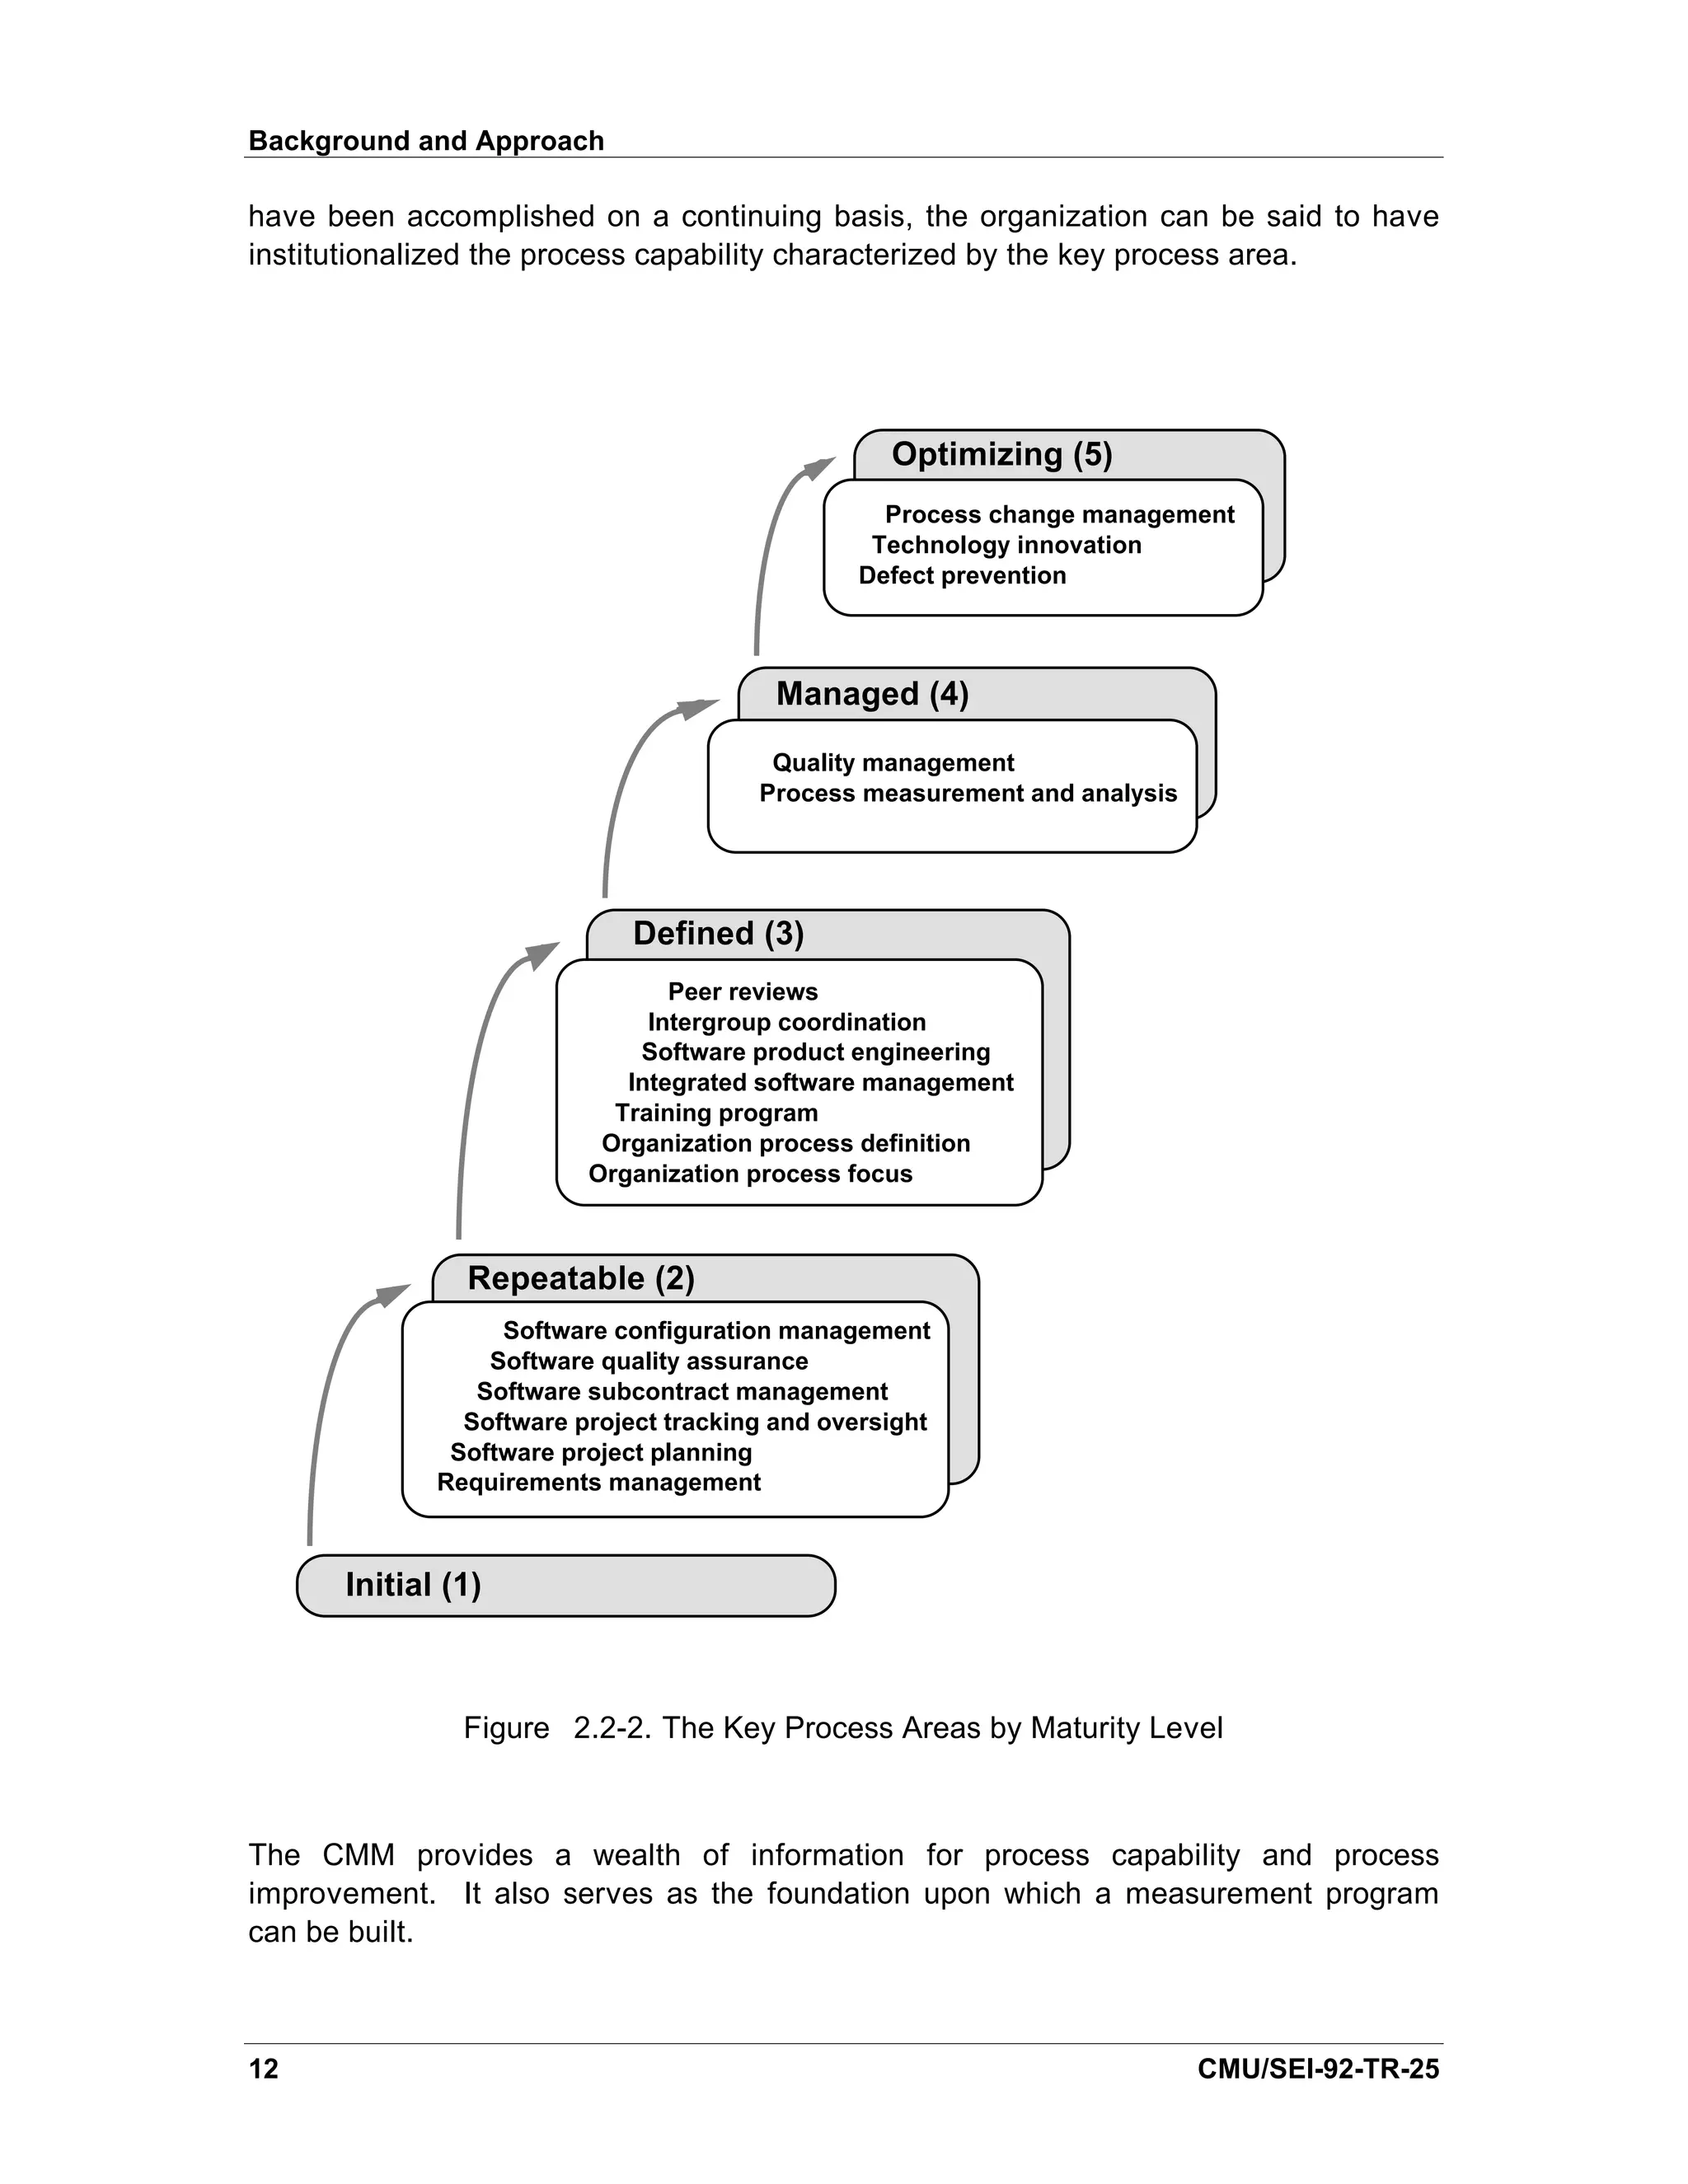
An organization at the Repeatable Level has installed basic software management
controls; that is, stable processes are in place for planning and tracking the software
project. Project software managers track software costs, schedules, and functionality;
problems in meeting commitments are identified when they arise. Software
configuration management procedures are used to baseline and control software
requirements. Project standards exist, and the software quality assurance group
ensures that they are followed. In essence, there is a stable, managed, working
environment.
An organization at the Defined Level has a standard process for developing and
maintaining software across the organization. The software engineering and software
management processes are integrated into a coherent whole. A software engineering
process group (SEPG) facilitates software process definition and improvement efforts.
An organization-wide training program is implemented to ensure that the staff and
managers have the knowledge and skills required to carry out their tasks. Projects use
the organization-wide standard software process to create their own defined software
process that encompasses the unique characteristics of the project. Each project uses
a peer review process to enhance product quality.
10 CMU/SEI-92-TR-25](https://image.slidesharecdn.com/softwaremeasuresandthecapabilitymaturitymodel-1992johnh-baumertsei-110103031855-phpapp02/75/Software-measures-and-the-capability-maturity-model-1992-john-h-baumert-sei-28-2048.jpg)
![Background and Approach
2.3. Goal-Question-Measure Paradigm
Basili and Weiss proposed a methodology for collecting valid software engineering data
that has come to be known as the goal-question-measure paradigm [Basili 84]. The
paradigm states that an organization should have specific goals in mind before data are
collected. This ensures that only appropriate data are collected.
The first step for an organization is to establish the goals of its measurement program.
The organization determines what it is that it is attempting to do with these data. Once
the goals have been established, the organization in the second step develops a list of
questions that are to be answered by the measurement program. Questions force the
organization to define more sharply the goals of the measurement program. The
questions ensure that only data appropriate to achieving those goals are collected. If a
data item is not needed in analysis, it is discarded. Also if there is a goal for which
questions cannot be formulated or for which data cannot be collected, then it is not a
viable measurement goal and is discarded.
The final step is to collect the data. However, when these measures are now made,
they are made for a well-defined purpose.
This paradigm was used in this task to maintain a focus on the measures appropriate to
achieve the goals of the key process areas. There are many measures available for
use in the software industry. Only those indicators that would help an organization in
assessing and improving itself as well as providing useful information to the software
project manager during software development were selected.
2.4. Selection Criteria for Indicators
The following criteria were used in selecting indicators:
• The indicator had to apply to a goal of a key process area within the CMM.
• The indicator could be used both as a status indicator and as a predictor of
future status.
• The indicator is used in measuring software process improvement efforts.
• The indicator is an existing measure; that is, there is a reference to it in the
literature.
• The indicator is easy to derive; that is, it does not require complicated arithmetic
procedures.
• The input items to an indicator require straightforward data collection efforts;
that is, the data collection lends itself to automation.
• The graphing of the trend charts is simple enough to be done by hand or lends
itself to automation.
An indicator had to satisfy a majority of the criteria. Not every criterion had to be
satisfied. Each candidate indicator was evaluated against these criteria and was
CMU/SEI-92-TR-25 13](https://image.slidesharecdn.com/softwaremeasuresandthecapabilitymaturitymodel-1992johnh-baumertsei-110103031855-phpapp02/75/Software-measures-and-the-capability-maturity-model-1992-john-h-baumert-sei-31-2048.jpg)

![Progress Repeatable Level
Sources
[AFSC 86] discusses planned and actual completions graphs at the computer software
configuration item (CSCI) level.
[Decker 91] lists requirements diagrams; function specifications; design diagrams; test
cases; units designed, coded, and tested; modules tested; and computer software
components tested as items tracked on planned and actual completions graphs.
[Grady 87] states that calendar measures are part of the Hewlett-Packard metrics
program.
[Landis 90] discusses planned and actual completions graphs for units coded, read,
and tested.
[Rozum 92] has a discussion on Gantt charts in their milestone performance metric and
a discussion of planned and actuals in their development progress metric.
[Schultz 88] discusses software requirements documented in his design progress
metric and the number of computer software units (CSU) designed, coded, tested, and
integrated in his CSU development progress metric. He also discusses the planned
and actual completions of CSCIs integrated in his test progress metric.
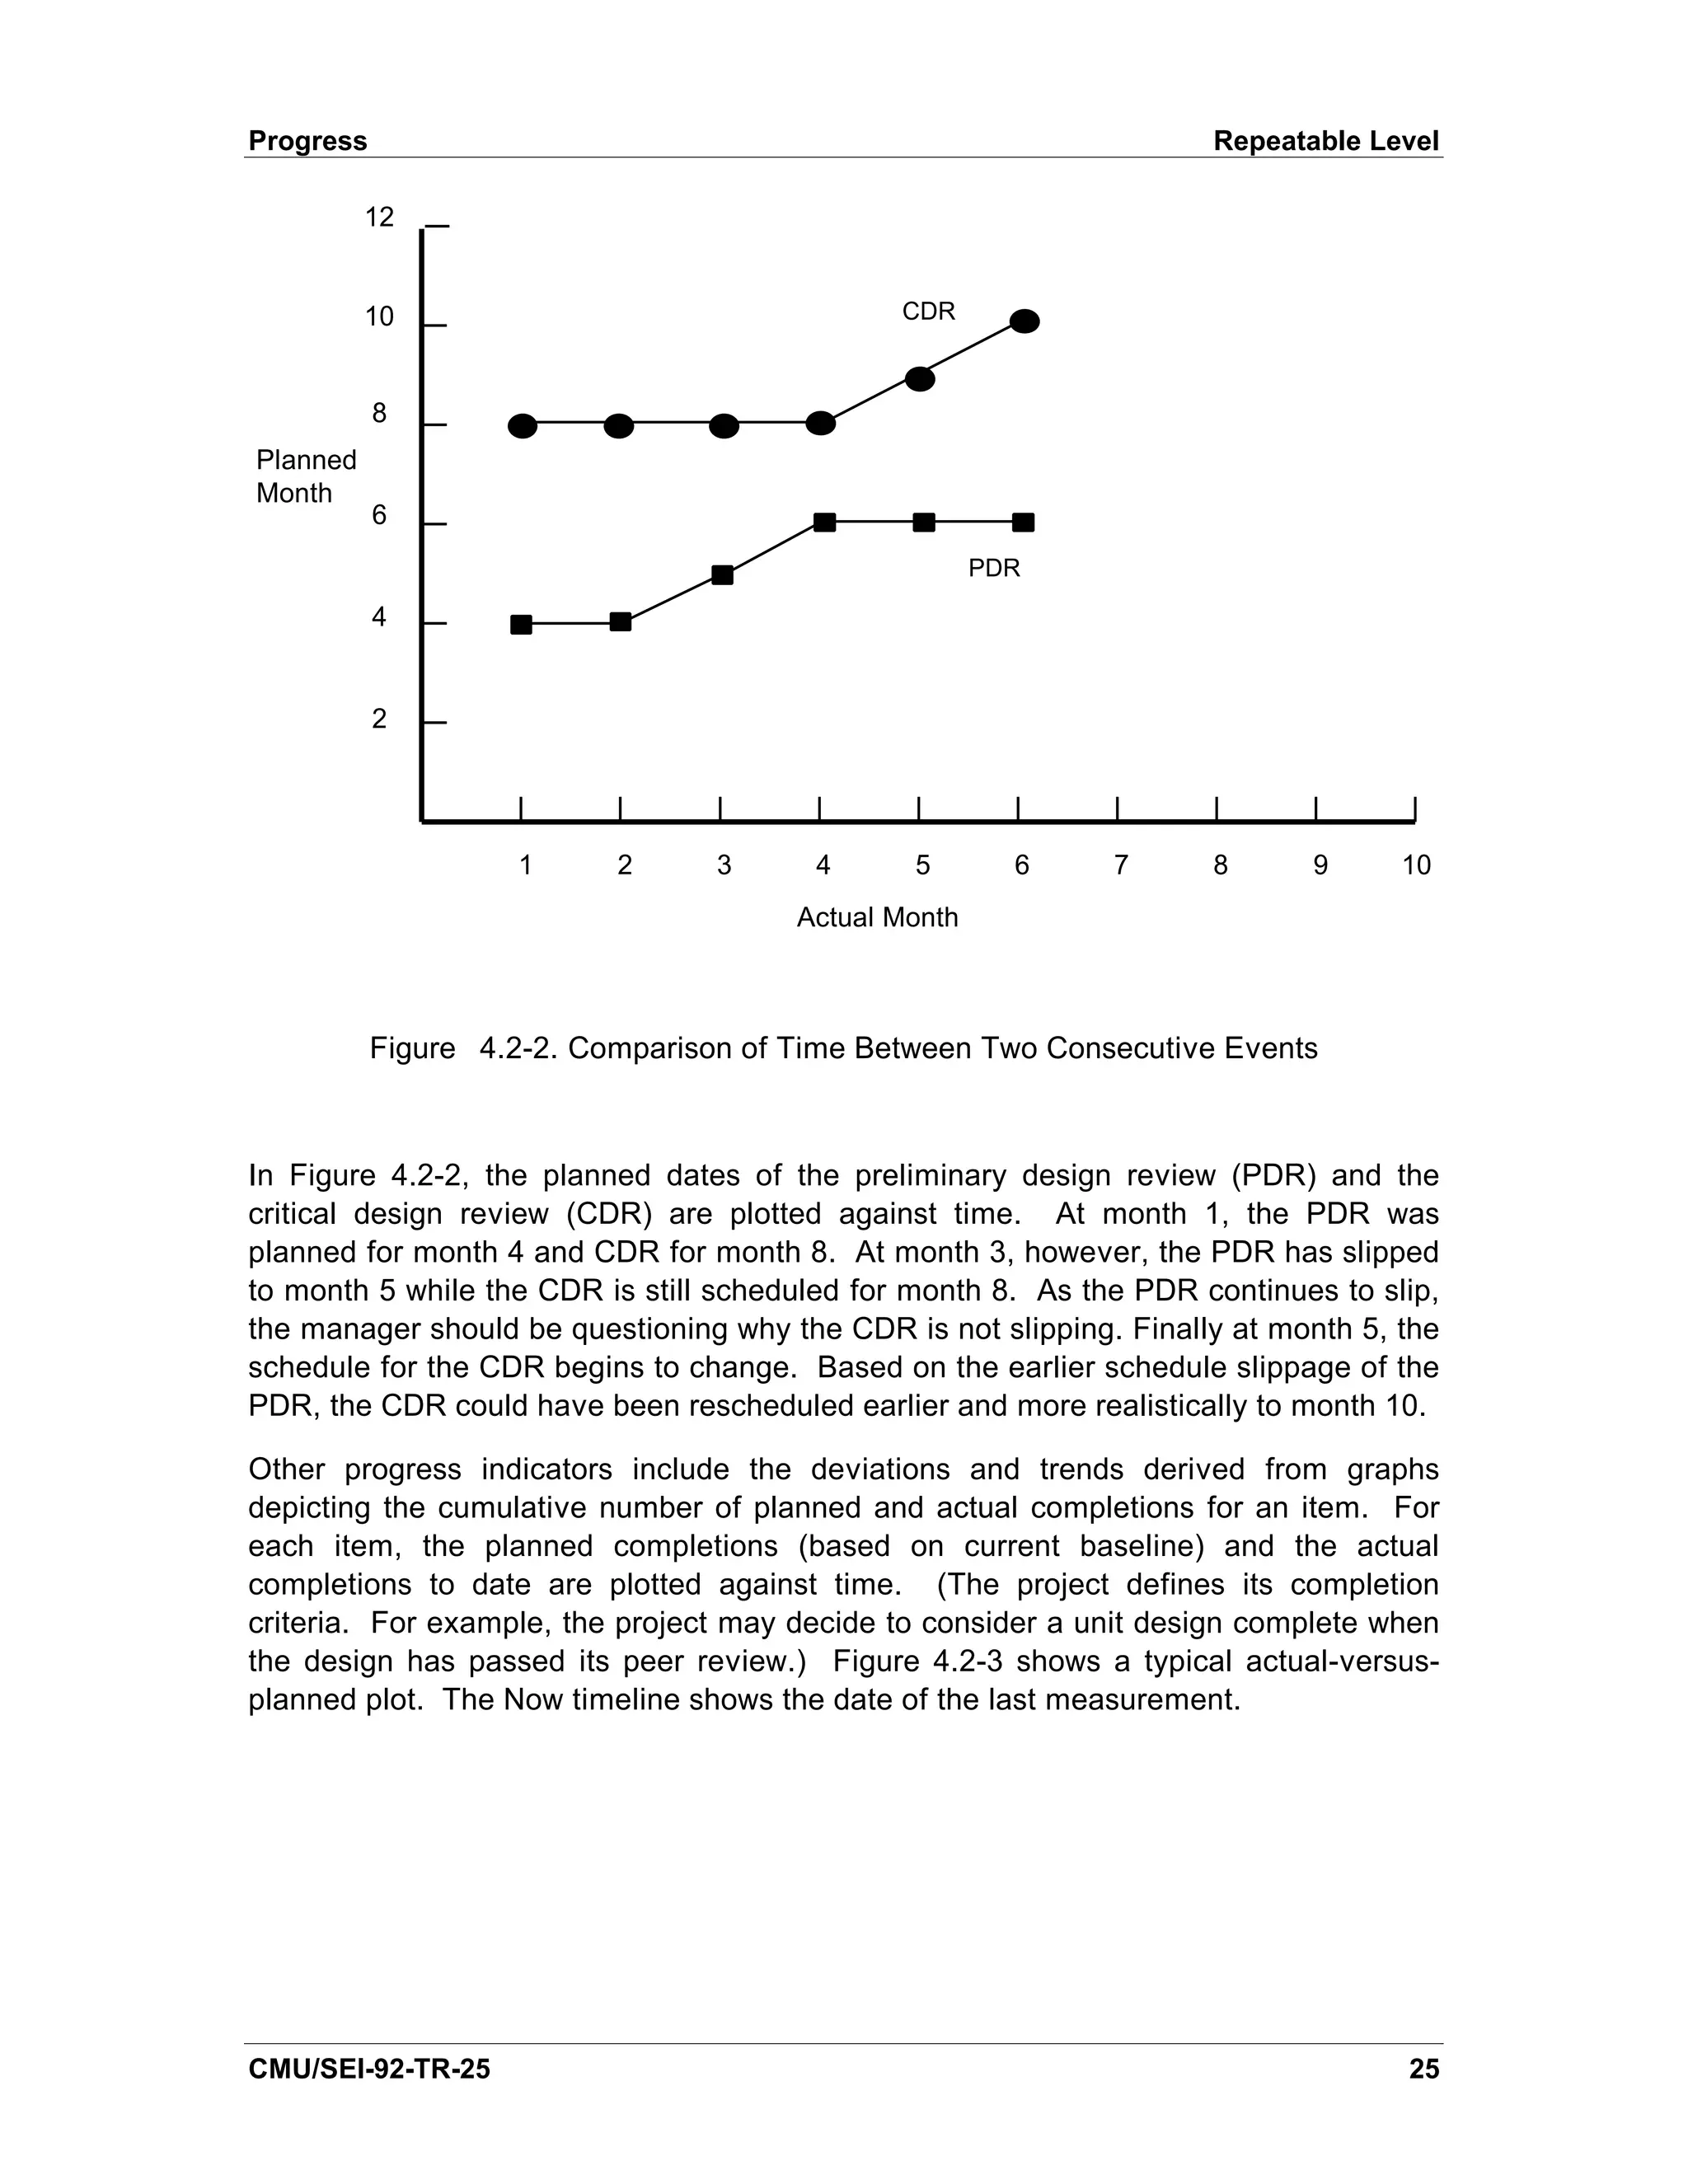
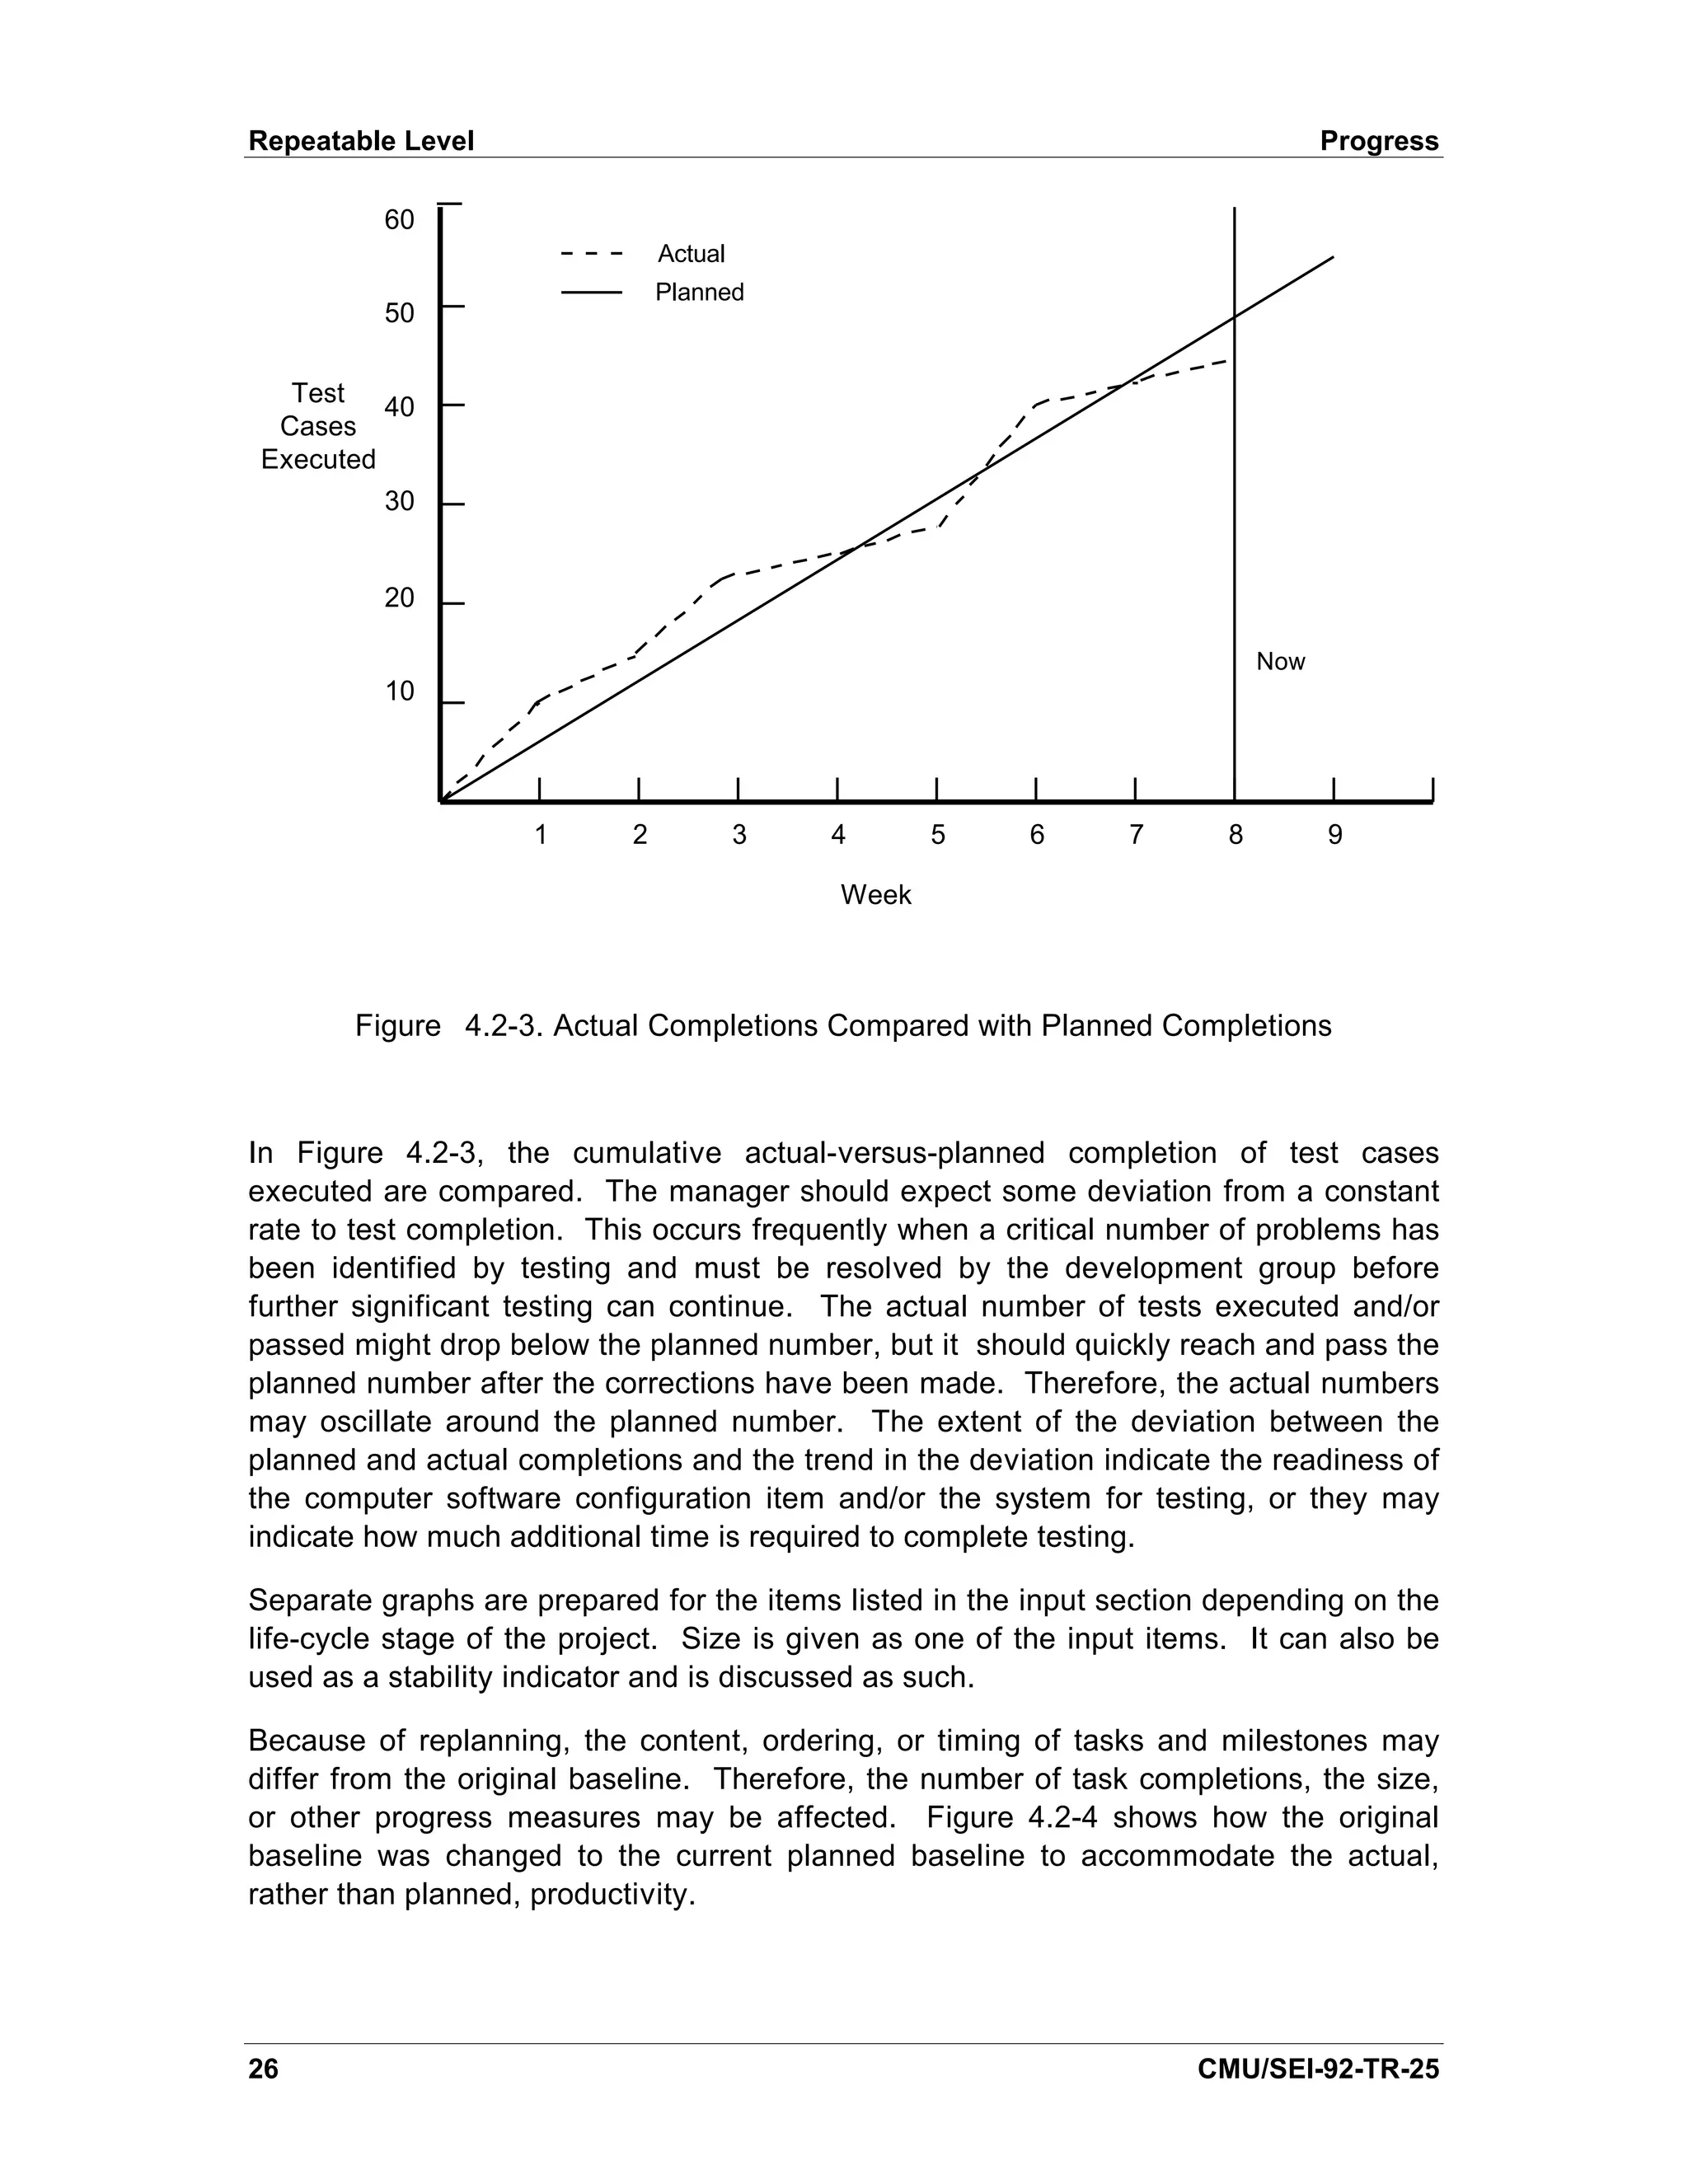
[STEP 91] discusses a schedule metric upon which Figure 4.2-2 is based and a
development progress metric.
CMU/SEI-92-TR-25 29](https://image.slidesharecdn.com/softwaremeasuresandthecapabilitymaturitymodel-1992johnh-baumertsei-110103031855-phpapp02/75/Software-measures-and-the-capability-maturity-model-1992-john-h-baumert-sei-47-2048.jpg)
![Repeatable Level Effort
• Staffing remains relatively stable during implementation.
• Staffing declines rapidly during testing since a full complement of implementors
is not required to correct problems detected during testing. When it is
necessary to retain a large number of implementors due to a large number of
trouble reports written during testing, the manager should question the quality of
the product.
In general, if the staffing profile is too pointed, communication/coordination problems
may occur [Brooks 82]; if the profile is too flat, the schedule could be shortened.
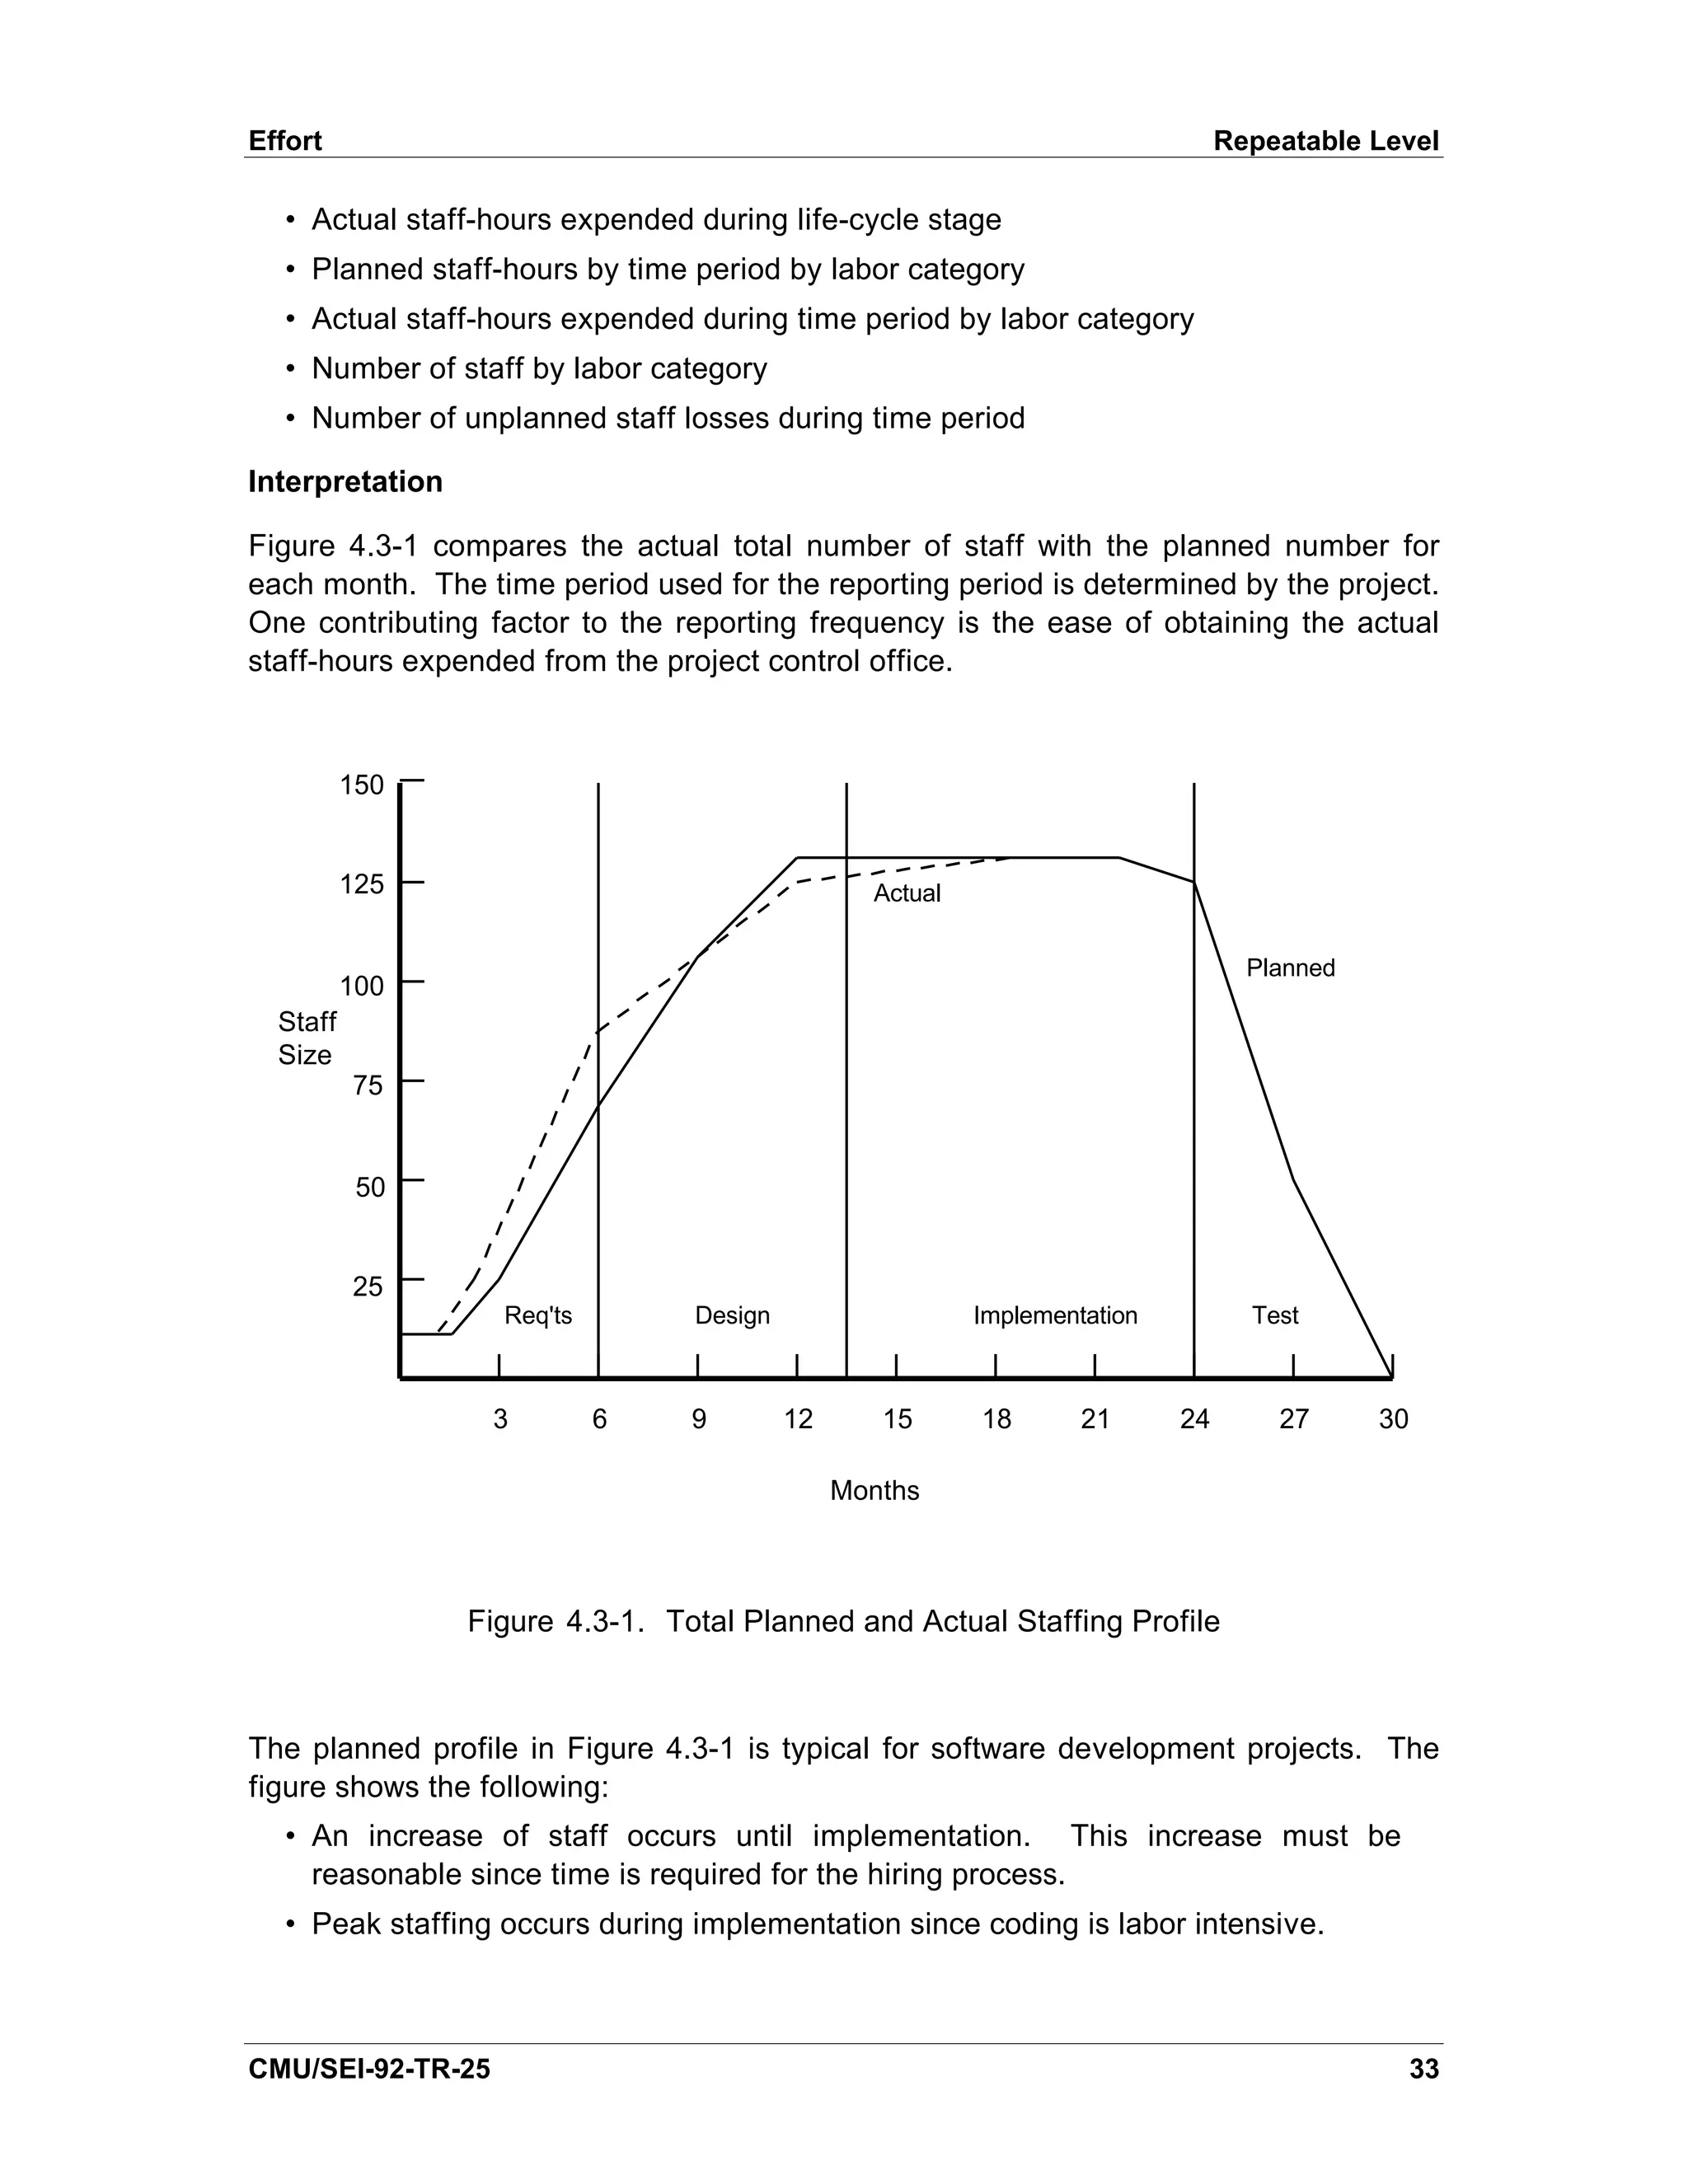
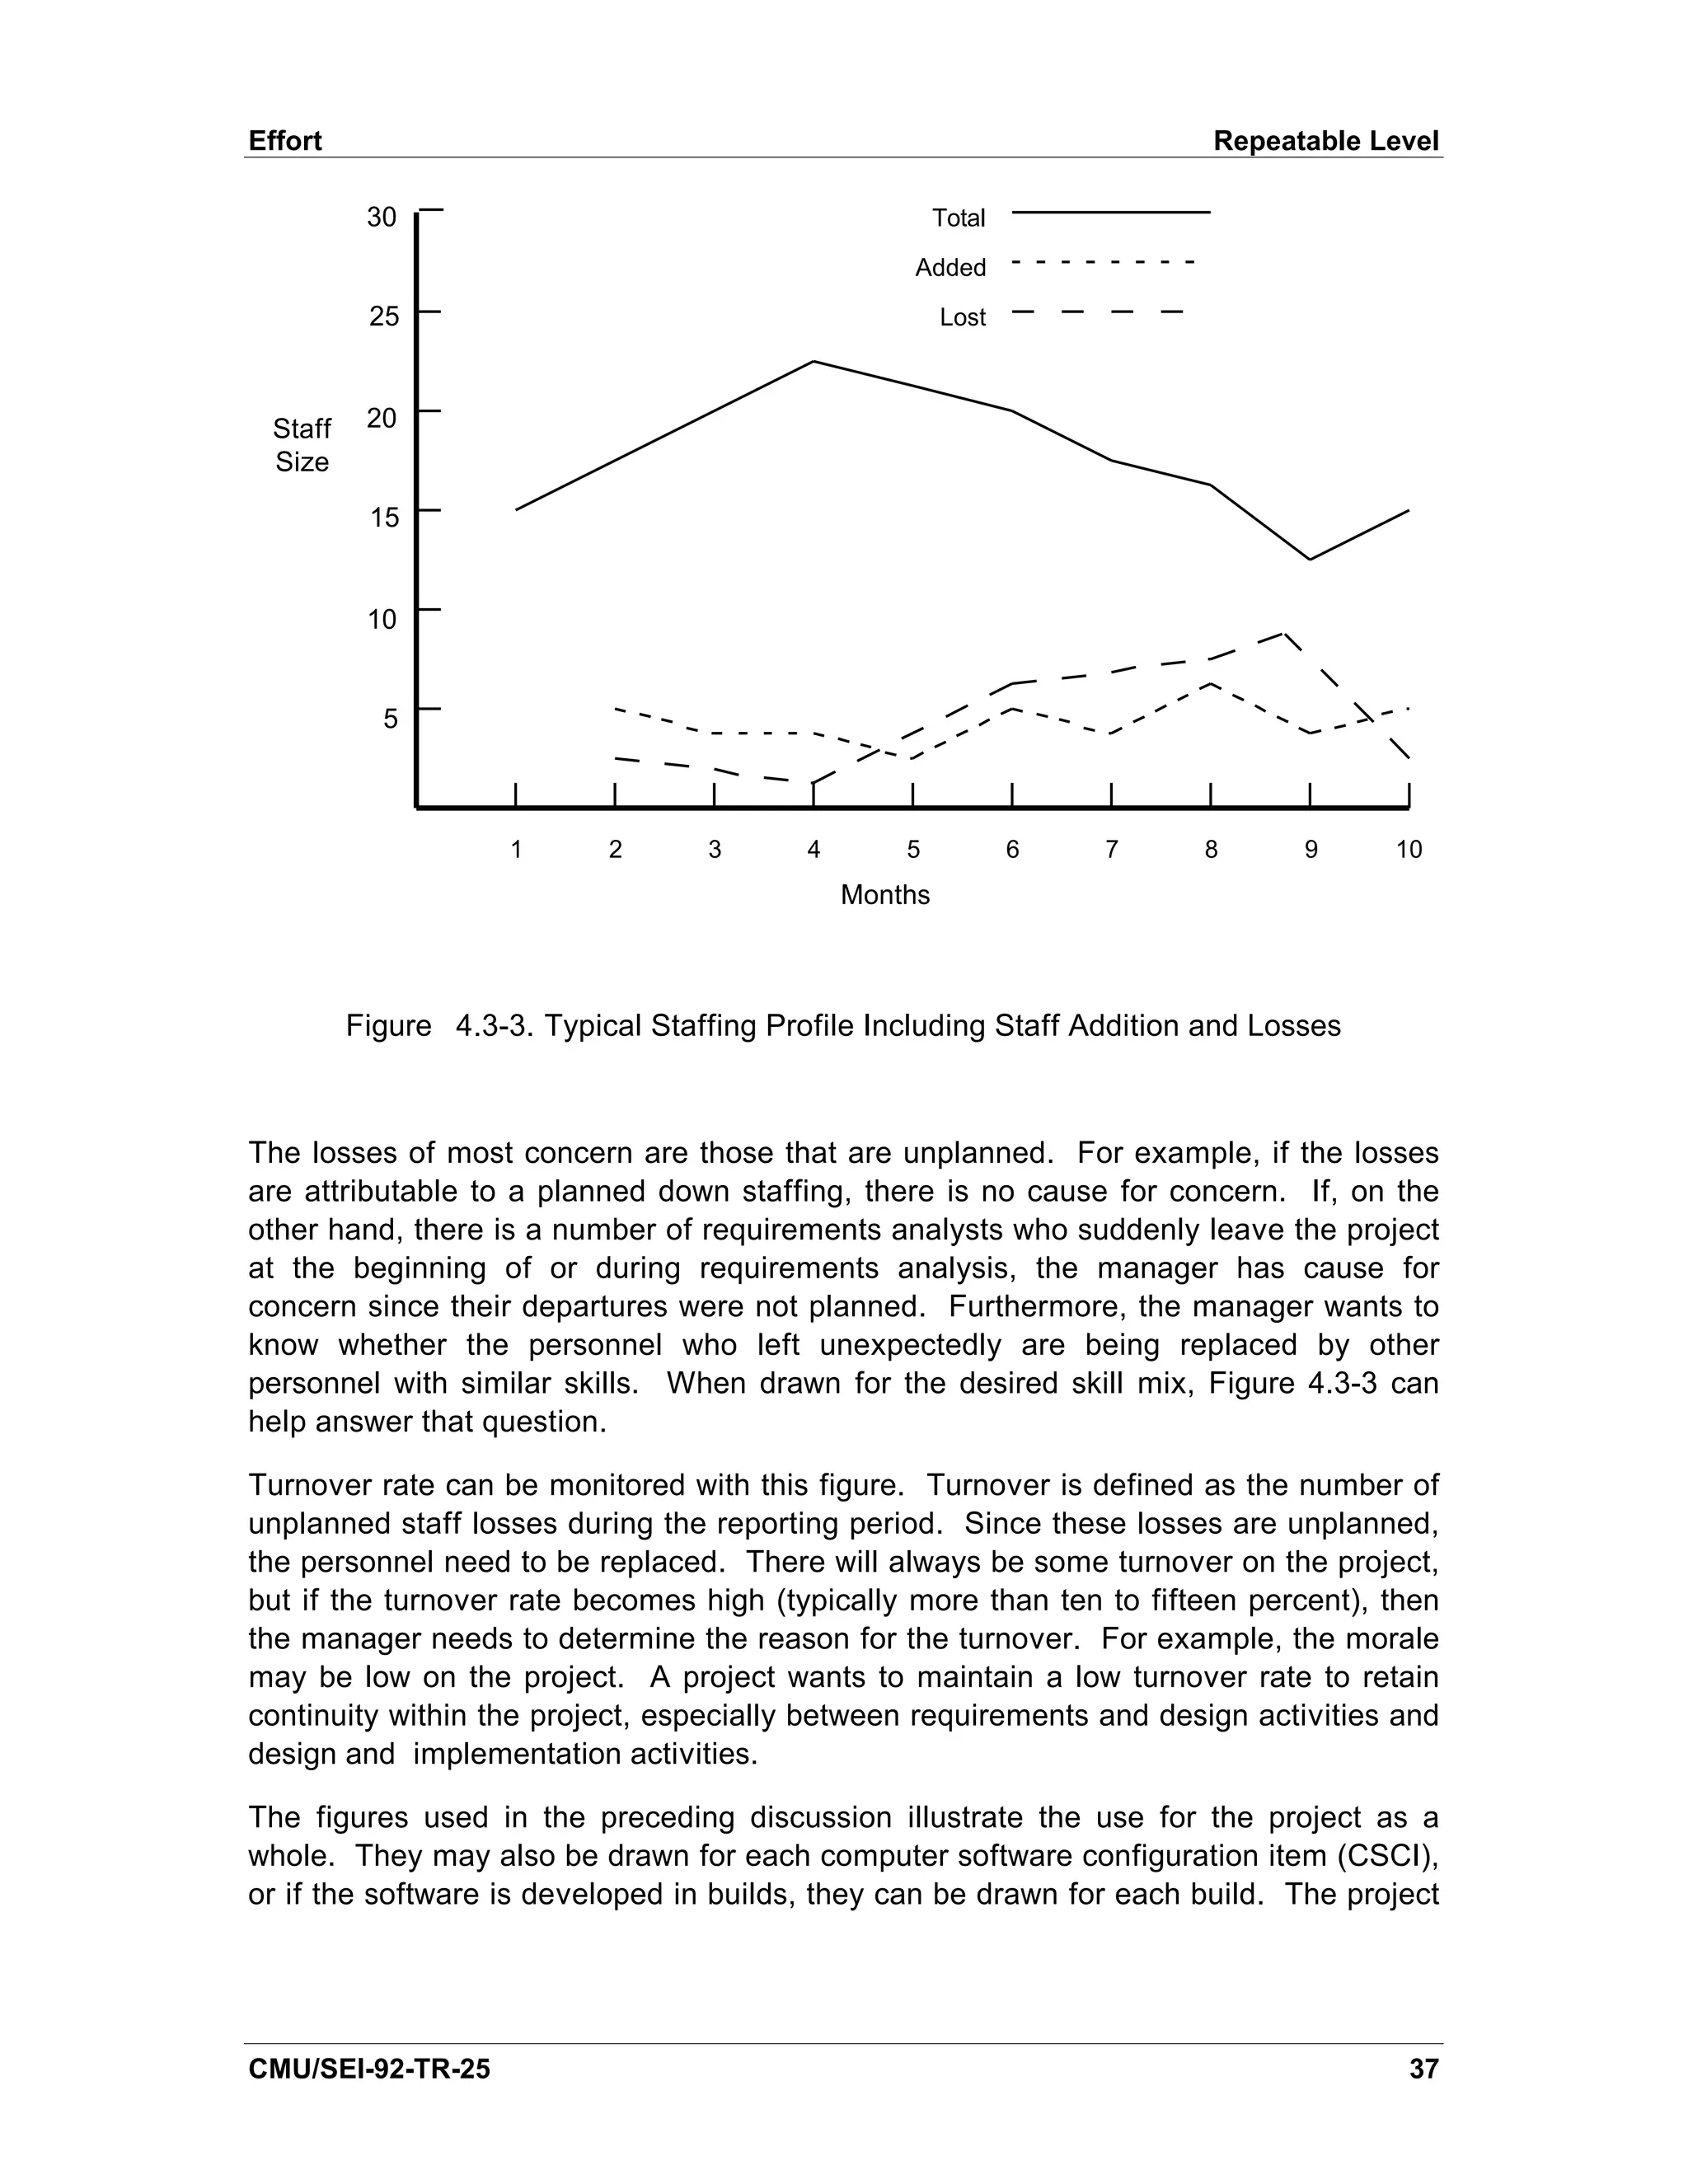
Figure 4.3-1 shows the number of staff for the entire project. Each lower-level manager
prepares similar graphs for the cost accounts under their control. The numbers are
consolidated for each level of management until the final graph shows the staffing
profile for the entire project. As part of the planning process, the lower-level managers
and the project software manager check their staffing profiles with the progress and
cost indicators to ensure that the three indicators form a consistent plan before work
begins.
Managers should expect deviation of the actual number of staff from the planned
number during the reporting period. However, large deviations or an extended
overstaffing or understaffing period requires analysis. An understaffing situation,
extending over several contiguous reporting periods, may be the result of the following:
• An overestimate of the software size
• Insufficient progress
• An increasing number of open trouble reports
• Lack of understanding of requirements
• A very productive team
• A poor quality product
The manager uses other indicators, especially progress, cost, and quality, to determine
the correct explanation. If the true reason is that productivity is not being maintained,
then the understaffing is an early indication of schedule slippage. The manager still
has time to take corrective action before the schedule slippage becomes severe.
Brooks has pointed out that adding staff to a late project seldom improves the schedule
and often causes additional delay [Brooks 82].
An overstaffing situation, extending over several contiguous reporting periods, may be
the result of the following:
• A more complex problem than expected
• Unstable requirements, which cause extensive rework
• Staff with the inappropriate skill for the work being performed
• Insufficient progress
• Increasing number of trouble reports
• An underestimate of the software size
34 CMU/SEI-92-TR-25](https://image.slidesharecdn.com/softwaremeasuresandthecapabilitymaturitymodel-1992johnh-baumertsei-110103031855-phpapp02/75/Software-measures-and-the-capability-maturity-model-1992-john-h-baumert-sei-52-2048.jpg)
![Effort Repeatable Level
As in the case of the understaffing situation, the manager can use other indicators to
determine the reason for the overstaffing.
Once the planned staffing profile has been developed, the project software manager
can determine from the organization’ historical data whether the allocation of staff over
s
the life-cycle stages is appropriate for that type of software project. Life-cycle stages
are shown in Figure 4.3-1. The manager can derive the percentage of staff-hours
planned for each life-cycle stage and compare them to historical data for similar
projects. If there are significant deviations, the manager needs to decide whether the
allocation is incorrect or whether the project has some unique characteristics that make
it different. One example of how the staffing profiles can be used is reported by Landis
et al [Landis 90]. For their type of projects at the Goddard Space Flight Center, they
find that the initial staffing level should be at least twenty-five percent of the average
staffing level.
Figure 4.3-1 may be used in conjunction with progress indicators to give the manager
an indication of the status of the project. For example, consider the four cases:
1. Actual staff-hours expended is greater than planned, and actual progress is
greater than planned. Even though more effort is being spent, if the trend
continues, the project will be completed ahead of schedule and within the
planned amount of effort.
2. Actual staff-hours expended is less than planned, but the actual progress is
greater than planned. Here less effort is required to complete the work. If the
trend continues, the project will be completed ahead of schedule and with less
effort than planned.
3. Actual staff-hours expended is greater than planned, and the actual progress is
less than planned. In this case, more effort is required to complete less work.
If the trend continues, the project will be completed later than planned and
exceed the planned amount of effort.
4. Actual staff-hours expended is less than planned, and the actual progress is
less than planned. This is a typical understaffing situation. If the trend
continues, the project will finish later than scheduled.
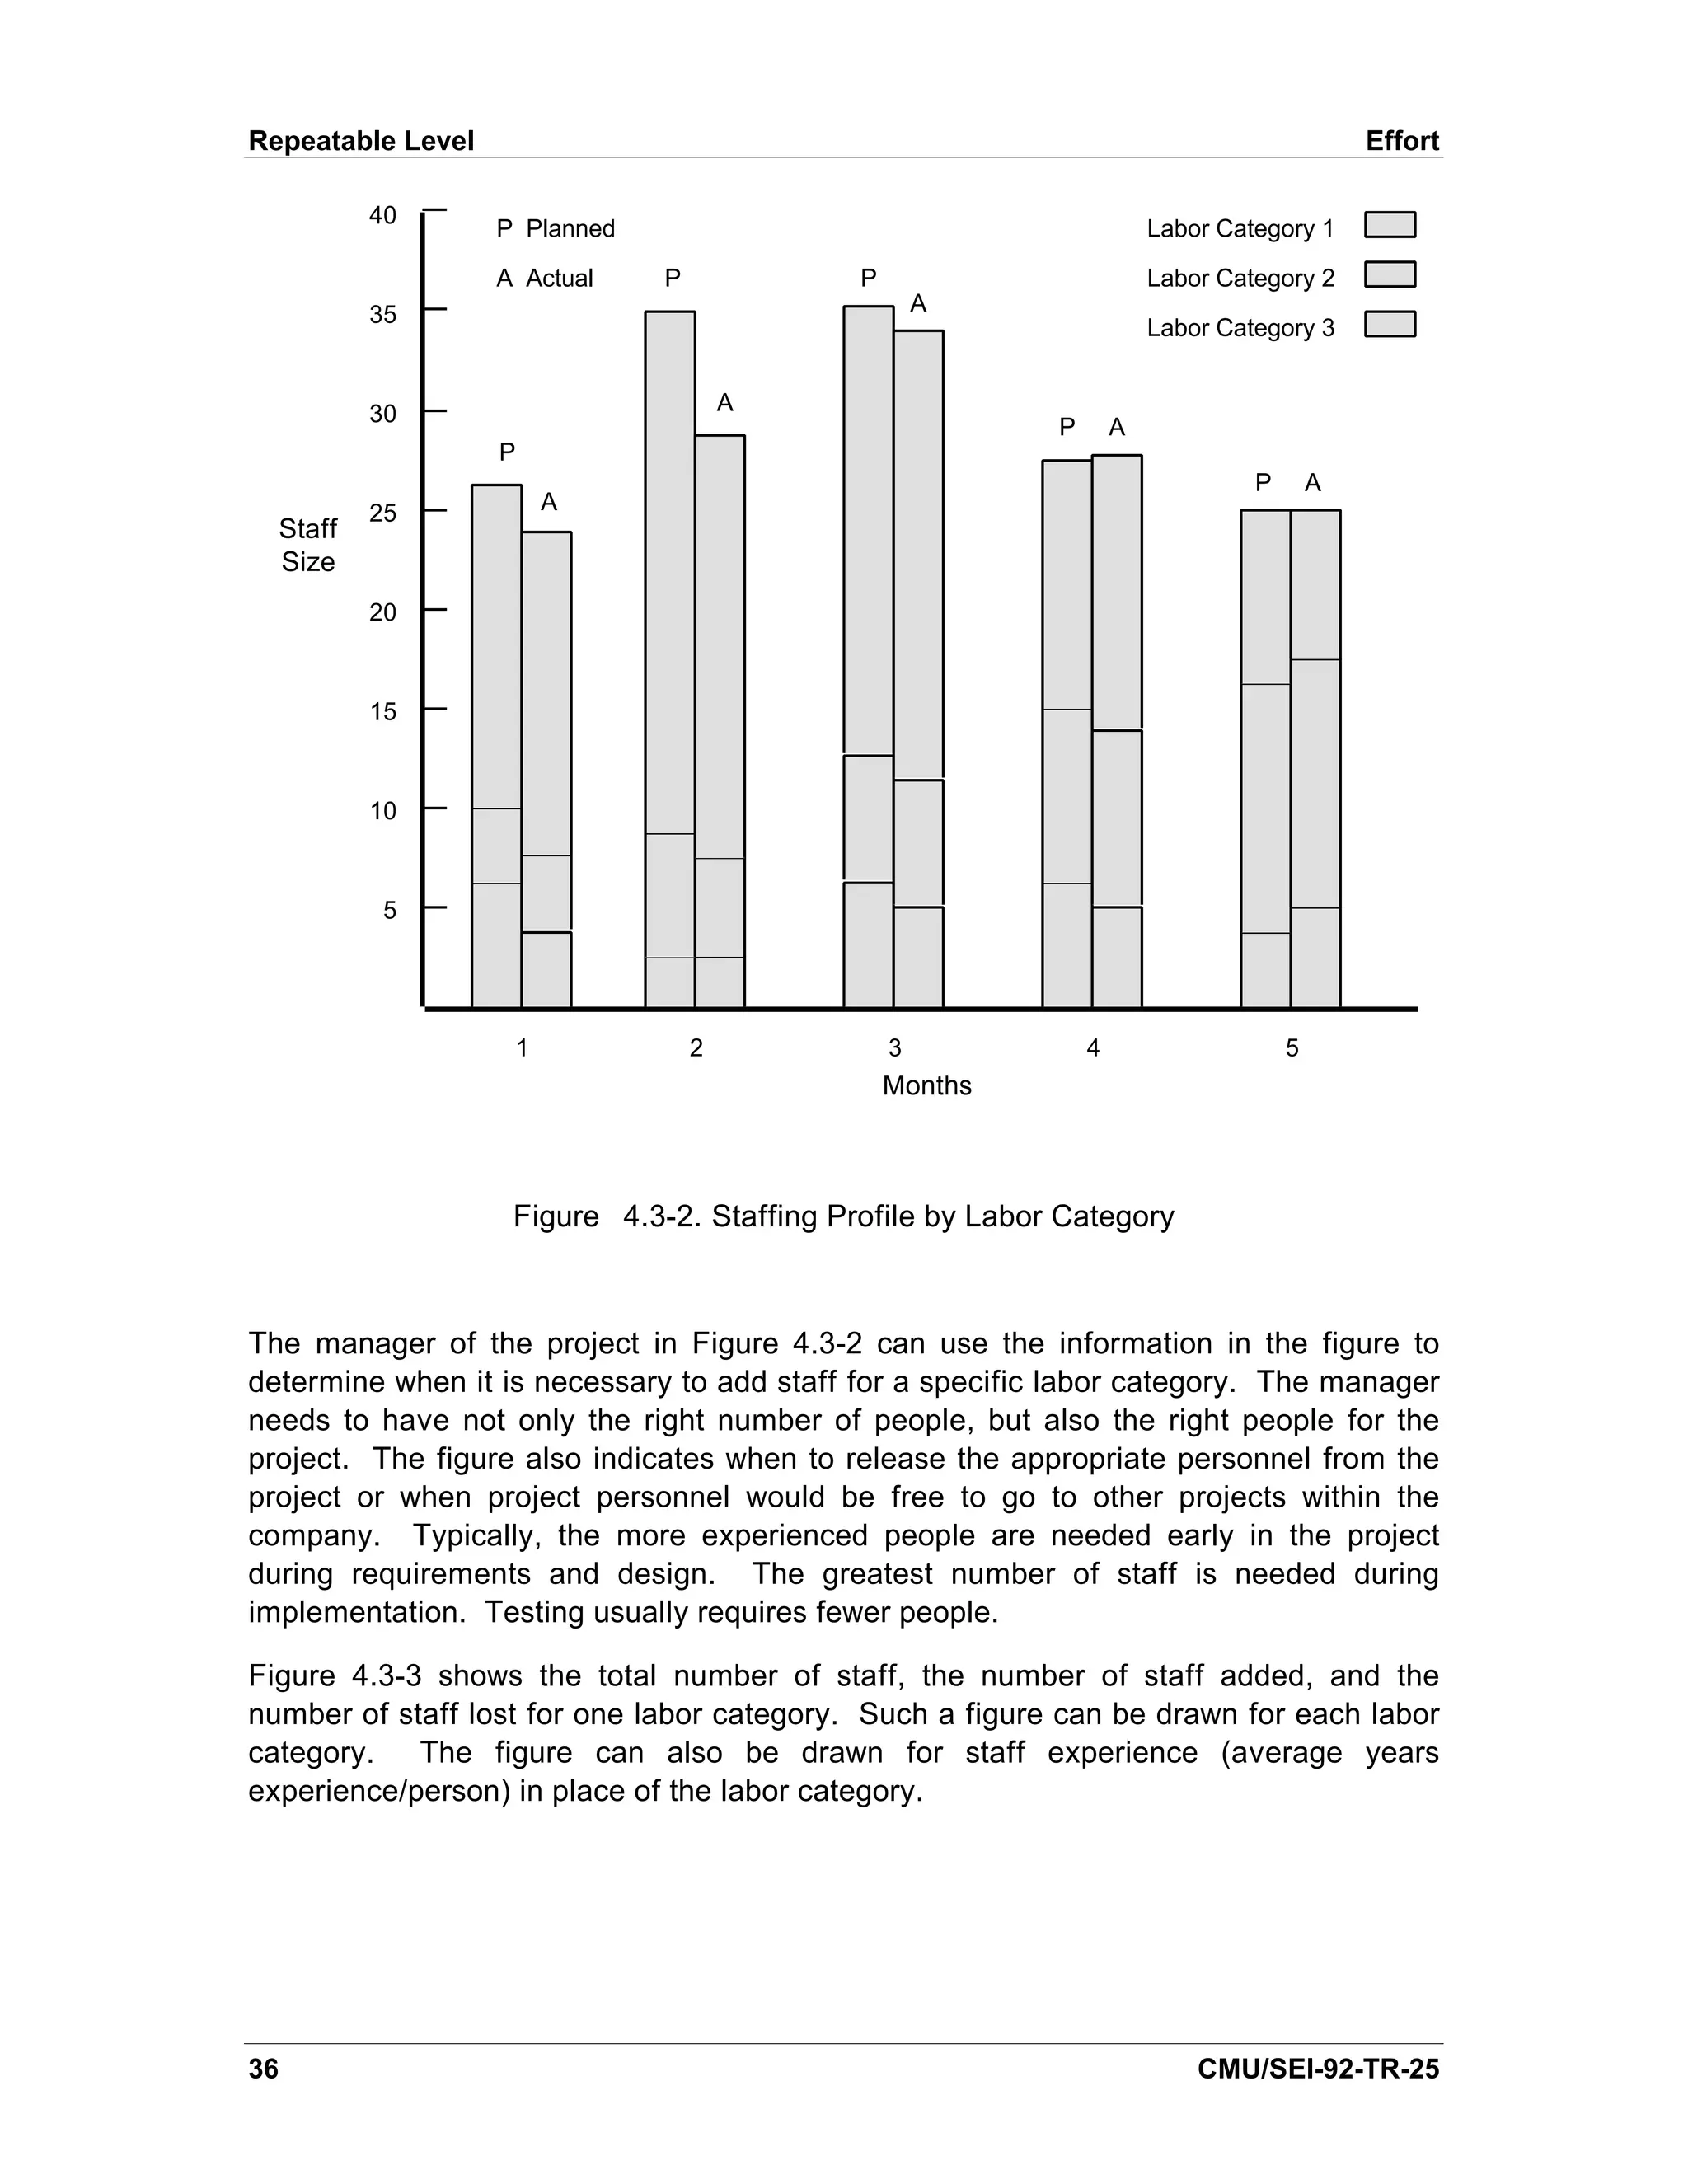
Figure 4.3-1 shows the staffing profile for the entire project. A plot of the staffing profile
by labor category or experience level, as in Figure 4.3-2, is also useful.
CMU/SEI-92-TR-25 35](https://image.slidesharecdn.com/softwaremeasuresandthecapabilitymaturitymodel-1992johnh-baumertsei-110103031855-phpapp02/75/Software-measures-and-the-capability-maturity-model-1992-john-h-baumert-sei-53-2048.jpg)
![Repeatable Level Effort
is responsible for deciding the granularity of the figures, both with respect to the
reporting period and the content.
Sources
[AFSC 86] discusses planned and actual staffing total profiles and staffing losses in its
software development personnel indicator.
[Decker 91], [Landis 90], and [Pfleeger 89] discuss the use of planned and actual
staffing profiles.
[Grady 87] reports that staff issues are part of the Hewlett-Packard software metrics
program.
[IEEE 1045] discusses the experience level, size, and turnover rates of the project staff.
[Rozum 92] discusses planned and actual staffing total profiles, experience profiles,
and also planned and actual staffing losses in their effort and staffing metrics.
[Schultz 88] discusses planned and actual staffing total profiles, experience profiles,
and also planned and actual staffing losses in his software personnel metric.
38 CMU/SEI-92-TR-25](https://image.slidesharecdn.com/softwaremeasuresandthecapabilitymaturitymodel-1992johnh-baumertsei-110103031855-phpapp02/75/Software-measures-and-the-capability-maturity-model-1992-john-h-baumert-sei-56-2048.jpg)
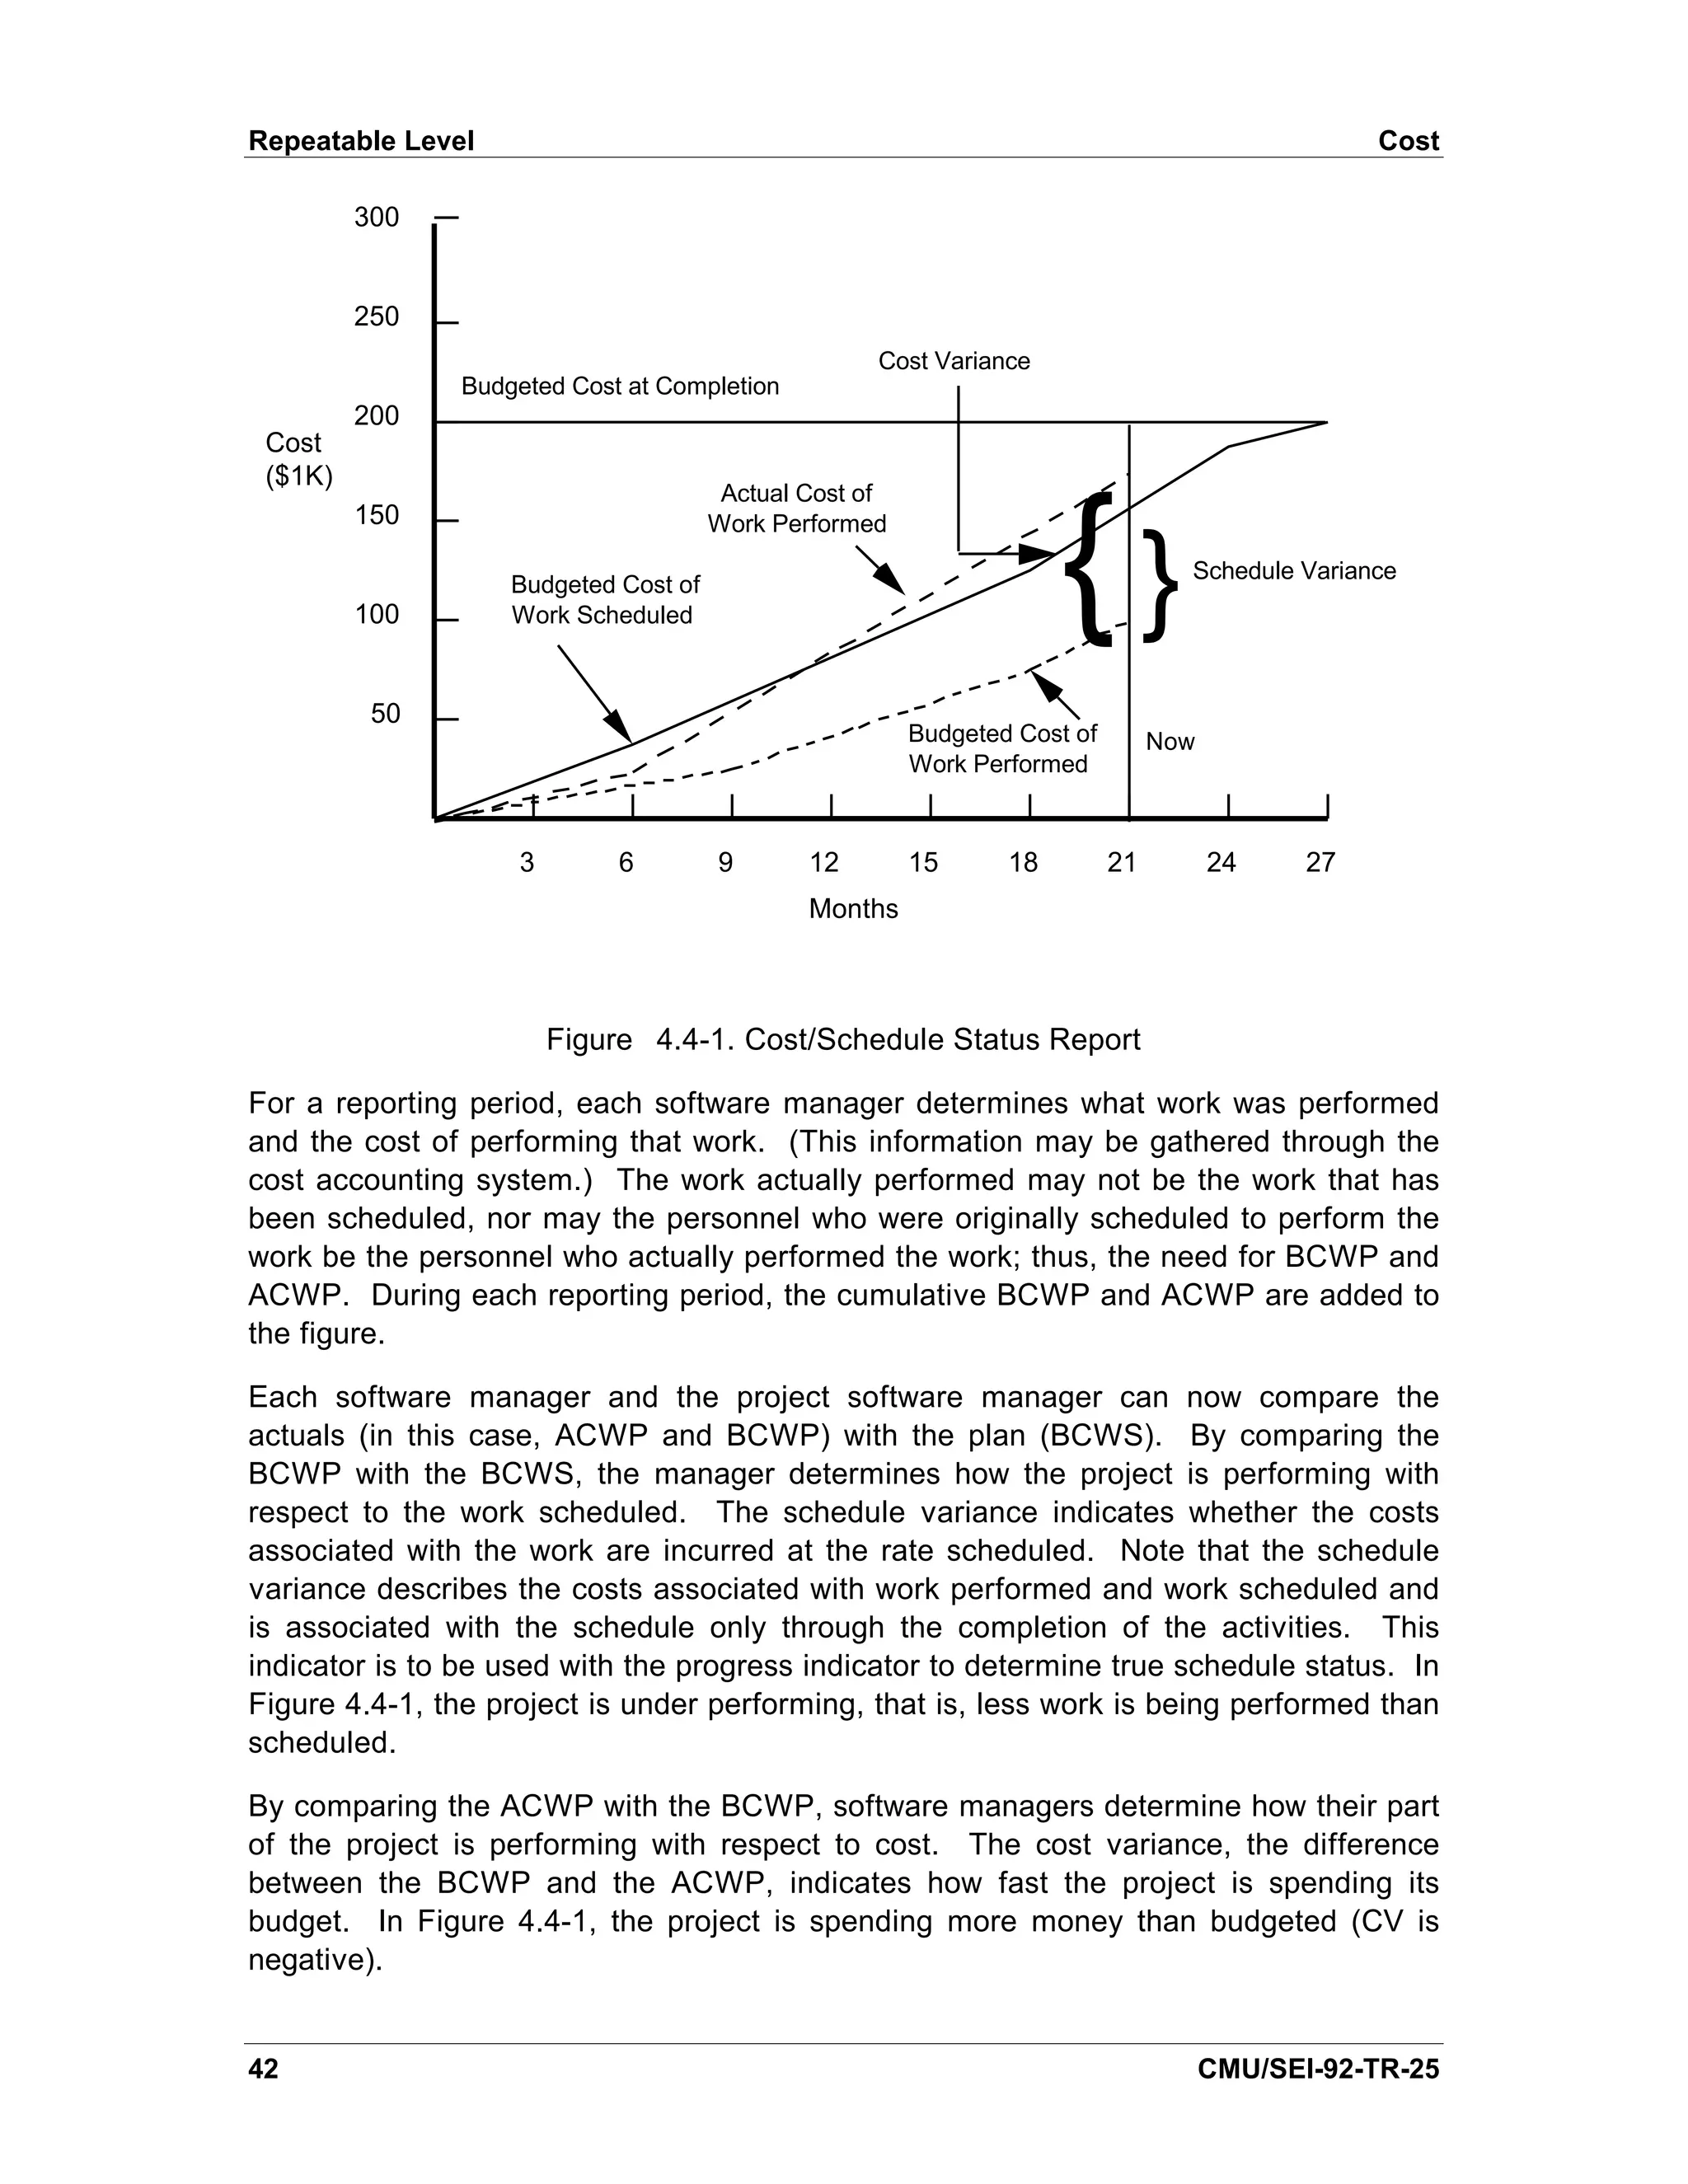
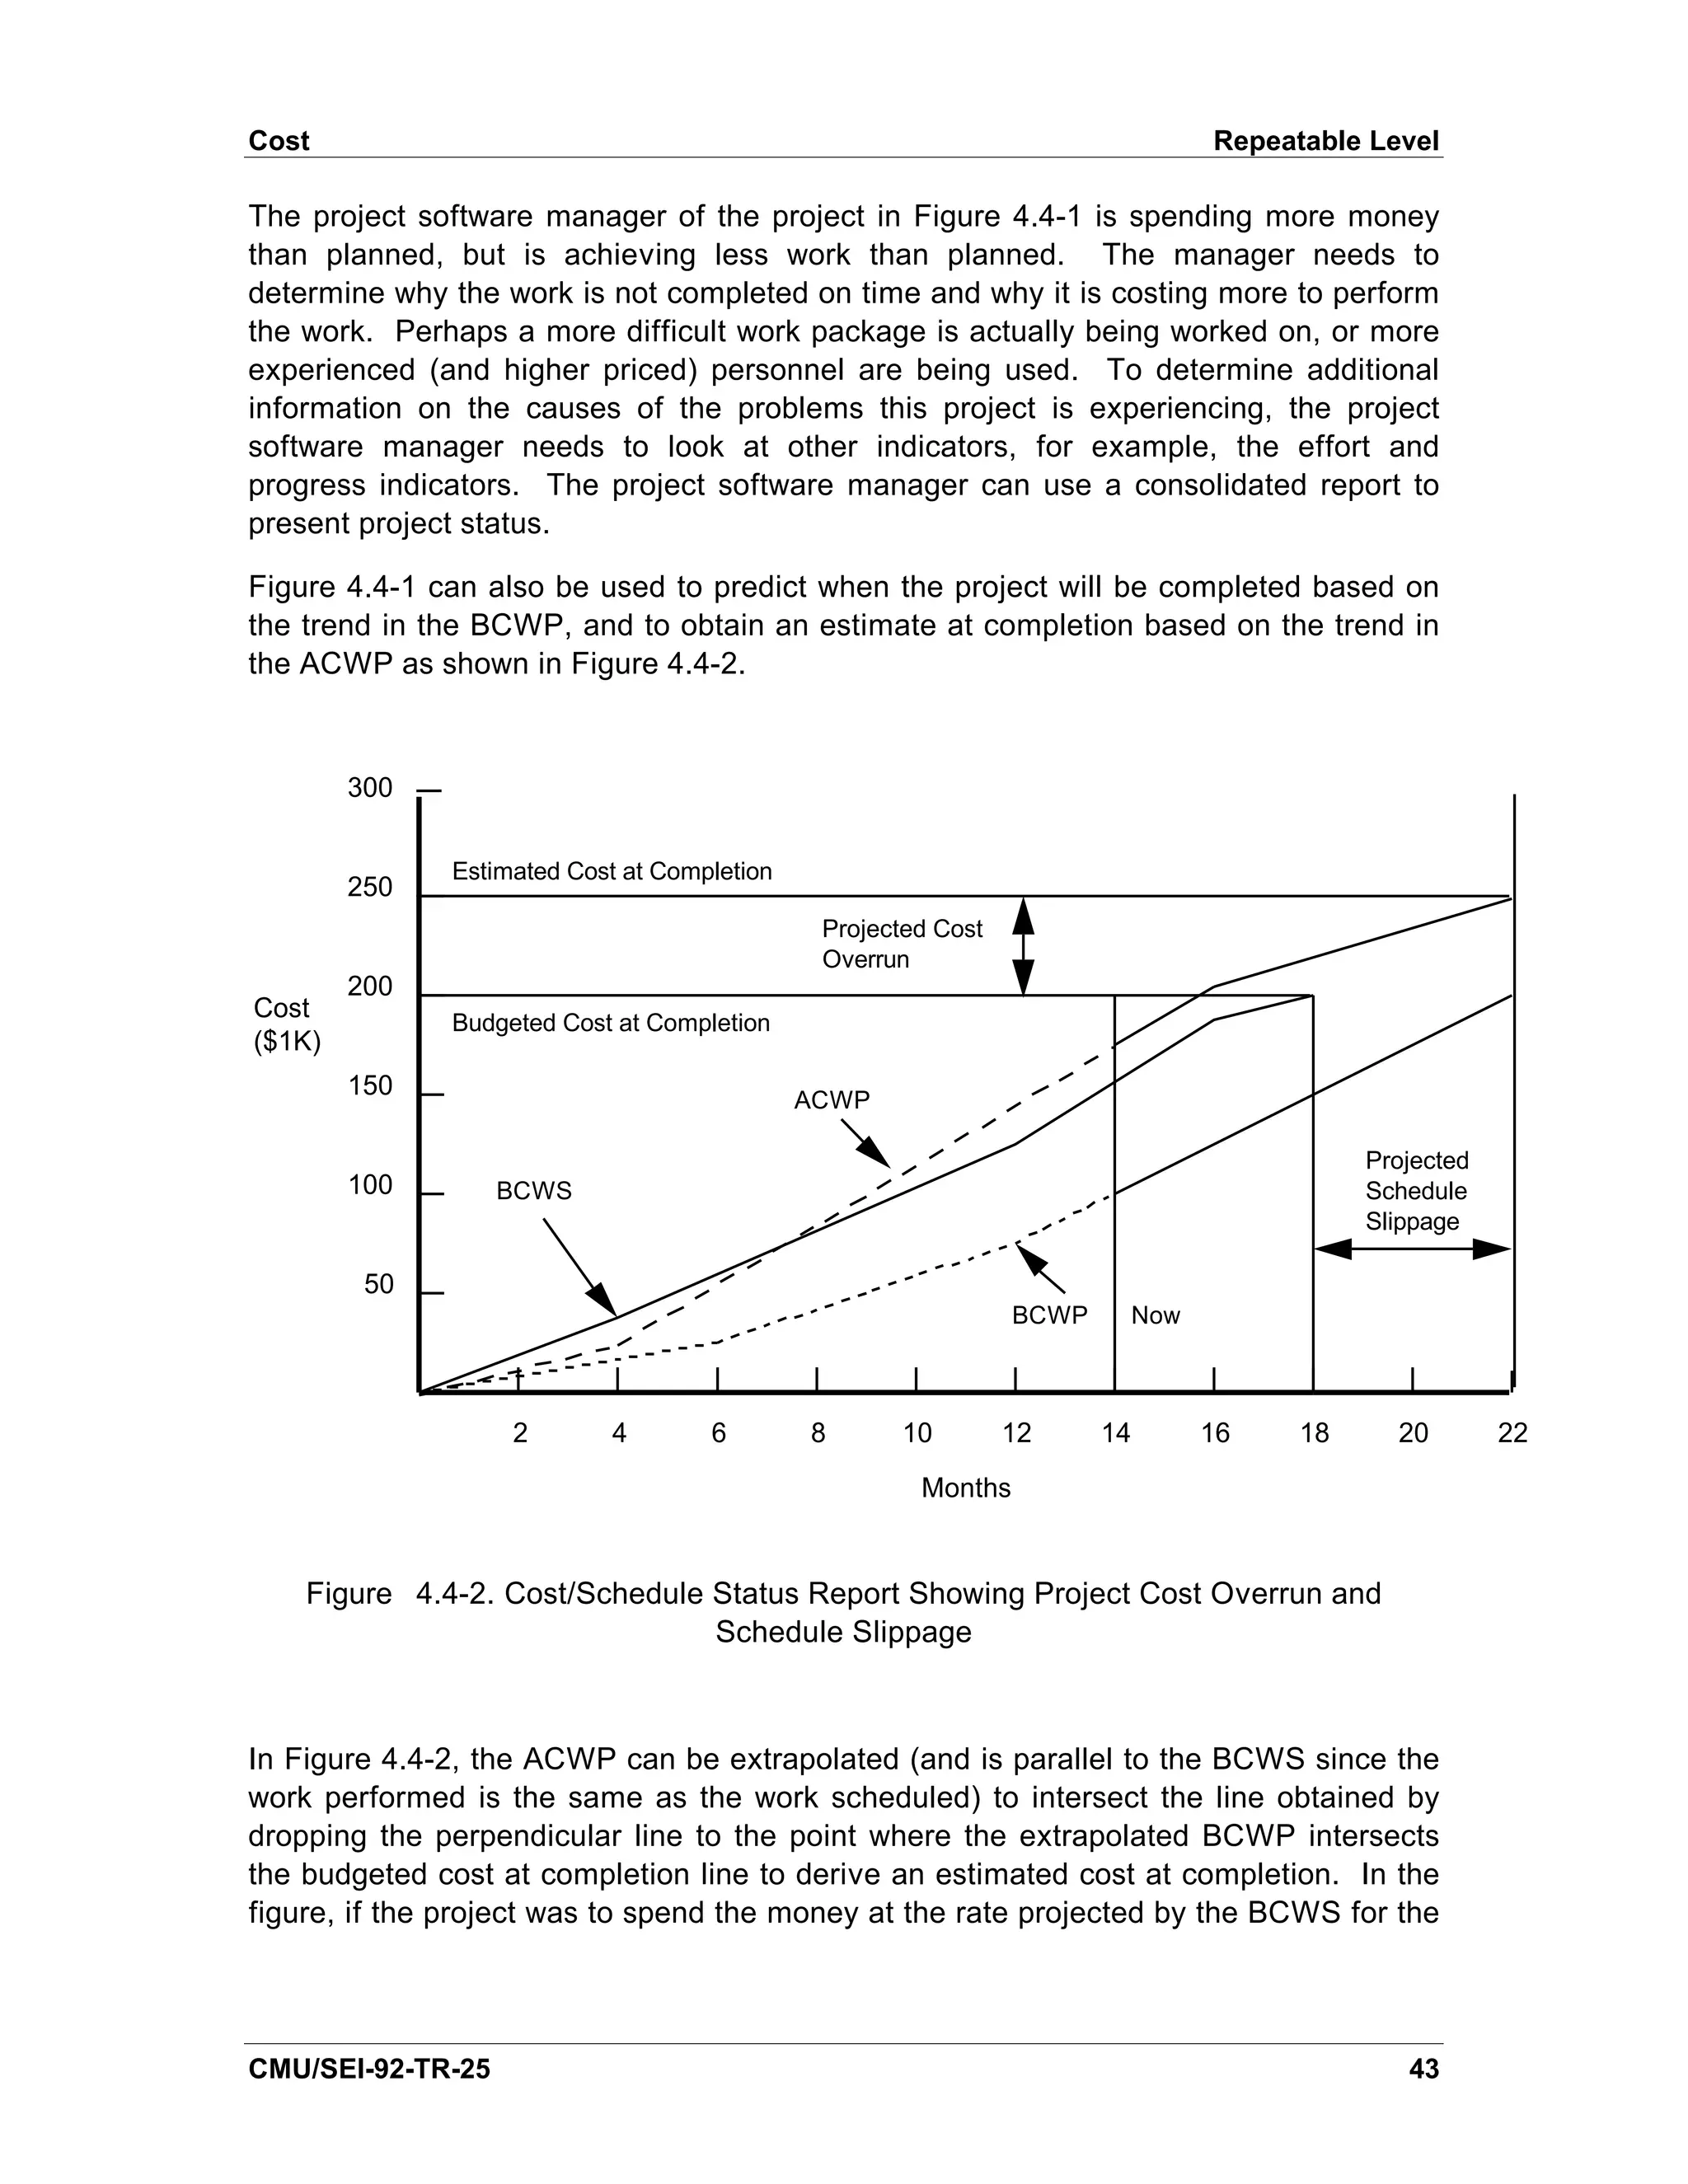
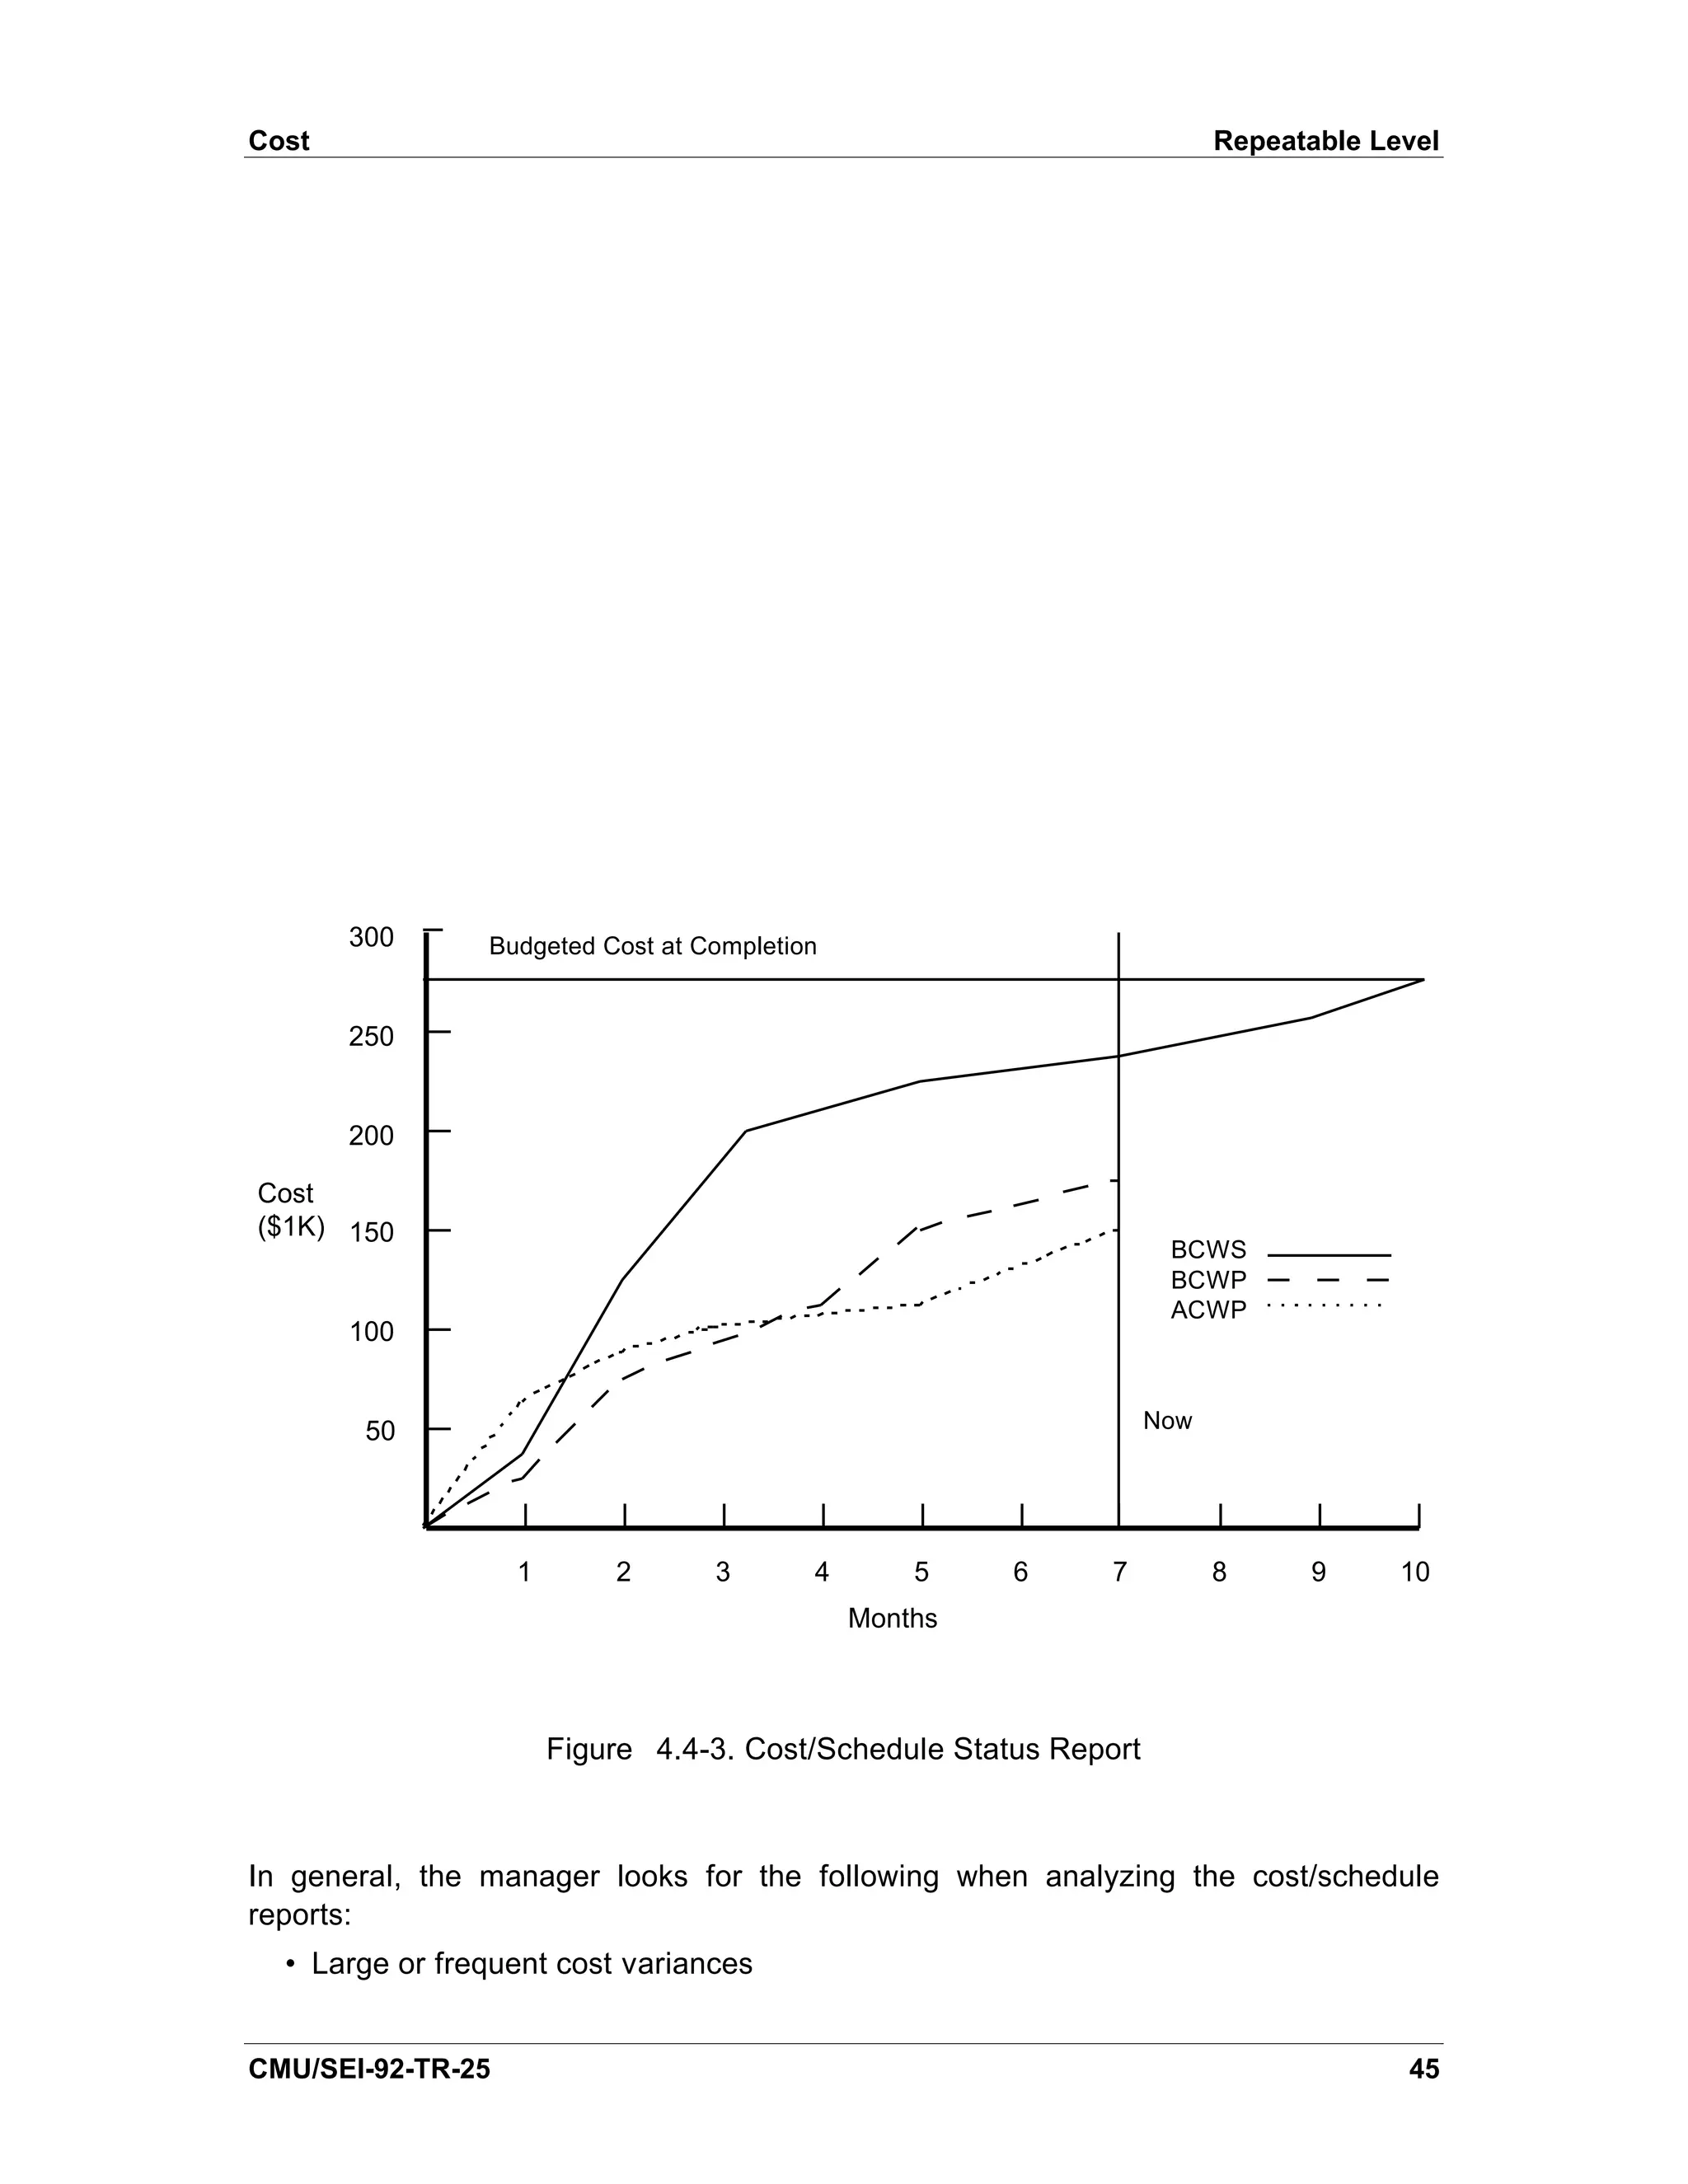
![Repeatable Level Cost
• Increasing cost/schedule variances
• Large schedule variances
• Failure to evaluate estimated cost at completion
• Consistently optimistic projections
• Frequent and extensive changes to the plans
• Plans that do not reflect actual conditions and are not being revised
Sources
[AFSC 86] has a discussion of these indicators.
[DoD 80] has a thorough discussion on the basics of the cost/schedule control reporting
and provided the definitions for ACWP, BCWP, and BCWS.
[DSDM 89] served as the major source of information in this section.
46 CMU/SEI-92-TR-25](https://image.slidesharecdn.com/softwaremeasuresandthecapabilitymaturitymodel-1992johnh-baumertsei-110103031855-phpapp02/75/Software-measures-and-the-capability-maturity-model-1992-john-h-baumert-sei-64-2048.jpg)

![4.5. Quality
At the Repeatable Level quality indicators are divided among the results of software
quality assurance audits, the results of life-cycle reviews with the customer, and the
trouble reports written after the implementation team has released the software for
testing. Even though there are numerous similarities among these three indicator
categories, and even though these indicators are discussed together by Florac et al
[Florac 92], they are discussed separately in this document to emphasize that the
information is gathered from three distinct activities and that each is used to obtain a
indication of the quality of the product and process.
4.5.1. Software Quality Assurance Audit Results
One of the goals of software quality assurance is to improve software quality by
monitoring both the software and the development process that produces it. An
effective way to accomplish this goal is through a quality audit. A quality audit checks a
product or process for compliance with project standards, procedures, and progress
reporting policy. When performed by an independent software quality assurance
organization, the project software manager is receiving an objective evaluation of the
product or process.
Objective of the Software Quality Assurance Audit Results Indicators
To provide project software management with an independent evaluation of the quality
of the product and/or adherence of the project staff to project requirements, standards,
and procedures.
Indicators
• Trends in the number, type, and severity of noncompliance issues found during
an audit
• Trends in the rate at which the noncompliance issues are being addressed
• Trends in the rate at which the noncompliance issues are being closed
Key Process Area Goals Addressed
Software Quality Assurance:
• Compliance of the software product and software process with applicable
standards, procedures, and product requirements is independently confirmed.
• When there are compliance problems, management is aware of them.
Life-Cycle Stages: All
Users
Mid-level and higher-level software management
CMU/SEI-92-TR-25 49](https://image.slidesharecdn.com/softwaremeasuresandthecapabilitymaturitymodel-1992johnh-baumertsei-110103031855-phpapp02/75/Software-measures-and-the-capability-maturity-model-1992-john-h-baumert-sei-67-2048.jpg)
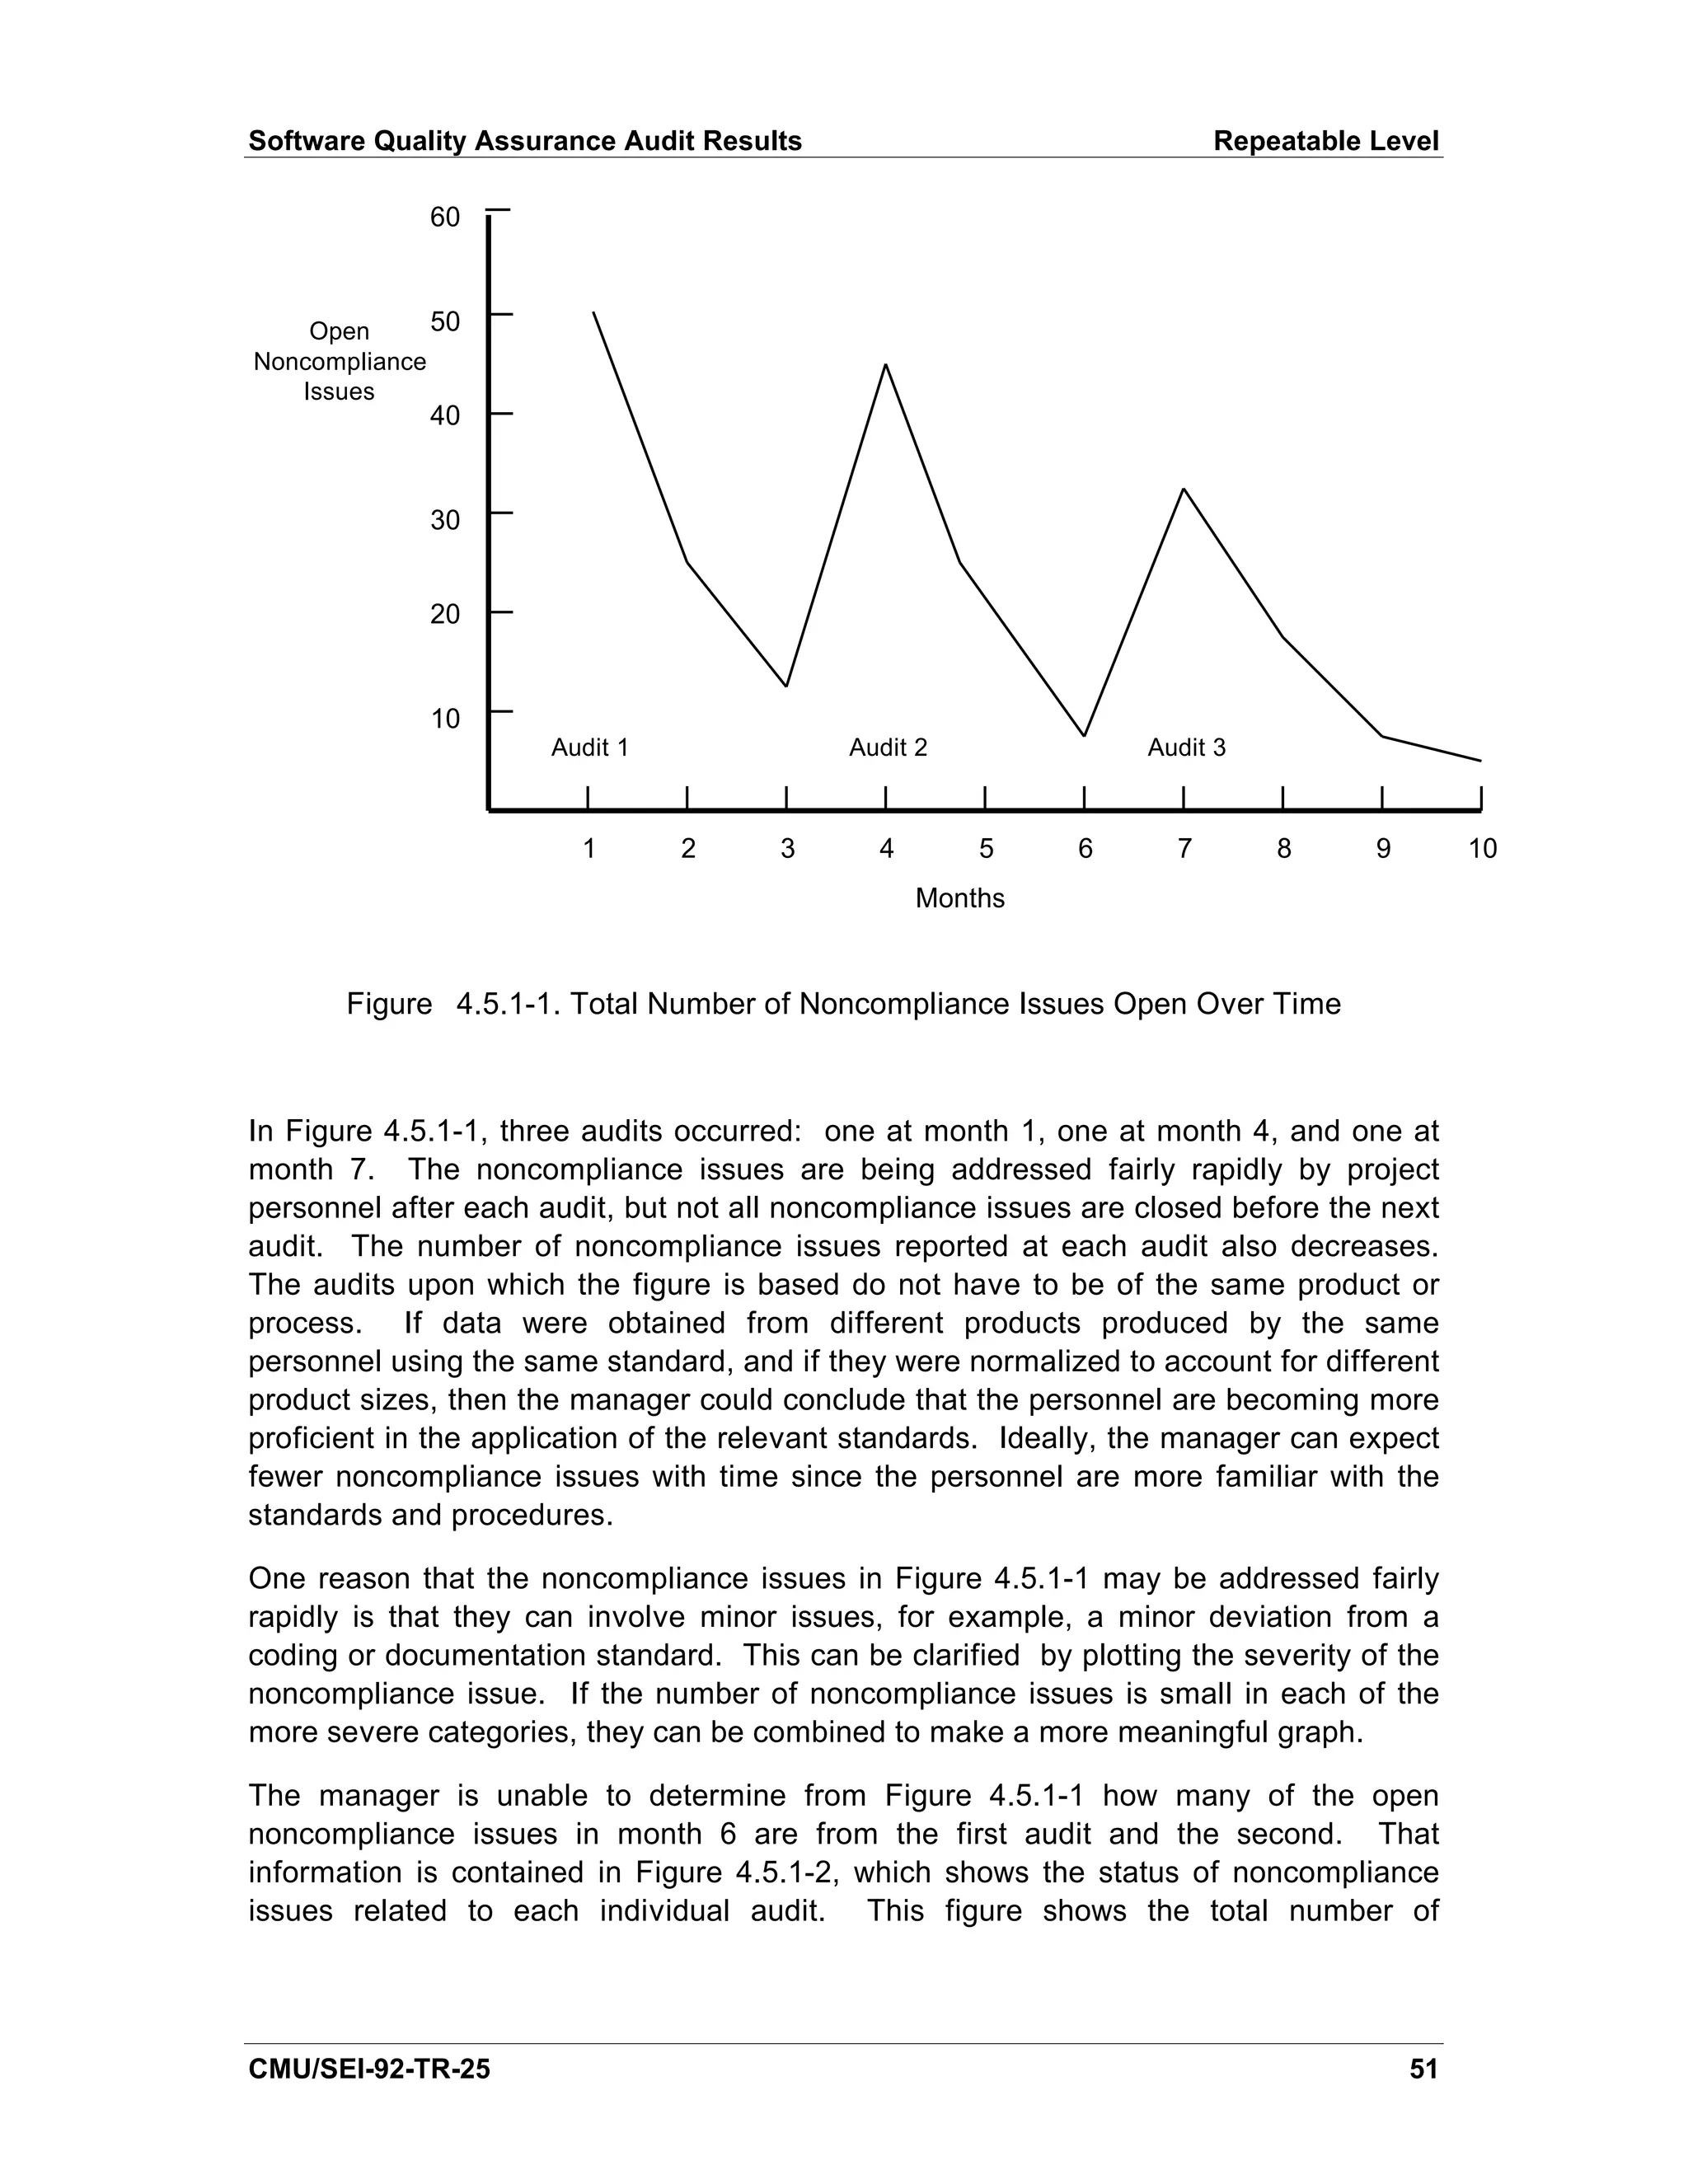
![Repeatable Level Software Quality Assurance Audit Results
noncompliance issues for each audit as well as the information displayed in Figure
4.5.1-1: the number of noncompliance issues open at any time and the rate at which
they are closed.
60 Open Closed
1 1 1 1 1
50
2 2 2 2
40
Noncompliance
Issues 3
30
20
10
1 2 3 4 5 6 7
Months
Figure 4.5.1-2. Number of Noncompliance Issues by Individual Audit
An alternative to Figure 4.5.1-2 is to plot the data from each audit on Figure 4.5.1-1 on
separate graphs.
Software quality assurance personnel prepare reports summarizing the results of the
audit. The report is distributed to the project software manager and other appropriate
managers. Managers receive a report only if it applies to their area of responsibility.
When severe quality problems exist and/or the noncompliance issues are not being
addressed adequately, the software quality manager reports the noncompliance issues
and their status to senior management.
Sources
[Pfleeger 89] and [Florac 92] discuss the tracking of problems found in a variety of life-
cycle stages. The software quality assurance audit results indicators are an extension
of that discussion.
52 CMU/SEI-92-TR-25](https://image.slidesharecdn.com/softwaremeasuresandthecapabilitymaturitymodel-1992johnh-baumertsei-110103031855-phpapp02/75/Software-measures-and-the-capability-maturity-model-1992-john-h-baumert-sei-70-2048.jpg)
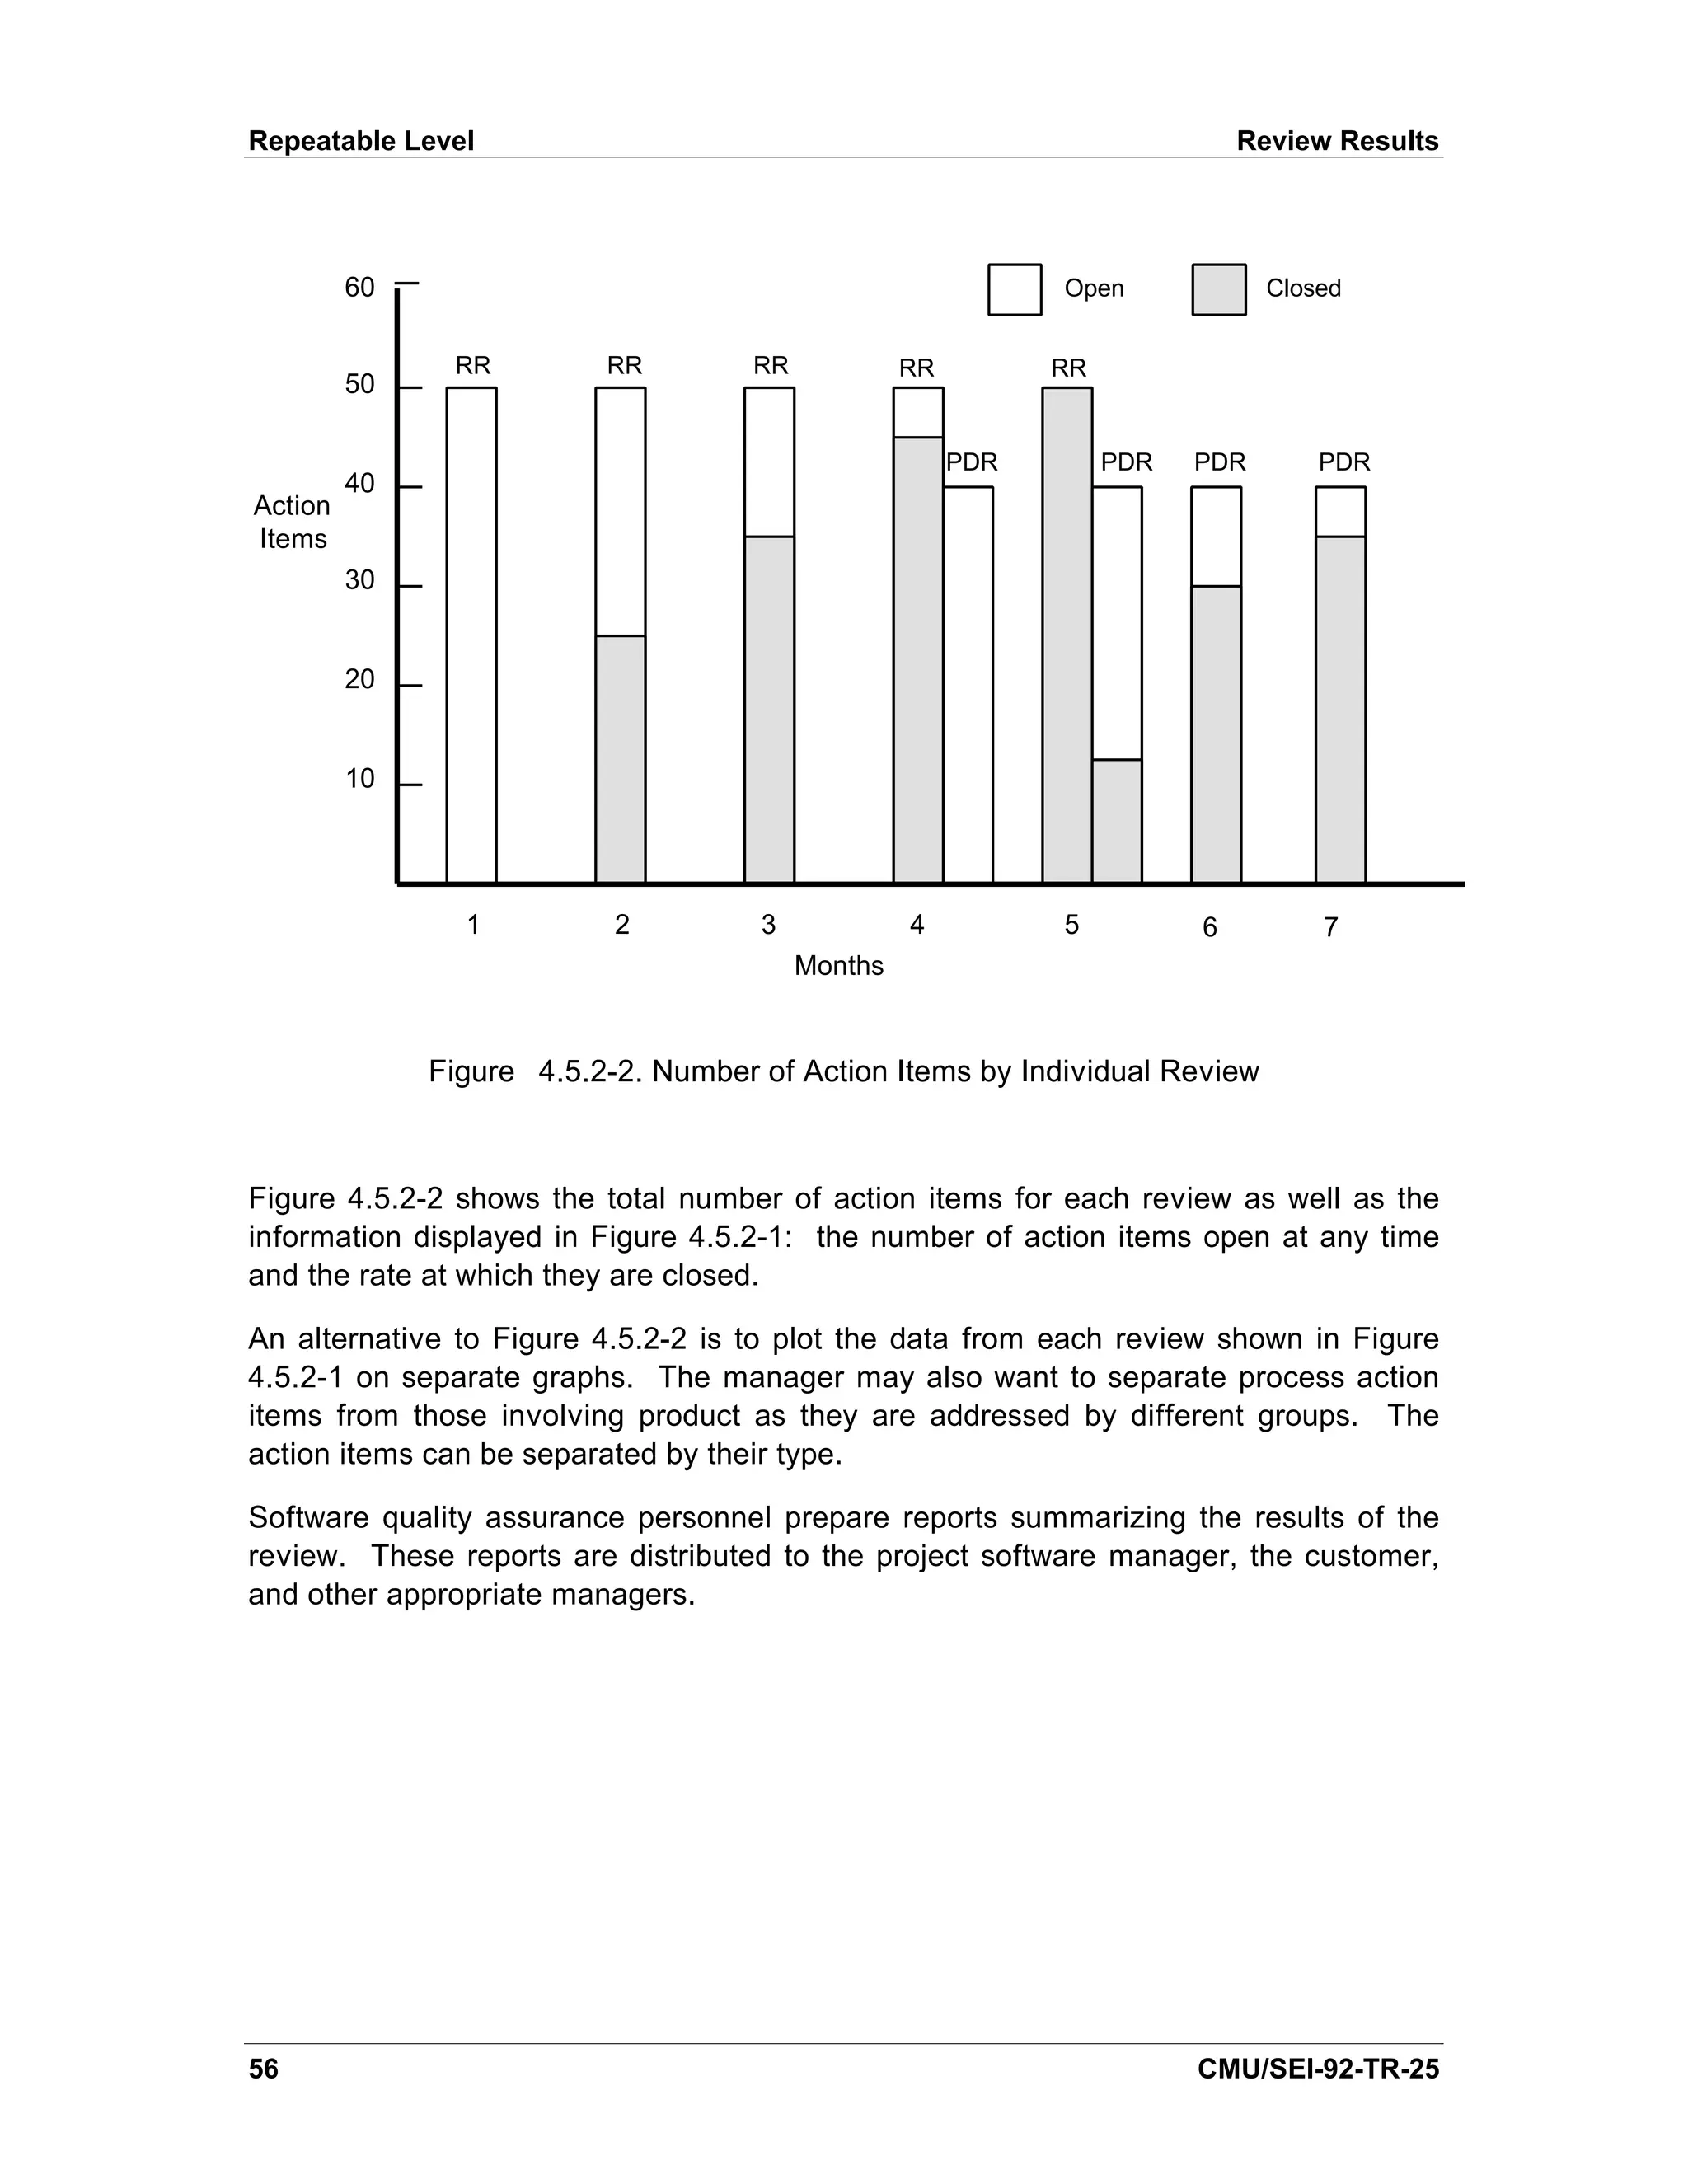
![4.5.2. Review Results
Of the many reviews held on a project, those held with the client are among the most
important. These formal reviews ensure coordination of the technical and business
aspects of the project, make all participating groups aware of the project status, and
either resolve or escalate key issues [Humphrey 89]. These reviews are major events
in the life of the project and are not peer reviews or the periodic status reviews held
with the customer to review cost and schedule issues. In the Department of Defense
2167A model, these reviews are the end-of-phase reviews wherein the customer gives
the approval to proceed to the next life-cycle phase. Also, these reviews can be used
to establish a baseline from which all further work proceeds.
At these reviews, action items are levied which are used in this indicator category. In
this document an action item is defined as any review discrepancy, clarification, or
issue that must be resolved by the project or the customer. Issues raised during peer
reviews are NOT included in the review results indicator. Peer review moderators must
track the action items originating in the peer reviews, but the shortened time scales
within the peer review process render the formalism discussed in this section
impractical.
Objective of the Review Results Indicators
To provide software project management, senior management, and the customer with
the status of action items originating during a life-cycle review.
Indicators
• Trends in the number, type, and priority of action items recorded during a review
• Trends in the rate at which the action items are being addressed
Key Process Area Goals Addressed
Software Project Tracking and Oversight:
• Actual results and performance of the software project are tracked against
documented and approved plans.
• Corrective actions are taken when the actual results and performance of the
software project deviate significantly from the plans.
• Changes to software commitments are understood and agreed to by all affected
groups and individuals.
Software Quality Assurance:
• Compliance of the software product and software process with applicable
standards, procedures, and product requirements is independently confirmed.
• When there are compliance problems, management is aware of them.
CMU/SEI-92-TR-25 53](https://image.slidesharecdn.com/softwaremeasuresandthecapabilitymaturitymodel-1992johnh-baumertsei-110103031855-phpapp02/75/Software-measures-and-the-capability-maturity-model-1992-john-h-baumert-sei-71-2048.jpg)
![Review Results Repeatable Level
Sources
[AFSC 86] discusses tracking action items in its requirements definition and stability
indicators.
[Florac 92] discusses tracking action items in a general discussion of a problem
management system.
[Rozum 92] discusses tracking action items according to a software defects metric.
[Schultz 88] discusses tracking action items in his software volatility metric.
CMU/SEI-92-TR-25 57](https://image.slidesharecdn.com/softwaremeasuresandthecapabilitymaturitymodel-1992johnh-baumertsei-110103031855-phpapp02/75/Software-measures-and-the-capability-maturity-model-1992-john-h-baumert-sei-75-2048.jpg)
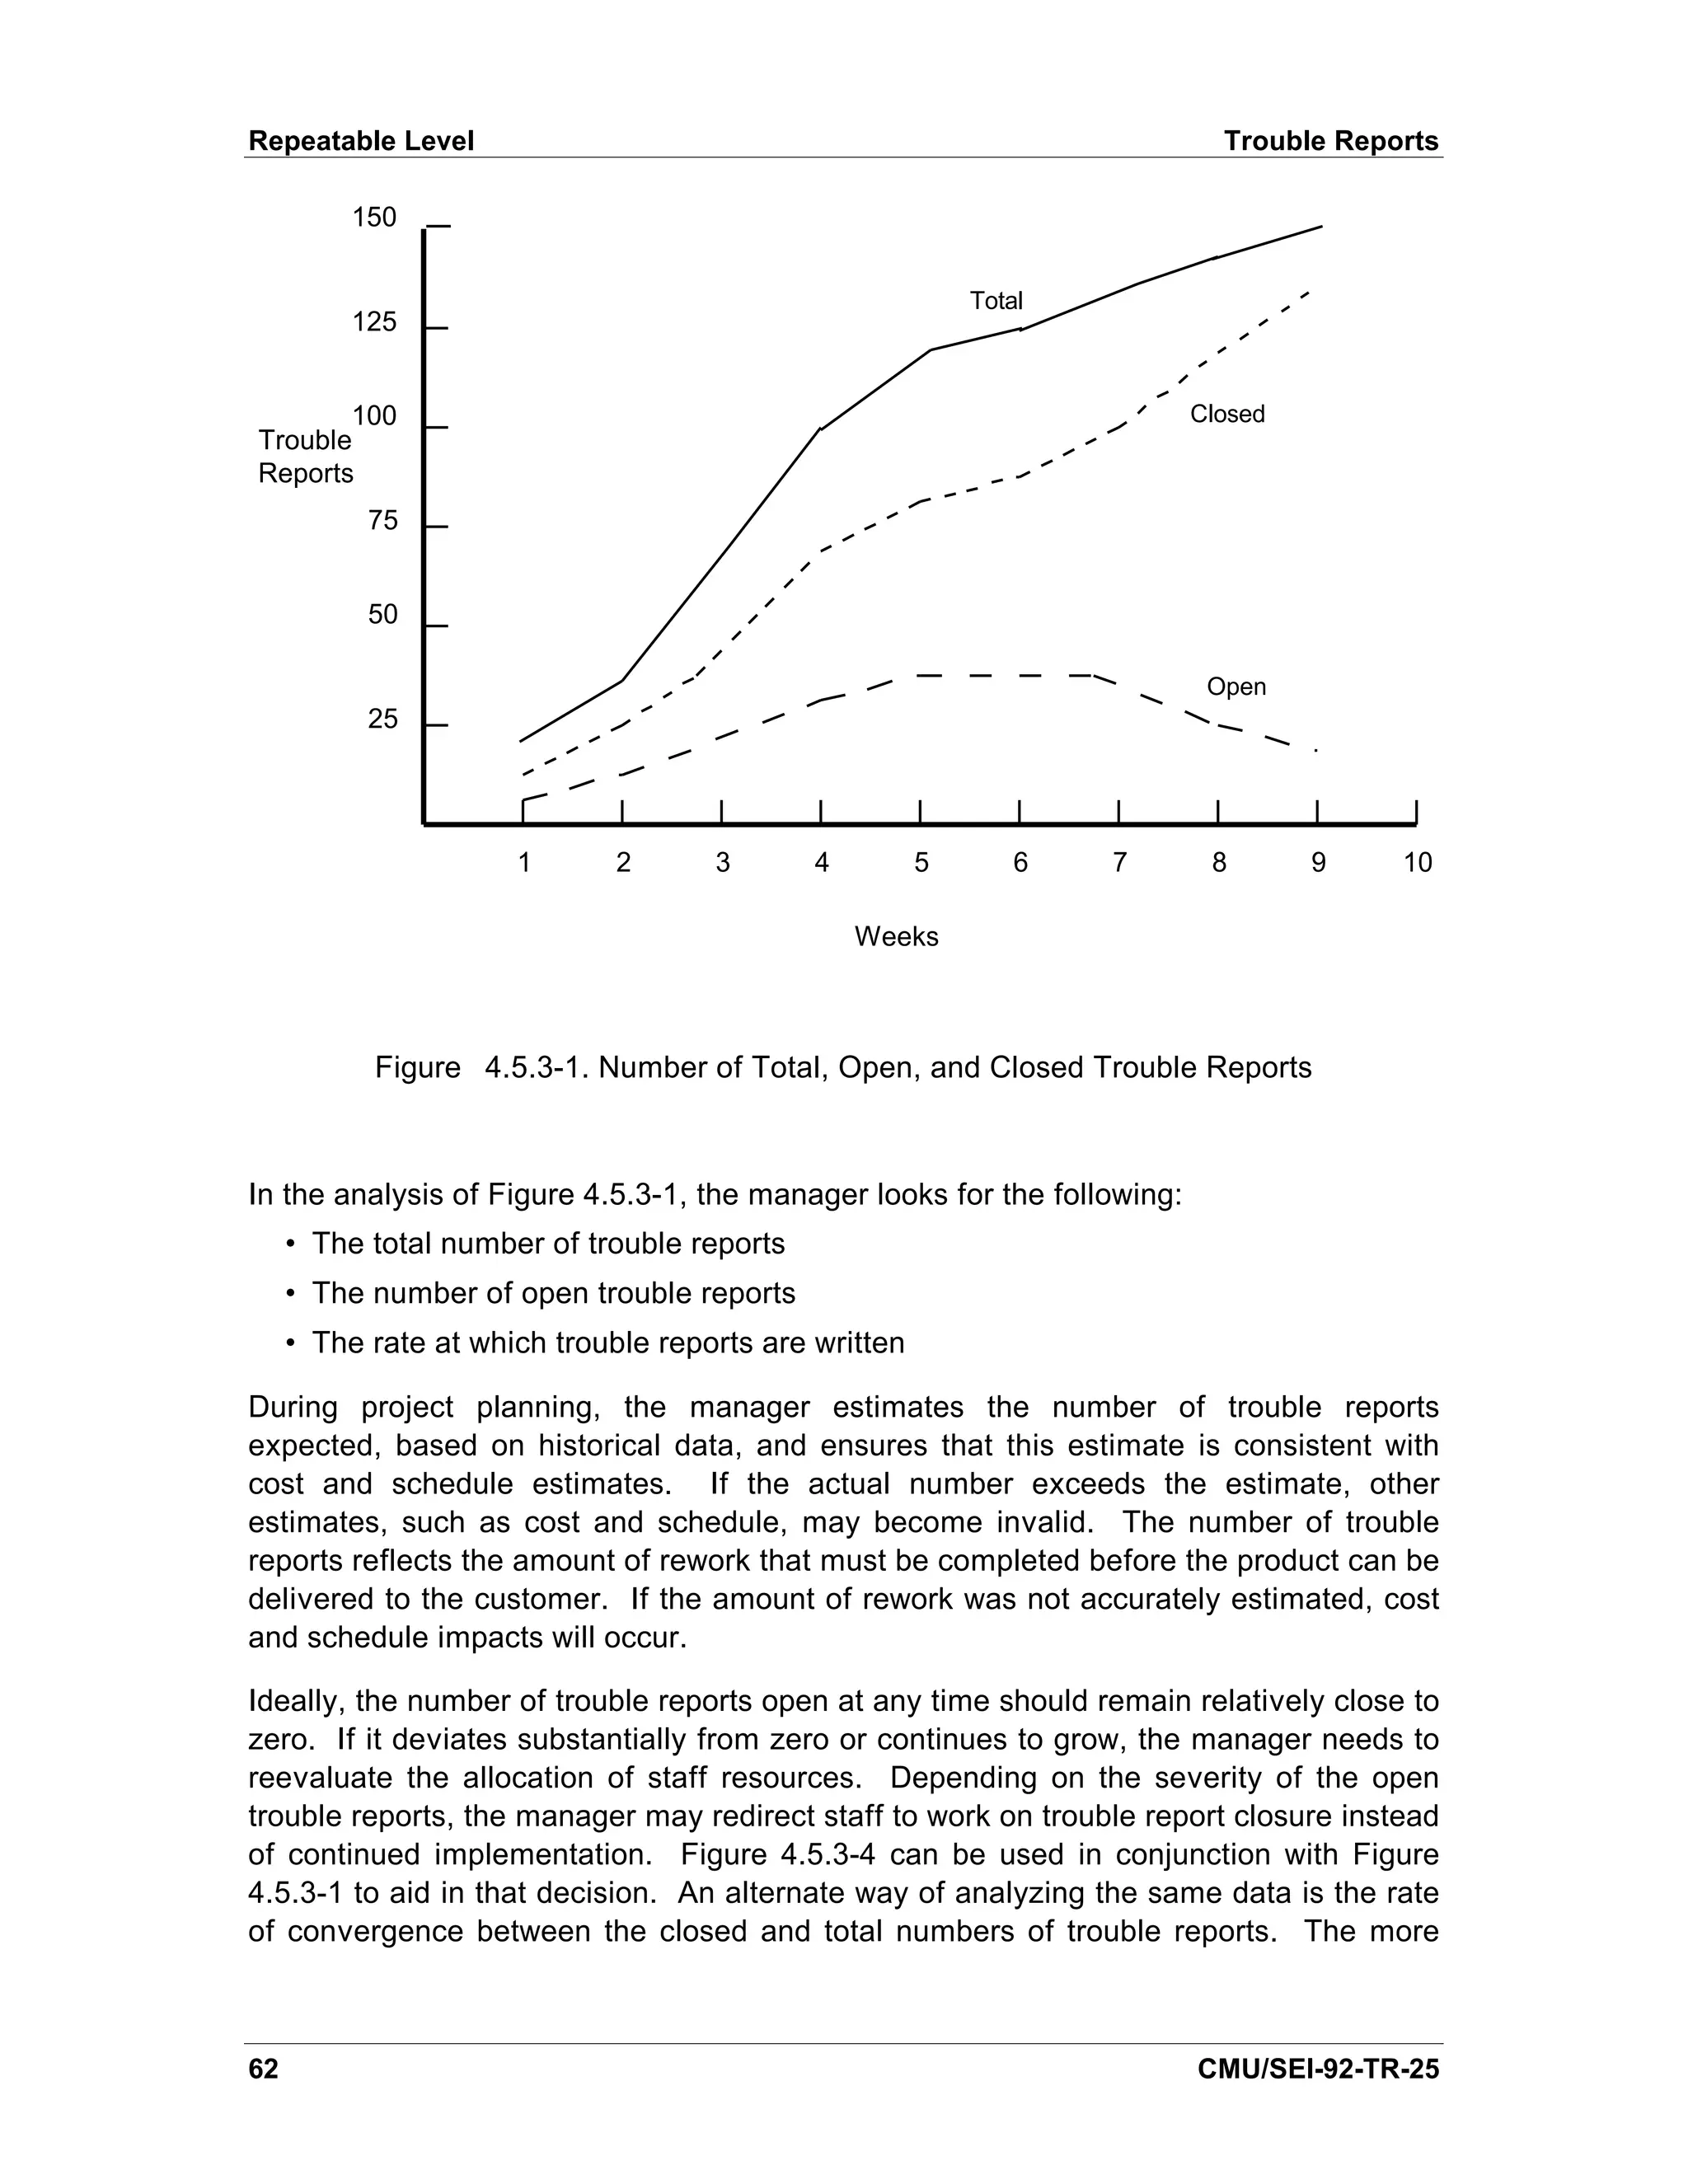
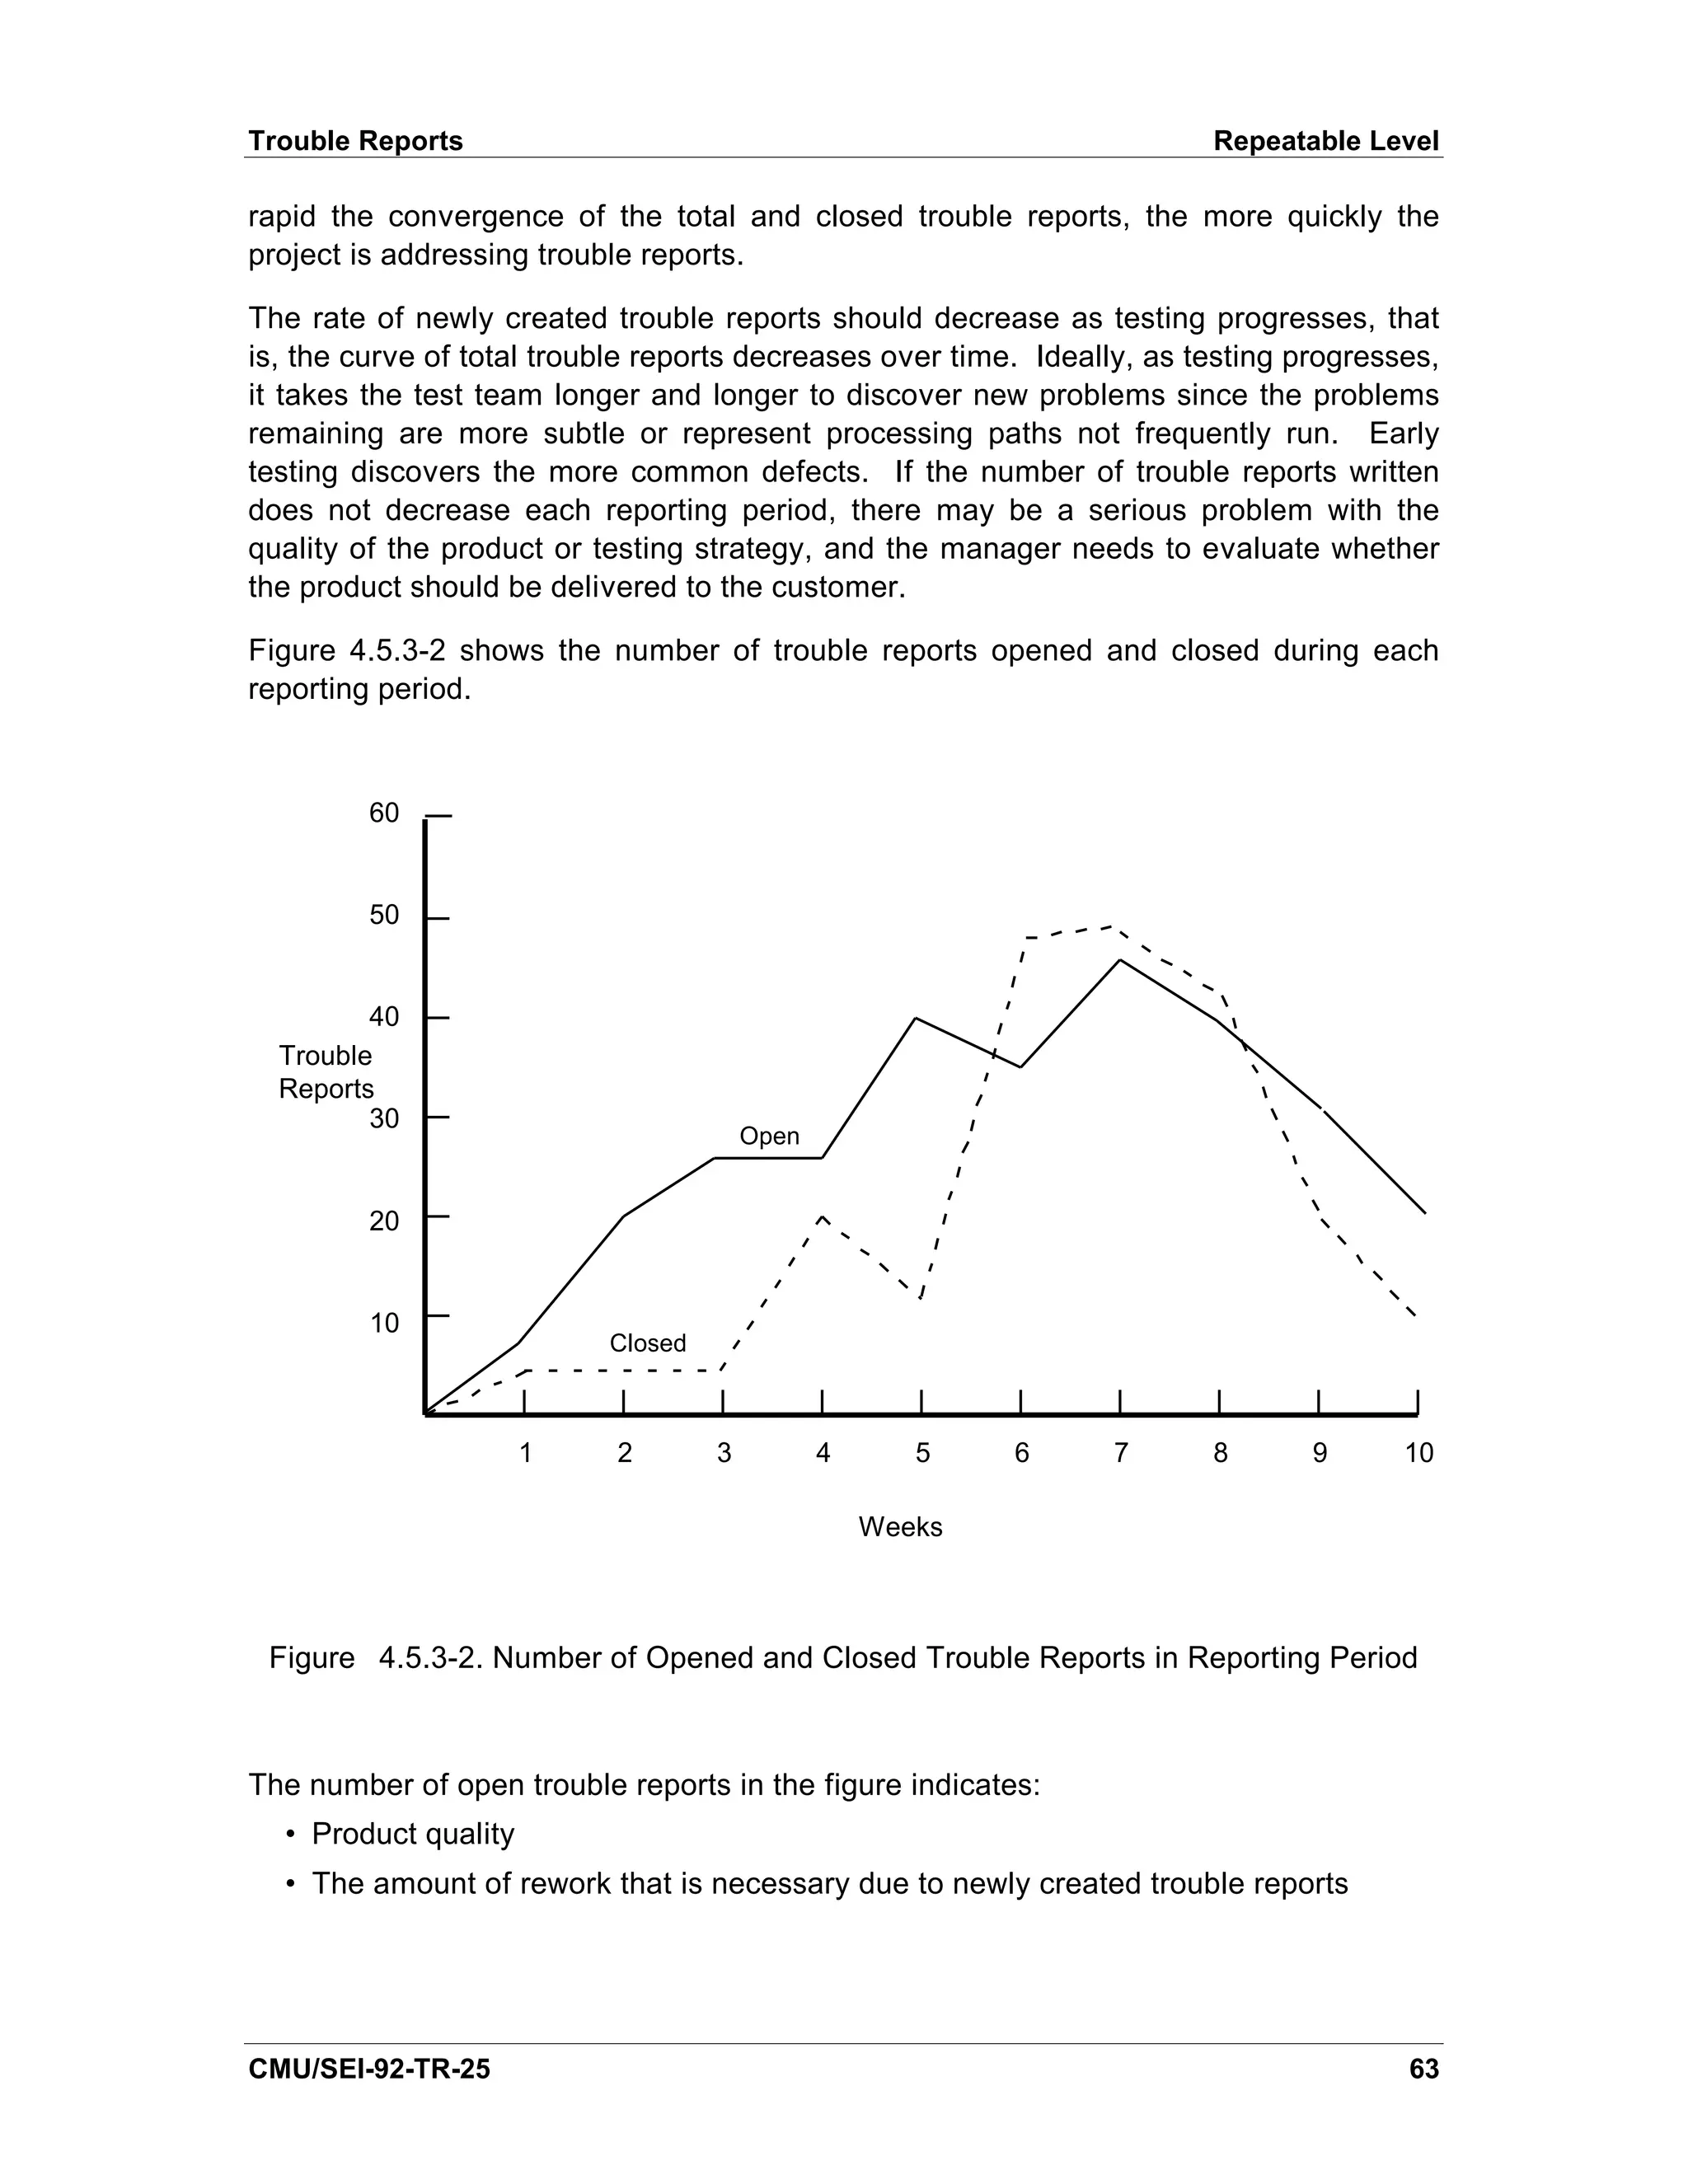
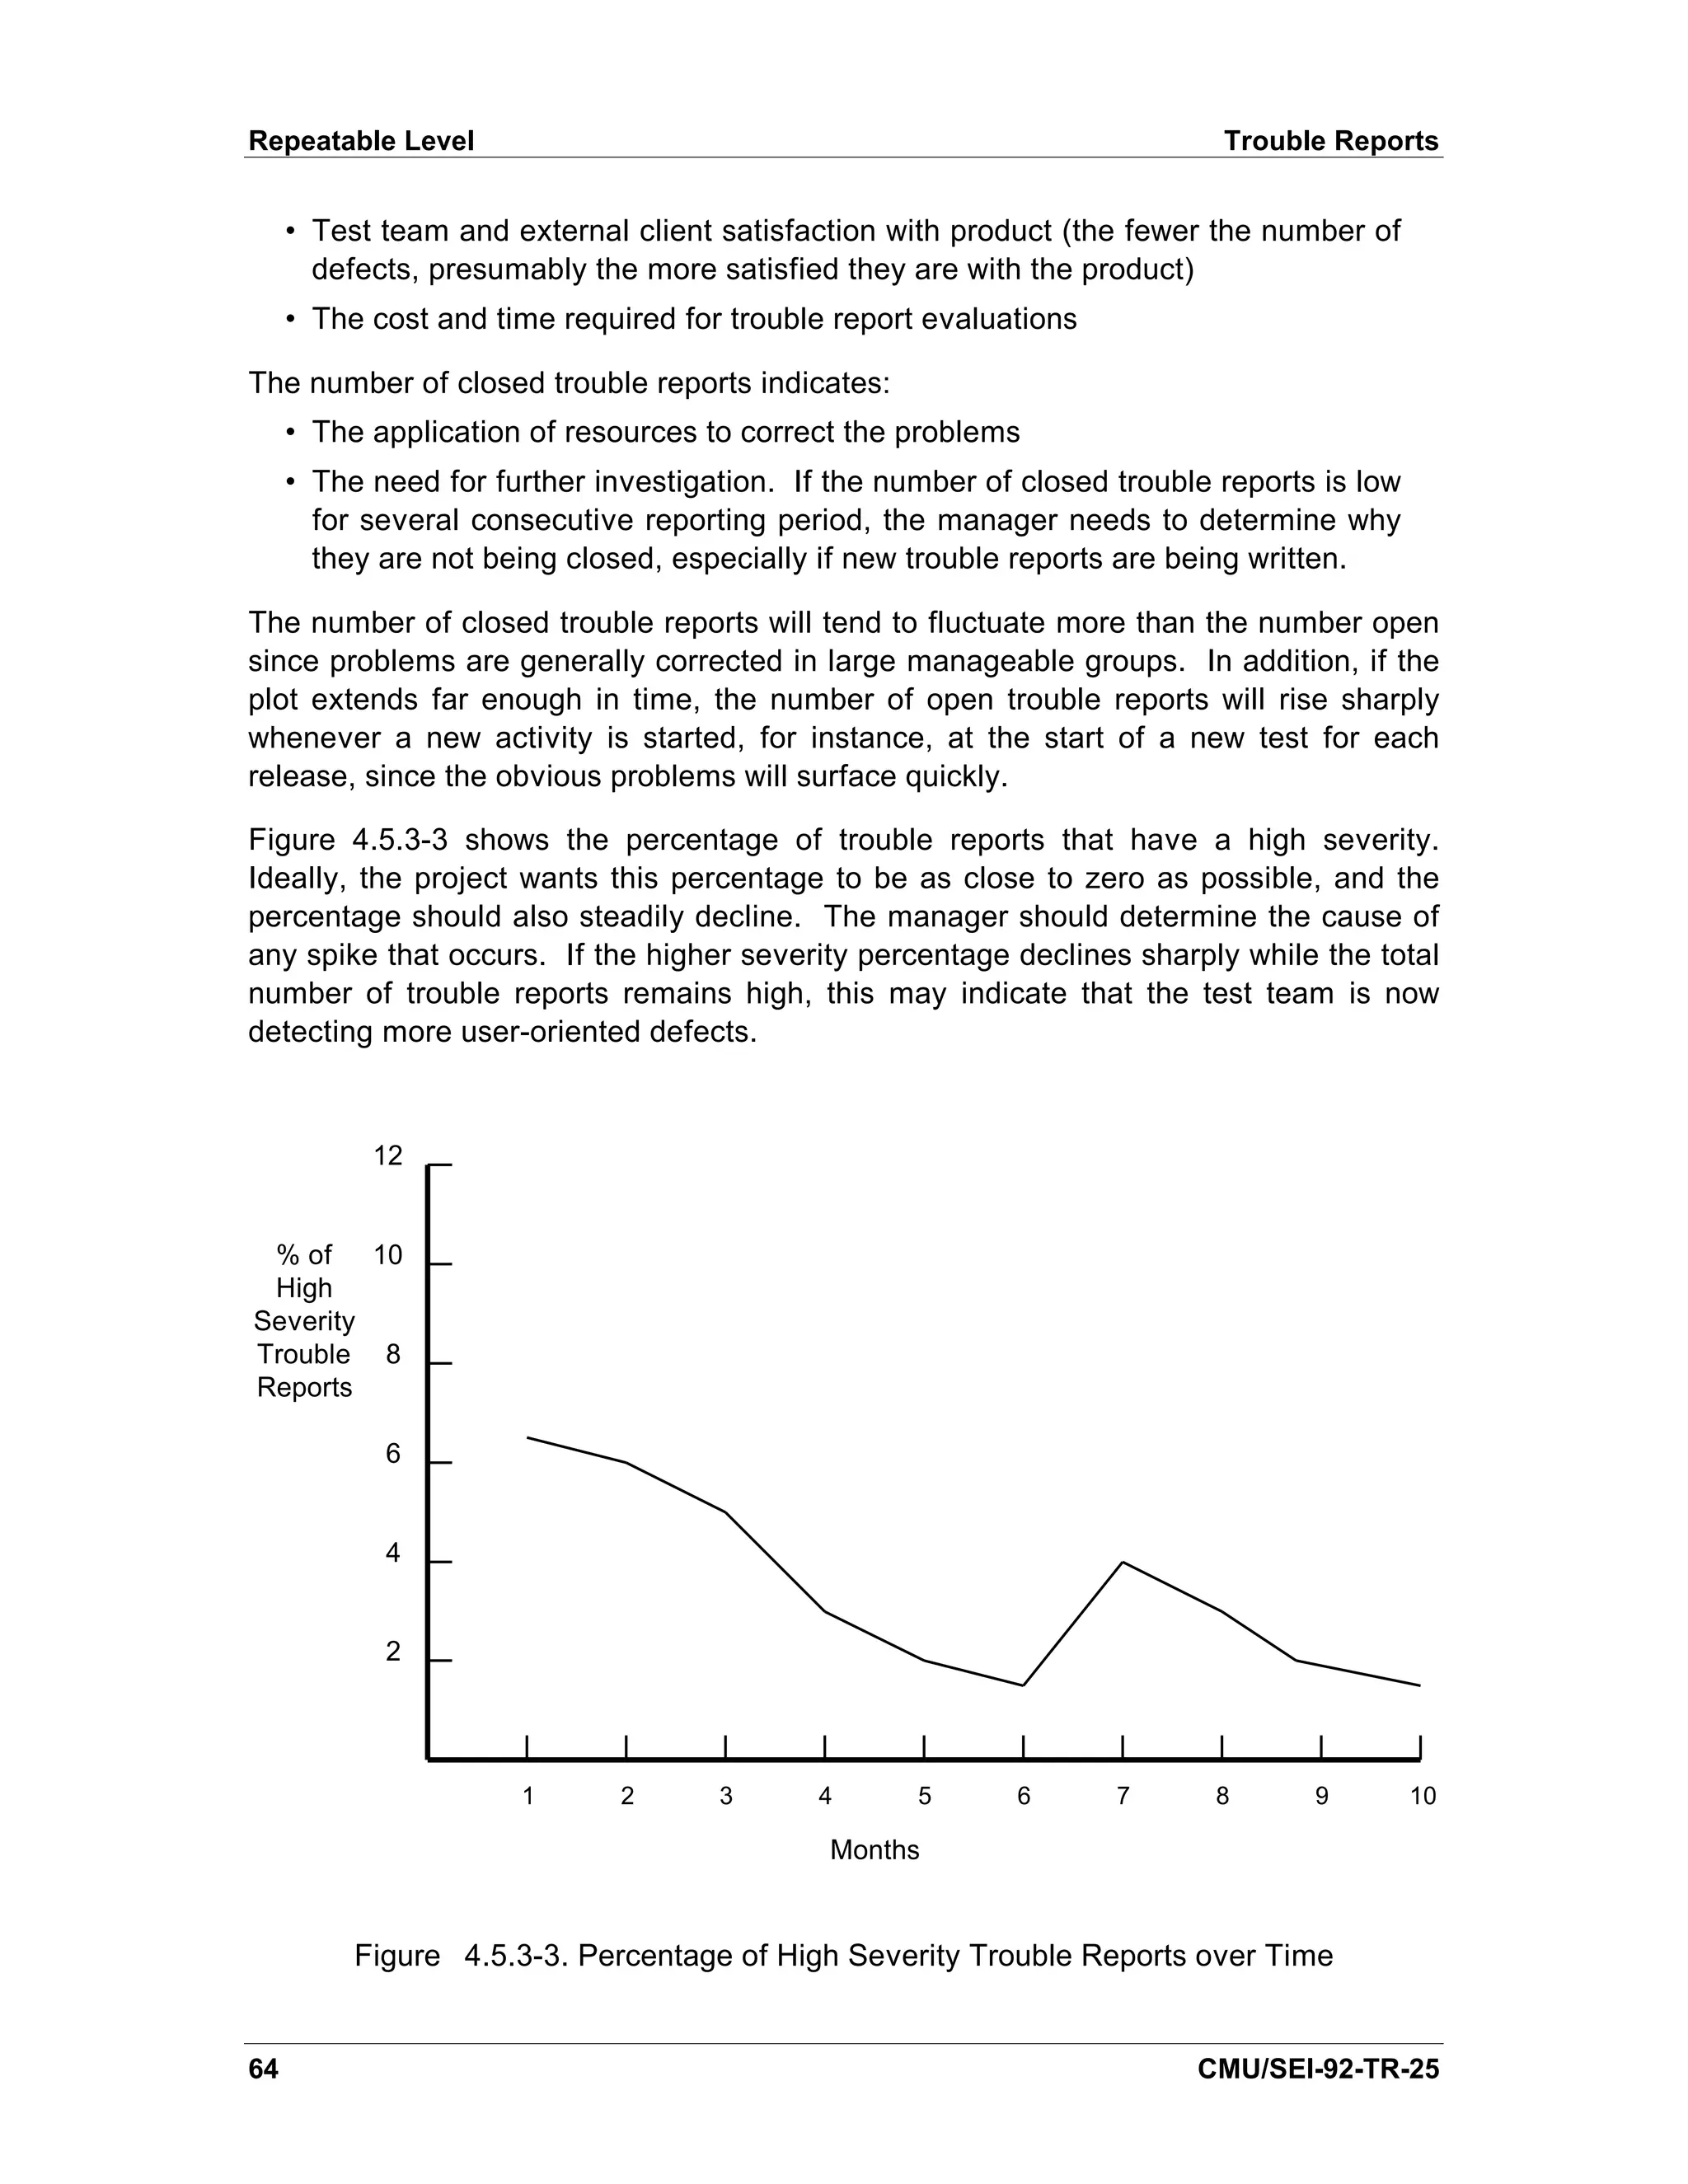
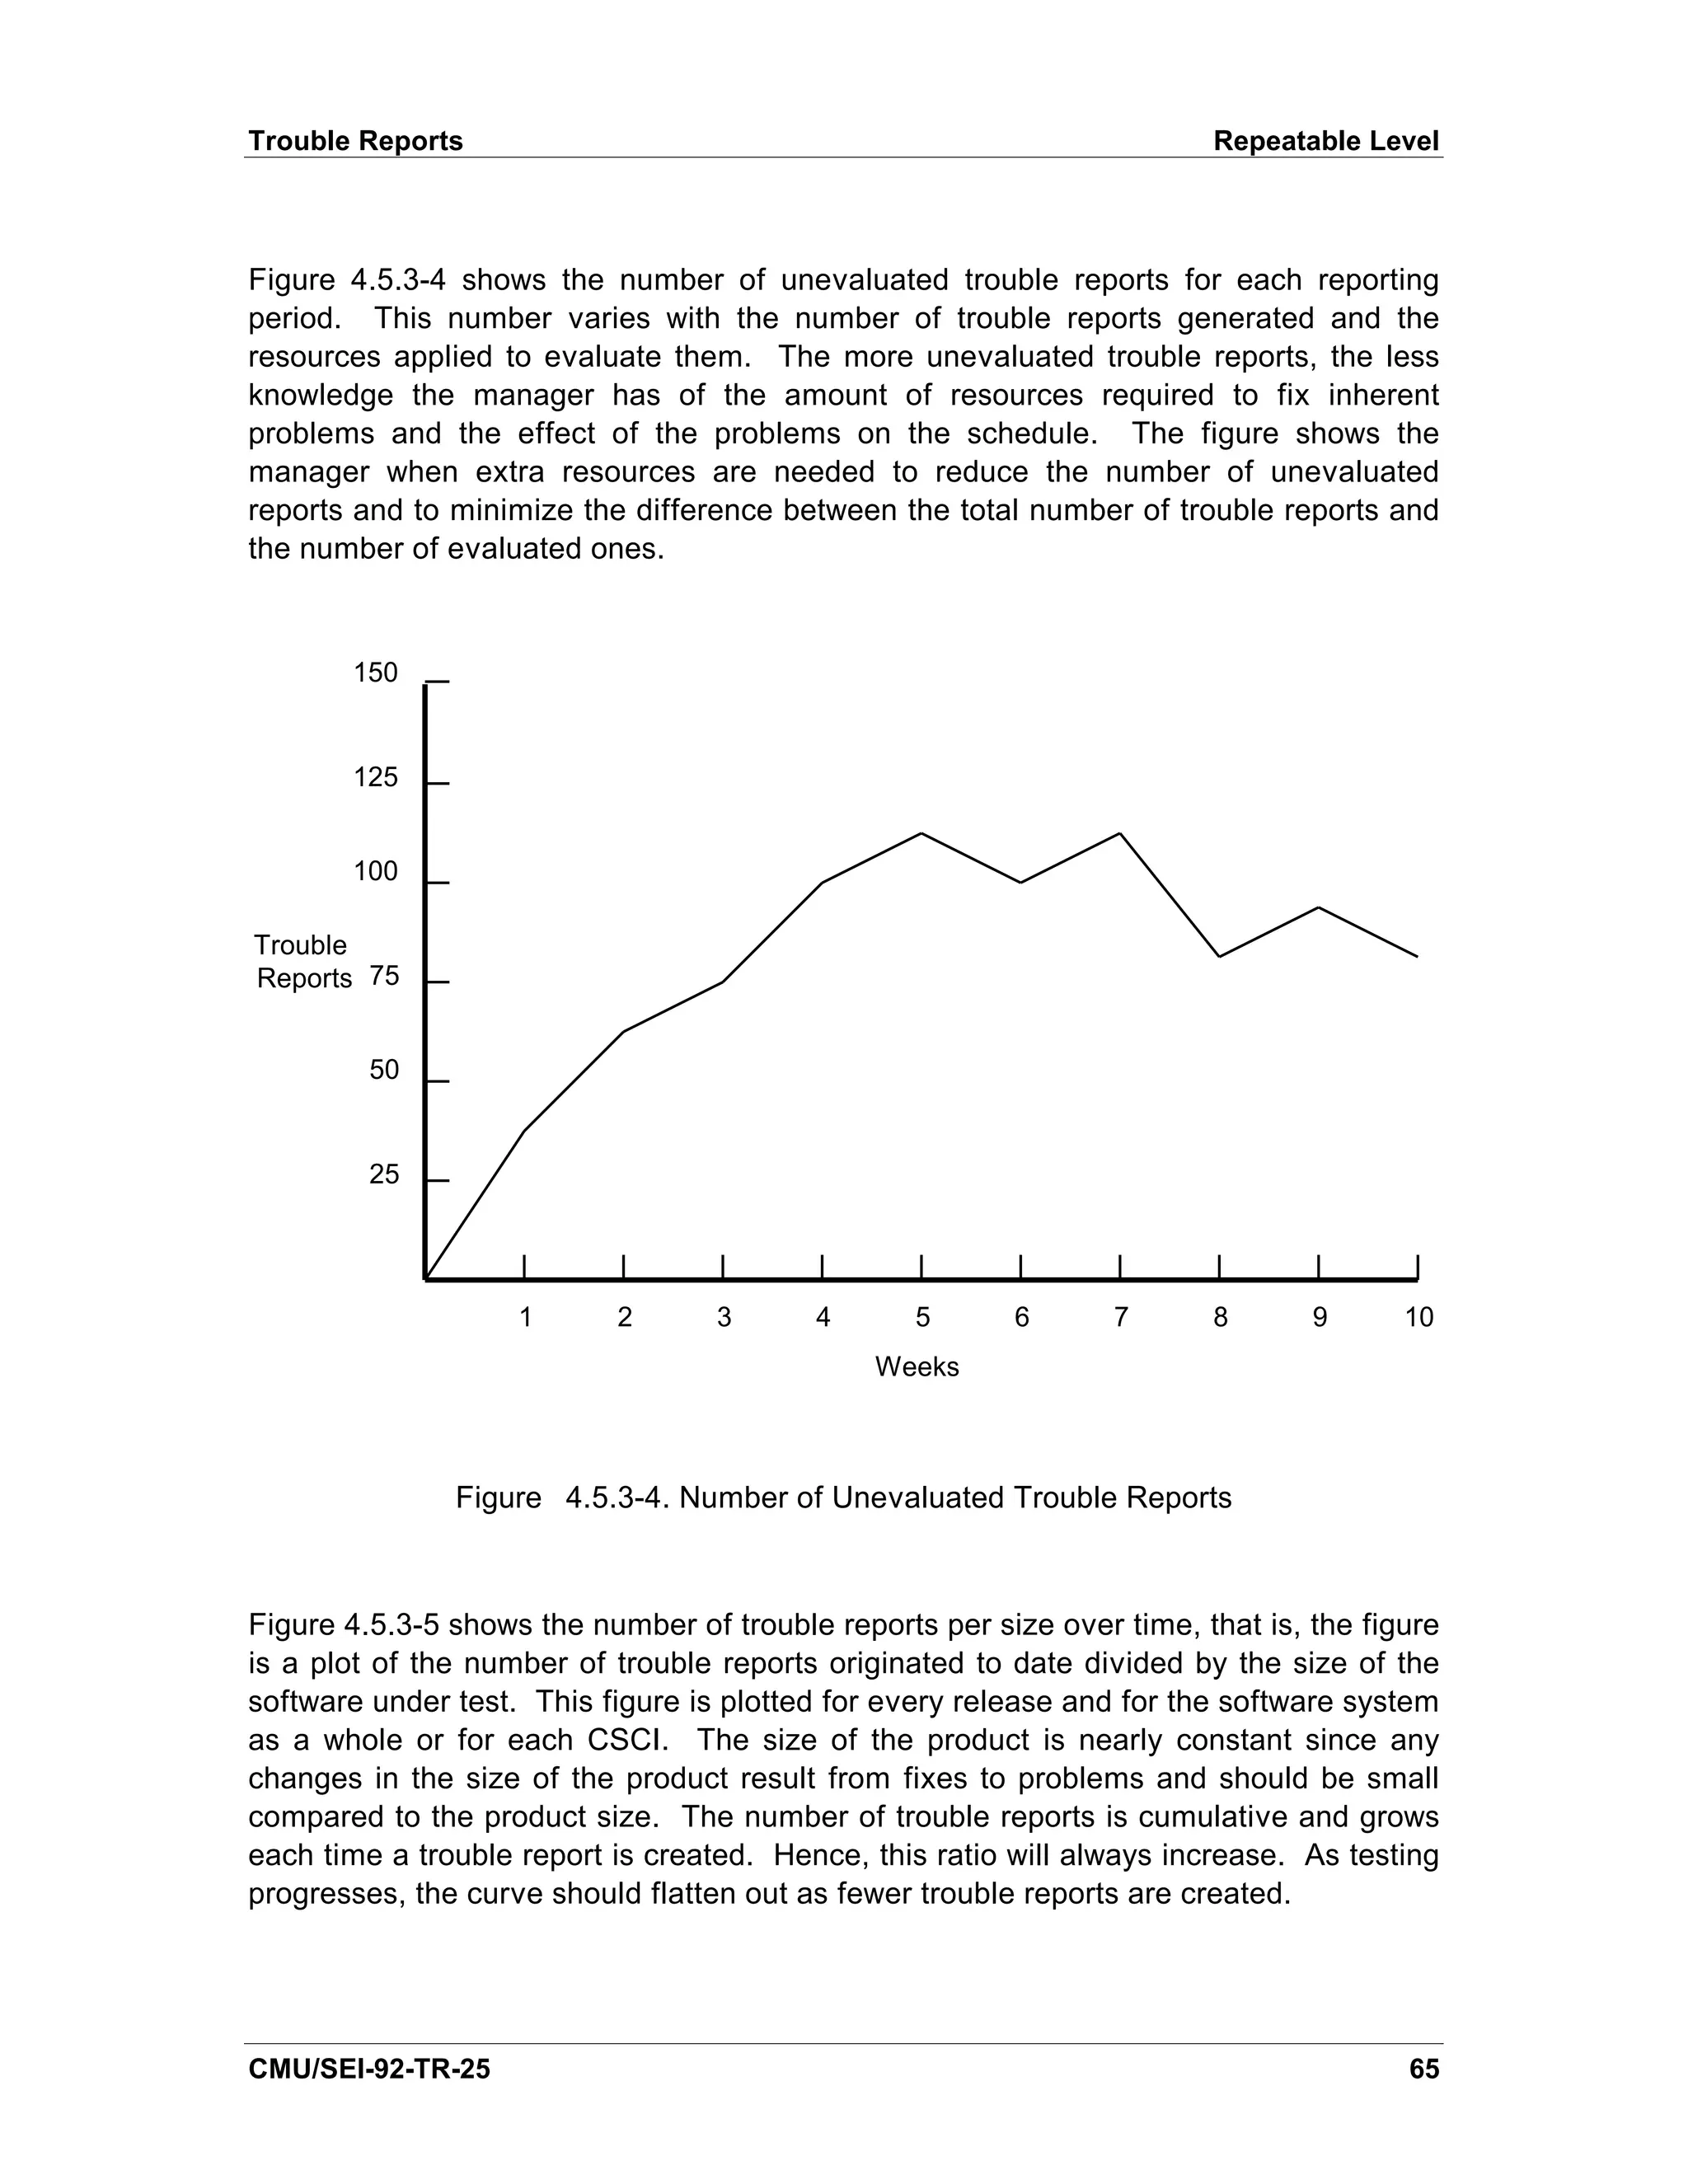
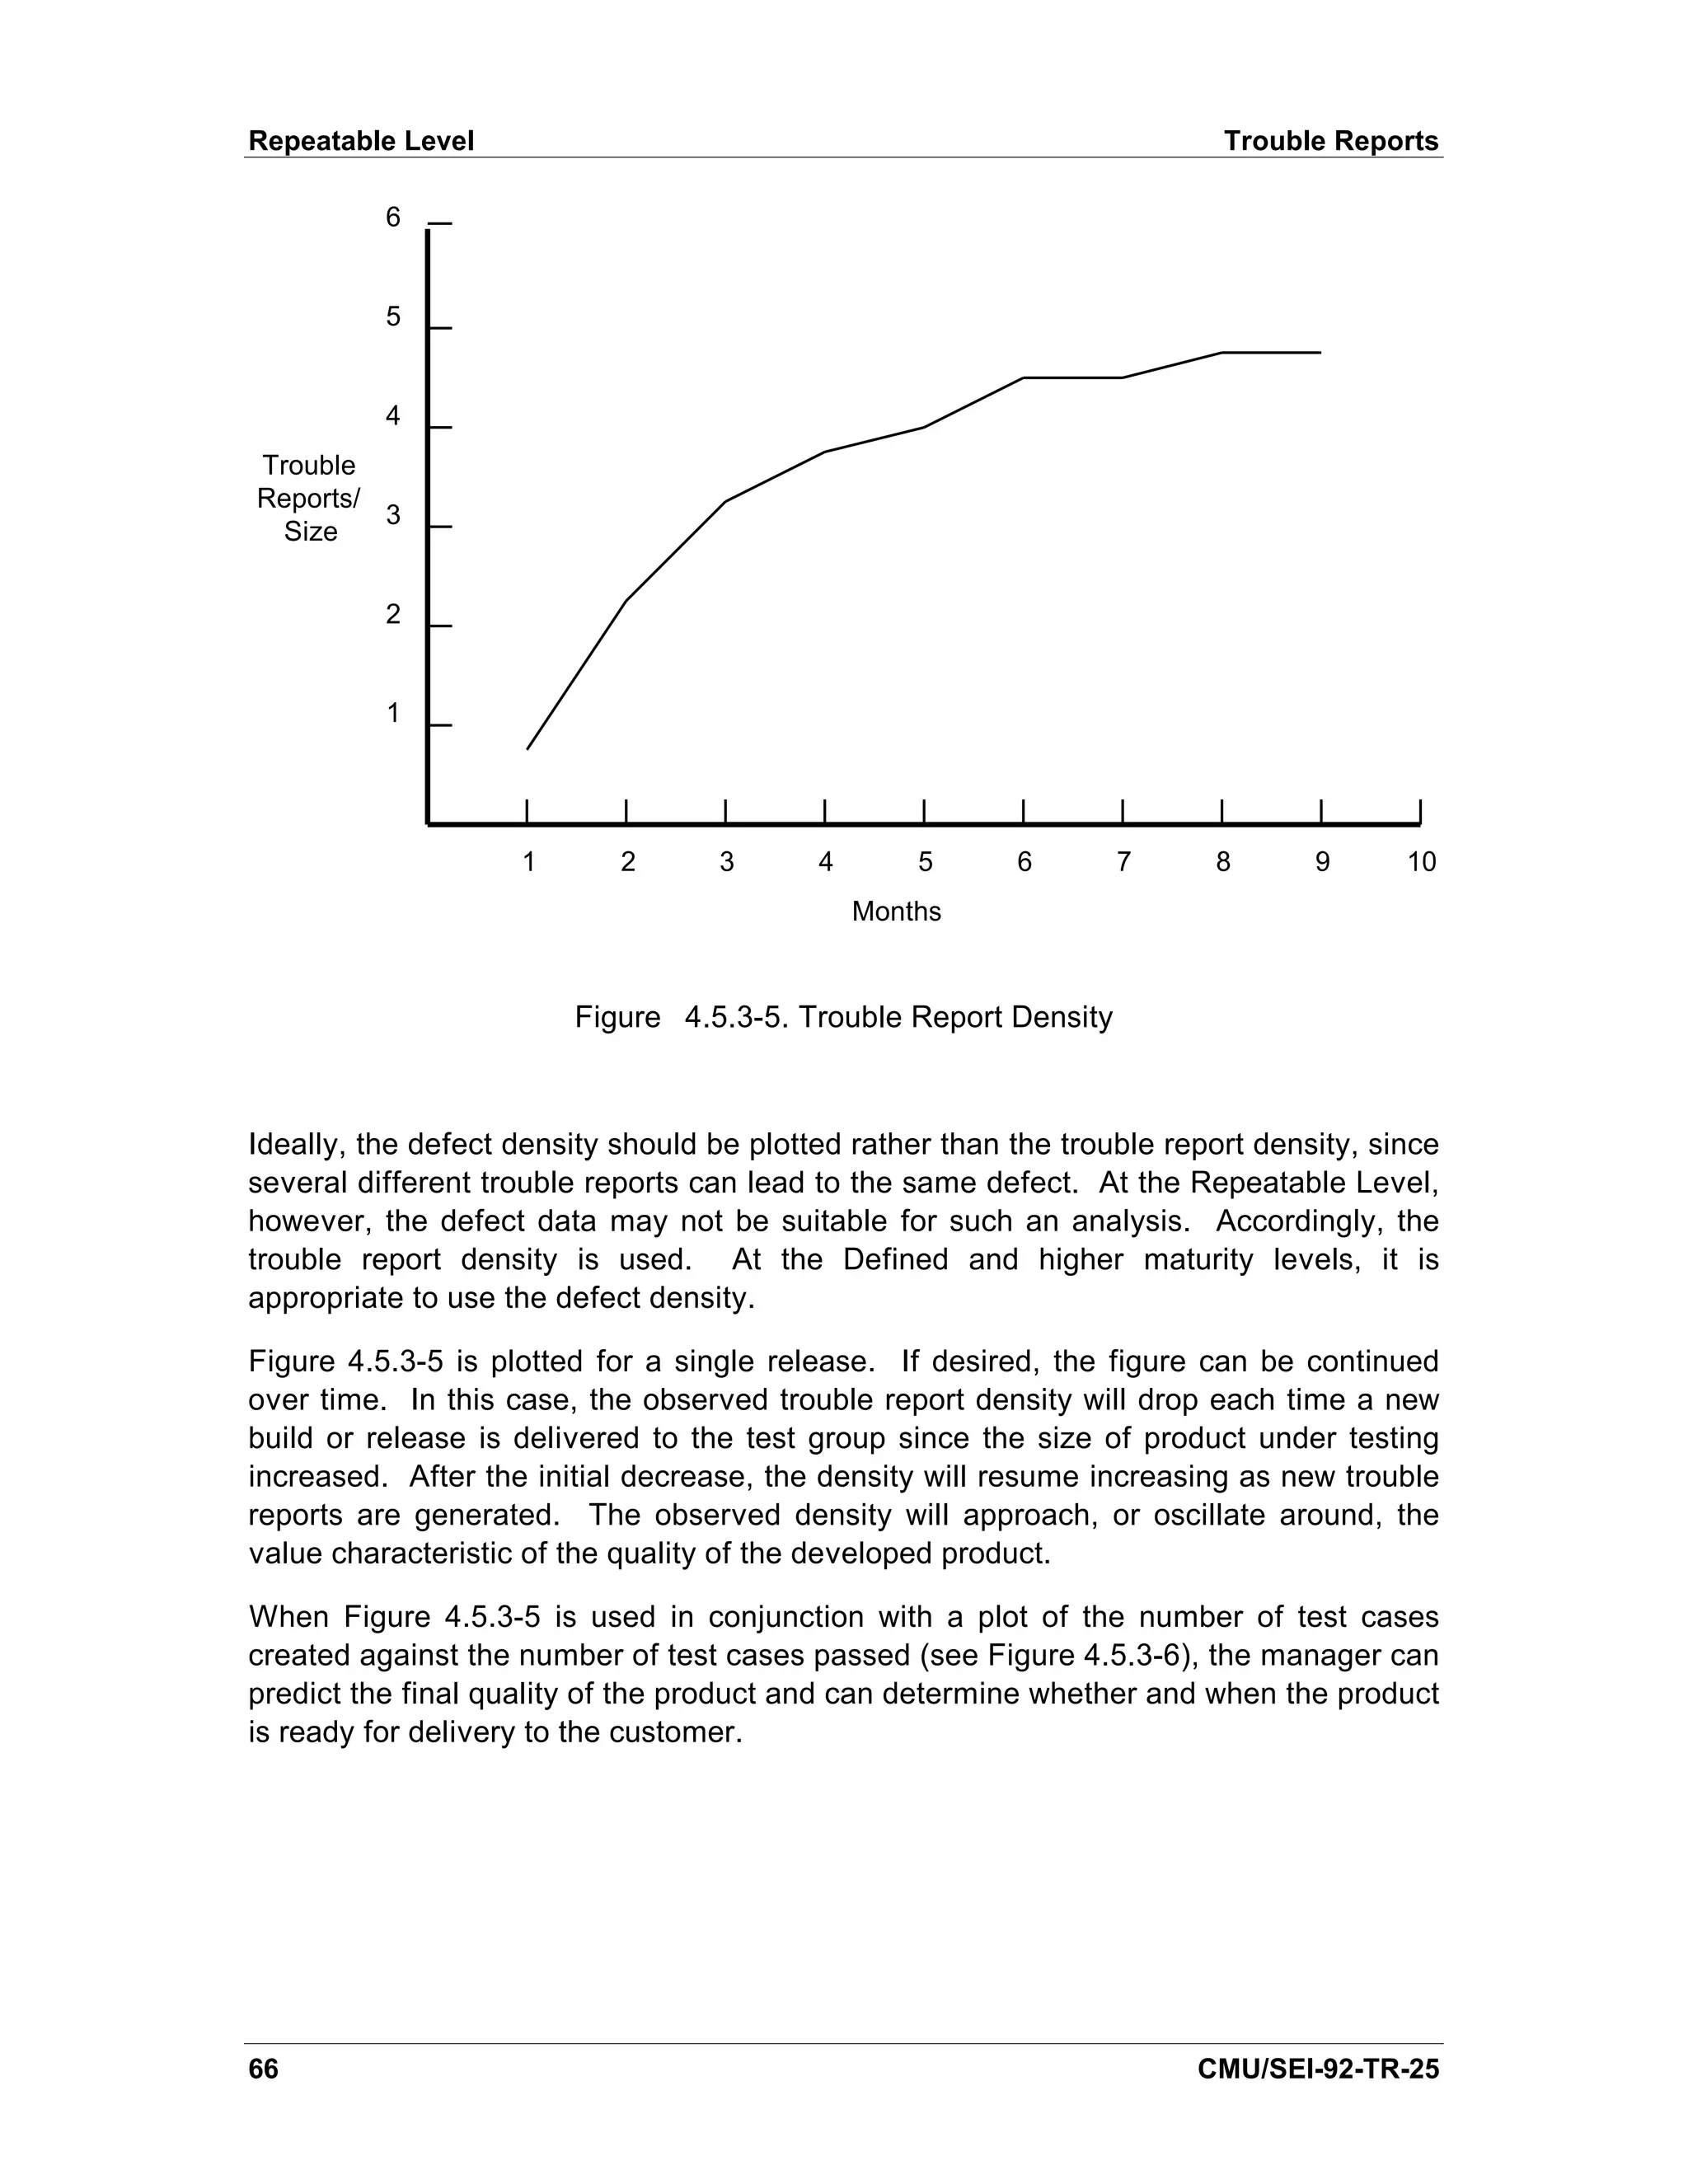
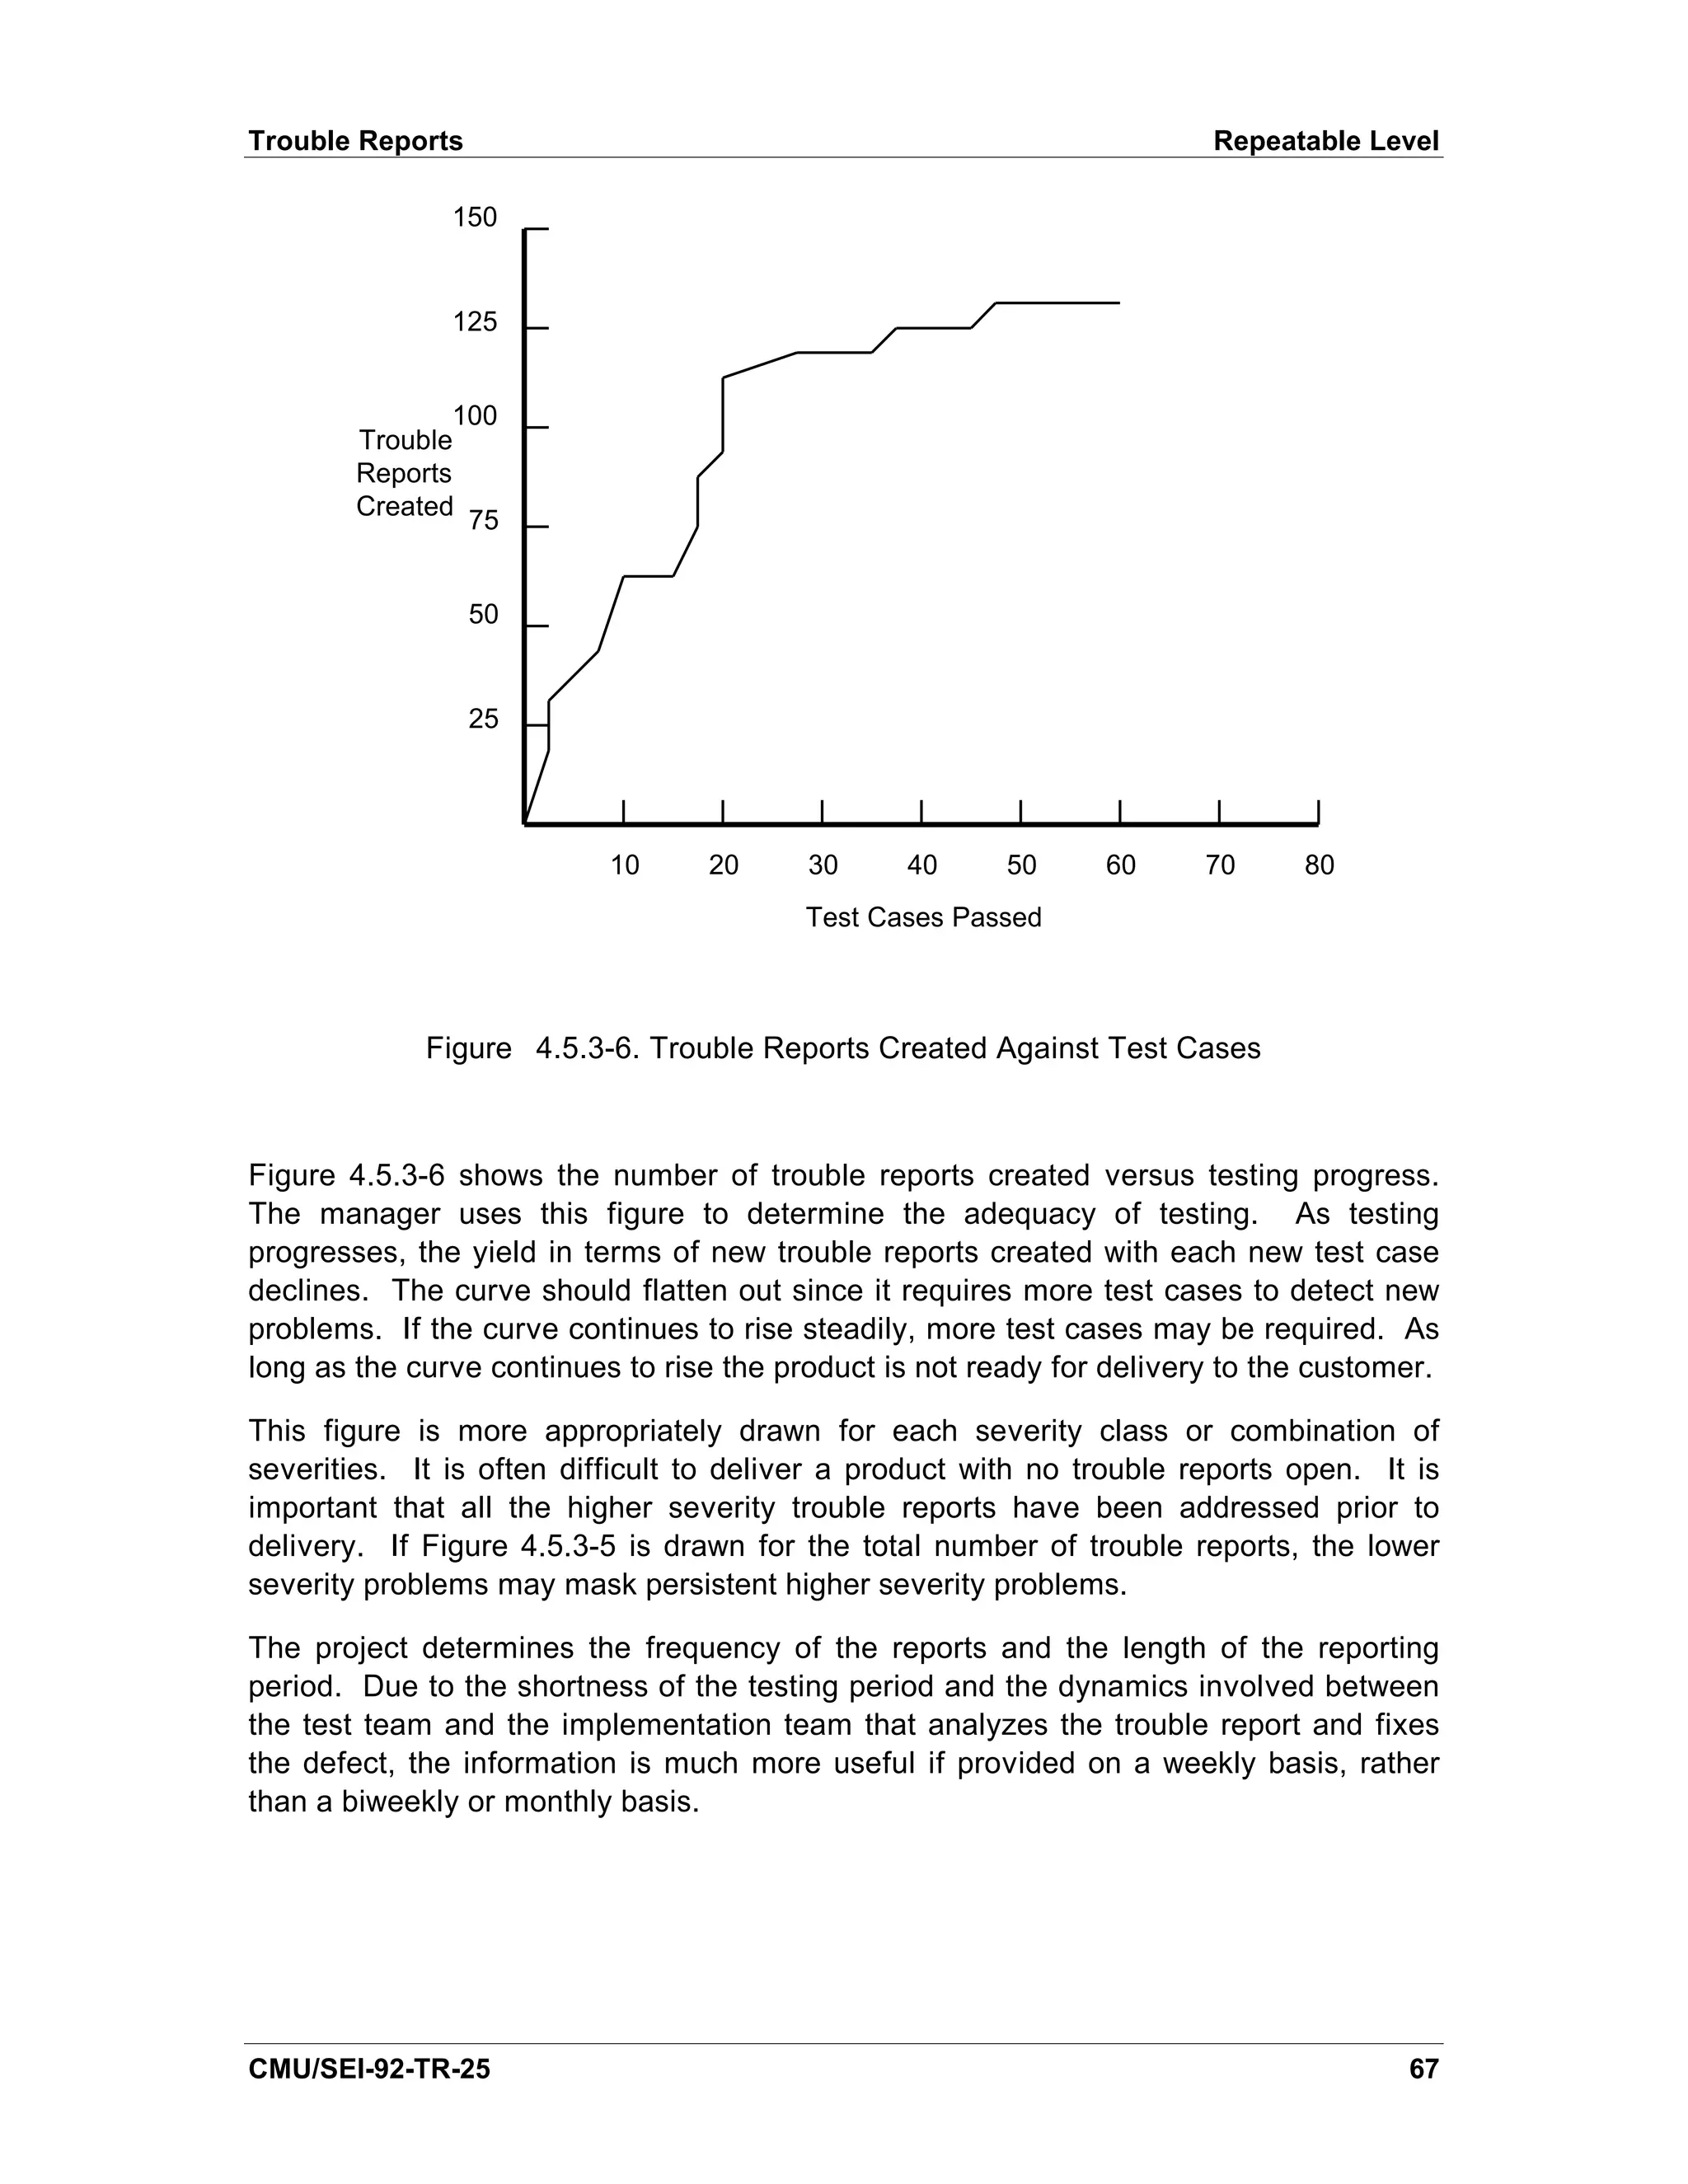
![4.5.3. Trouble Reports
Trouble reports provide an indication of the quality of the product not only by their
number, but also by the rate at which they are written. The number of trouble reports
also reflects the amount of rework. A trouble report is a document (electronic or hard
copy) used to recognize, record, track, and close anomalies detected in the software
and its accompanying documentation. Trouble reports are often referred to as problem
reports, discrepancy reports, anomaly reports, etc. In this document, trouble reports
are restricted to those written during the integration and test, and the acceptance test
activities, that is, those activities conducted after the implementation team turns the
software and its accompanying documentation over to an independent testing team.
Terminology is important in the discussion of problems and defects. In this document,
the following definitions are used:
• A defect is a product’ inconsistency with its specification. Examples include
s
such things as omissions and imperfections found in software during the early
life-cycle phases and faults in software that is sufficiently mature for test or
operation.
• An error is a human action that produces an incorrect result [IEEE 610].
• A fault is an incorrect step, process, or data definition in a computer program
[IEEE 610]. It is synonymous with bug.
• A failure is the inability of a system or component to perform its required
functions within specified performance requirements [IEEE 610].
• A problem is an unsettled question arising from a situation where it appears that
a change to the software, its documentation, or related hardware is necessary
for successful test or operation of the system [IEEE P1044].
Objective of the Trouble Reports Indicators
To provide software managers with insight into the quality of the product, the software
reliability, and the effectiveness of testing.
Indicators
• Trends in the following:
- Number, type, and severity of the trouble reports
- Trouble report density, that is, the number of trouble reports per unit size
- Rate at which trouble reports are being addressed
• Relationship between the number of trouble reports and the number of test
cases passed
CMU/SEI-92-TR-25 59](https://image.slidesharecdn.com/softwaremeasuresandthecapabilitymaturitymodel-1992johnh-baumertsei-110103031855-phpapp02/75/Software-measures-and-the-capability-maturity-model-1992-john-h-baumert-sei-77-2048.jpg)
![Repeatable Level Trouble Reports
Sources
[AFSC 87], [Buckley 90], [Card 90], [Decker 91], [Grady 87], [IEEE 1061], [Landis 90],
[Pfleeger 89], and [Rozum 92] discuss trouble reports.
[Florac 92] has a thorough discussion of trouble reports and serves as the main source
of information for this section.
68 CMU/SEI-92-TR-25](https://image.slidesharecdn.com/softwaremeasuresandthecapabilitymaturitymodel-1992johnh-baumertsei-110103031855-phpapp02/75/Software-measures-and-the-capability-maturity-model-1992-john-h-baumert-sei-86-2048.jpg)
![4.6. Stability
At the Repeatable Level the stability indicators concentrate on the stability of the
requirements and the size. Requirements stability is concerned with the number of
changes to the requirements and the amount of information that still needs to be
determined with regard to the requirements. Size stability is concerned with the stability
of code size and size estimates.
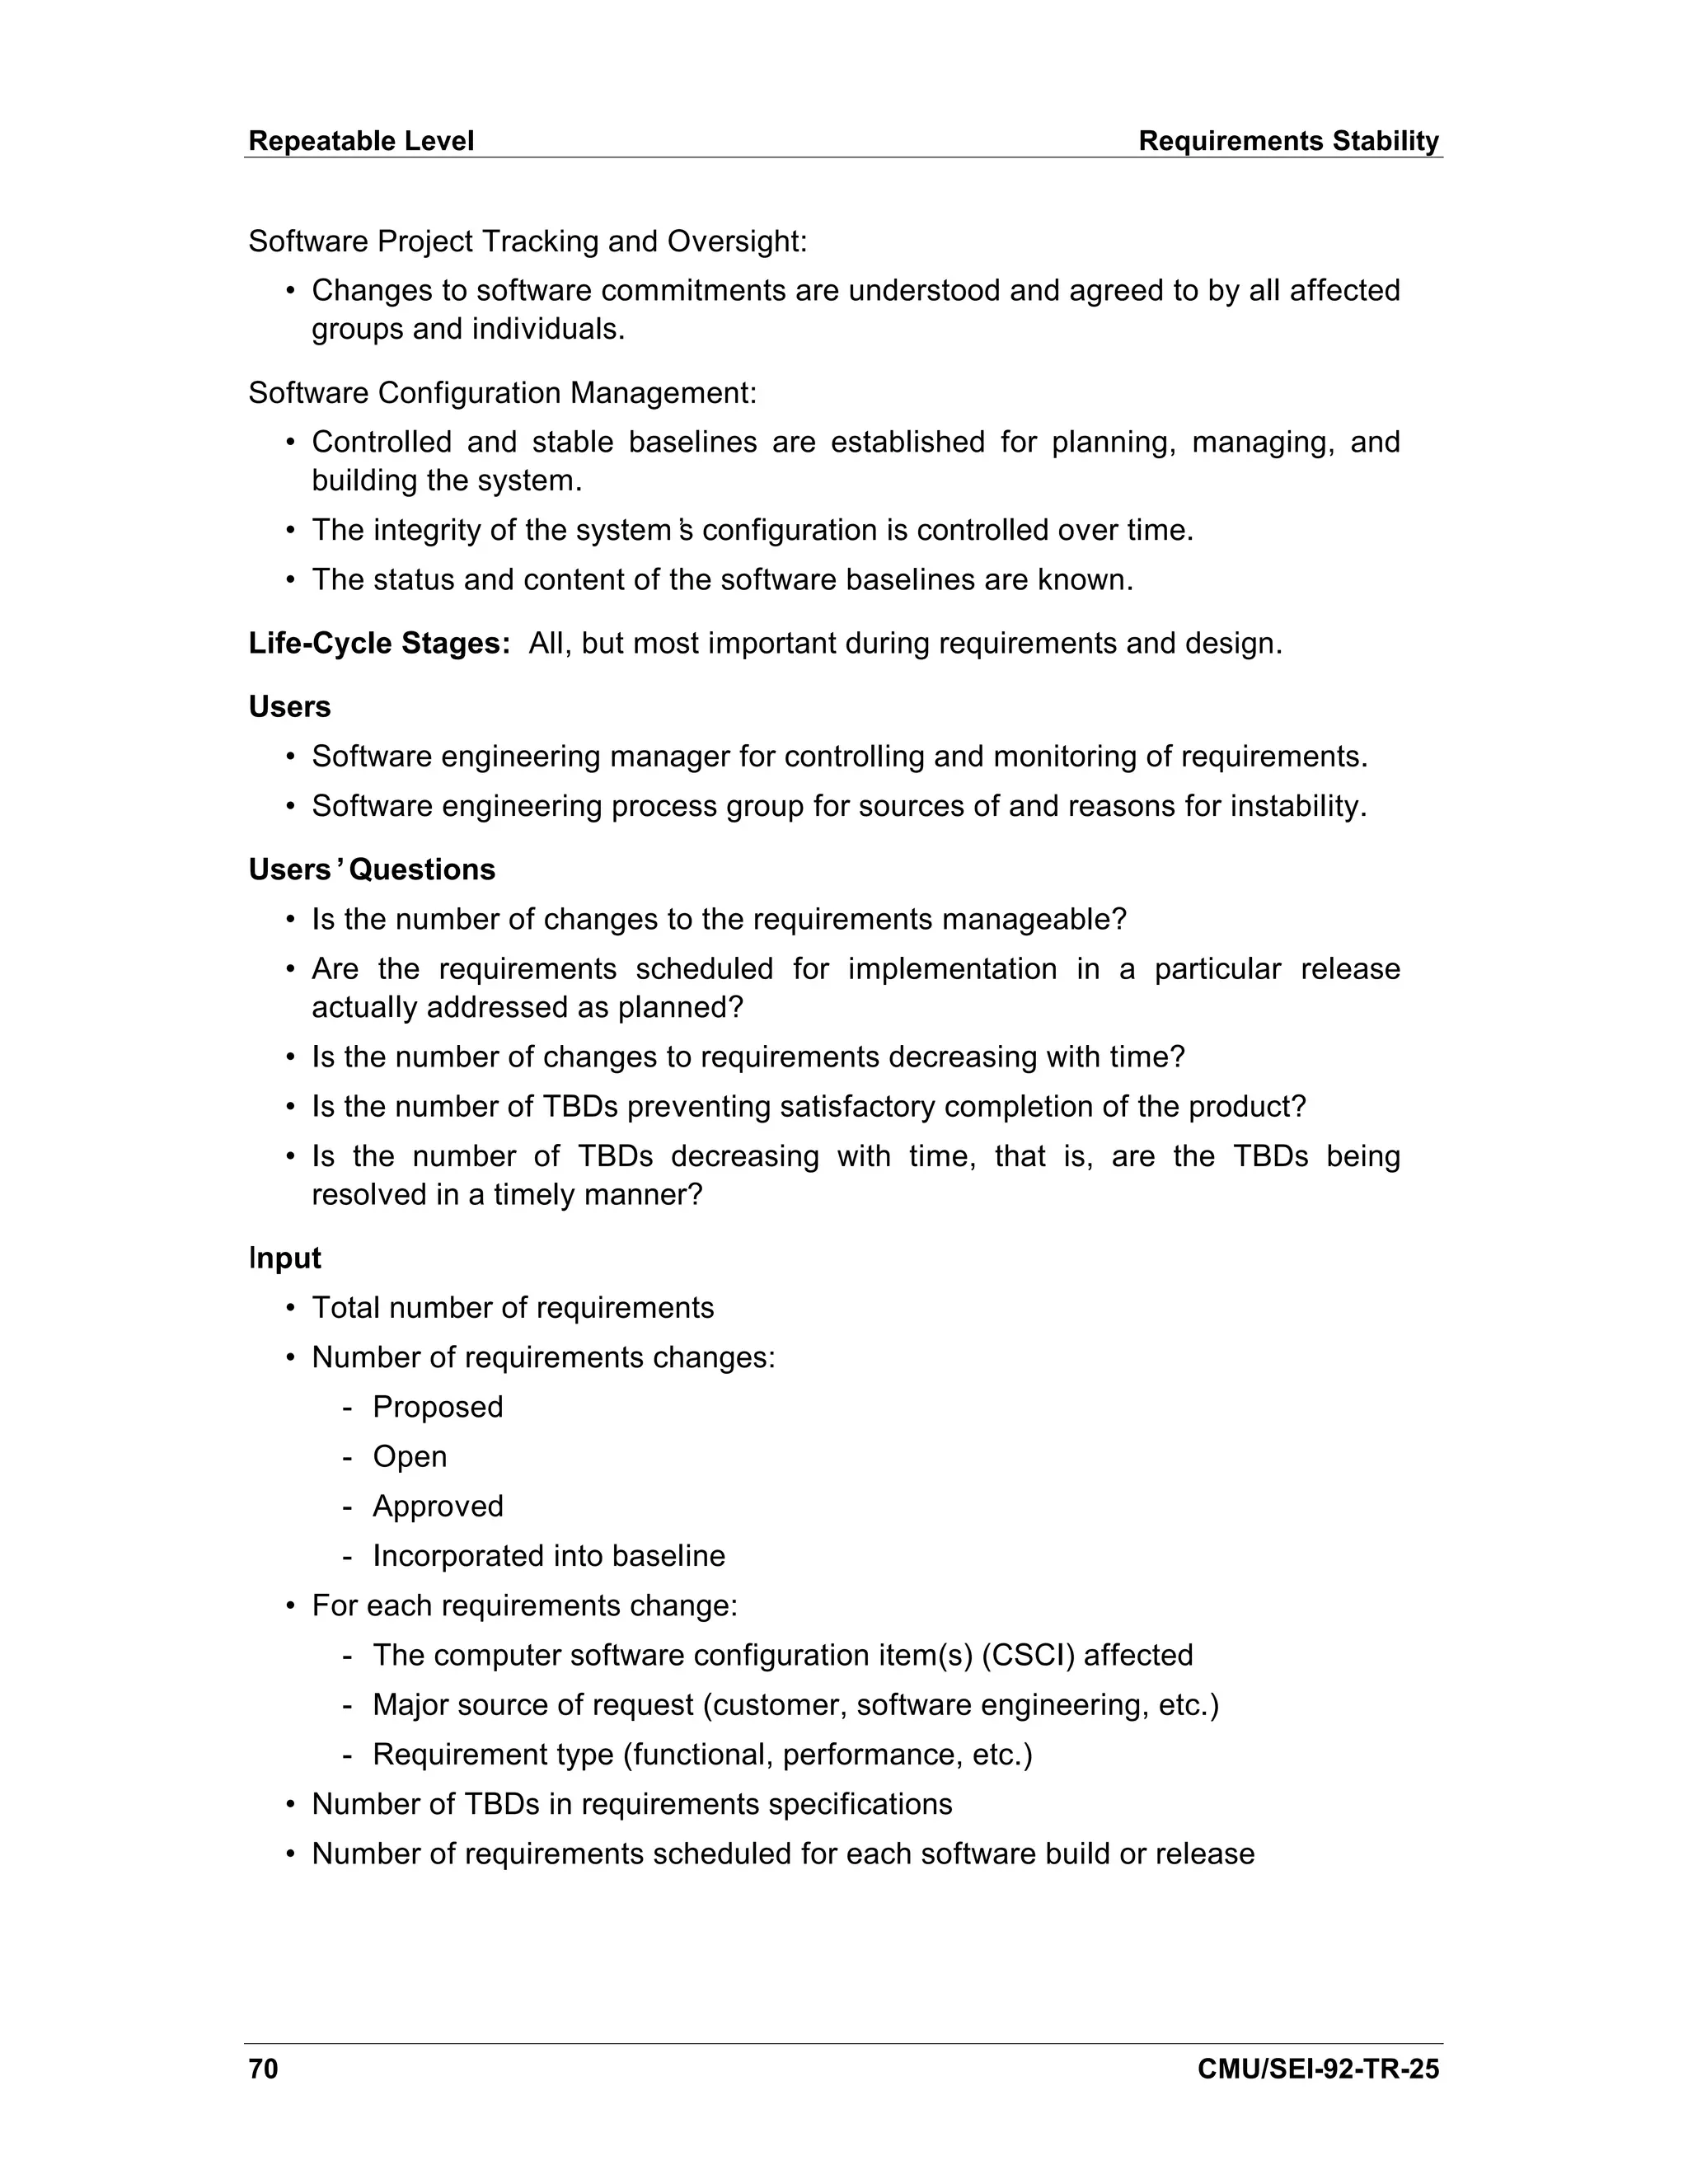
4.6.1. Requirements Stability
The lack of requirements stability can lead to poor product quality, increased project
cost, and/or lengthened project schedule. The requirements stability indicators consist
of trend charts that show the total number of requirements, the cumulative number of
changes, and the number of to-be-determineds (TBDs) over time.1 Landis et al report
that a large number of TBDs in the requirements and specifications, combined with a
large number of requirements changes, have caused systems in their environment to
grow up to forty percent larger than size estimates made at preliminary design review
[Landis 90].
Objective of the Requirements Stability Indicators
To provide the software manager with visibility into whether requirements changes are
responsible for cost overruns, schedule delays, and decreased product quality.
Indicators
• Trends in the total number of requirements changes
• Trends in the number of TBDs
Key Process Area Goals Addressed
Requirements Management:
• The system requirements allocated to software provide a clearly stated,
verifiable, and testable foundation for software engineering and software
management.
• The allocated requirements define the scope of the software effort.
• The allocated requirements and changes to the allocated requirements are
incorporated into the software plans, products, and activities in an orderly
manner.
1The organization must have a definition for what constitutes a unit of requirements such as a
numbered paragraph containing the word “shall.”
CMU/SEI-92-TR-25 69](https://image.slidesharecdn.com/softwaremeasuresandthecapabilitymaturitymodel-1992johnh-baumertsei-110103031855-phpapp02/75/Software-measures-and-the-capability-maturity-model-1992-john-h-baumert-sei-87-2048.jpg)
![Repeatable Level Requirements Stability
600
Original Plan
Current Estimate
500
Release 3
400
Requirements Release 2A
300
Release 2
200
Release 1 Now
100
1 2 3 4 5 6 7 8 9 10
Months
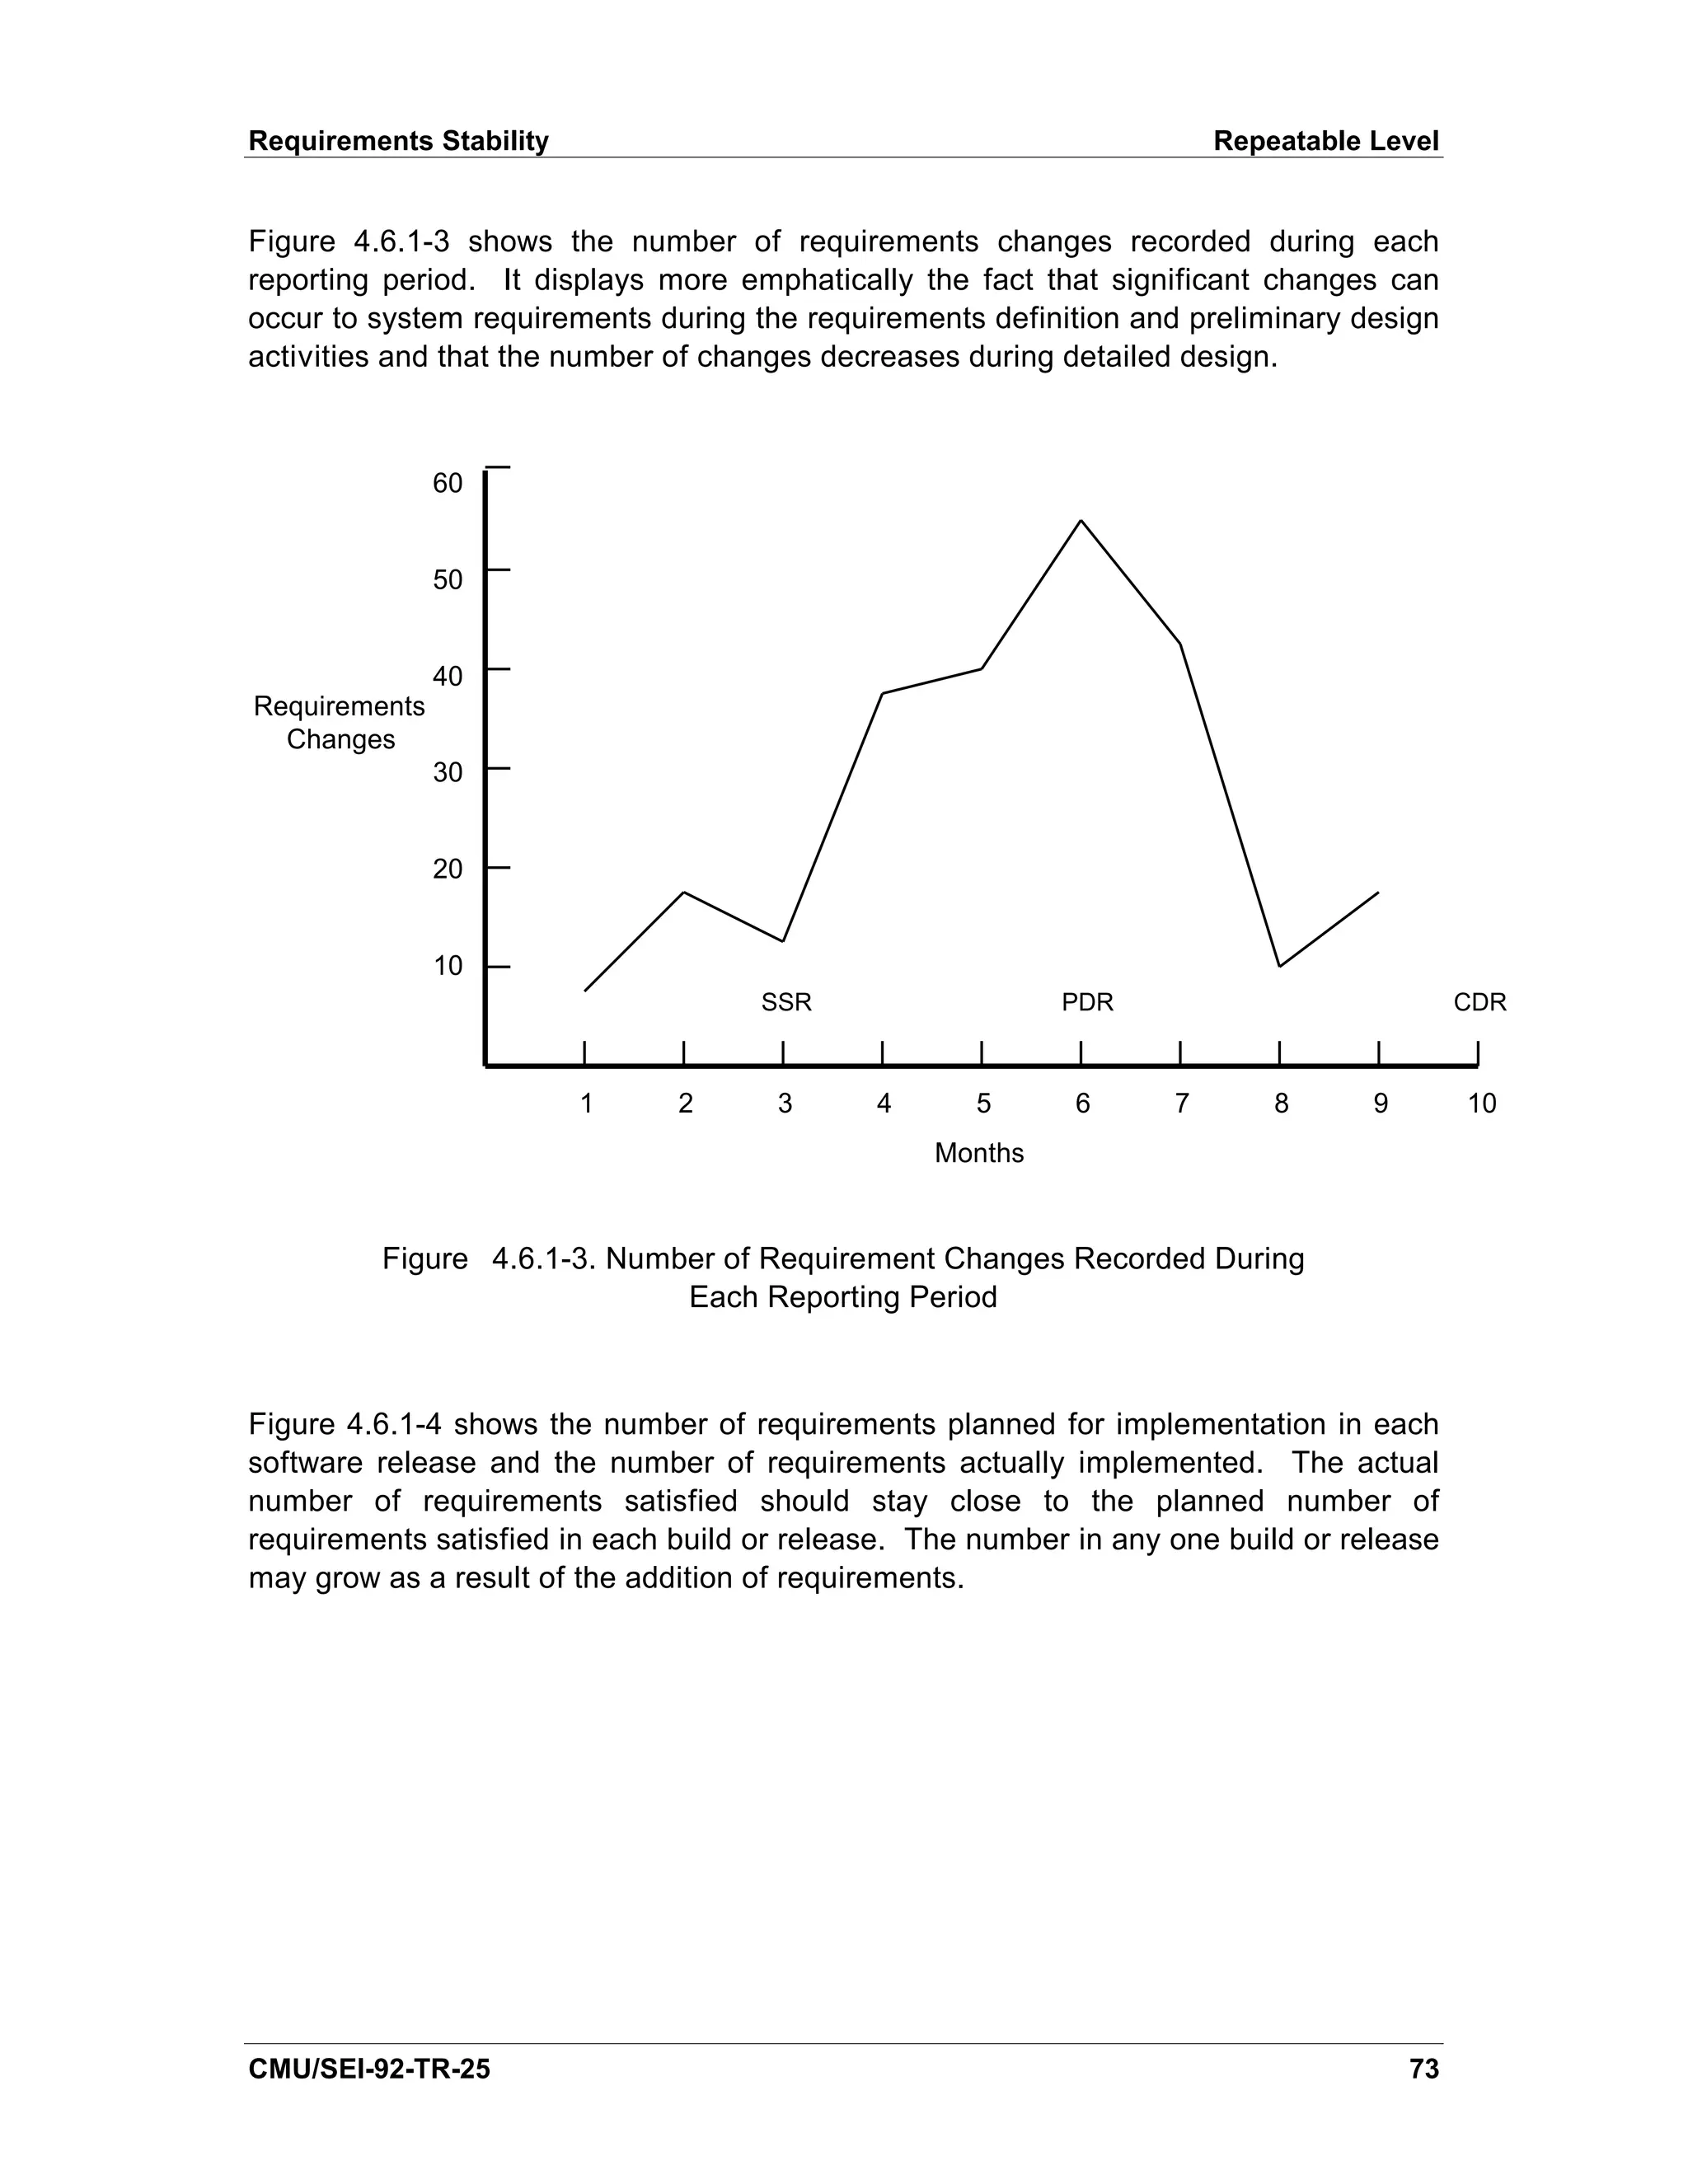
Figure 4.6.1-4. Number of Requirements per Release
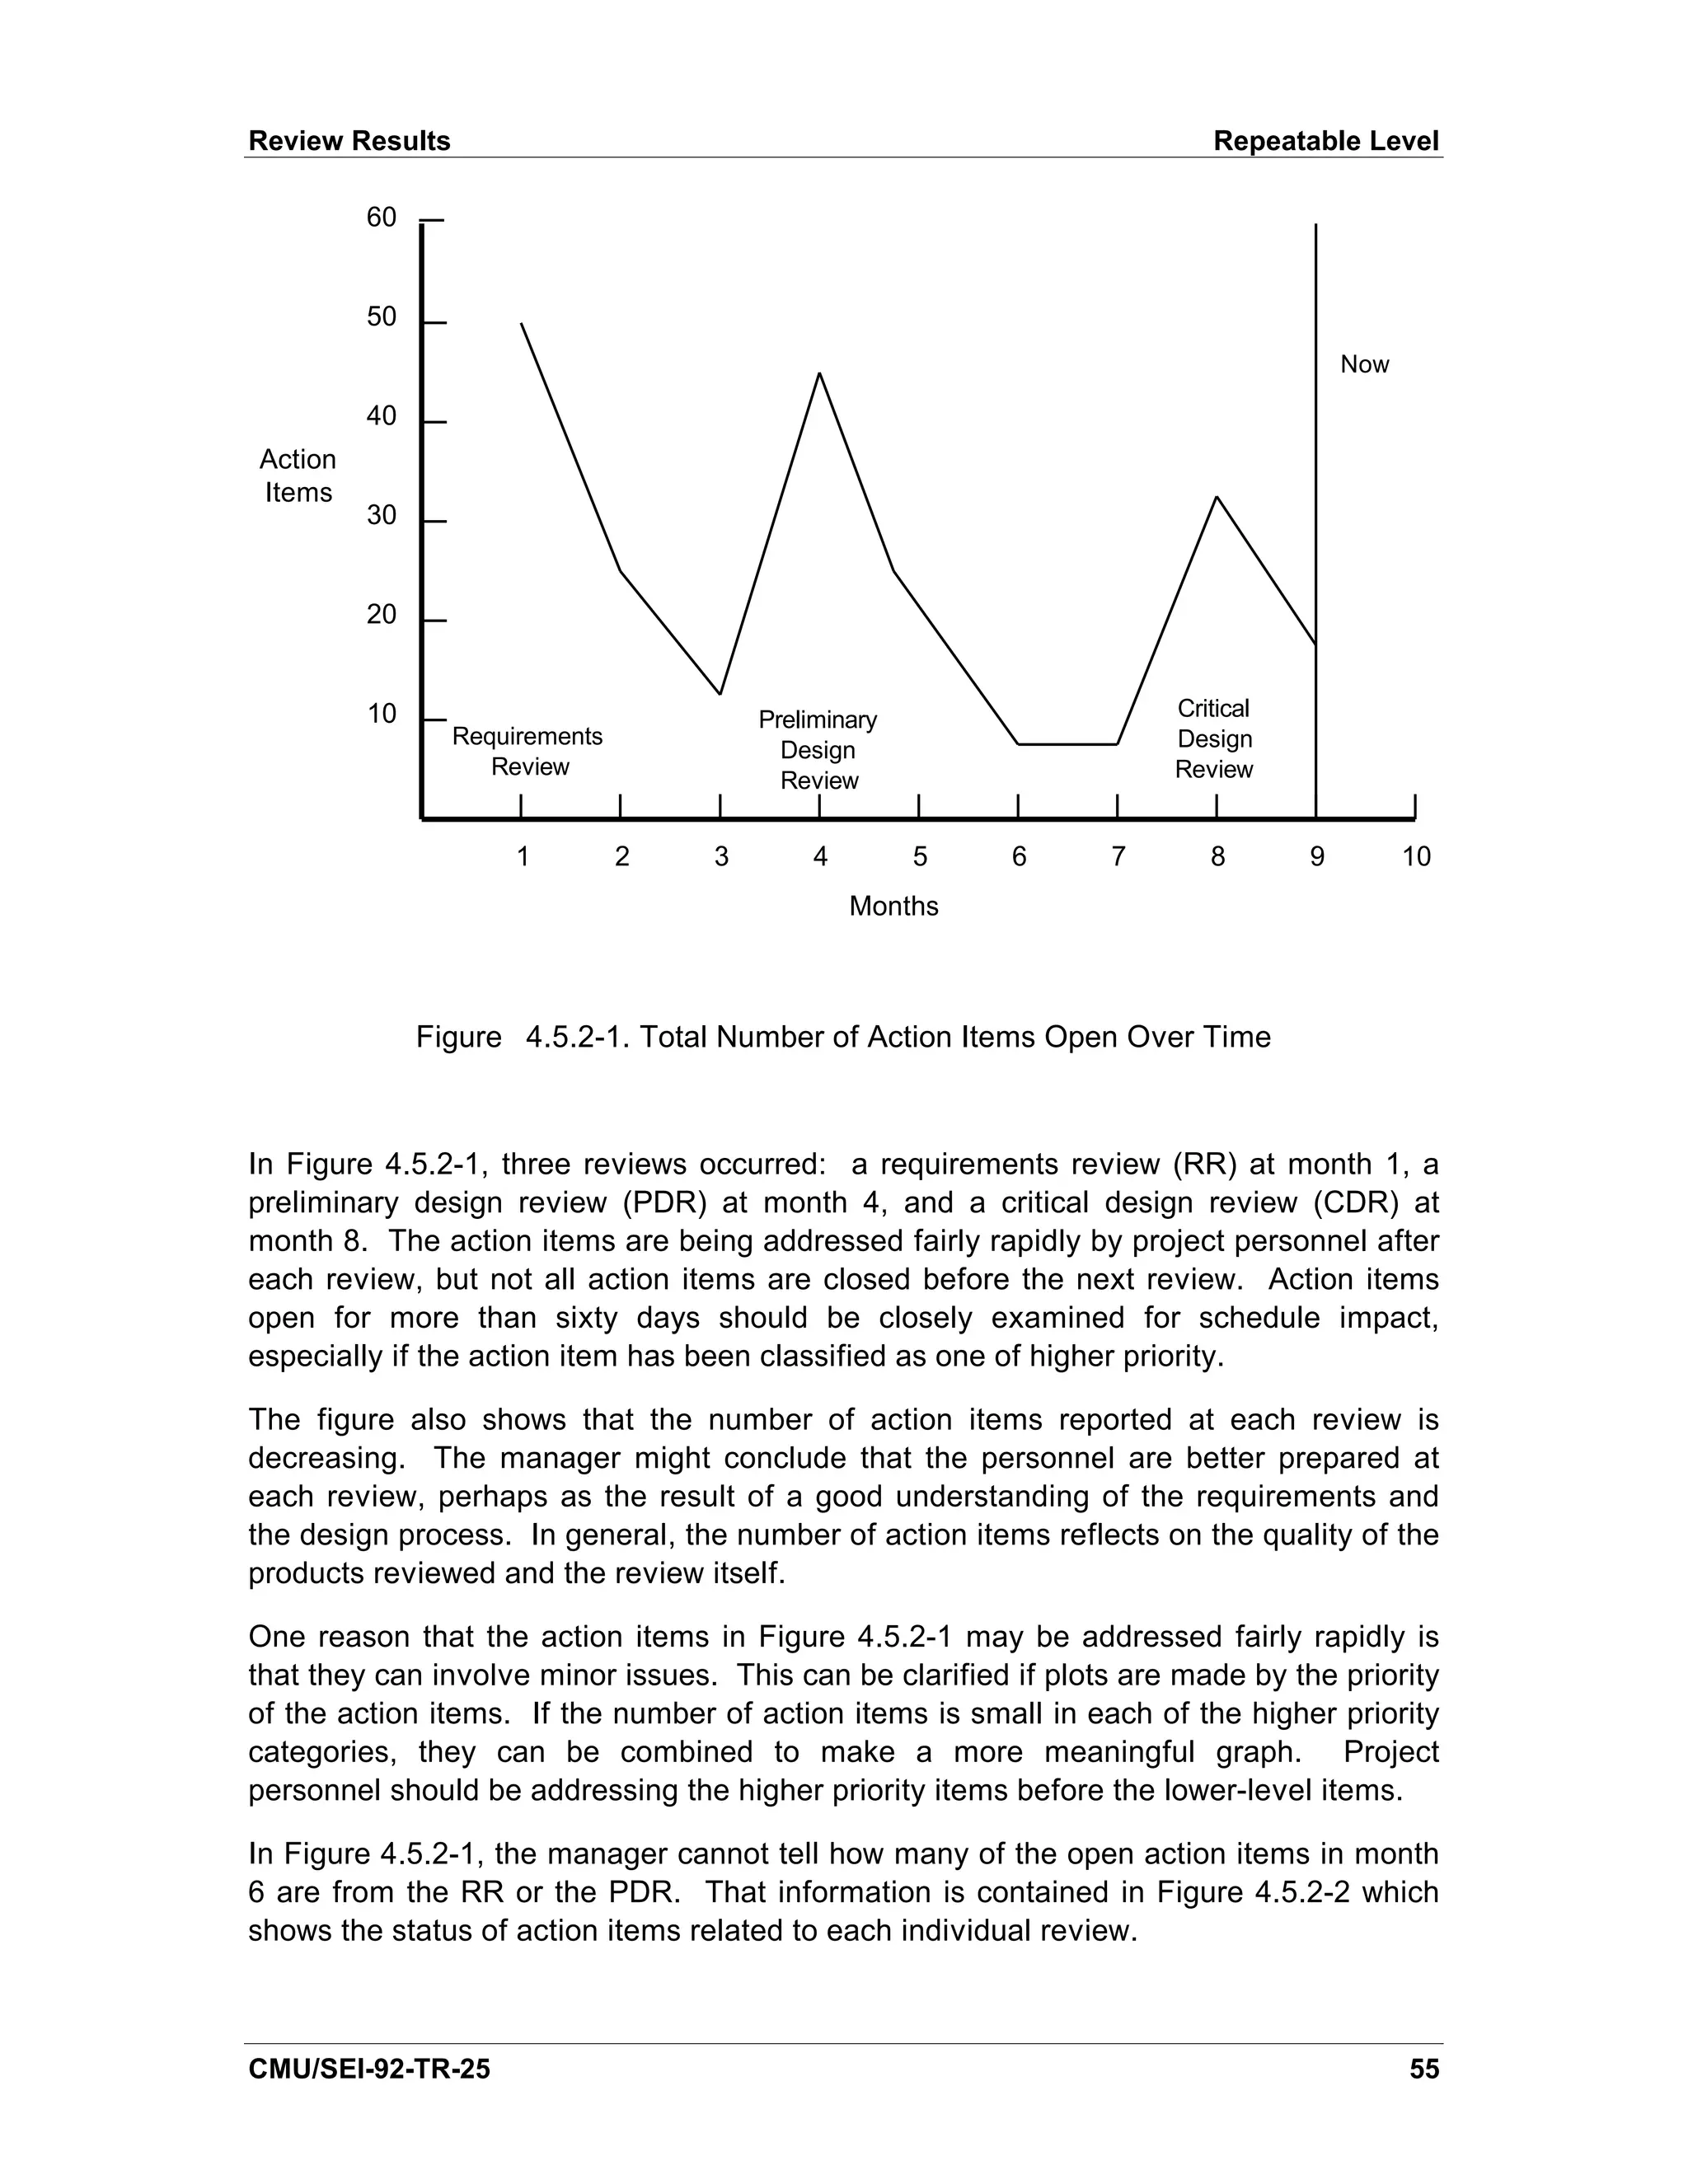
The project shown in the figure may be experiencing schedule trouble. The number of
requirements satisfied in the first release did not match the plan, and the same trend
has occurred for the second release. The project planned on satisfying these
requirements in release 2A but, again, the project is not meeting its goals. The number
of requirements for release 3 is increasing, but past history indicates a schedule
slippage for the project.
Sources
[AFSC 86] has a similar indicator that uses software size.
[Decker 91], [Pfleeger 89], and [Schultz 88] discuss requirements stability.
[Grady 87] uses a requirements stability as an input to Hewlett-Packard’ difficulty
s
metric.
[Landis 90] discusses two indicators that are related to this but uses software size in
the trend chart.
74 CMU/SEI-92-TR-25](https://image.slidesharecdn.com/softwaremeasuresandthecapabilitymaturitymodel-1992johnh-baumertsei-110103031855-phpapp02/75/Software-measures-and-the-capability-maturity-model-1992-john-h-baumert-sei-92-2048.jpg)
![4.6.2. Size Stability
Size is an important input in the planning process. The project software manager
needs a good estimate of the size of the software to derive accurate estimates of the
effort, cost, and schedule of the project. Changes in the size ripple through the project
with effects on effort, cost, and schedule.
The project software manager selects from the approved organizational methods the
technique to be used by the project for determining size. There are many units of
measure for software size, for example, source lines of code, delivered source
instructions, function points, objects, or tokens. While this document makes no
recommendation on how to determine size (examples of counting lines of code are
given by Park [Park 92]), it does describe how to interpret trends in the size measure.
Objective of the Size Stability Indicators
To provide the project software manager and the project manager with an indication of
the completeness and stability of the requirements and of the capability of the
implementation staff to produce the software product within the current budget and
schedule.
Indicators
• Trends in the code size
• The variation of actual software size from size estimates
• Variation of actual software size from estimated size by build or release
Key Process Area Goals Addressed
Software Project Planning:
• All affected groups and individuals understand the software estimates and plans
and commit to support them.
• The software estimates and plans are documented for use in tracking the
software activities and commitments.
Software Project Tracking and Oversight:
• Actual results and performance of the software project are tracked against
documented and approved plans.
• Corrective actions are taken when the actual results and performance of the
software project deviate significantly from the plans.
• Changes to software commitments are understood and agreed to by all affected
groups and individuals.
Software Subcontract Management:
• The software standards, procedures, and product requirements for the
subcontractor comply with the prime contractor’ commitments.
s
CMU/SEI-92-TR-25 75](https://image.slidesharecdn.com/softwaremeasuresandthecapabilitymaturitymodel-1992johnh-baumertsei-110103031855-phpapp02/75/Software-measures-and-the-capability-maturity-model-1992-john-h-baumert-sei-93-2048.jpg)
![Size Stability Repeatable Level
Size Total
New
Reused
SSR PDR CDR TRR PCA
1 2 3 4 5 6 7 8 9 10
Months
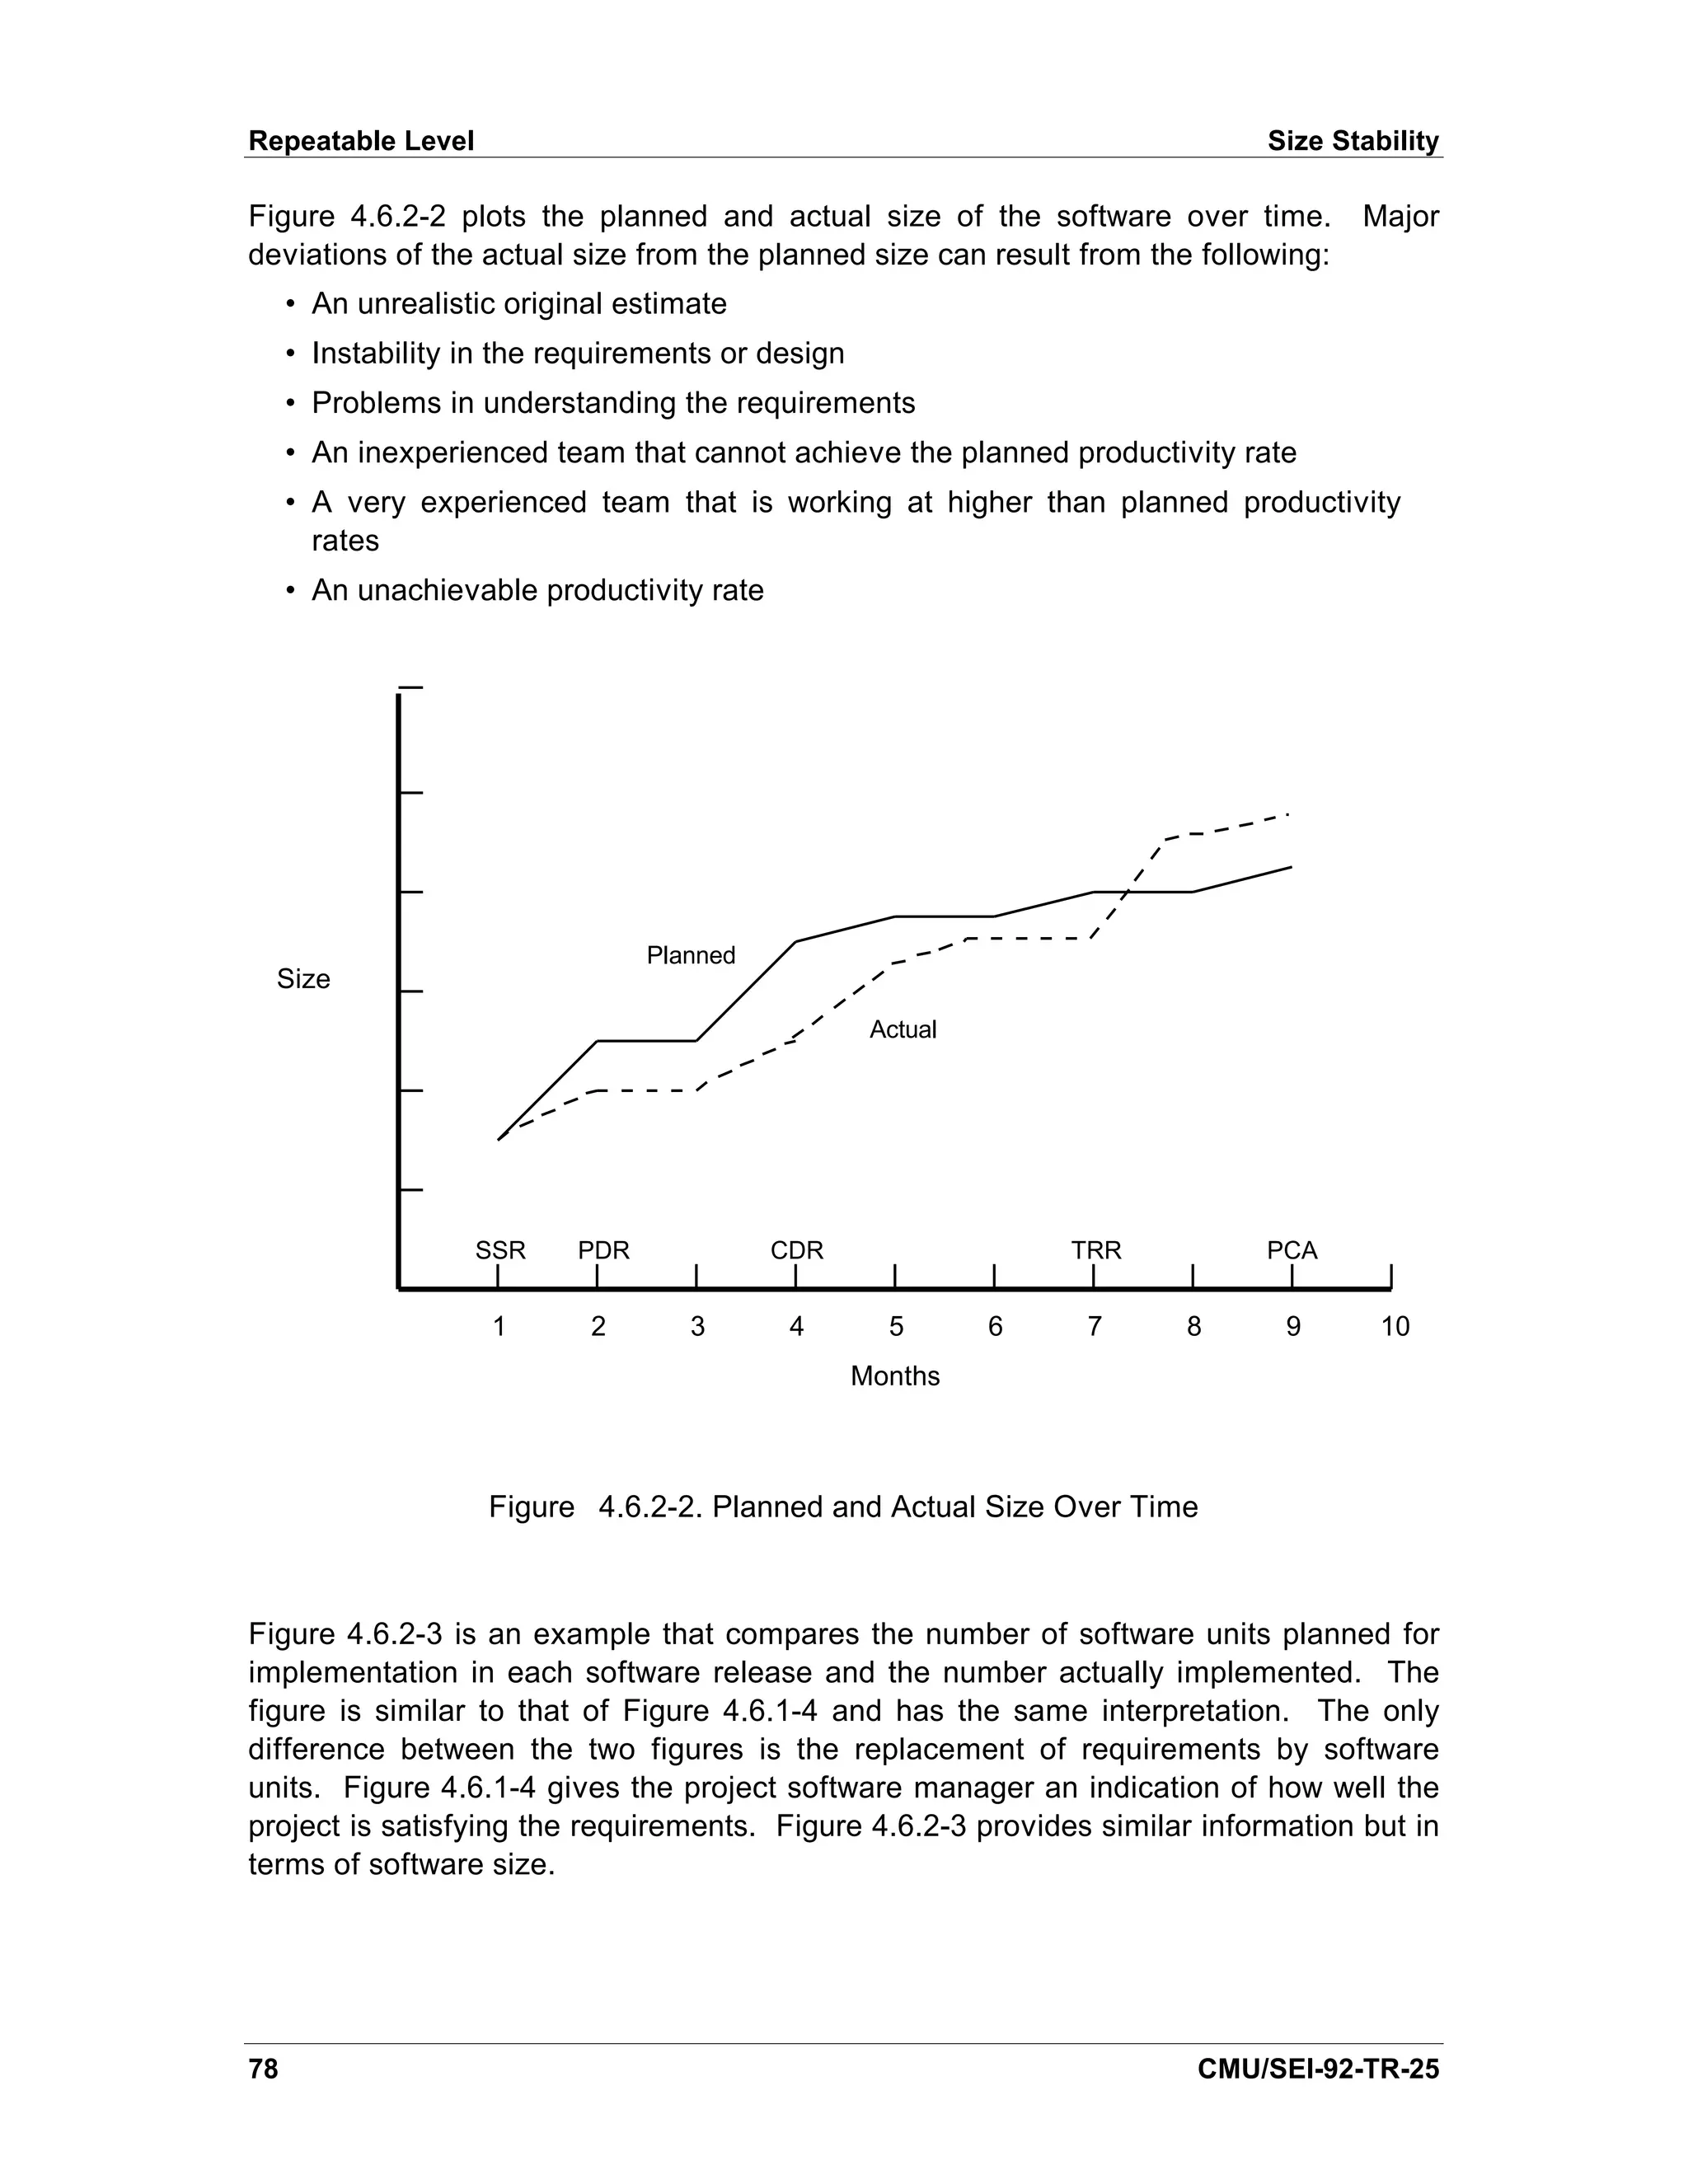
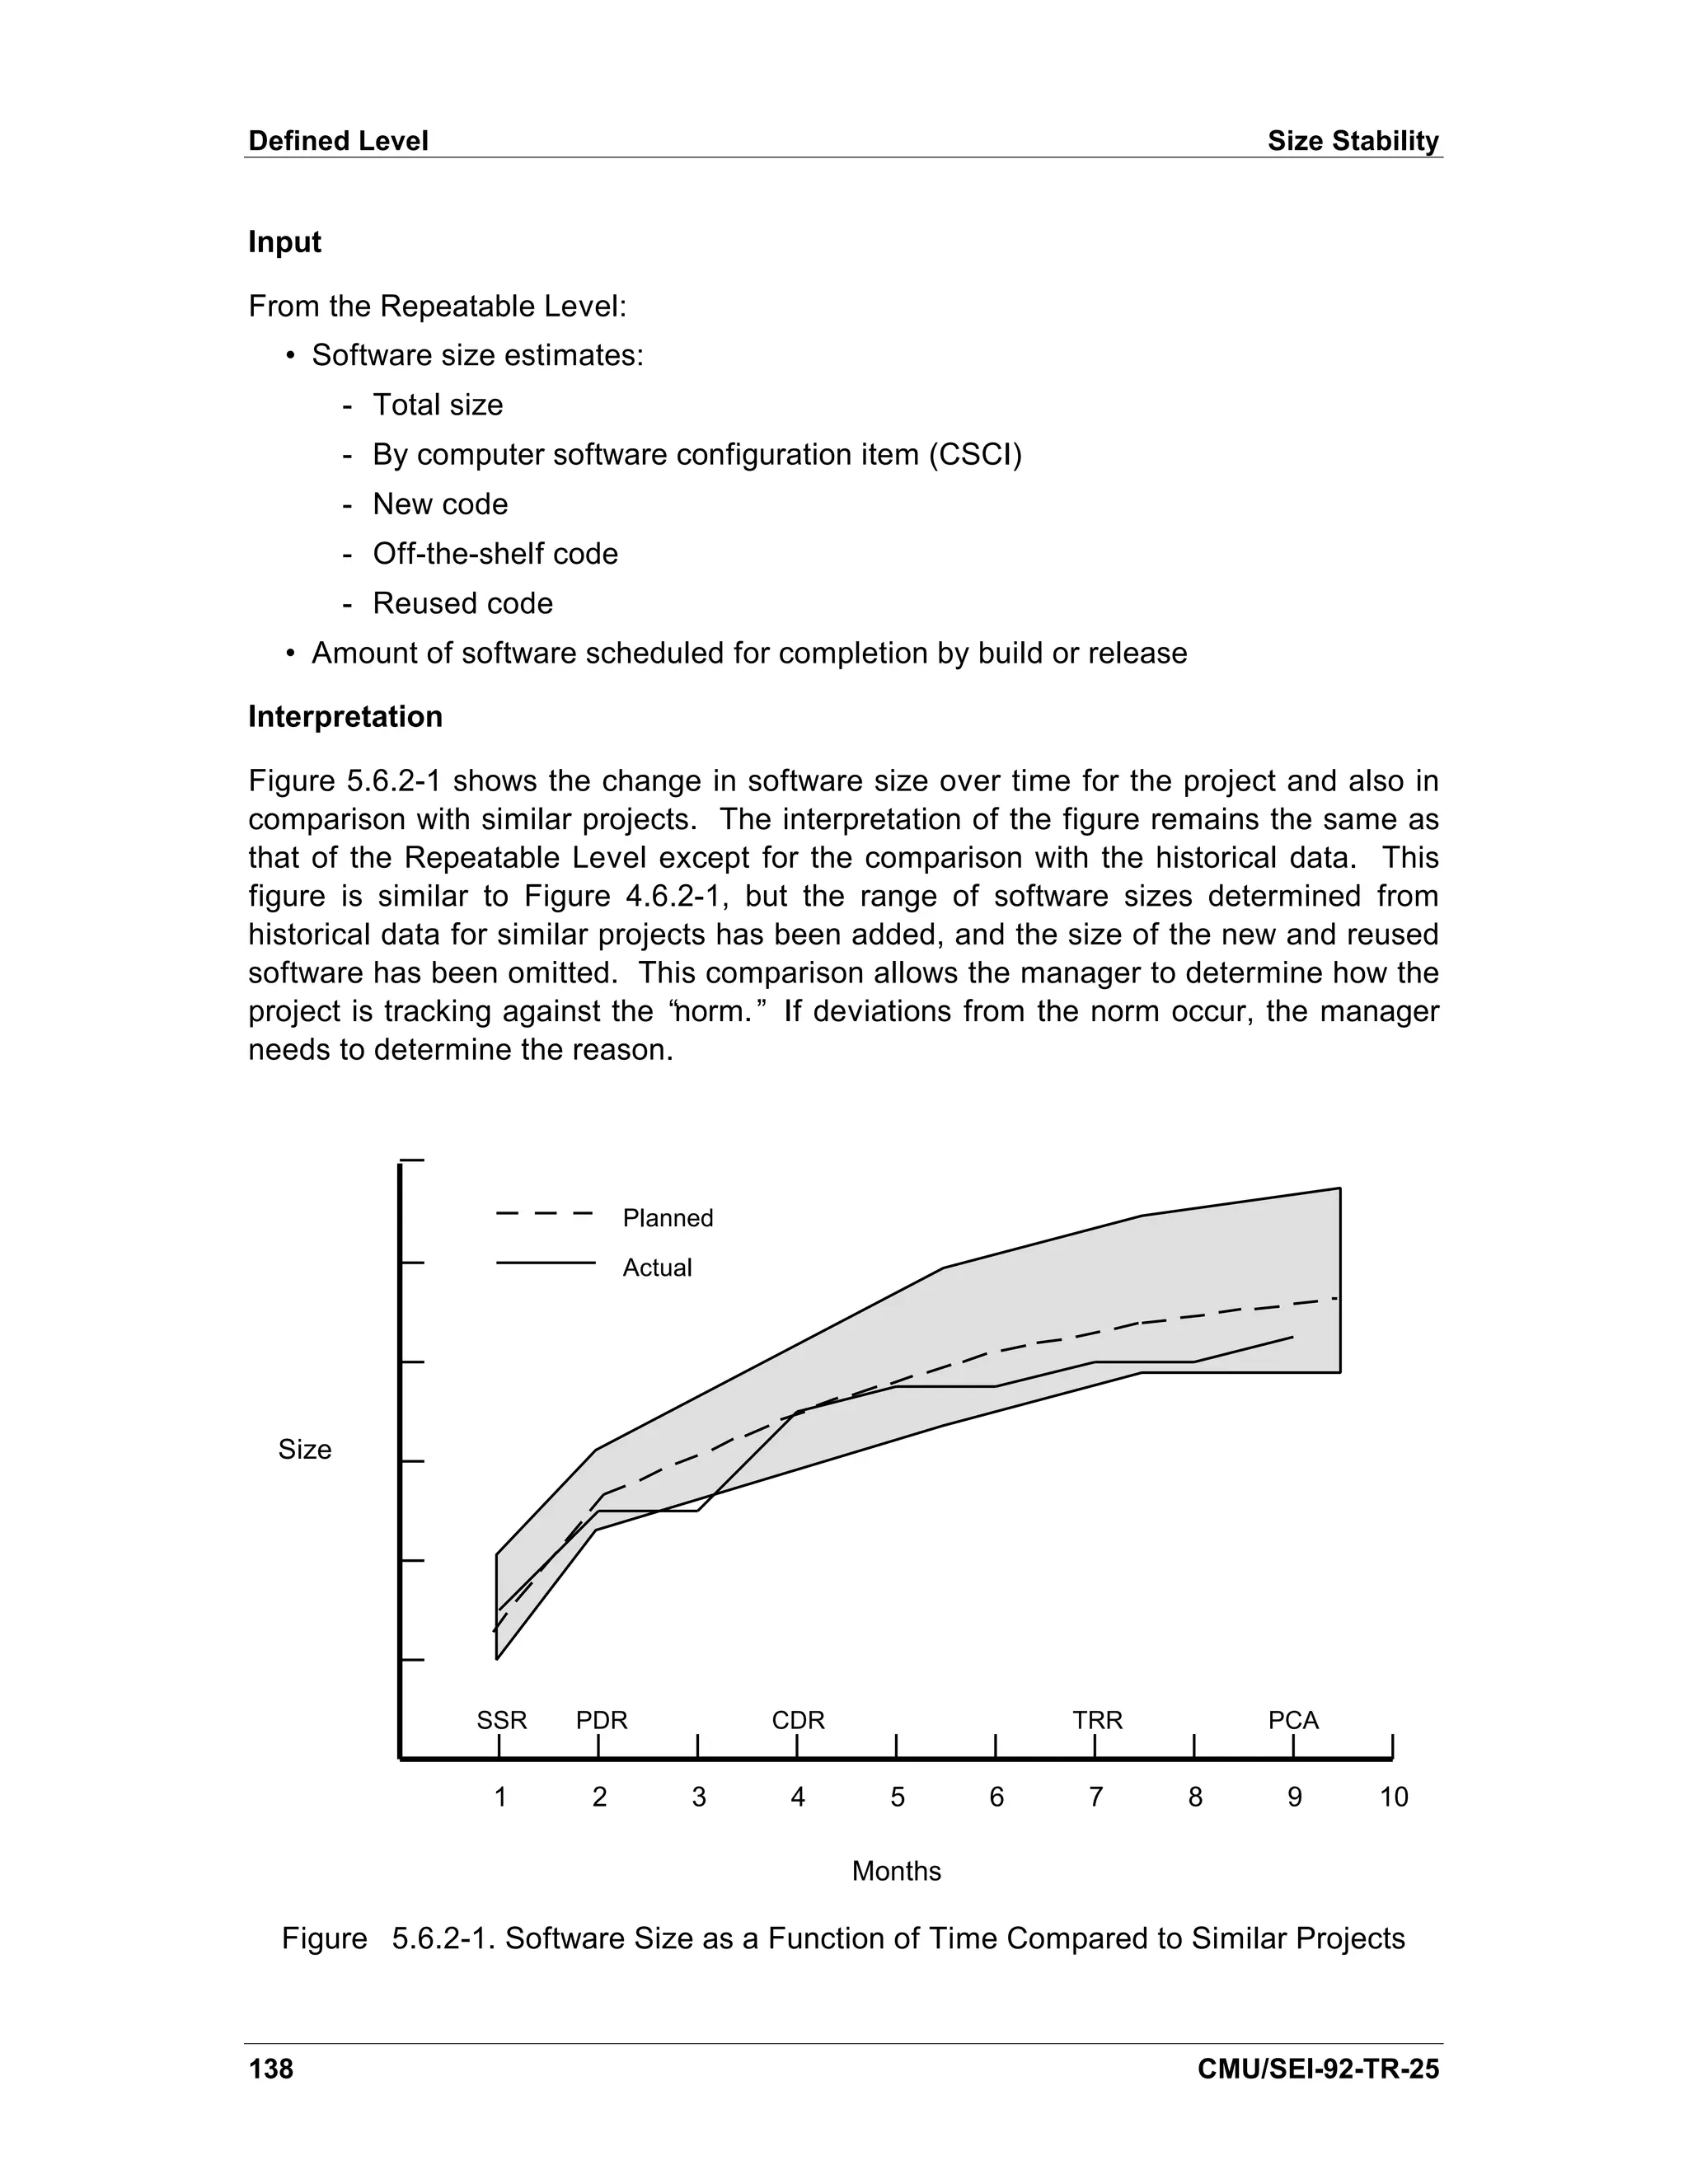
Figure 4.6.2-1. Software Size as a Function of Time
If the project is monitoring size with lines of code, the software manager should be
aware of the following experiences when analyzing a figure like Figure 4.6.2-1 [Landis
90]:
• There will be periods of sharp growth in lines of code that are separated by
periods of more moderate growth.
• Ten percent of the code may be produced after testing starts due to
requirements changes.
• A steady growth of software size from approximately the midpoint of
implementation through acceptance testing can occur due to response to
trouble reports.
• Exaggerated flat spots on the curve (i.e., periods with no change) or large
jumps in the curve (many changes made at the same time) indicate the need for
an analysis to determine why there is no activity or why there is a sudden
increase in size.
• Changes can result from a better understanding of the requirements. These
changes should also be reflected in schedule and staffing. This implies that this
indicator can be used in conjunction with effort and progress indicators.
Decker mentions that projects are not likely to deliver fewer lines of code than initially
estimated unless a major descoping of the project occurs [Decker 91].
CMU/SEI-92-TR-25 77](https://image.slidesharecdn.com/softwaremeasuresandthecapabilitymaturitymodel-1992johnh-baumertsei-110103031855-phpapp02/75/Software-measures-and-the-capability-maturity-model-1992-john-h-baumert-sei-95-2048.jpg)
![Size Stability Repeatable Level
600 Original Plan
Current Estimate
500
Release 3
400
Release 2A
Software
Units
300 Release 2
200
Release 1 Now
100
1 2 3 4 5 6 7 8 9 10
Months
Figure 4.6.2-3. Computer Software Unit Release Content
Figures 4.6.2-1 through 4.6.2-3 show the data for the entire project. This should also
be done for each CSCI.
Sources
[AFSC 86], [Decker 91], [Landis 90], [Pfleeger 89], and [Schultz 88] all discuss tracking
software size.
CMU/SEI-92-TR-25 79](https://image.slidesharecdn.com/softwaremeasuresandthecapabilitymaturitymodel-1992johnh-baumertsei-110103031855-phpapp02/75/Software-measures-and-the-capability-maturity-model-1992-john-h-baumert-sei-97-2048.jpg)

![Repeatable Level Computer Resource Utilization
Life-Cycle Stages
Computer resource utilization is planned during the requirements activity and reviewed
during the design activity. Resources are monitored from the start of the
implementation activity to the end of the life cycle.
Users
The project software manager reviews consolidated graphs of the significant or high-
risk resources. Lower level managers review detailed graphs of resources for
components under their control (e.g., memory used by a computer software
configuration item [CSCI]).
Users’Questions
• Are the actual values of the computer resources within the allowable limits?
• Do the trends of the actuals indicate that the computer resources will remain
within the allowable limits?
• Should more computer resources be acquired?
Input
System or software requirements and design that contain specifications or estimations
of the maximum allowable2 resource utilization for:
• Computer memory
• I/O throughput
• I/O channels
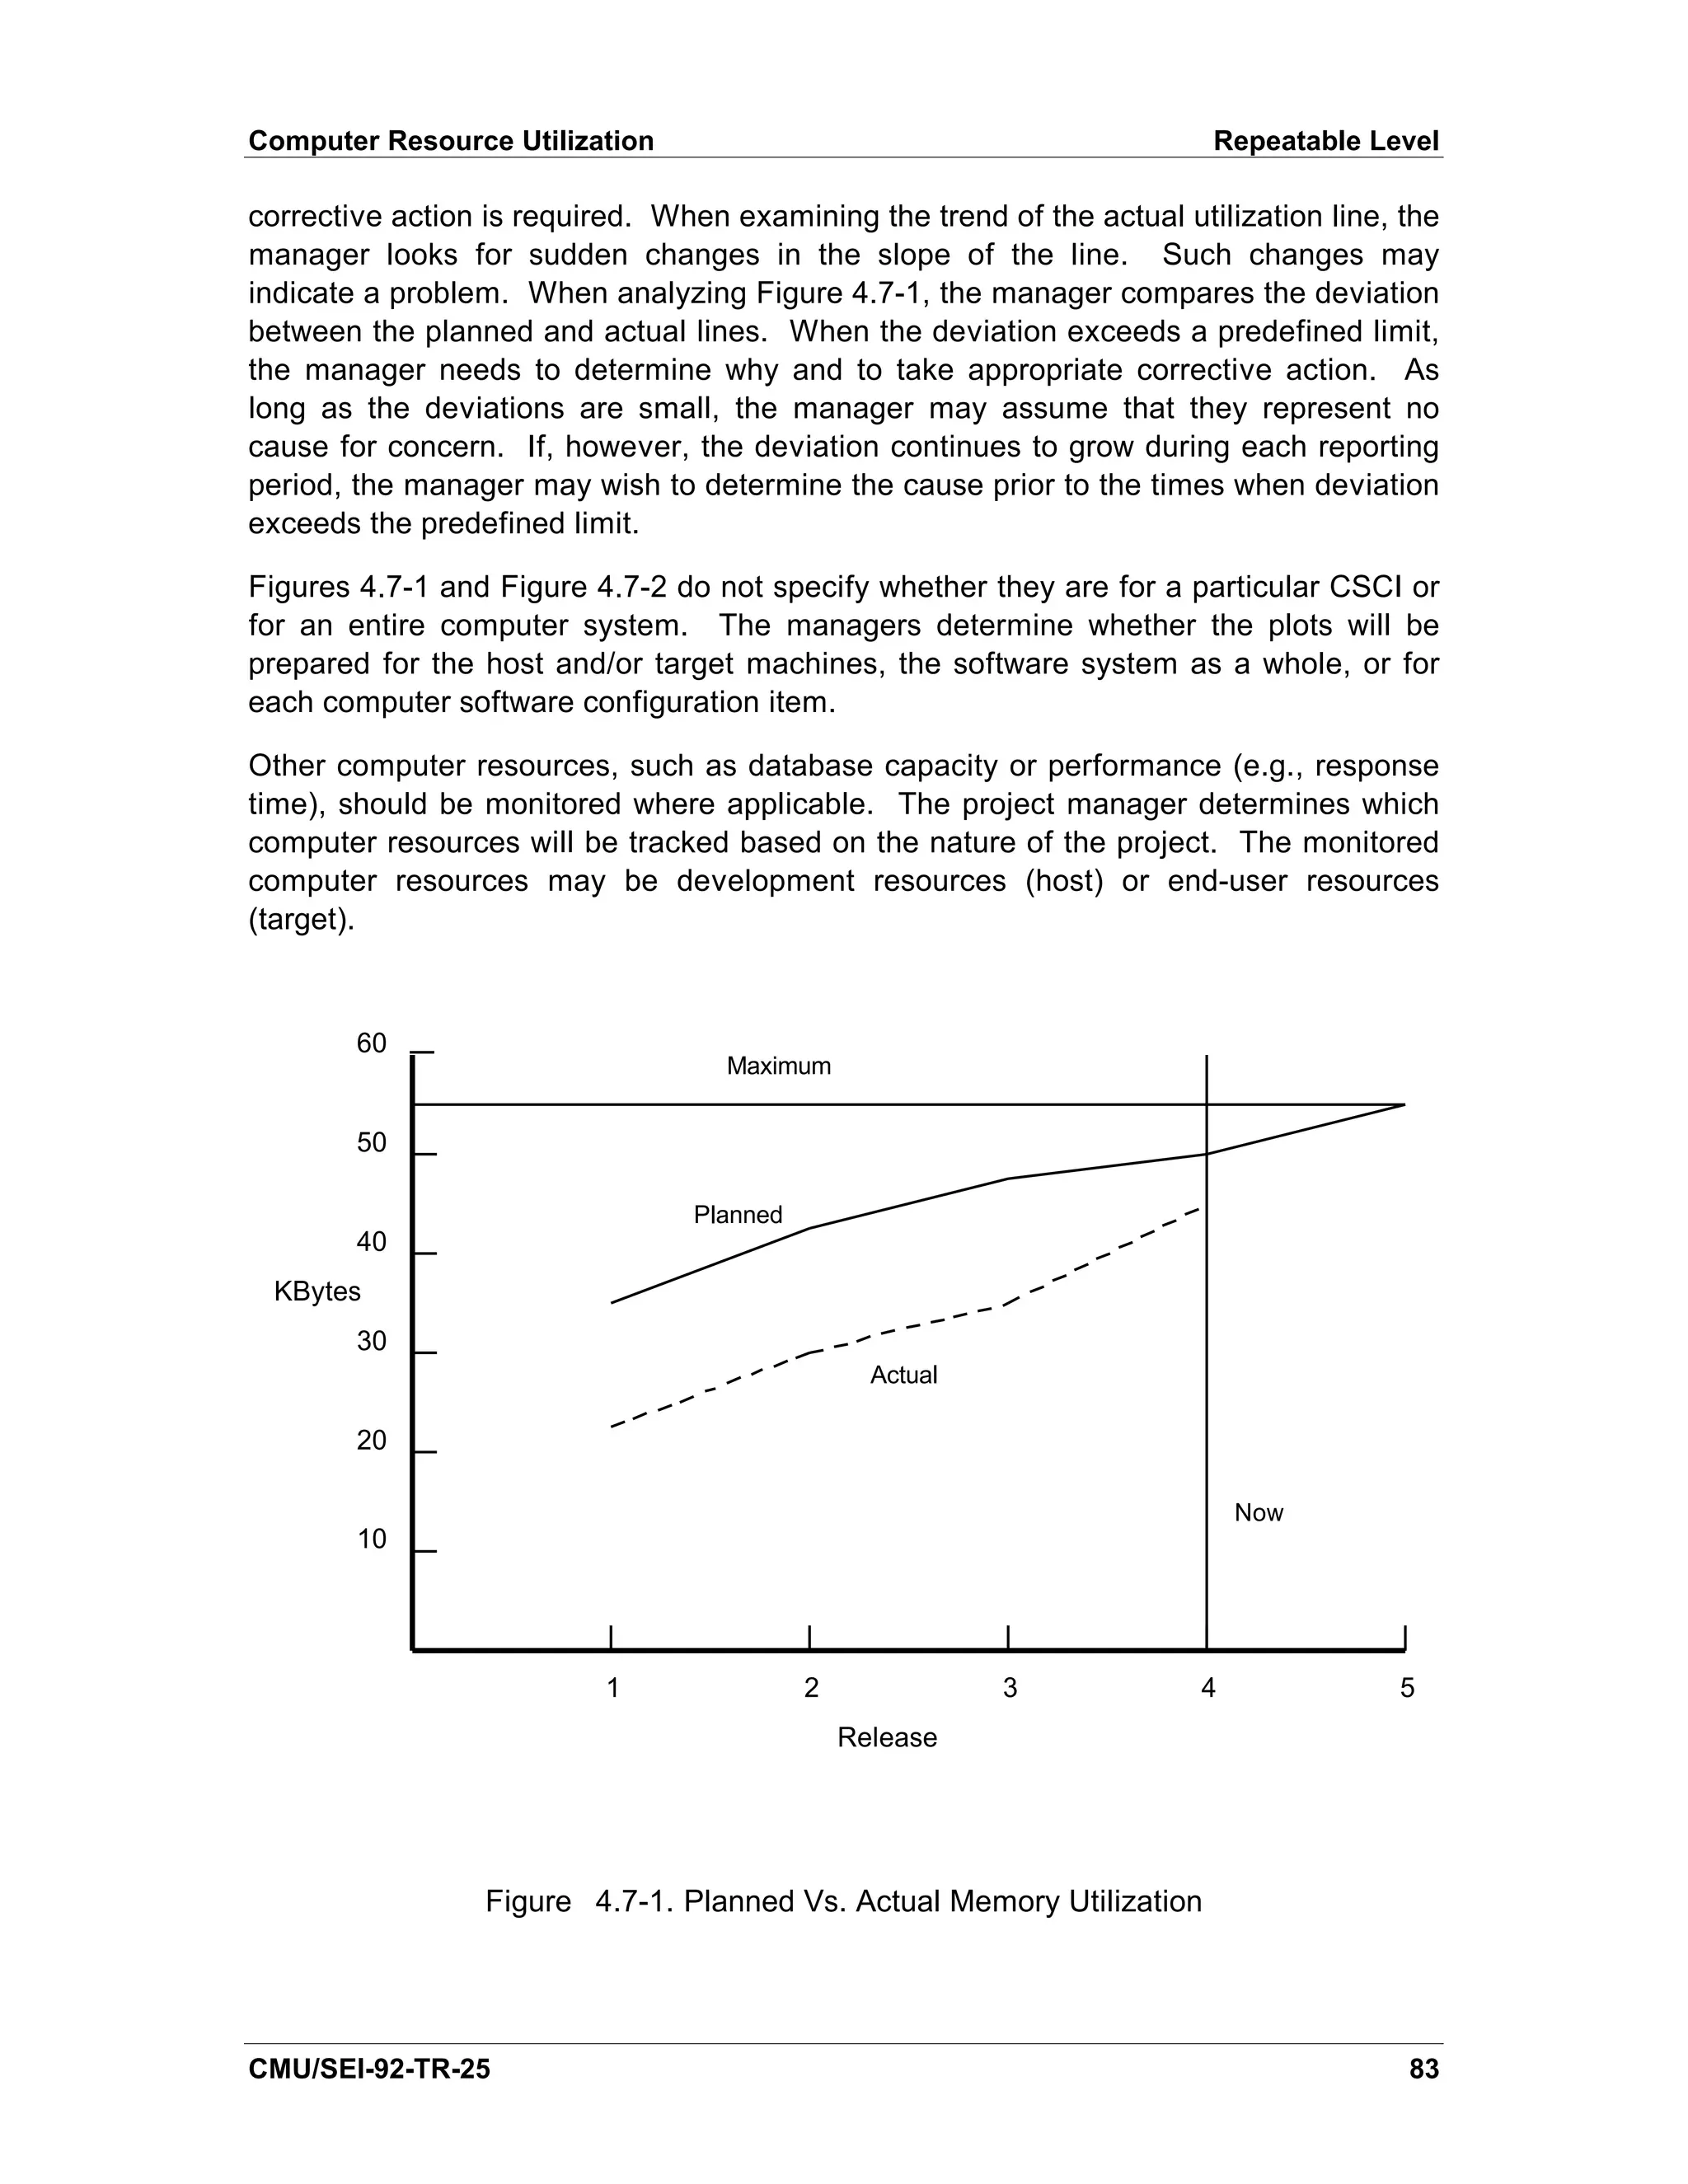
Interpretation
The software managers monitor the utilization level of each resource over time. Figure
4.7-1 shows a typical plot of the planned and actual utilization of memory while Figure
4.7-2 shows the actual memory used to-date expressed as a percentage of that
allowed. Both figures show the maximum allowable utilization for that resource. The
maximum allowable utilization may be set by physical constraints, the contract, or by
modeling the software system. For example, a development plan may call for a 50
percent memory reserve for future expansion. Thus, the remaining fifty percent would
be the one hundred percent allowable utilization. This number is determined by
physical constraints, contract, or by modeling the software system.
For each figure, the manager compares the actual computer resource utilization with
the maximum allowed. If the actual utilization is above the maximum allowed,
2 The maximum allowable utilization may be set by physical constraints, the contract, or by
modeling the software system. For example, a development plan may call for a fifty percent
memory reserve for future expansion. Thus, the fifty percent level would be the one hundred
percent allowable utilization.
82 CMU/SEI-92-TR-25](https://image.slidesharecdn.com/softwaremeasuresandthecapabilitymaturitymodel-1992johnh-baumertsei-110103031855-phpapp02/75/Software-measures-and-the-capability-maturity-model-1992-john-h-baumert-sei-100-2048.jpg)
![Repeatable Level Computer Resource Utilization
120
Maximum
100
80
Utilization
%
60
40 Actual
20 Now
1 2 3 4 5 6 7 8 9 10
Months
Figure 4.7-2. Memory Utilization
Sources
[AFSC 87], [Decker 91], [Landis 90], [Rozum 92], and [Schultz 88] discuss computer
resource utilization.
84 CMU/SEI-92-TR-25](https://image.slidesharecdn.com/softwaremeasuresandthecapabilitymaturitymodel-1992johnh-baumertsei-110103031855-phpapp02/75/Software-measures-and-the-capability-maturity-model-1992-john-h-baumert-sei-102-2048.jpg)
![5. The Defined Level— Maturity Level 3
This chapter summarizes the characteristics of an organization with a defined process
and discusses the indicators that are appropriate for the Defined Level.
5.1. Characteristics of a Defined-Level Organization
An organization with a defined process is characterized as one with a standard process
for developing and maintaining software. The process is documented and integrates
both the software engineering and software management process into a coherent
whole. Emphasis has shifted from project issues to organizational issues. A software
engineering process group (SEPG) exists and facilitates process definition and process
improvement. An organization-wide training program also exists to train the staff and
managers in the skills required to carry out their tasks.
Since basic project management processes are now in place, the organization has the
opportunity to concentrate on its software development processes. Managers will
continue to use the indicators discussed in Chapter 4, but measures can now be made
to determine the effectiveness of the organization’ overall software development
s
processes and of some detailed processes, such as peer review and training.
More historical data are available to a Defined-Level organization since it was collecting
data at the Repeatable Level. An organization can use these historical data to define
the normal range for measured items or by placing upper and lower bounds on these
items. This allows the project manager to compare the project to the “ norm.” If an item
is out-of-bounds, the manager has more reliable data available to determine whether
the item is out-of-bounds due to a breakdown in the process or to an inherent
characteristic of the item. The project manager cannot routinely perform such an
analysis at the Repeatable Level since the process may not have been well-defined or
even stable. However, at the Defined Level, the project manager has the advantage of
more mature and defined processes. In Section 6 of their work, Landis et al have
numerous illustrations of how a project manager can use ranges [Landis 90].
Indicators appropriate for a Defined-Level organization are progress, effort, cost,
quality, stability, computer resource utilization, and training.
5.2. Progress
The progress indicators for the Defined Level are essentially the same as those at the
Repeatable Level: Gantt charts and actual-versus-planned-completion charts (see
Section 4.2). The main difference is the addition of “ normal” ranges around the
planned completion lines. The organization establishes the normal range for each
activity by selecting some percentage around the planned completion line. This
CMU/SEI-92-TR-25 85](https://image.slidesharecdn.com/softwaremeasuresandthecapabilitymaturitymodel-1992johnh-baumertsei-110103031855-phpapp02/75/Software-measures-and-the-capability-maturity-model-1992-john-h-baumert-sei-103-2048.jpg)
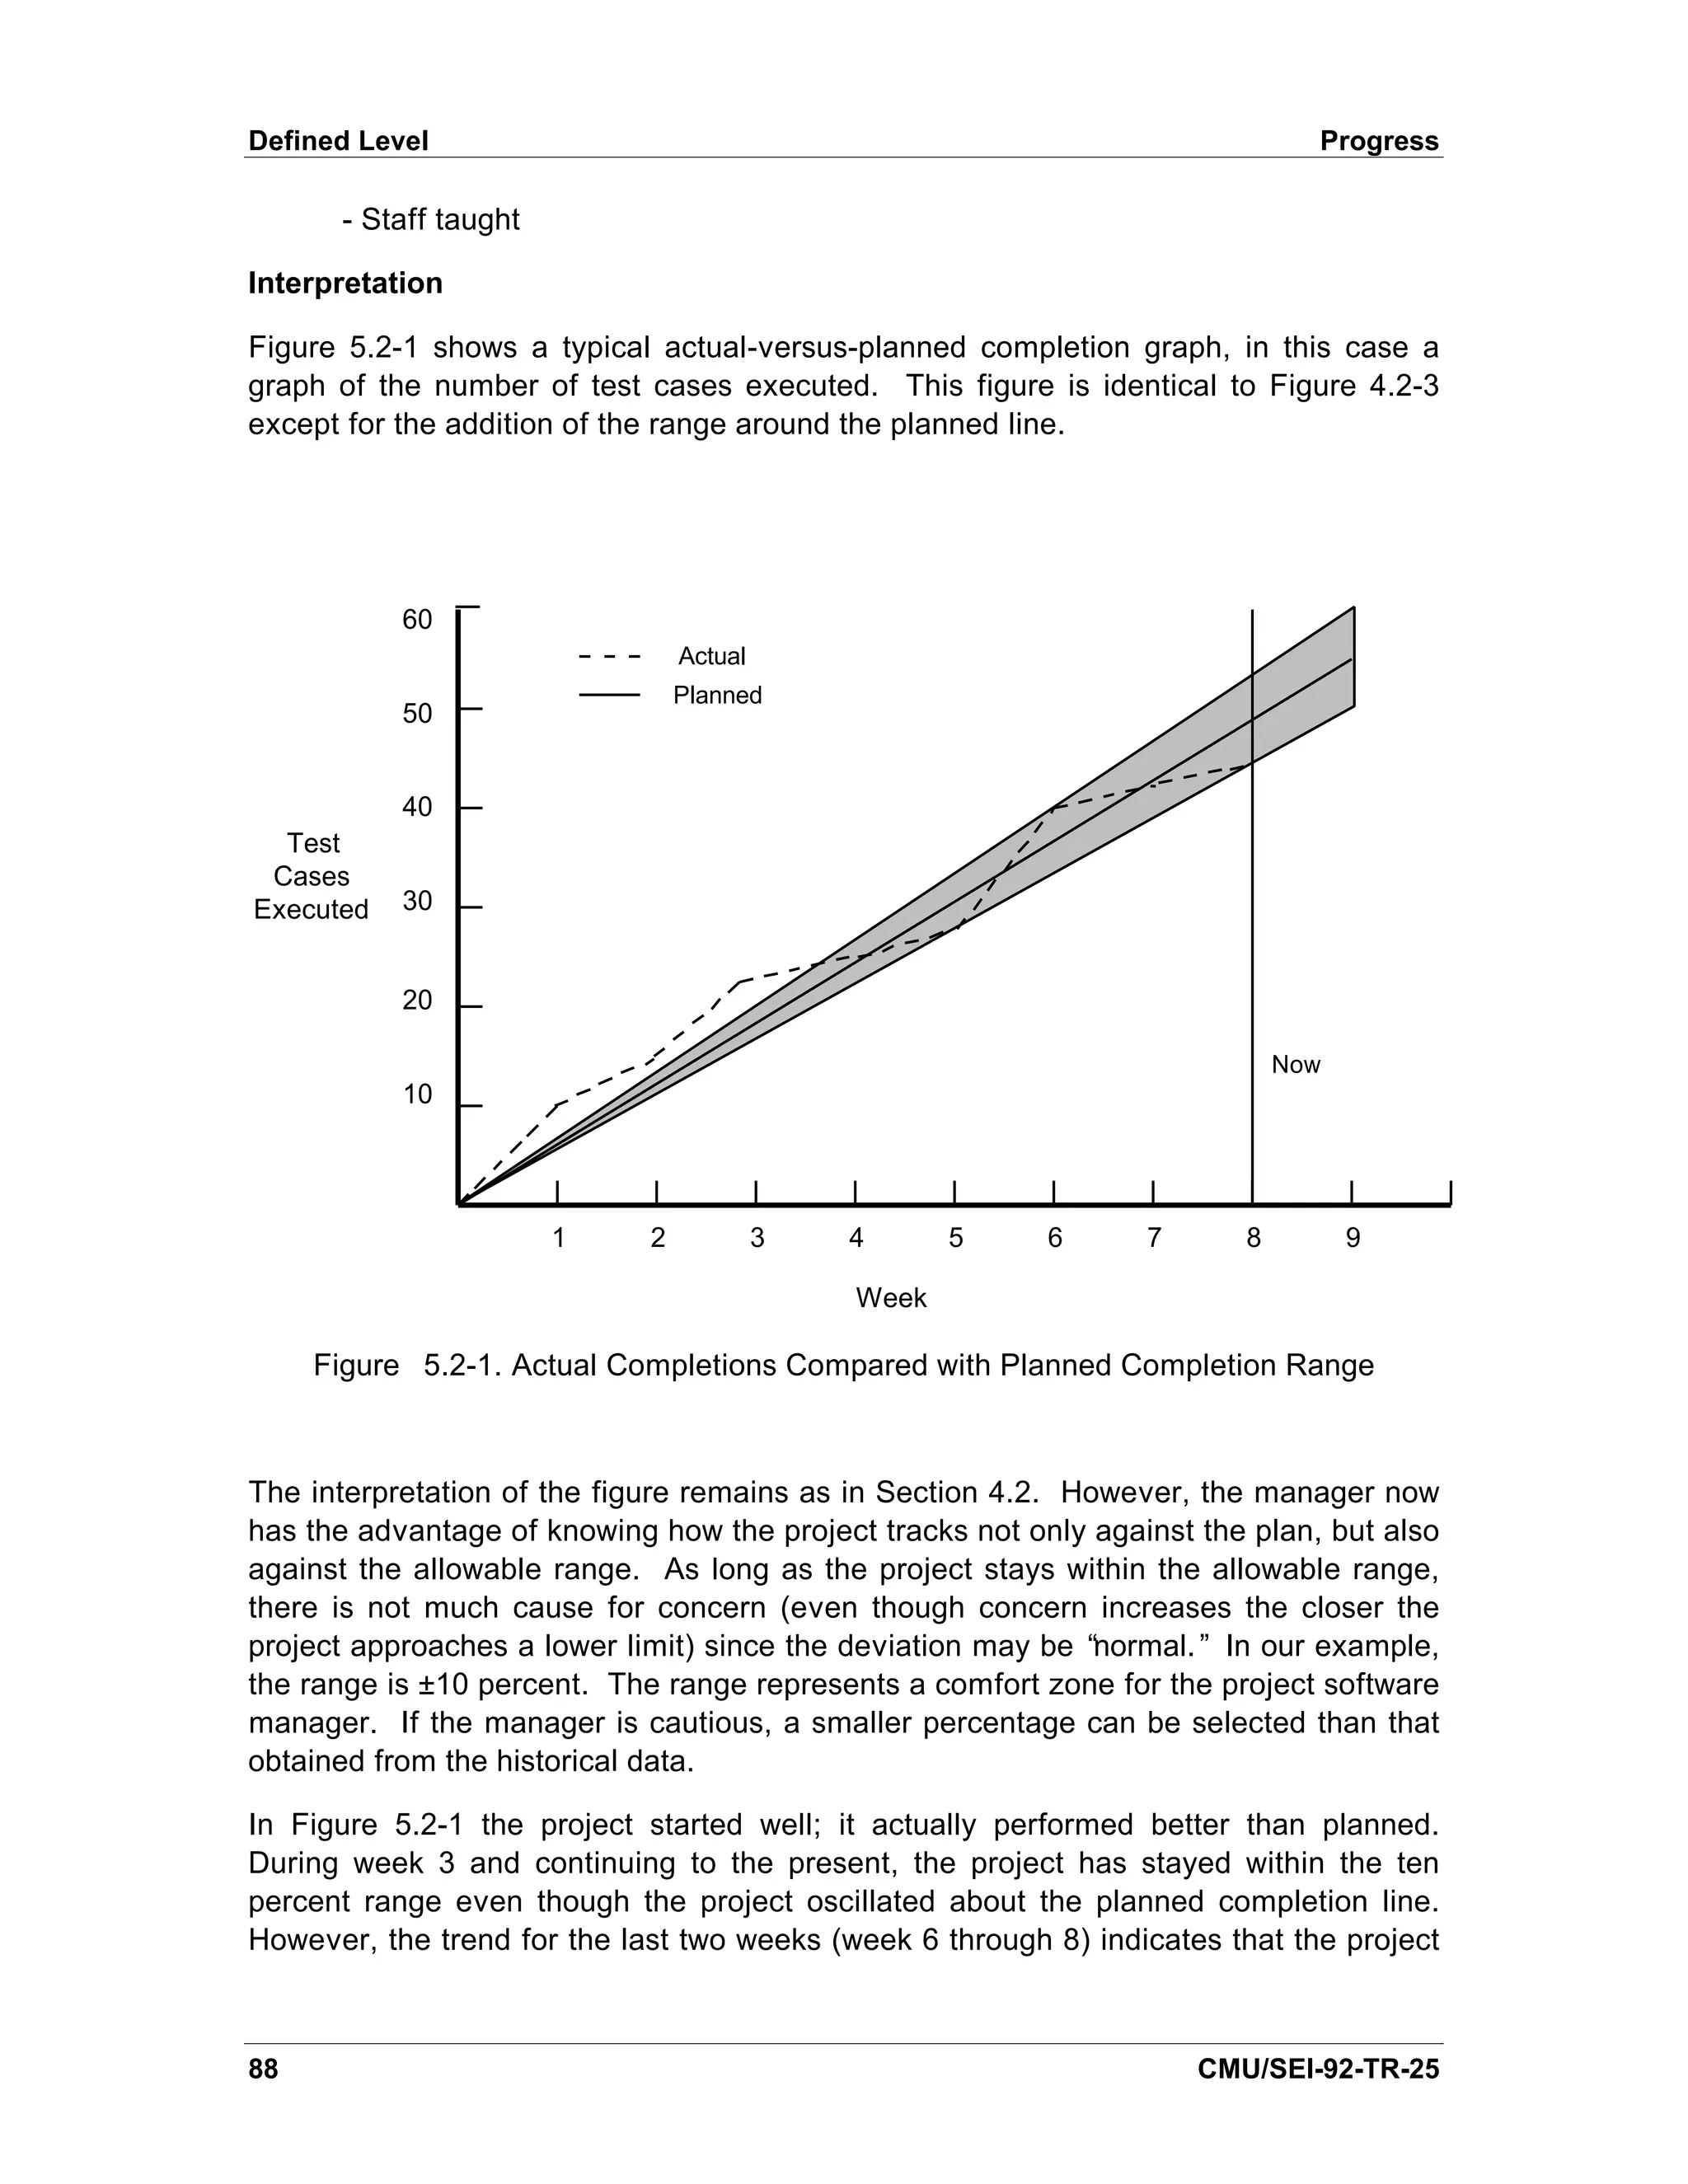
![Progress Defined Level
is not executing the number of test cases planned. If the current trend continues
through week 9, the project will fall out of the allowable range. The manager needs to
determine the reason for this trend.
The manager should also be concerned if the project exceeds the upper bound of the
range, that is, the project is performing better than planned. On the surface, this
appears to be good news in that the project is performing better than anticipated.
However, it may indicate that other activities are not being performed or that the
manager’ planning and estimation processes are poor.
s
As in the Repeatable Level, separate graphs are prepared for the items listed in the
input section depending on the life-cycle stage of the project. The number of staff
taught and the number of training classes held can be tracked to provide the project
software manager with information on the progress of the project training.
The use of Gantt charts is the same as for the Repeatable Level.
At the Defined Level, the project software manager analyzes the dependencies of the
activities listed on the Gantt chart and conducts a critical path analysis to determine
which activities lie on the critical path. This is often facilitated by the preparation of a
program-evaluation-and-review-technique (PERT) chart as shown in Figure 5.2-2.
Activity 2 Activity 4
Activity 1 Activity 6
Activity 3 Activity 5
Figure 5.2-2. A Simplified PERT Chart Showing the Critical Path
This figure shows the dependencies of six activities needed to complete the project.
The path defined by activities 1-2-5-6 is known as the critical path and denotes the
minimum time in which the project can be completed. A slippage in the completion of
any one of these activities results in a corresponding slippage in the completion of the
project. During project monitoring, the project manager pays particular attention to the
activities on the critical path.
Sources
From the Repeatable Level:
[AFSC 86] discusses planned and actual completions graphs at the computer software
configuration item (CSCI) level.
CMU/SEI-92-TR-25 89](https://image.slidesharecdn.com/softwaremeasuresandthecapabilitymaturitymodel-1992johnh-baumertsei-110103031855-phpapp02/75/Software-measures-and-the-capability-maturity-model-1992-john-h-baumert-sei-107-2048.jpg)
![Defined Level Progress
[Decker 91] lists requirements diagrams; function specifications; design diagrams; test
cases; units designed, coded, and tested; modules tested; and computer software
components tested as items tracked on planned and actual completions graphs.
[Grady 87] states that calendar measures are part of the Hewlett-Packard metrics
program.
[Landis 90] discusses planned and actual completions graphs for units coded, read,
and tested.
[Rozum 92] has a discussion on Gantt charts in their milestone performance metric and
a discussion of planned and actuals in their development progress metric.
[Schultz 88] discusses software requirements documented in his design progress
metric and the number of computer software units (CSU) designed, coded, tested, and
integrated in his CSU development progress metric. He also discusses the planned
and actual completions of CSCIs integrated in his test progress metric.
[STEP 91] discusses a schedule metric upon which Figure 4.2-2 is based and a
development progress metric.
For the Defined Level:
[Lockyer 84] discusses Gantt charts and the critical path method.
90 CMU/SEI-92-TR-25](https://image.slidesharecdn.com/softwaremeasuresandthecapabilitymaturitymodel-1992johnh-baumertsei-110103031855-phpapp02/75/Software-measures-and-the-capability-maturity-model-1992-john-h-baumert-sei-108-2048.jpg)
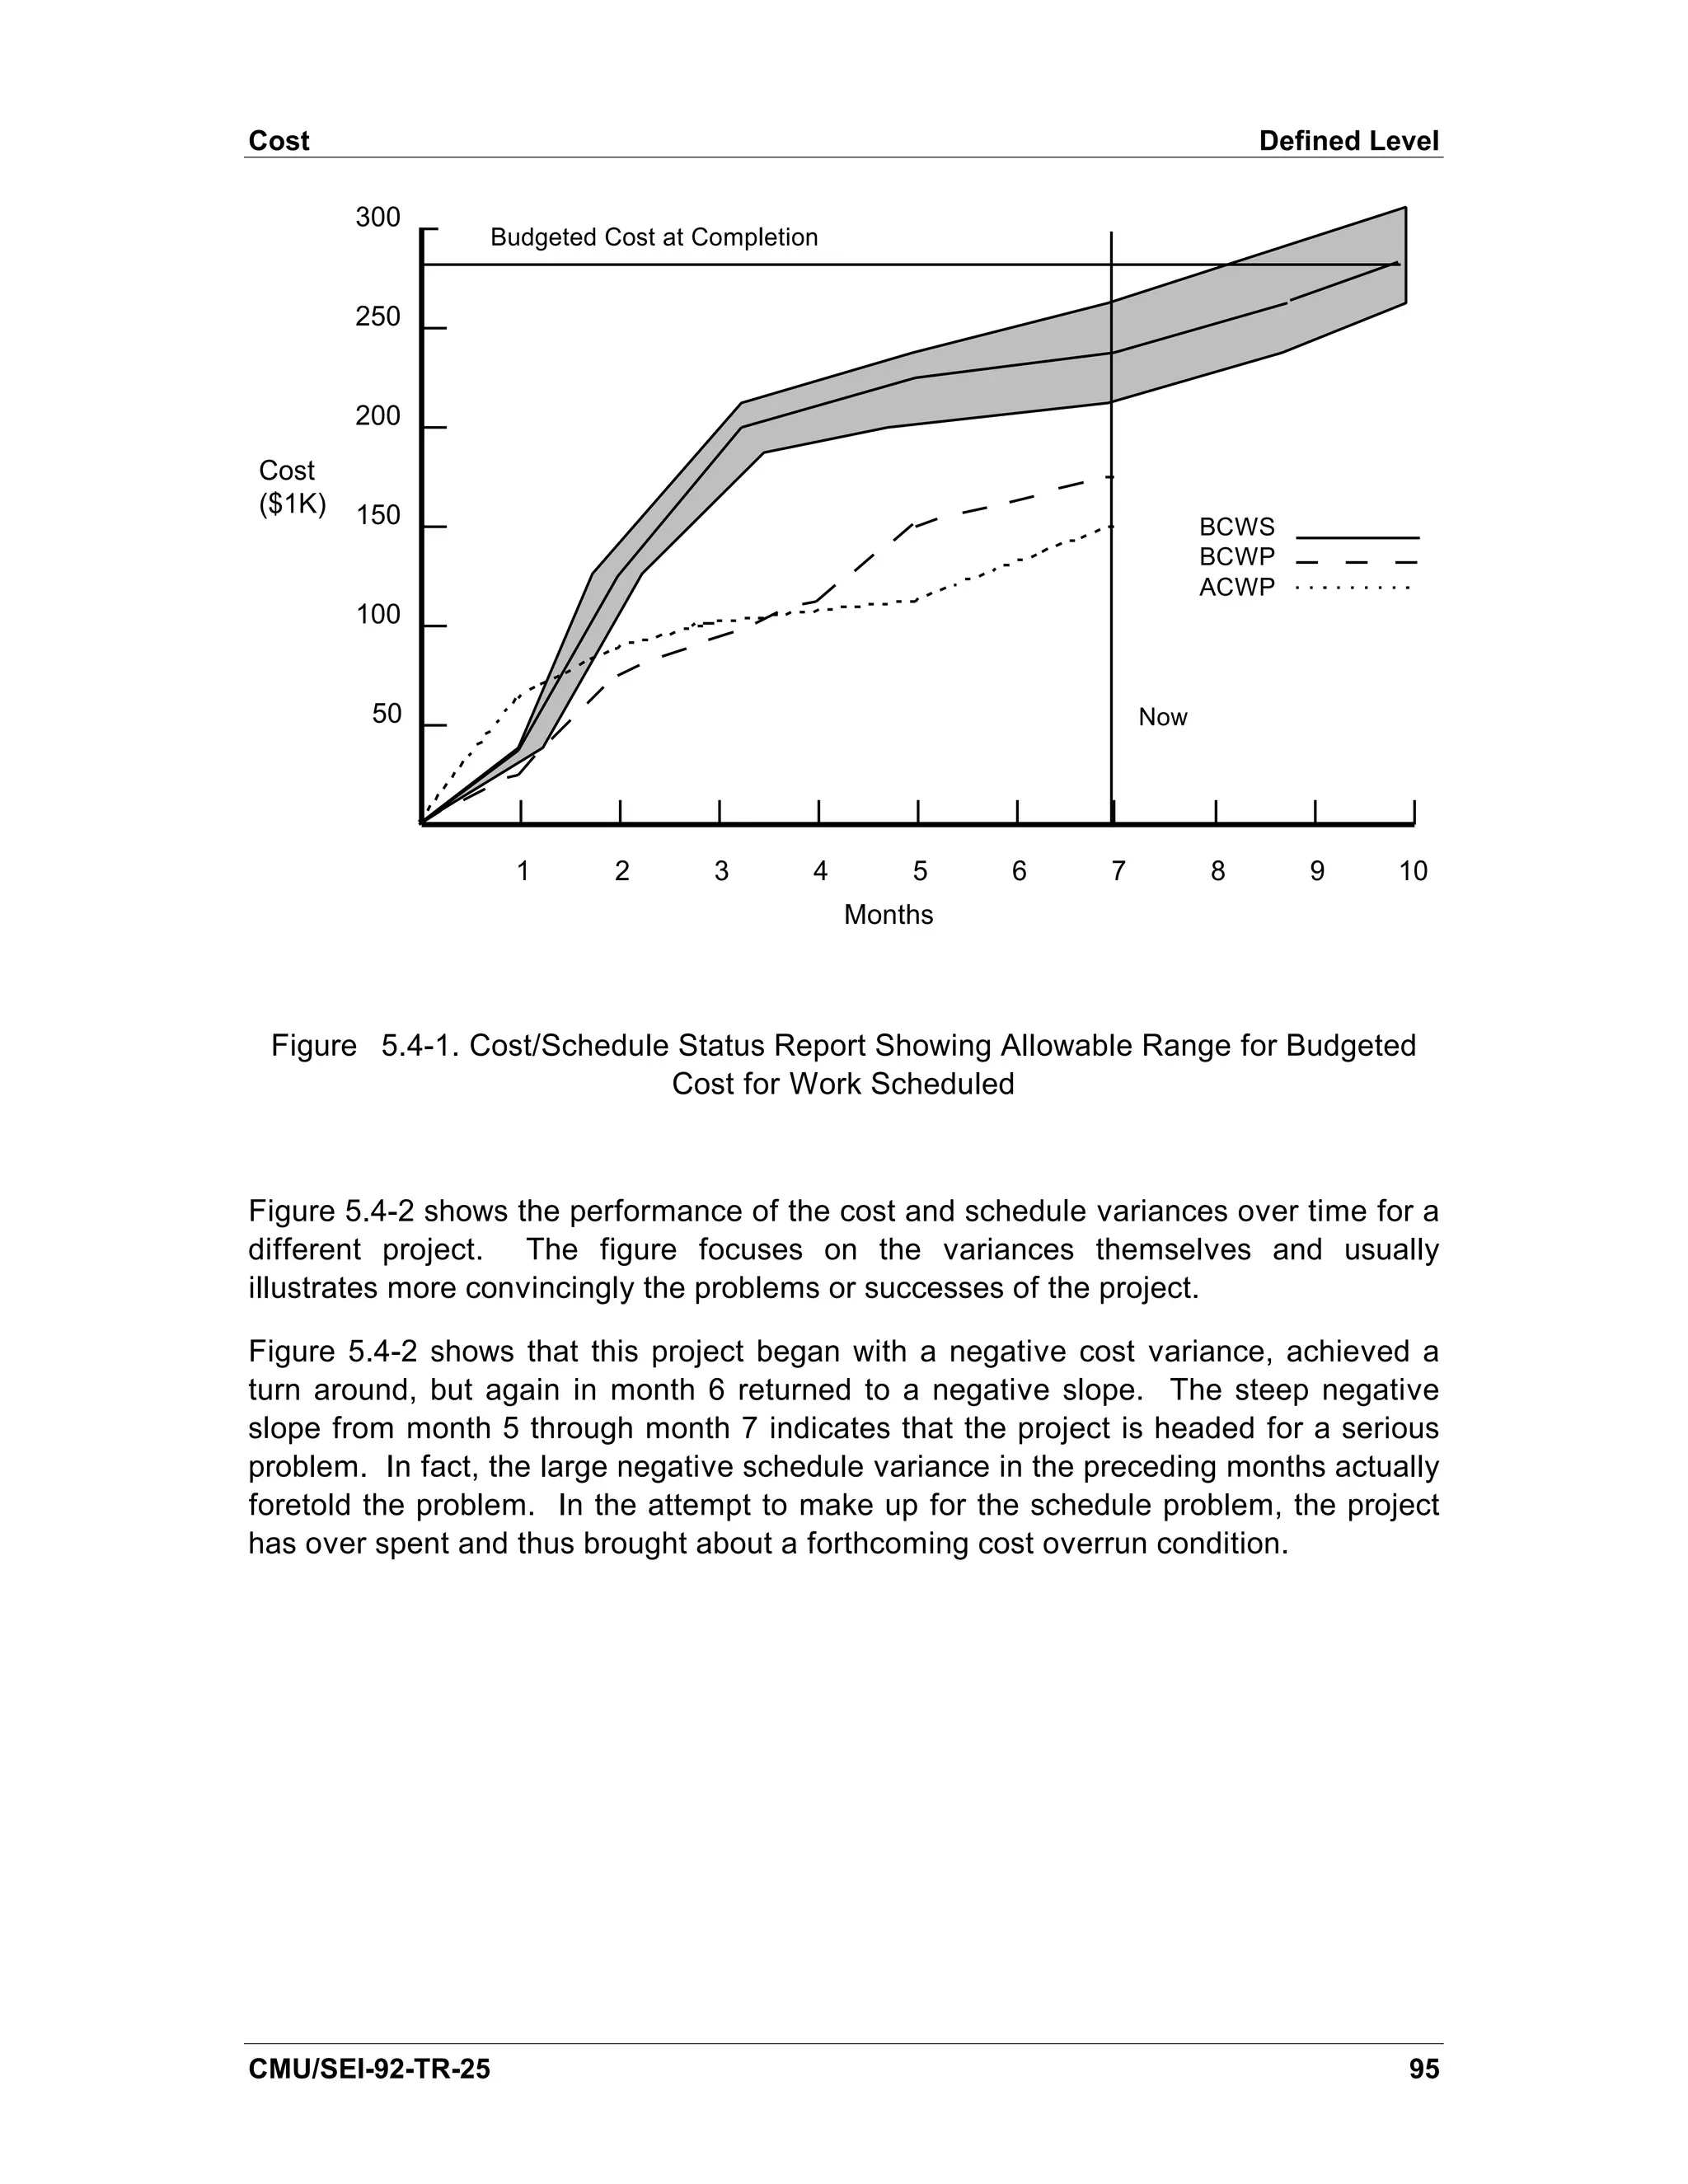
![Defined Level Cost
Cost variance
Schedule variance
+20
+10
Variance (%) 0
-10
-20 Now
1 2 3 4 5 6 7 8 9 10
Months
Figure 5.4-2. Variance Report
Variance is to be expected; the amount and sign of variance is important. An
organization uses its historical data to determine the normal ranges of cost and
schedule variances. An organization uses these ranges to establish threshold limits on
variances. For example, an organization can adopt ±10 percent to signify low risk, ±10-
15 percent to signify moderate risk (and the possible need for corrective action), and
any variance over ±15 percent to signify a high risk that requires corrective action. The
manager of the area that exceeds the threshold explains to the next level of
management the cause(s) of the variance and the corrective action to be taken (if any).
If variances consistently remain beyond the thresholds, the organization may wish to
reexamine its estimating and scheduling processes. Likewise, if the variances
consistently stay within the threshold, management may want to redefine the threshold
by setting smaller tolerances.
When the variances become so large that the plan is no longer valid, the managers
replan the elements of the project according to the documented procedure for the
project.
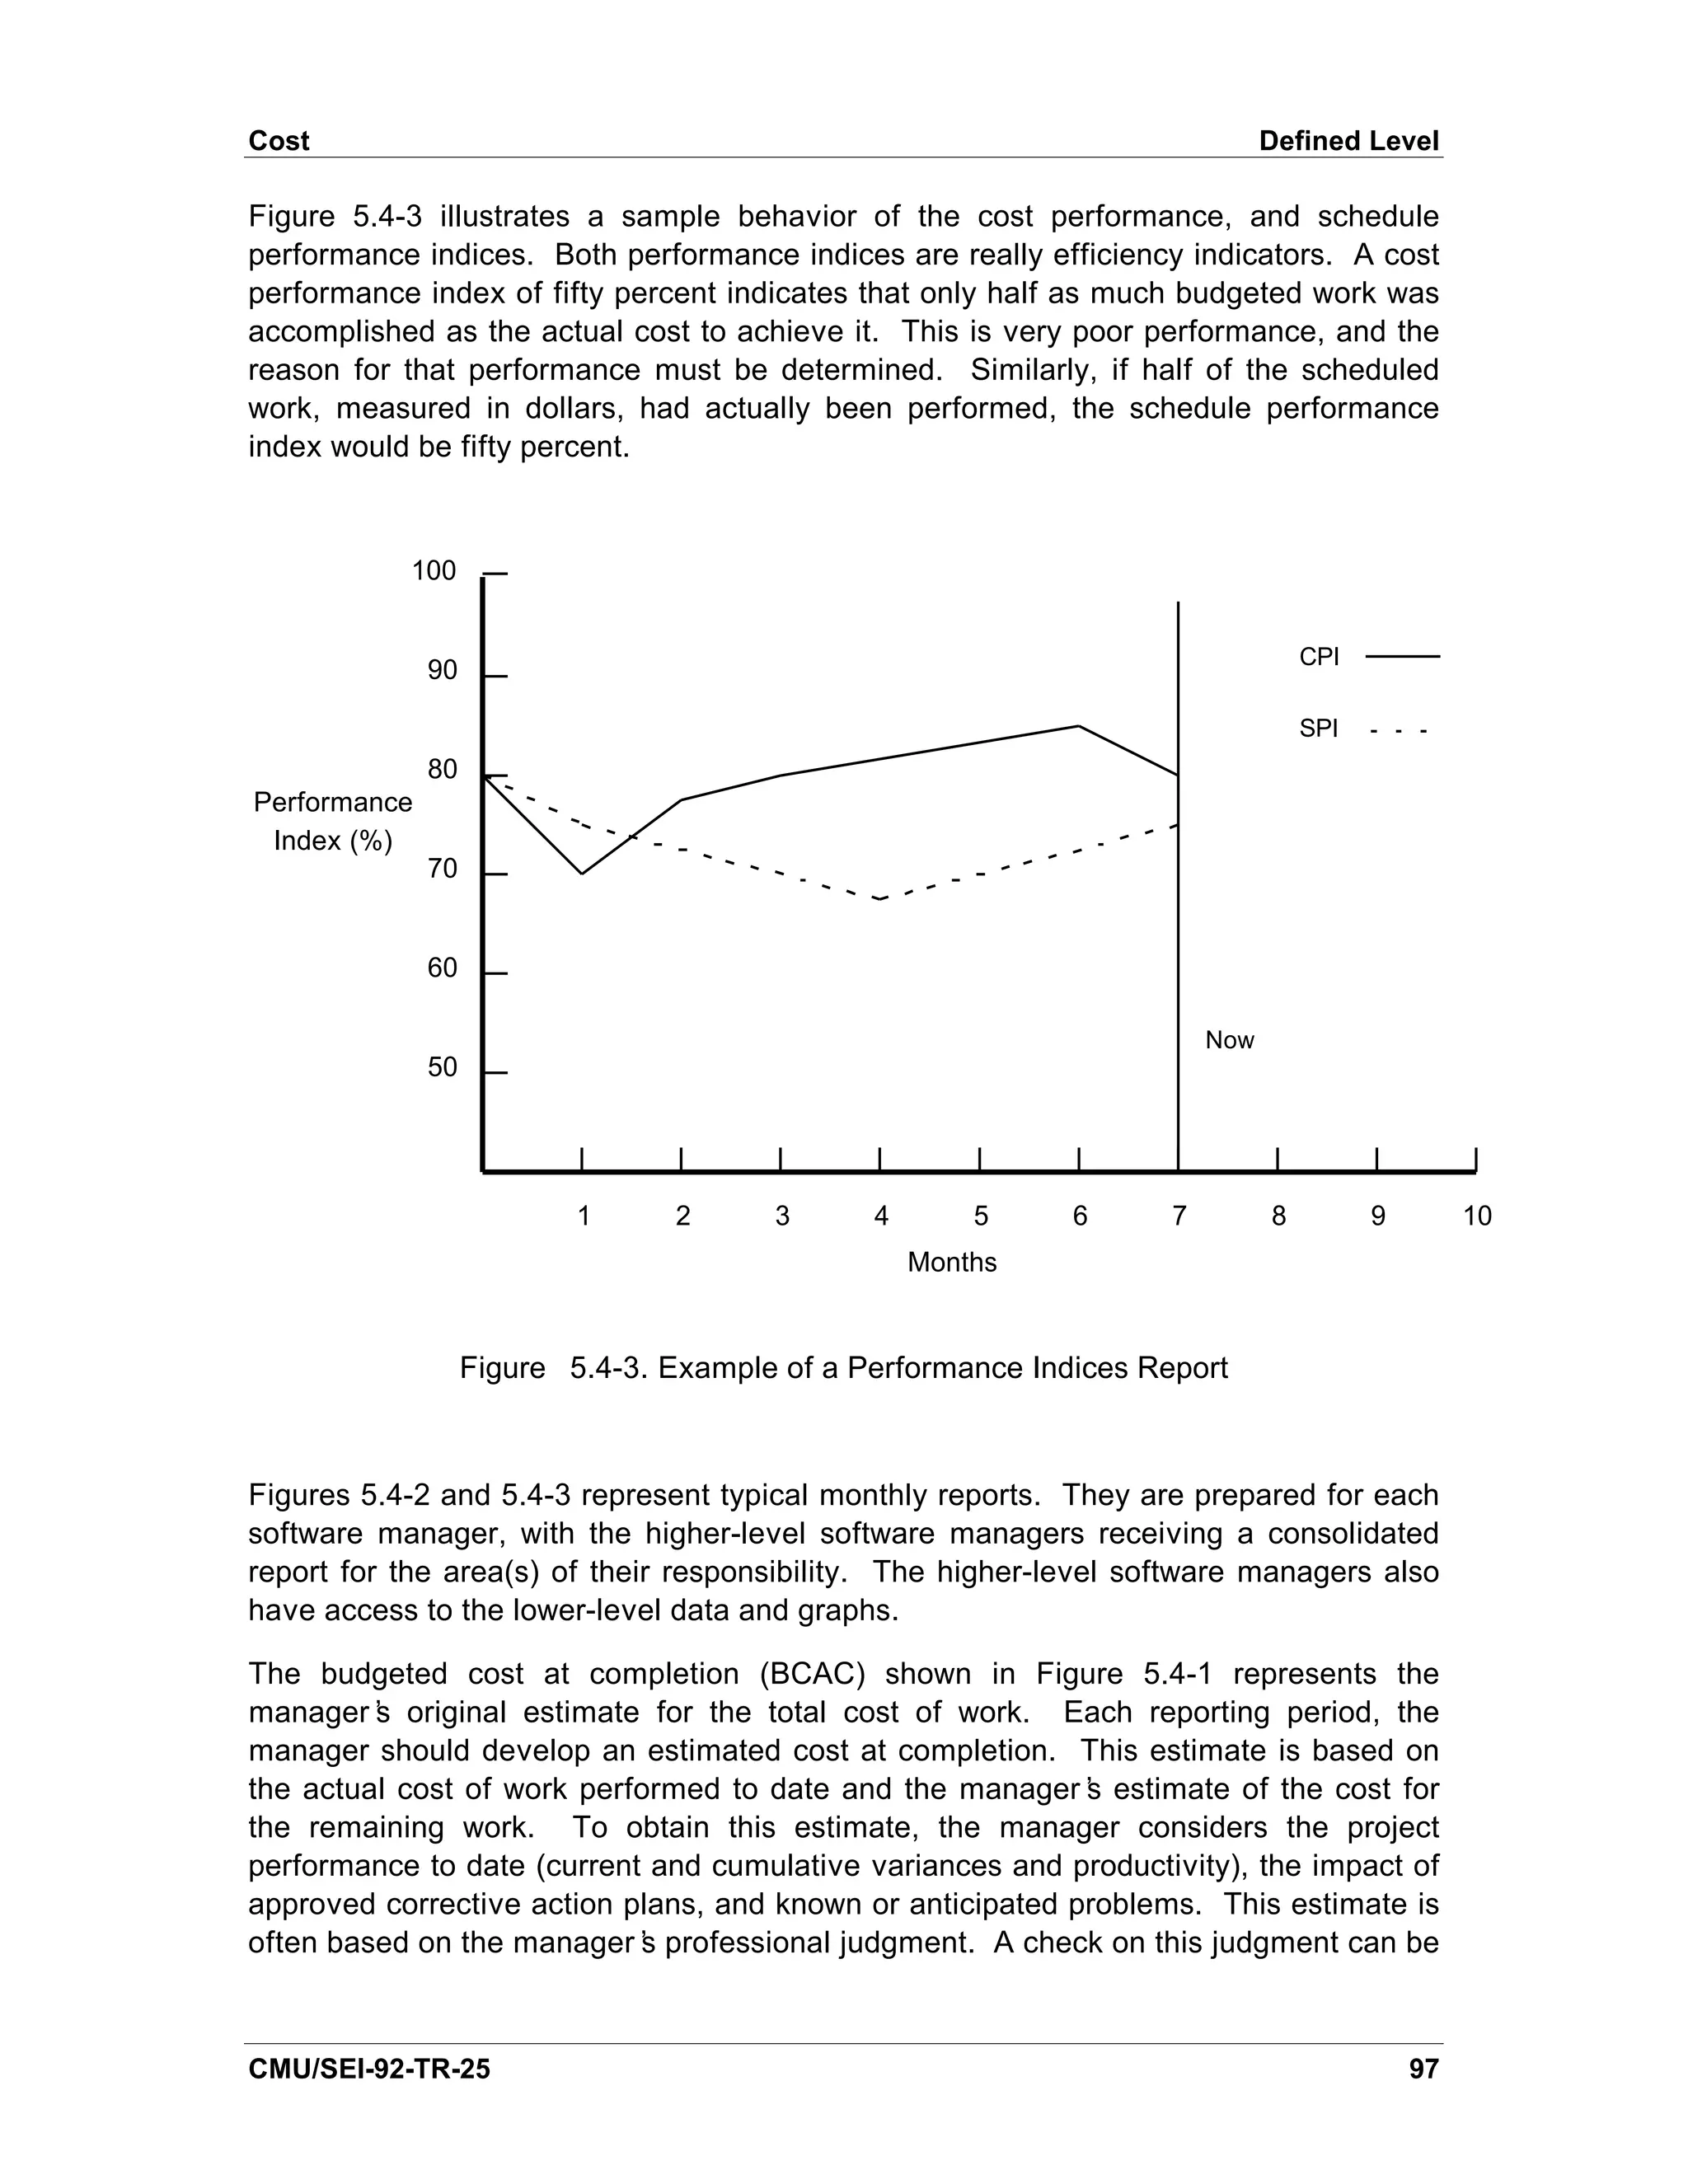
Another way of analyzing the performance of the project is through cost and schedule
performance indices. The cost performance index (CPI) is the ratio of the budgeted
cost for work performed and the actual cost of the work performed, expressed as a
percentage [CPI=(BCWP/ACWP)*100%]. The schedule performance index (SPI) is the
ratio of the budgeted cost for the work performed and the budgeted cost for the work
scheduled, expressed as a percentage [SPI=(BCWP/BCWS)*100%].
96 CMU/SEI-92-TR-25](https://image.slidesharecdn.com/softwaremeasuresandthecapabilitymaturitymodel-1992johnh-baumertsei-110103031855-phpapp02/75/Software-measures-and-the-capability-maturity-model-1992-john-h-baumert-sei-114-2048.jpg)
![Defined Level Cost
obtained through the use of the actual costs and the performance indices. For
example, an estimated cost at completion can be obtained from the following equation
[AFSC 86]:
Estimated cost at completion = ACWP + [BCAC - BCWP] / [0.2(SPI) + 0.8(CPI)]
Other estimates can be obtained through the use of parametric cost models. Ideally,
the organization should develop its own equation from its historical cost data. The
manager compares the estimated cost at completion with that derived from the data
and explains any differences. The final estimated cost at completion must be reviewed
for realism and appropriateness.
Sources
[AFSC 86] has a discussion of these indicators.
[DoD 80] discusses the basics of ACWP, BCWP, and BCWS.
[DSDM 89] served as the major source of information in this section.
98 CMU/SEI-92-TR-25](https://image.slidesharecdn.com/softwaremeasuresandthecapabilitymaturitymodel-1992johnh-baumertsei-110103031855-phpapp02/75/Software-measures-and-the-capability-maturity-model-1992-john-h-baumert-sei-116-2048.jpg)
![Defined Level Software Quality Assurance Audit Results
report can include the number of each type of audit conducted and summary
information on each audit. This information includes sample size and the percentage
of the total that the sample size represents.
Sources
[Pfleeger 89] and [Florac 92] discuss the tracking of problems found in a variety of life-
cycle stages. The indicators of software quality assurance audit results are an
extension of that discussion.
102 CMU/SEI-92-TR-25](https://image.slidesharecdn.com/softwaremeasuresandthecapabilitymaturitymodel-1992johnh-baumertsei-110103031855-phpapp02/75/Software-measures-and-the-capability-maturity-model-1992-john-h-baumert-sei-120-2048.jpg)
![Review Results Defined Level
The project is addressing the highest and lowest priority action items faster than the
average project and is performing just as an average project with respect to the middle
priority action items. The project is also addressing all product action items (all
priorities combined) faster than the average, but is not performing as well with respect
to the process related action items.
Sources
From the Repeatable Level:
[AFSC 86] discusses tracking action items in its requirements definition and stability
indicators.
[Florac 92] discusses tracking action items in their general discussion of a problem
management system.
[Rozum 92] discusses tracking action items in their software defects metric.
[Schultz 88] discusses tracking action items in his software volatility metric.
CMU/SEI-92-TR-25 105](https://image.slidesharecdn.com/softwaremeasuresandthecapabilitymaturitymodel-1992johnh-baumertsei-110103031855-phpapp02/75/Software-measures-and-the-capability-maturity-model-1992-john-h-baumert-sei-123-2048.jpg)
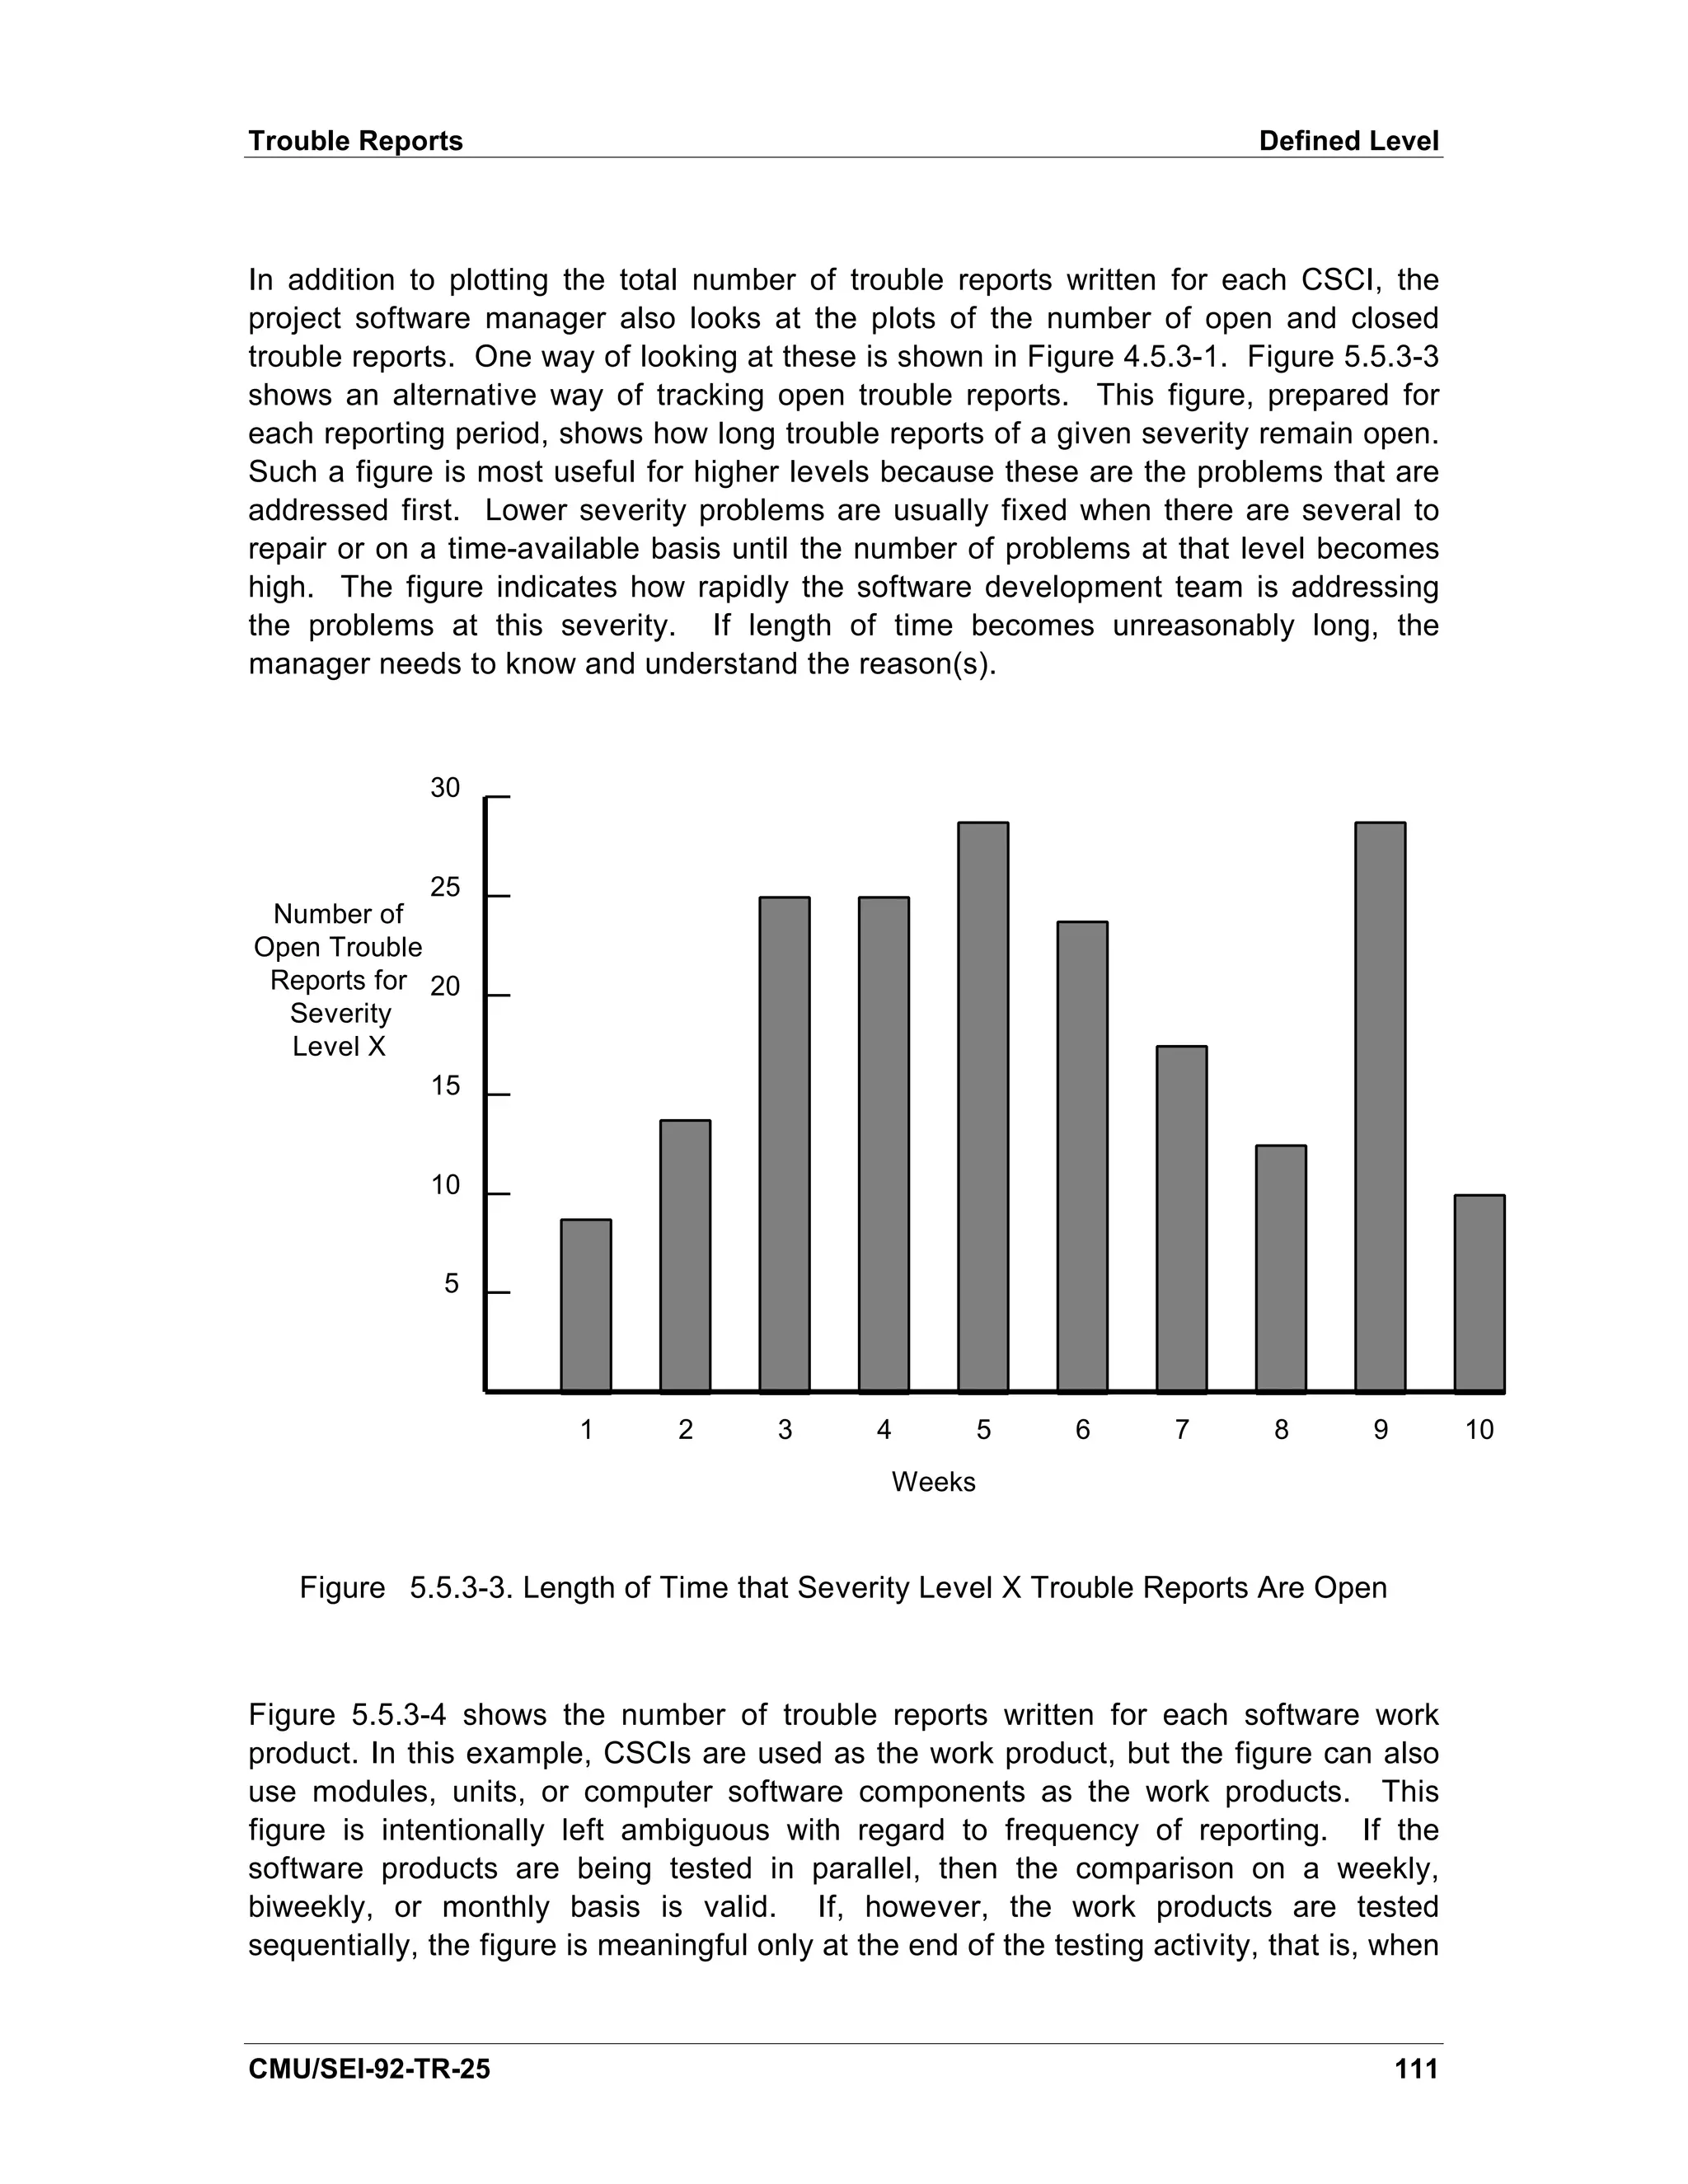
![Trouble Reports Defined Level
- Date trouble report evaluated
- Type
- Severity
- Type (category) of defect
- Severity of defect
- Product identification
- Trouble report identification
- Source of problem
- Cause of defect
- Life-cycle stage in which trouble report is written
- Activity in which defect was introduced
- Units affected by defect
Note that some of the information requested for each trouble report can be provided
only after the problem has been analyzed and the defect fixed.
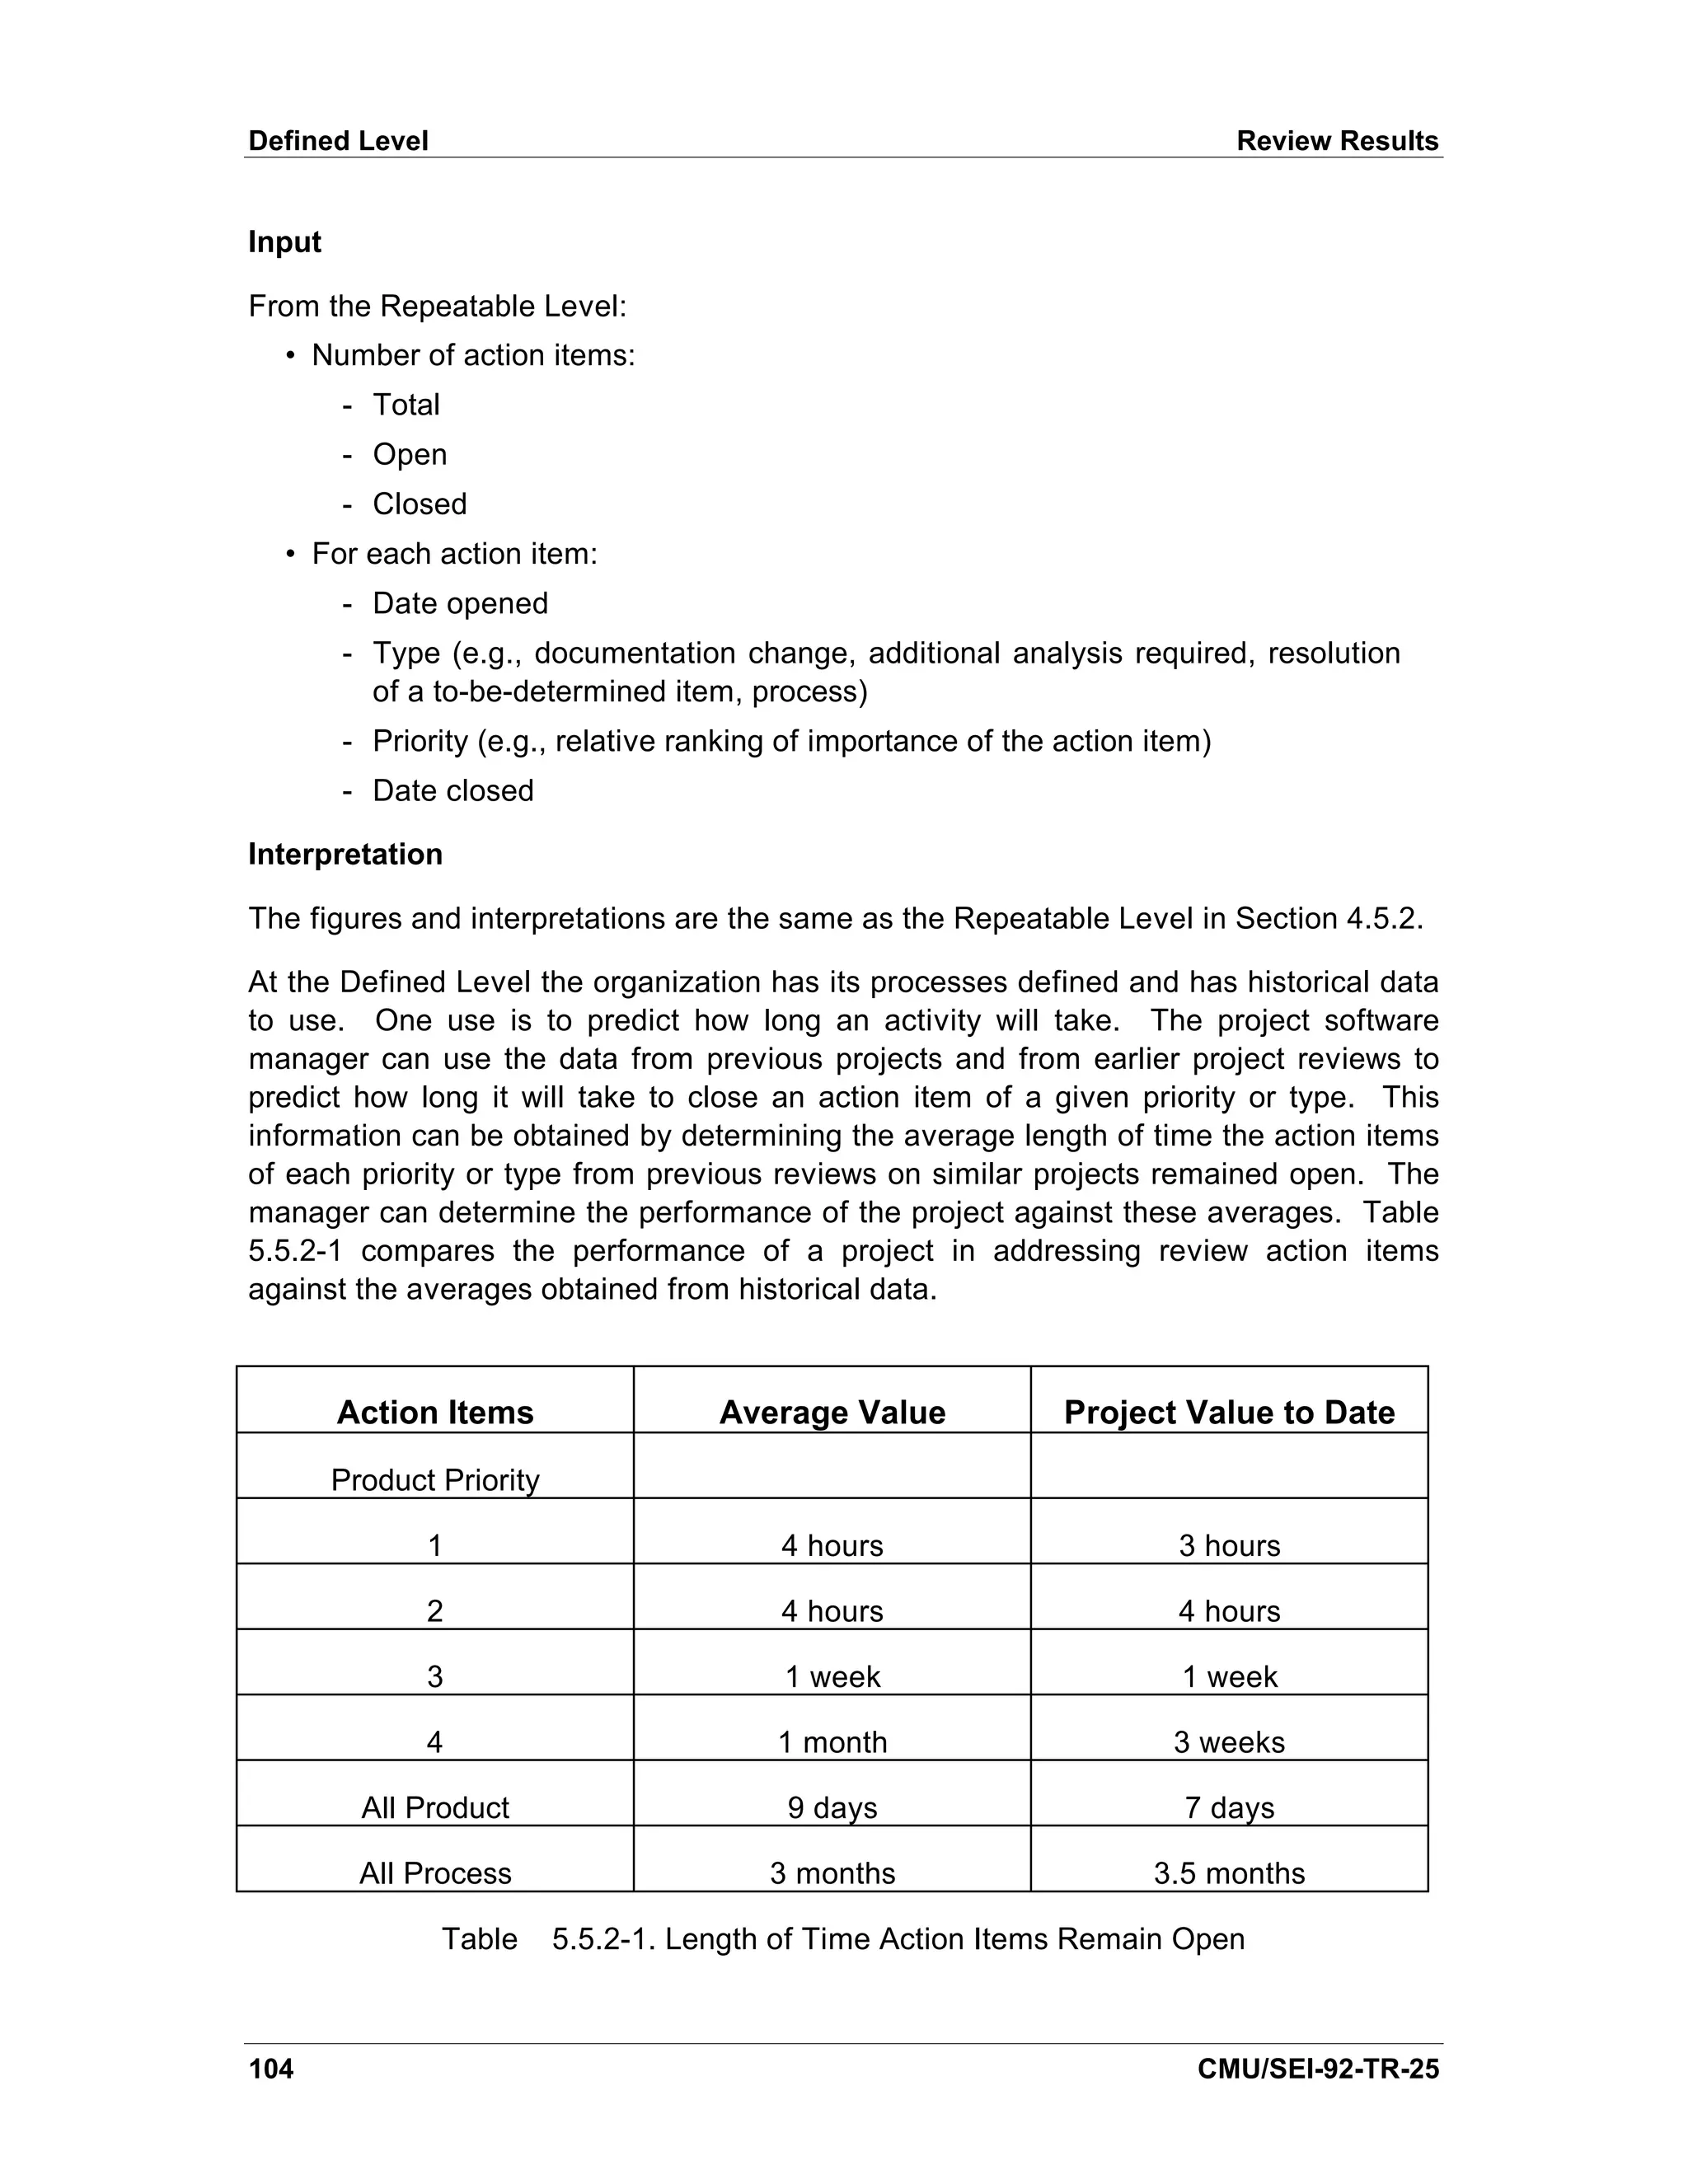
Interpretation
The plots used at the Repeatable Level are also applicable at the Defined Level. At the
Defined Level, the figures are more meaningful if prepared for each computer software
configuration item (CSCI) instead of for the project as a whole. Also, at the Defined
Level, the project can use historical data to compare itself against similar projects and
to predict the number of trouble reports it can expect.
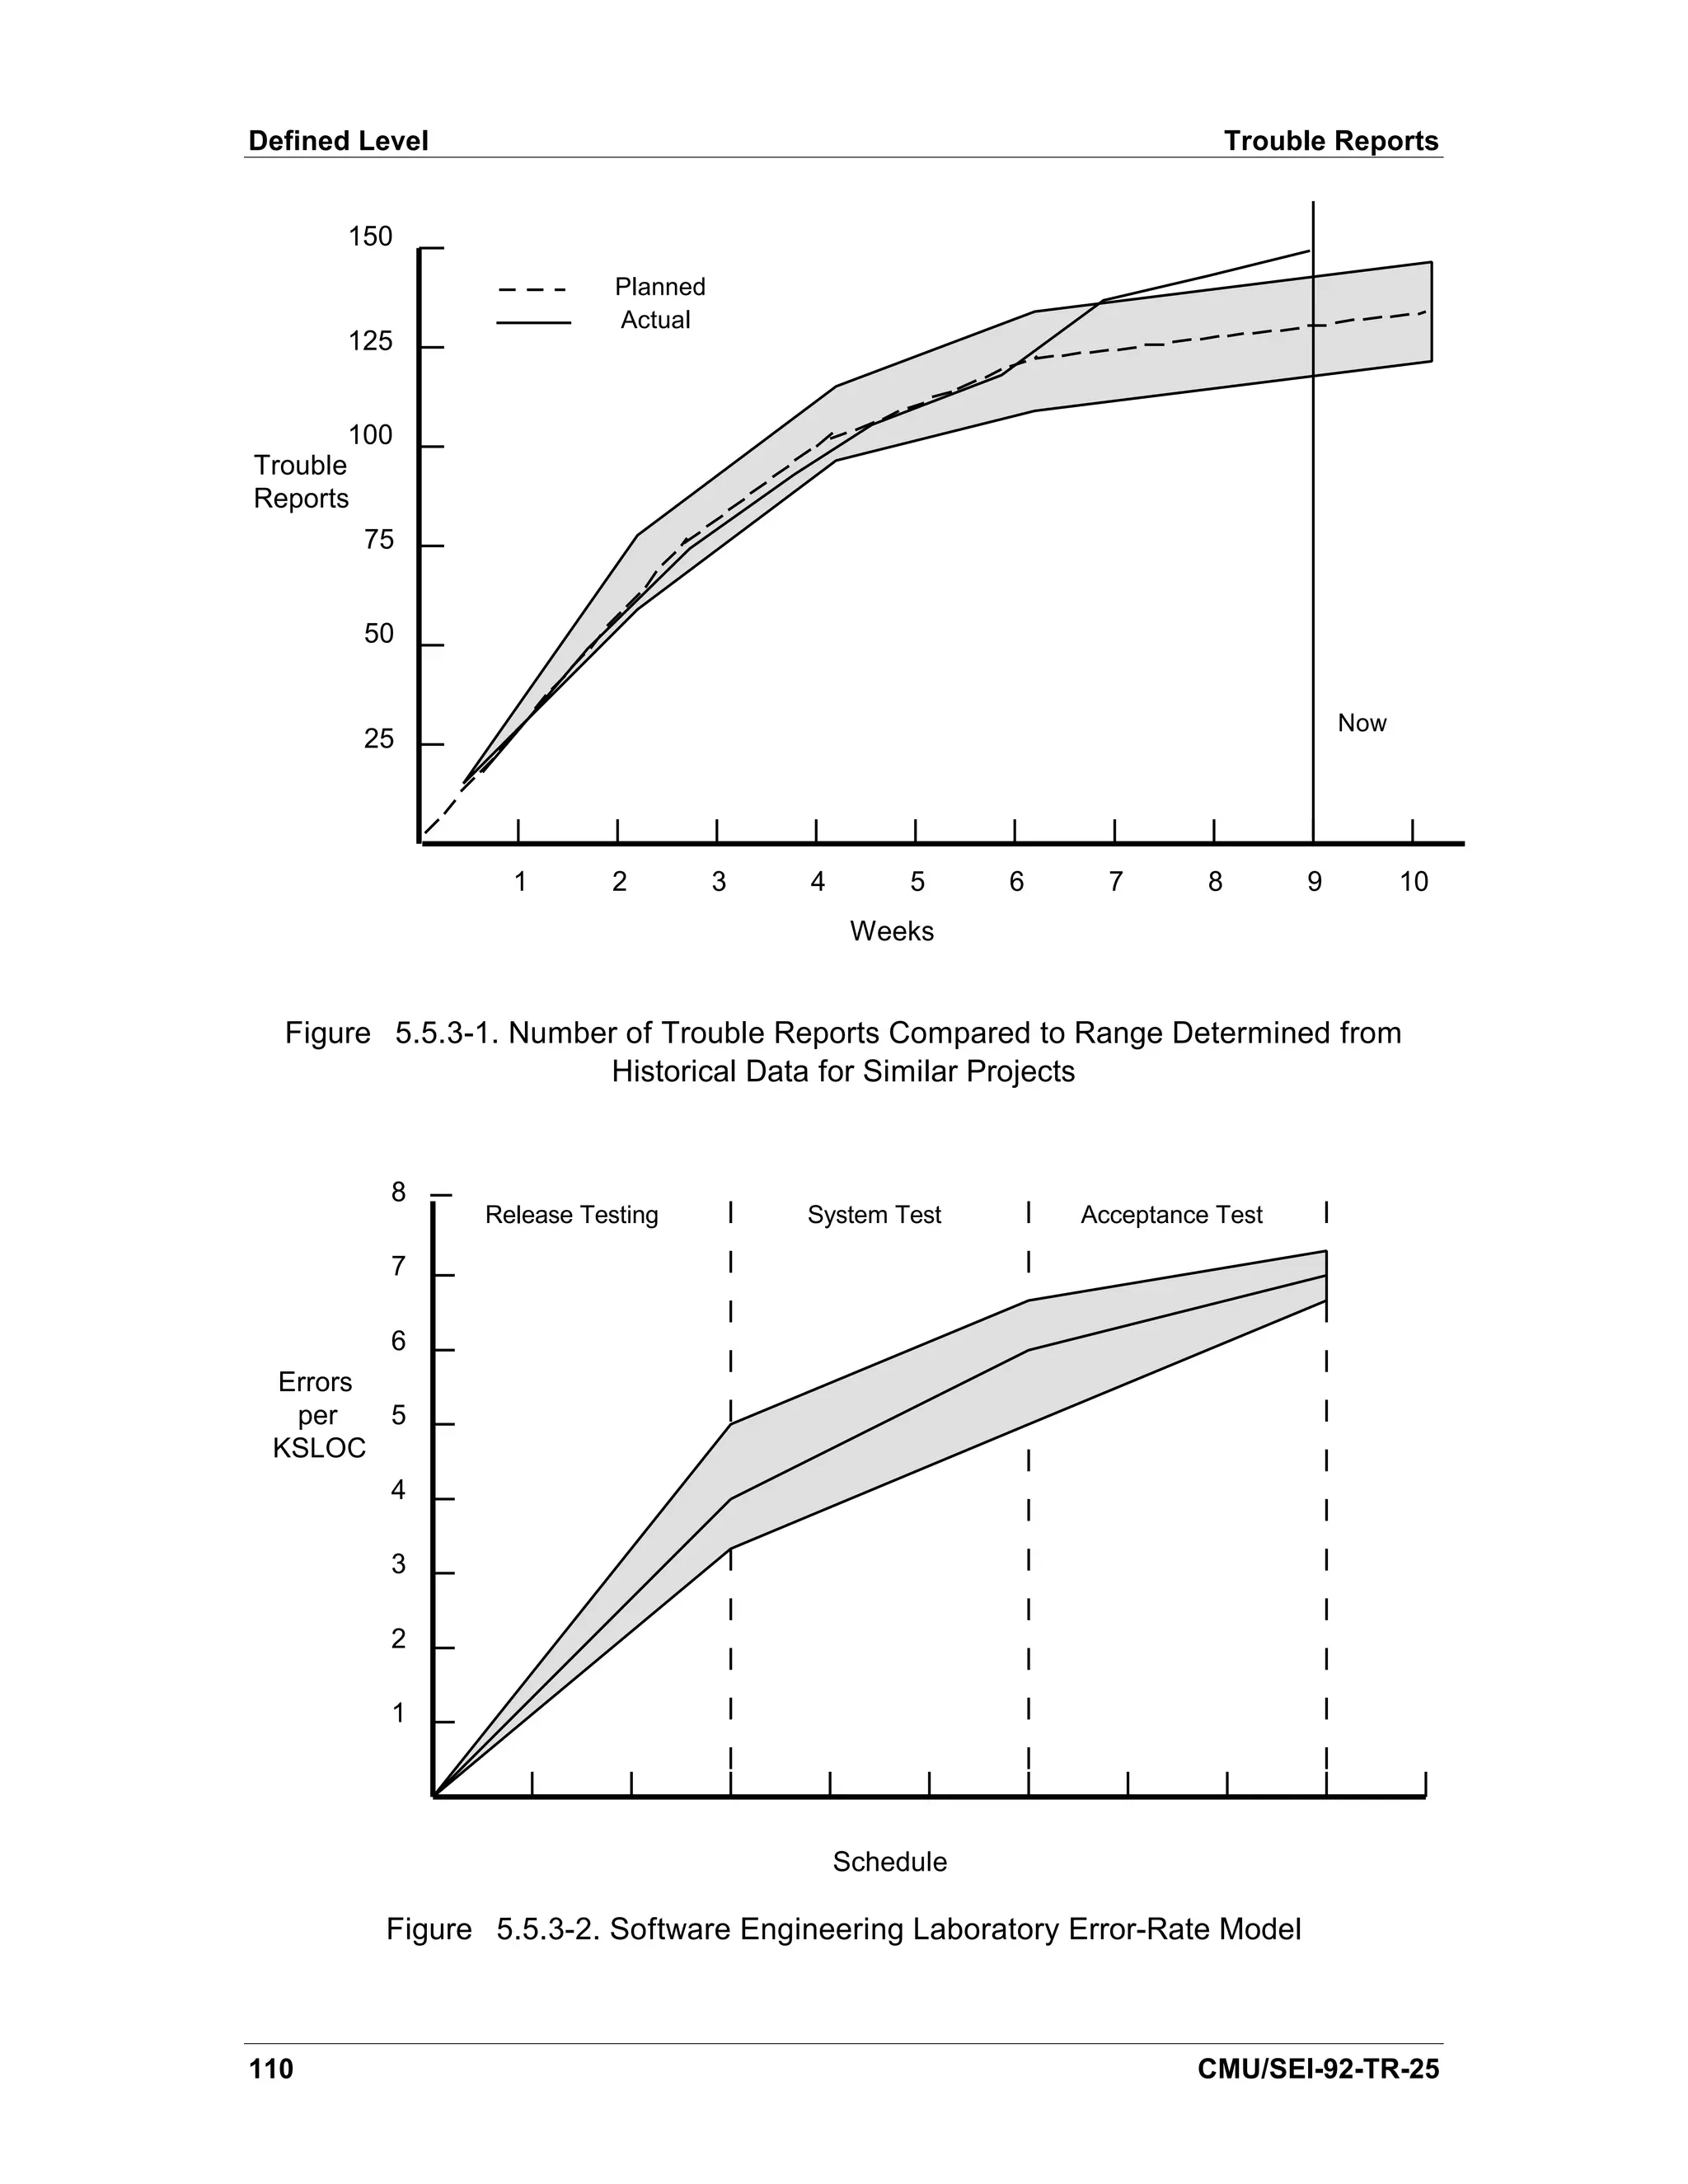
Figure 5.5.3-1 compares the total number of trouble reports written against the range of
the average total number of trouble reports written per week obtained from historical
data. The project software manager needs to determine why at week 7 this CSCI
started to exceed the norm. Did the test team postpone the start of the more complex
tests? Has the quality of the CSCI suddenly decreased? Have the early tests not been
sufficient to detect these defects? How does this CSCI compare to the other CSCIs on
the project? In general, if the number of trouble reports exceeds the upper threshold,
possible causes are unreliable software, misinterpreted requirements, or extremely
complex software. If the number of trouble reports is less than the lower threshold,
possible causes are reliable software or inadequate testing.
Figure 5.5.3-2 is an example of what an organization can do with historical data. This
figure (adapted from [Landis 90]) shows the number of errors detected per thousand
source lines of code (KSLOC) for each life-cycle stage for the project and the range
observed from the historical data. Landis et al report that their data in the Software
Engineering Laboratory supports a “ halving” model in which the rate is cut by fifty
percent at each stage [Landis 90]. Typically, their projects have about four errors per
thousand SLOC during build/release testing, two errors per thousand during system
testing, and one error per thousand during acceptance testing.
CMU/SEI-92-TR-25 109](https://image.slidesharecdn.com/softwaremeasuresandthecapabilitymaturitymodel-1992johnh-baumertsei-110103031855-phpapp02/75/Software-measures-and-the-capability-maturity-model-1992-john-h-baumert-sei-127-2048.jpg)
![Trouble Reports Defined Level
Sources
From the Repeatable Level:
[AFSC 87], [Buckley 90], [Card 90], [Decker 91], [Grady 87], [IEEE 1061], [Landis 90],
[Pfleeger 89], and [Rozum 92] discuss trouble reports.
[Florac 92] has a thorough discussion of trouble reports and serves as the main source
of information for this section.
From the Defined Level:
[Florac 92] has a thorough discussion of problem reports.
[IEEE 1044] was used to determine the inputs for this indicator.
CMU/SEI-92-TR-25 113](https://image.slidesharecdn.com/softwaremeasuresandthecapabilitymaturitymodel-1992johnh-baumertsei-110103031855-phpapp02/75/Software-measures-and-the-capability-maturity-model-1992-john-h-baumert-sei-131-2048.jpg)

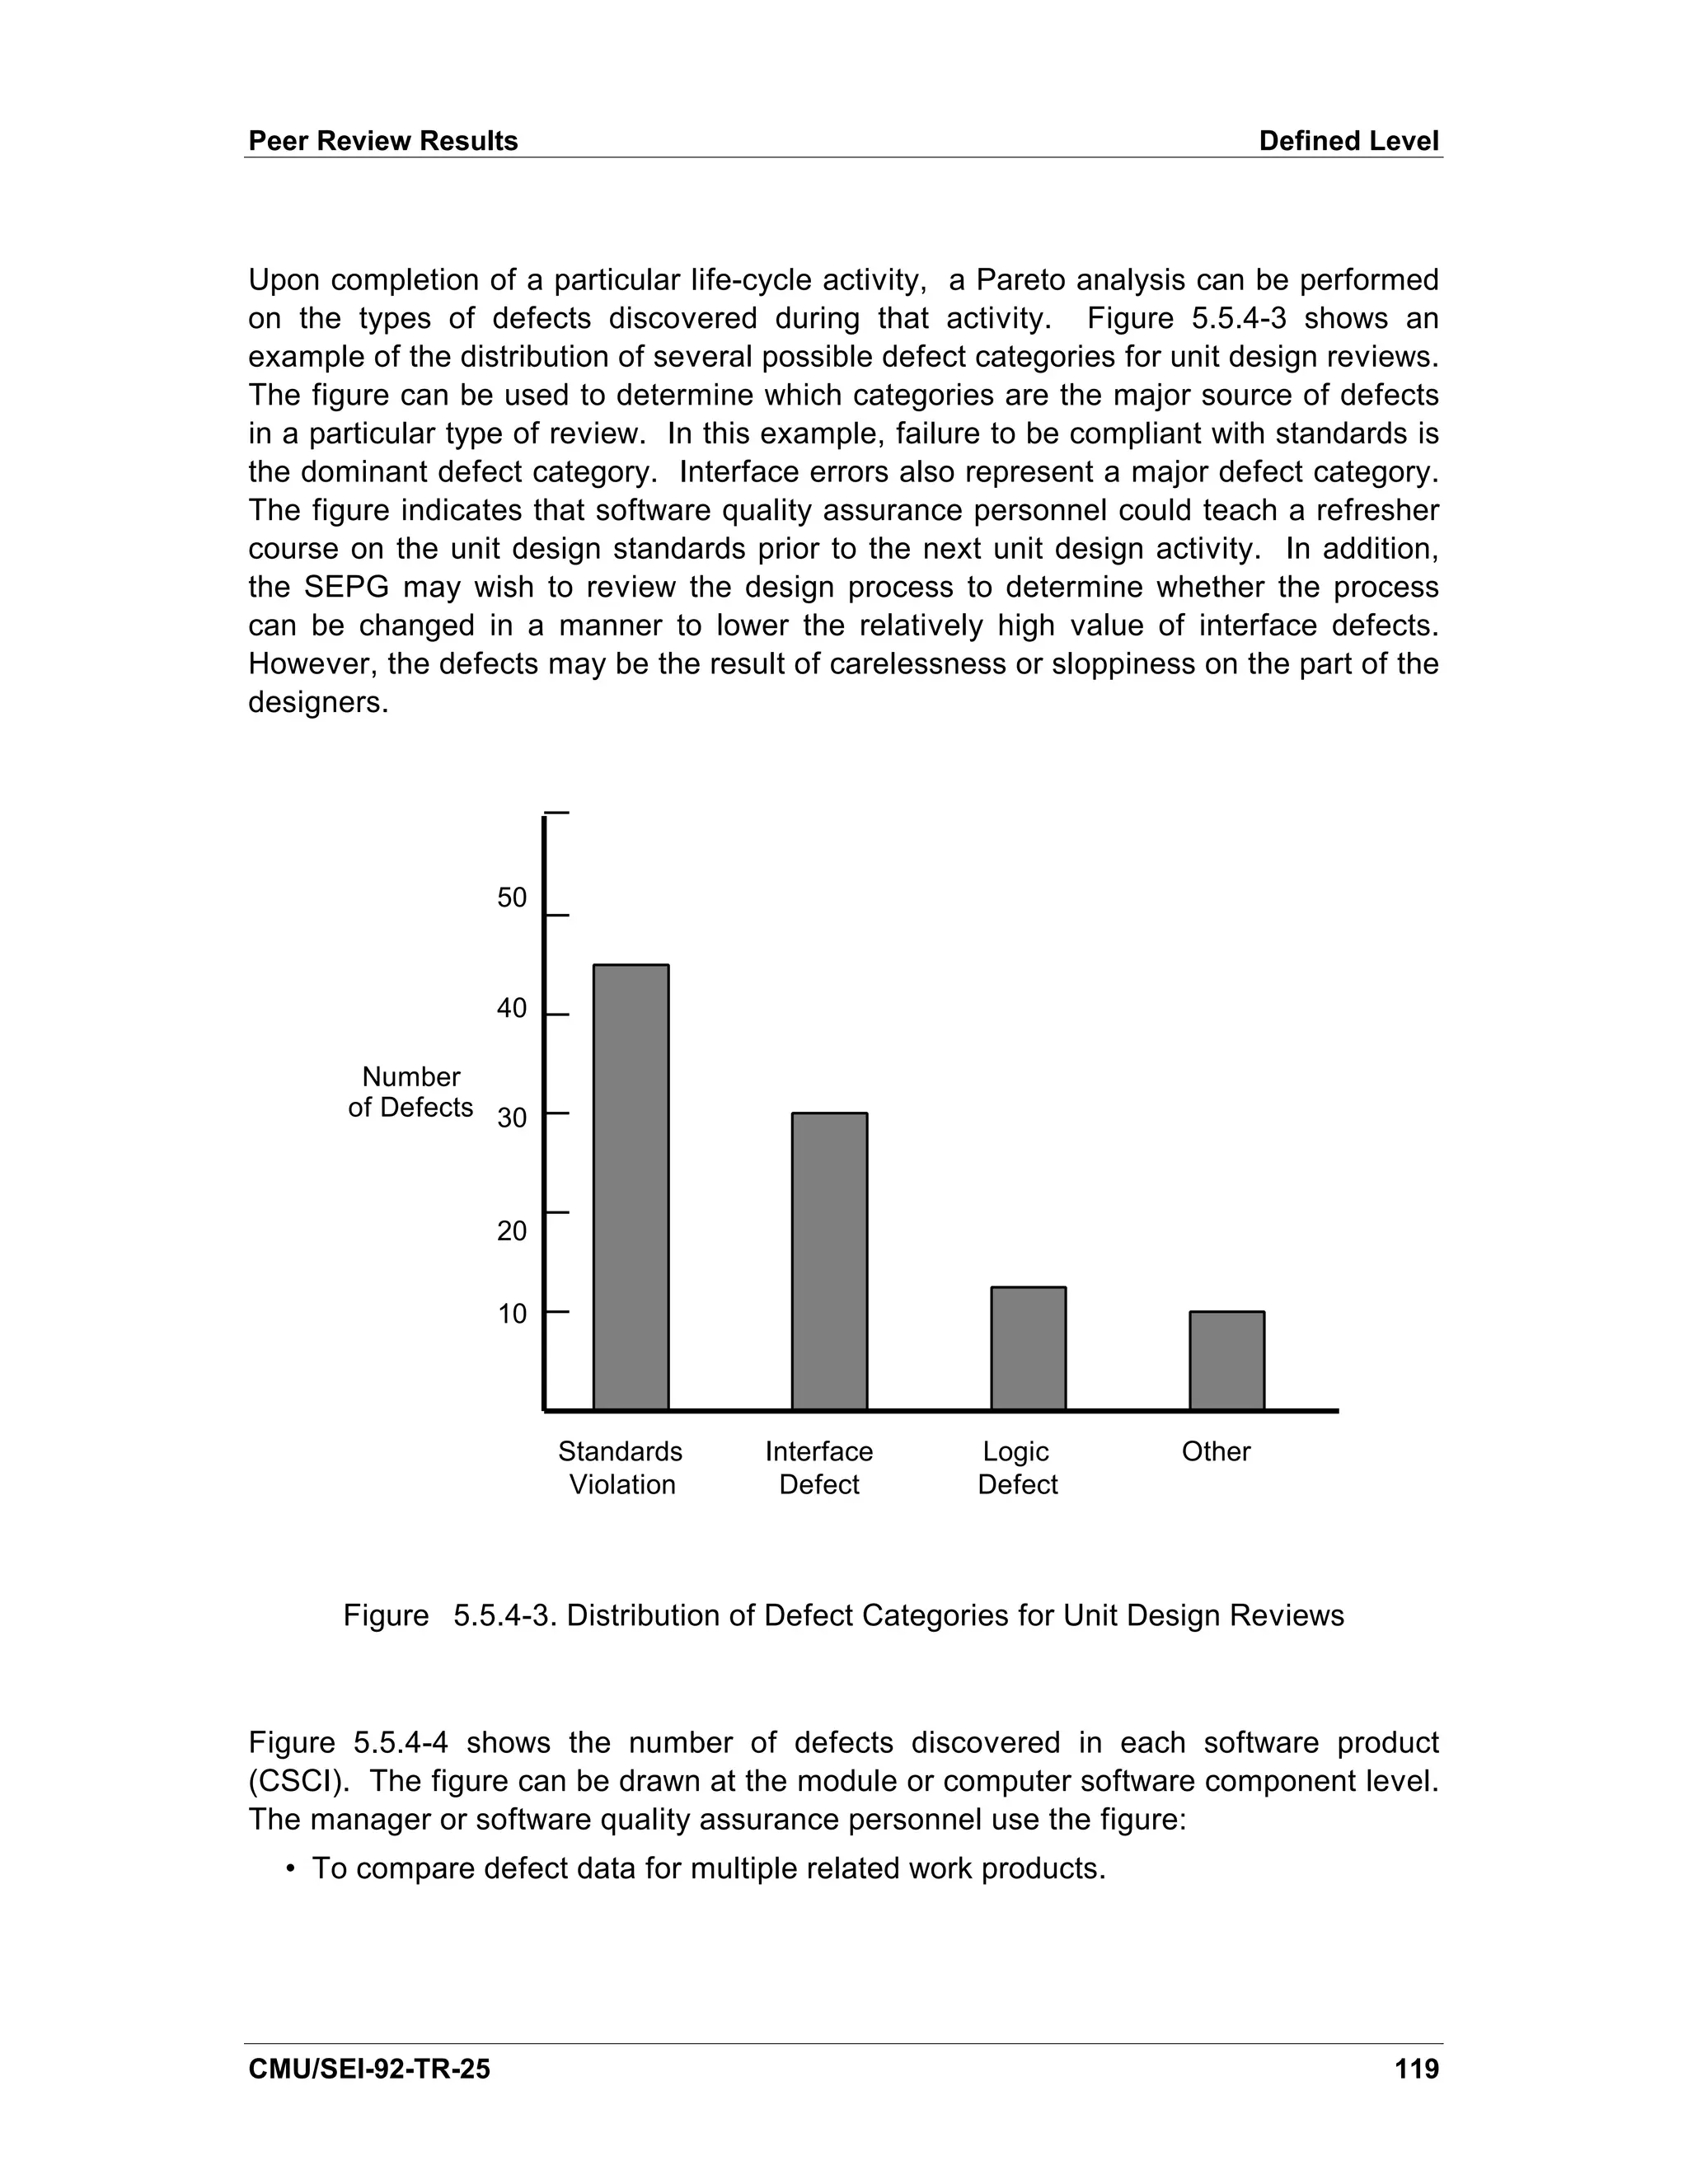
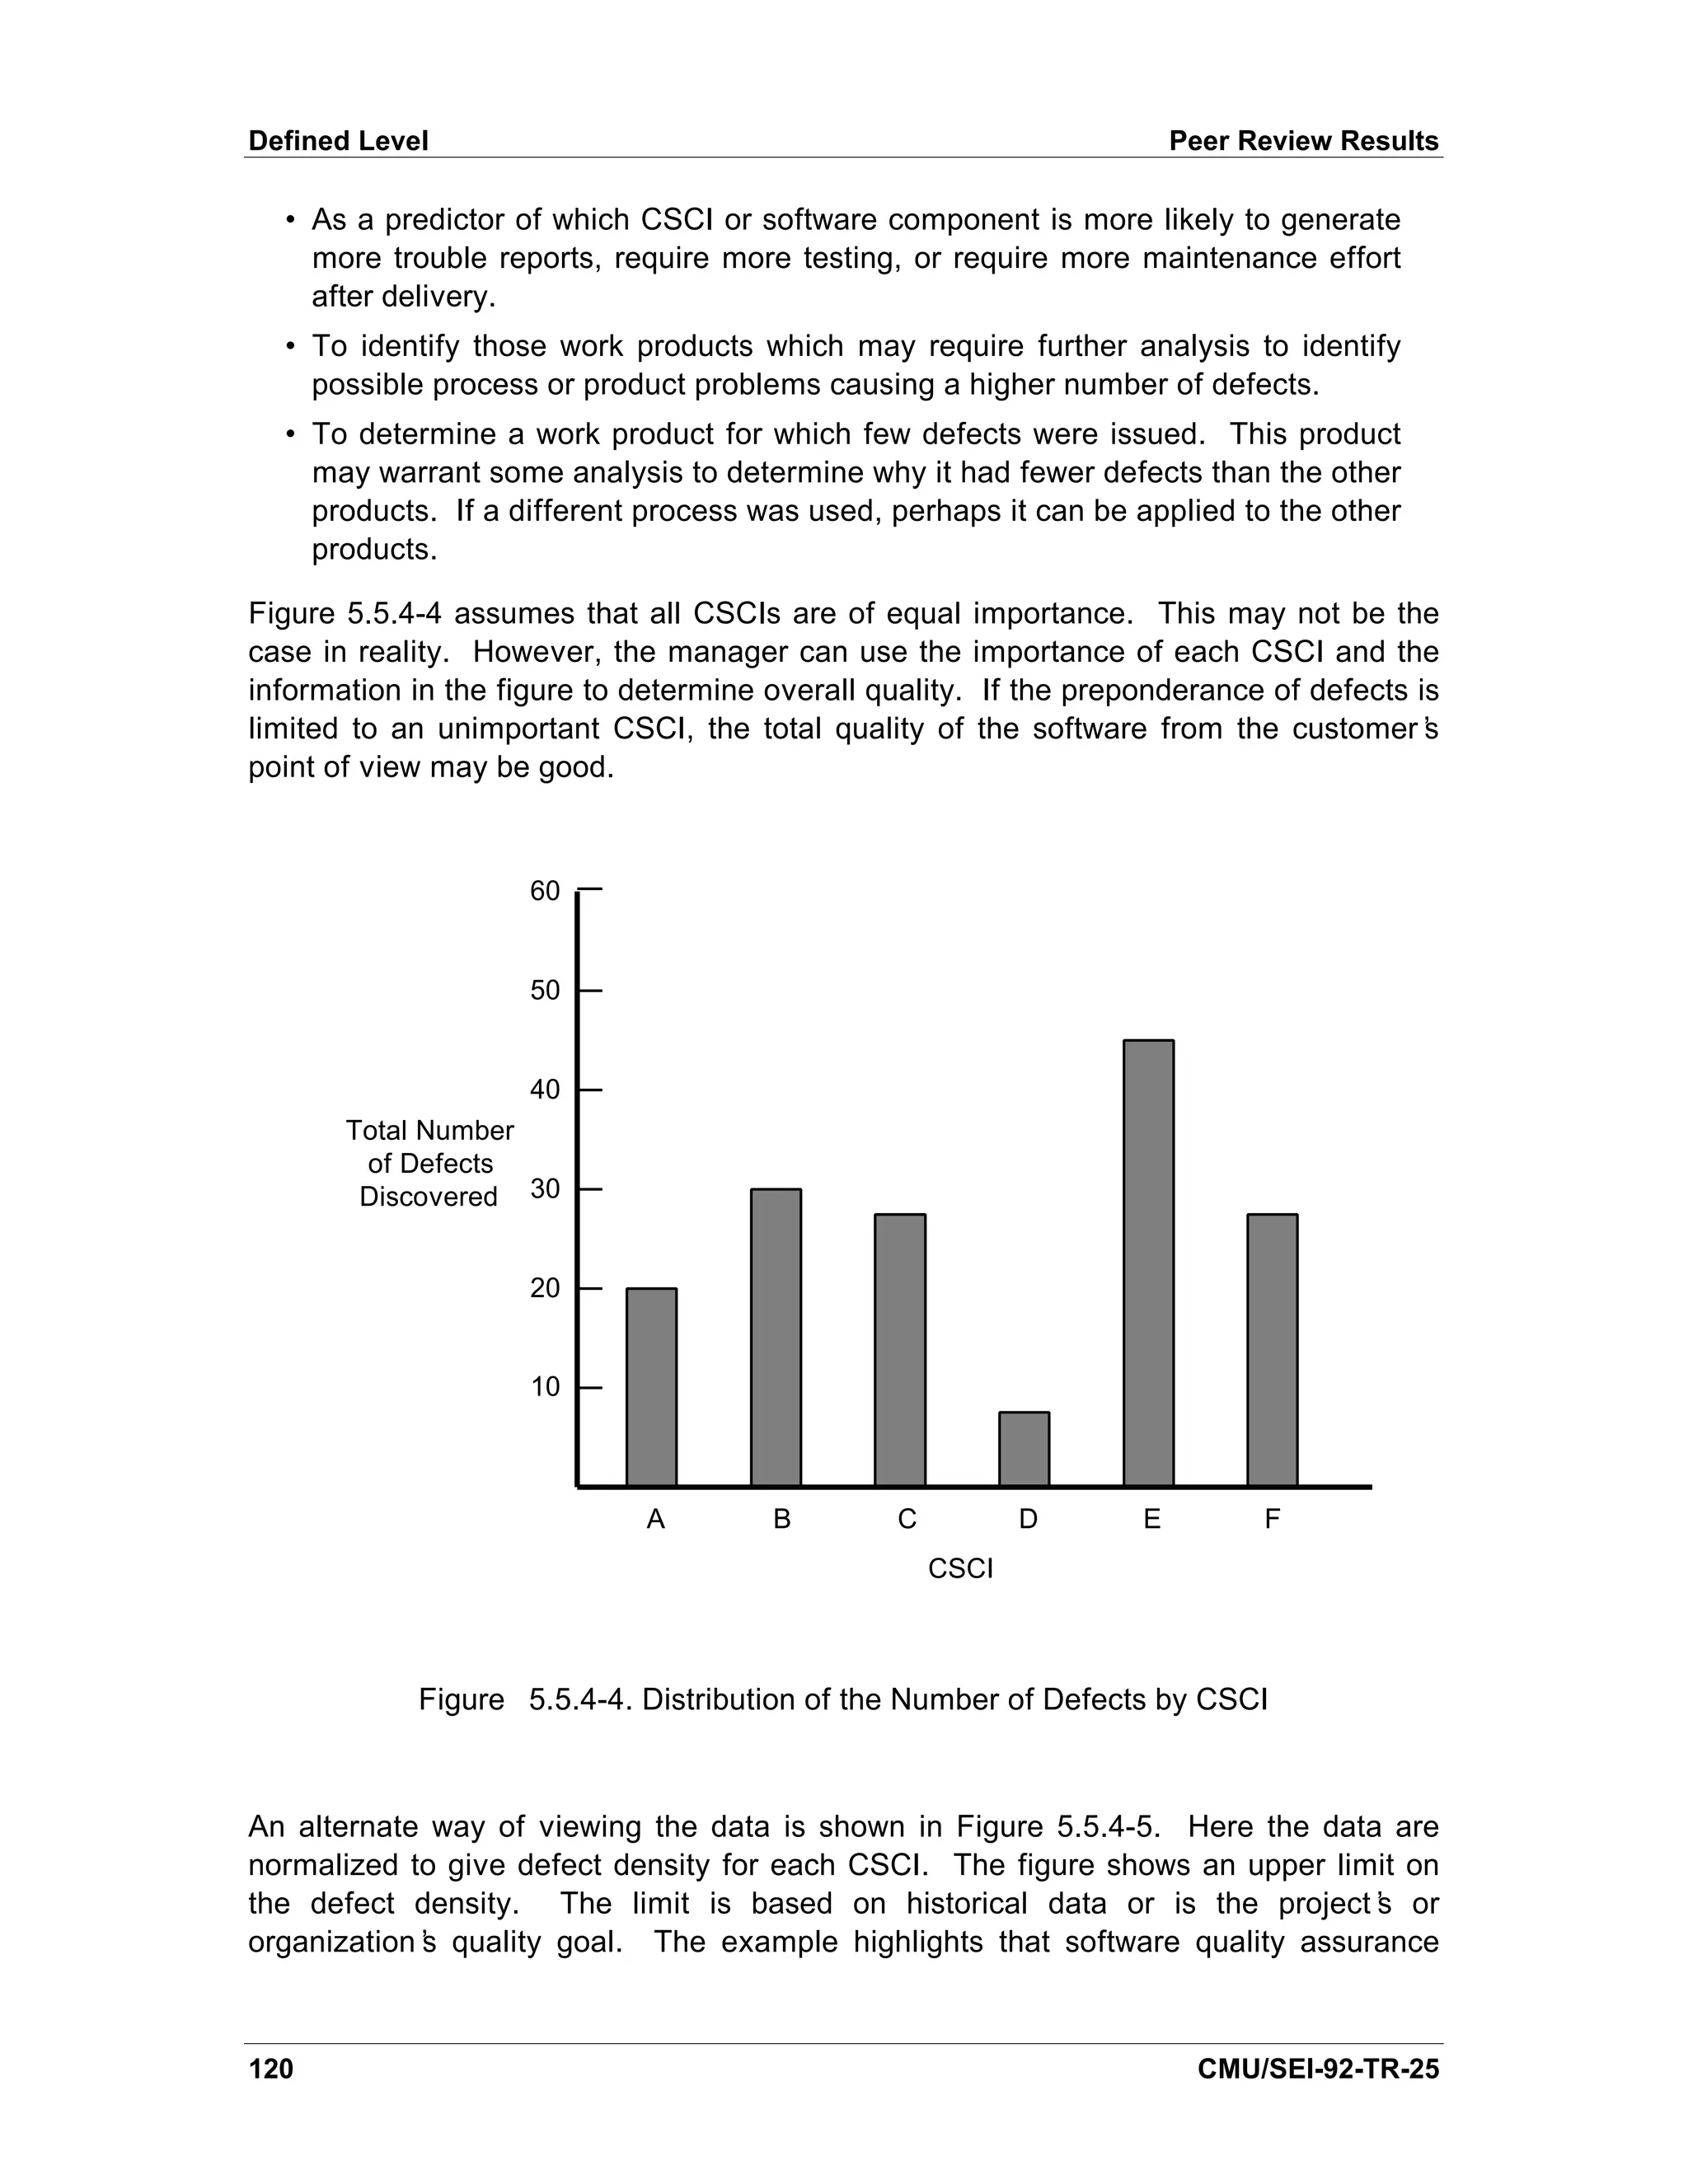
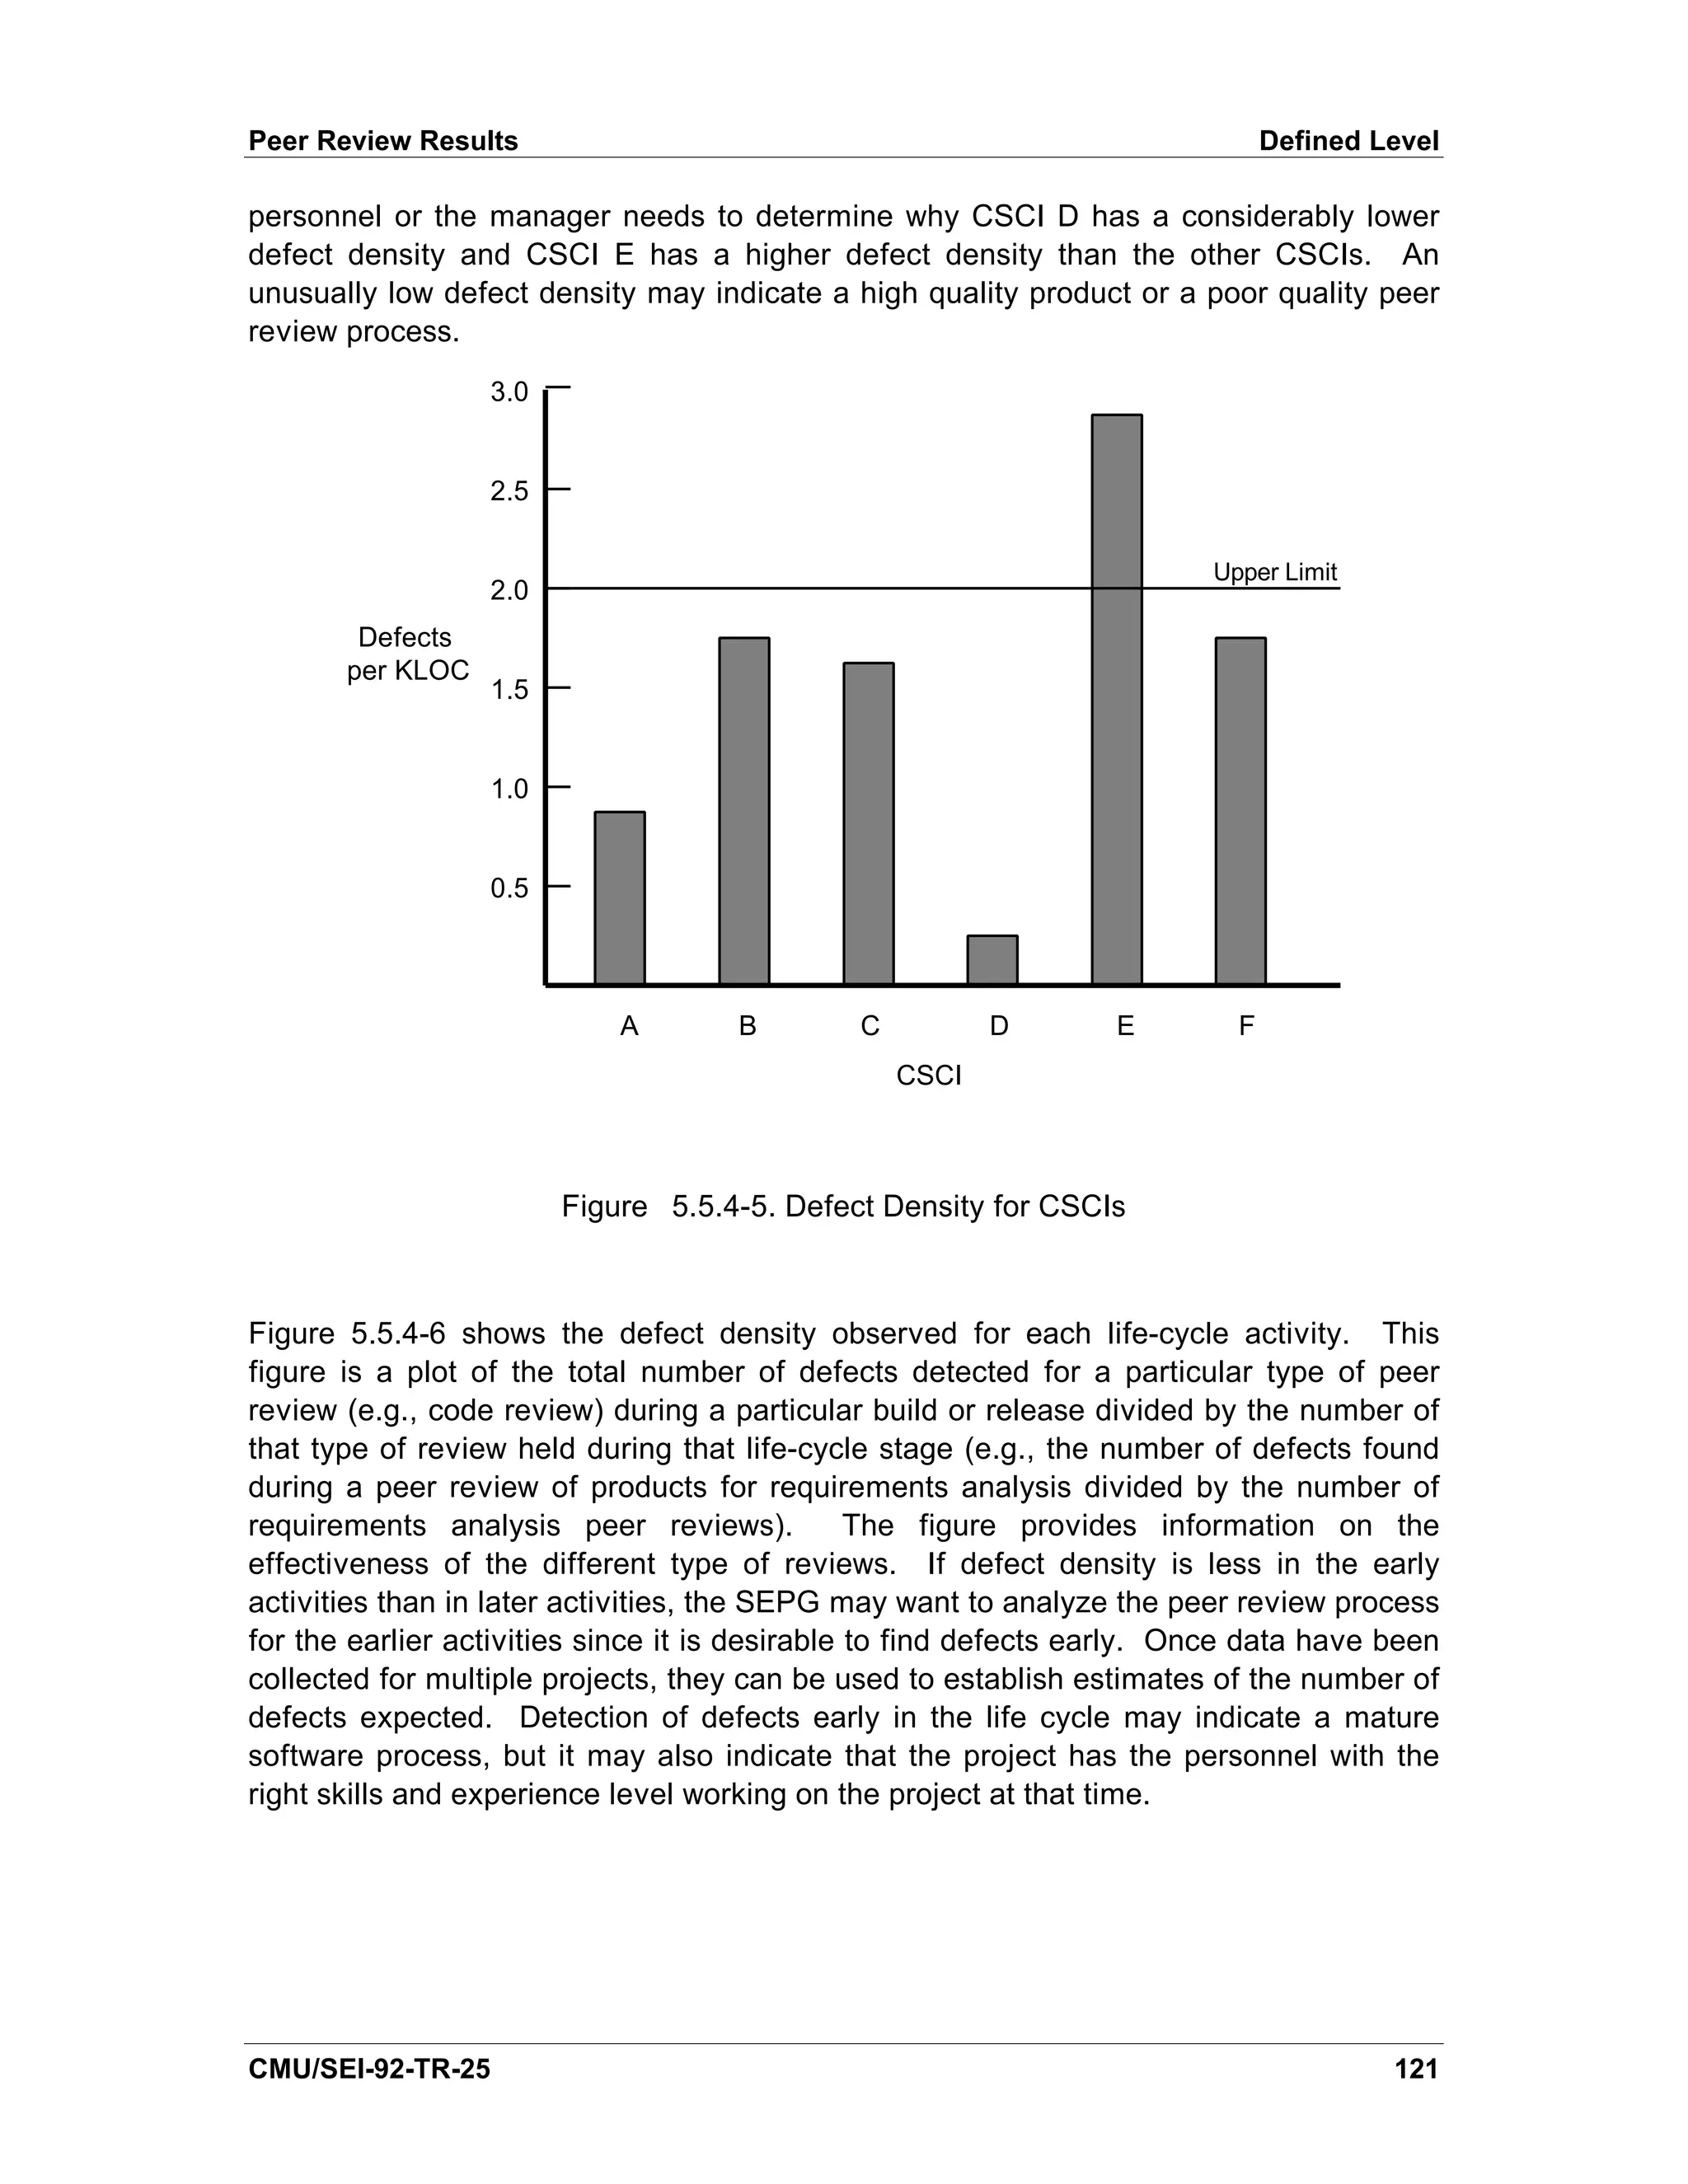
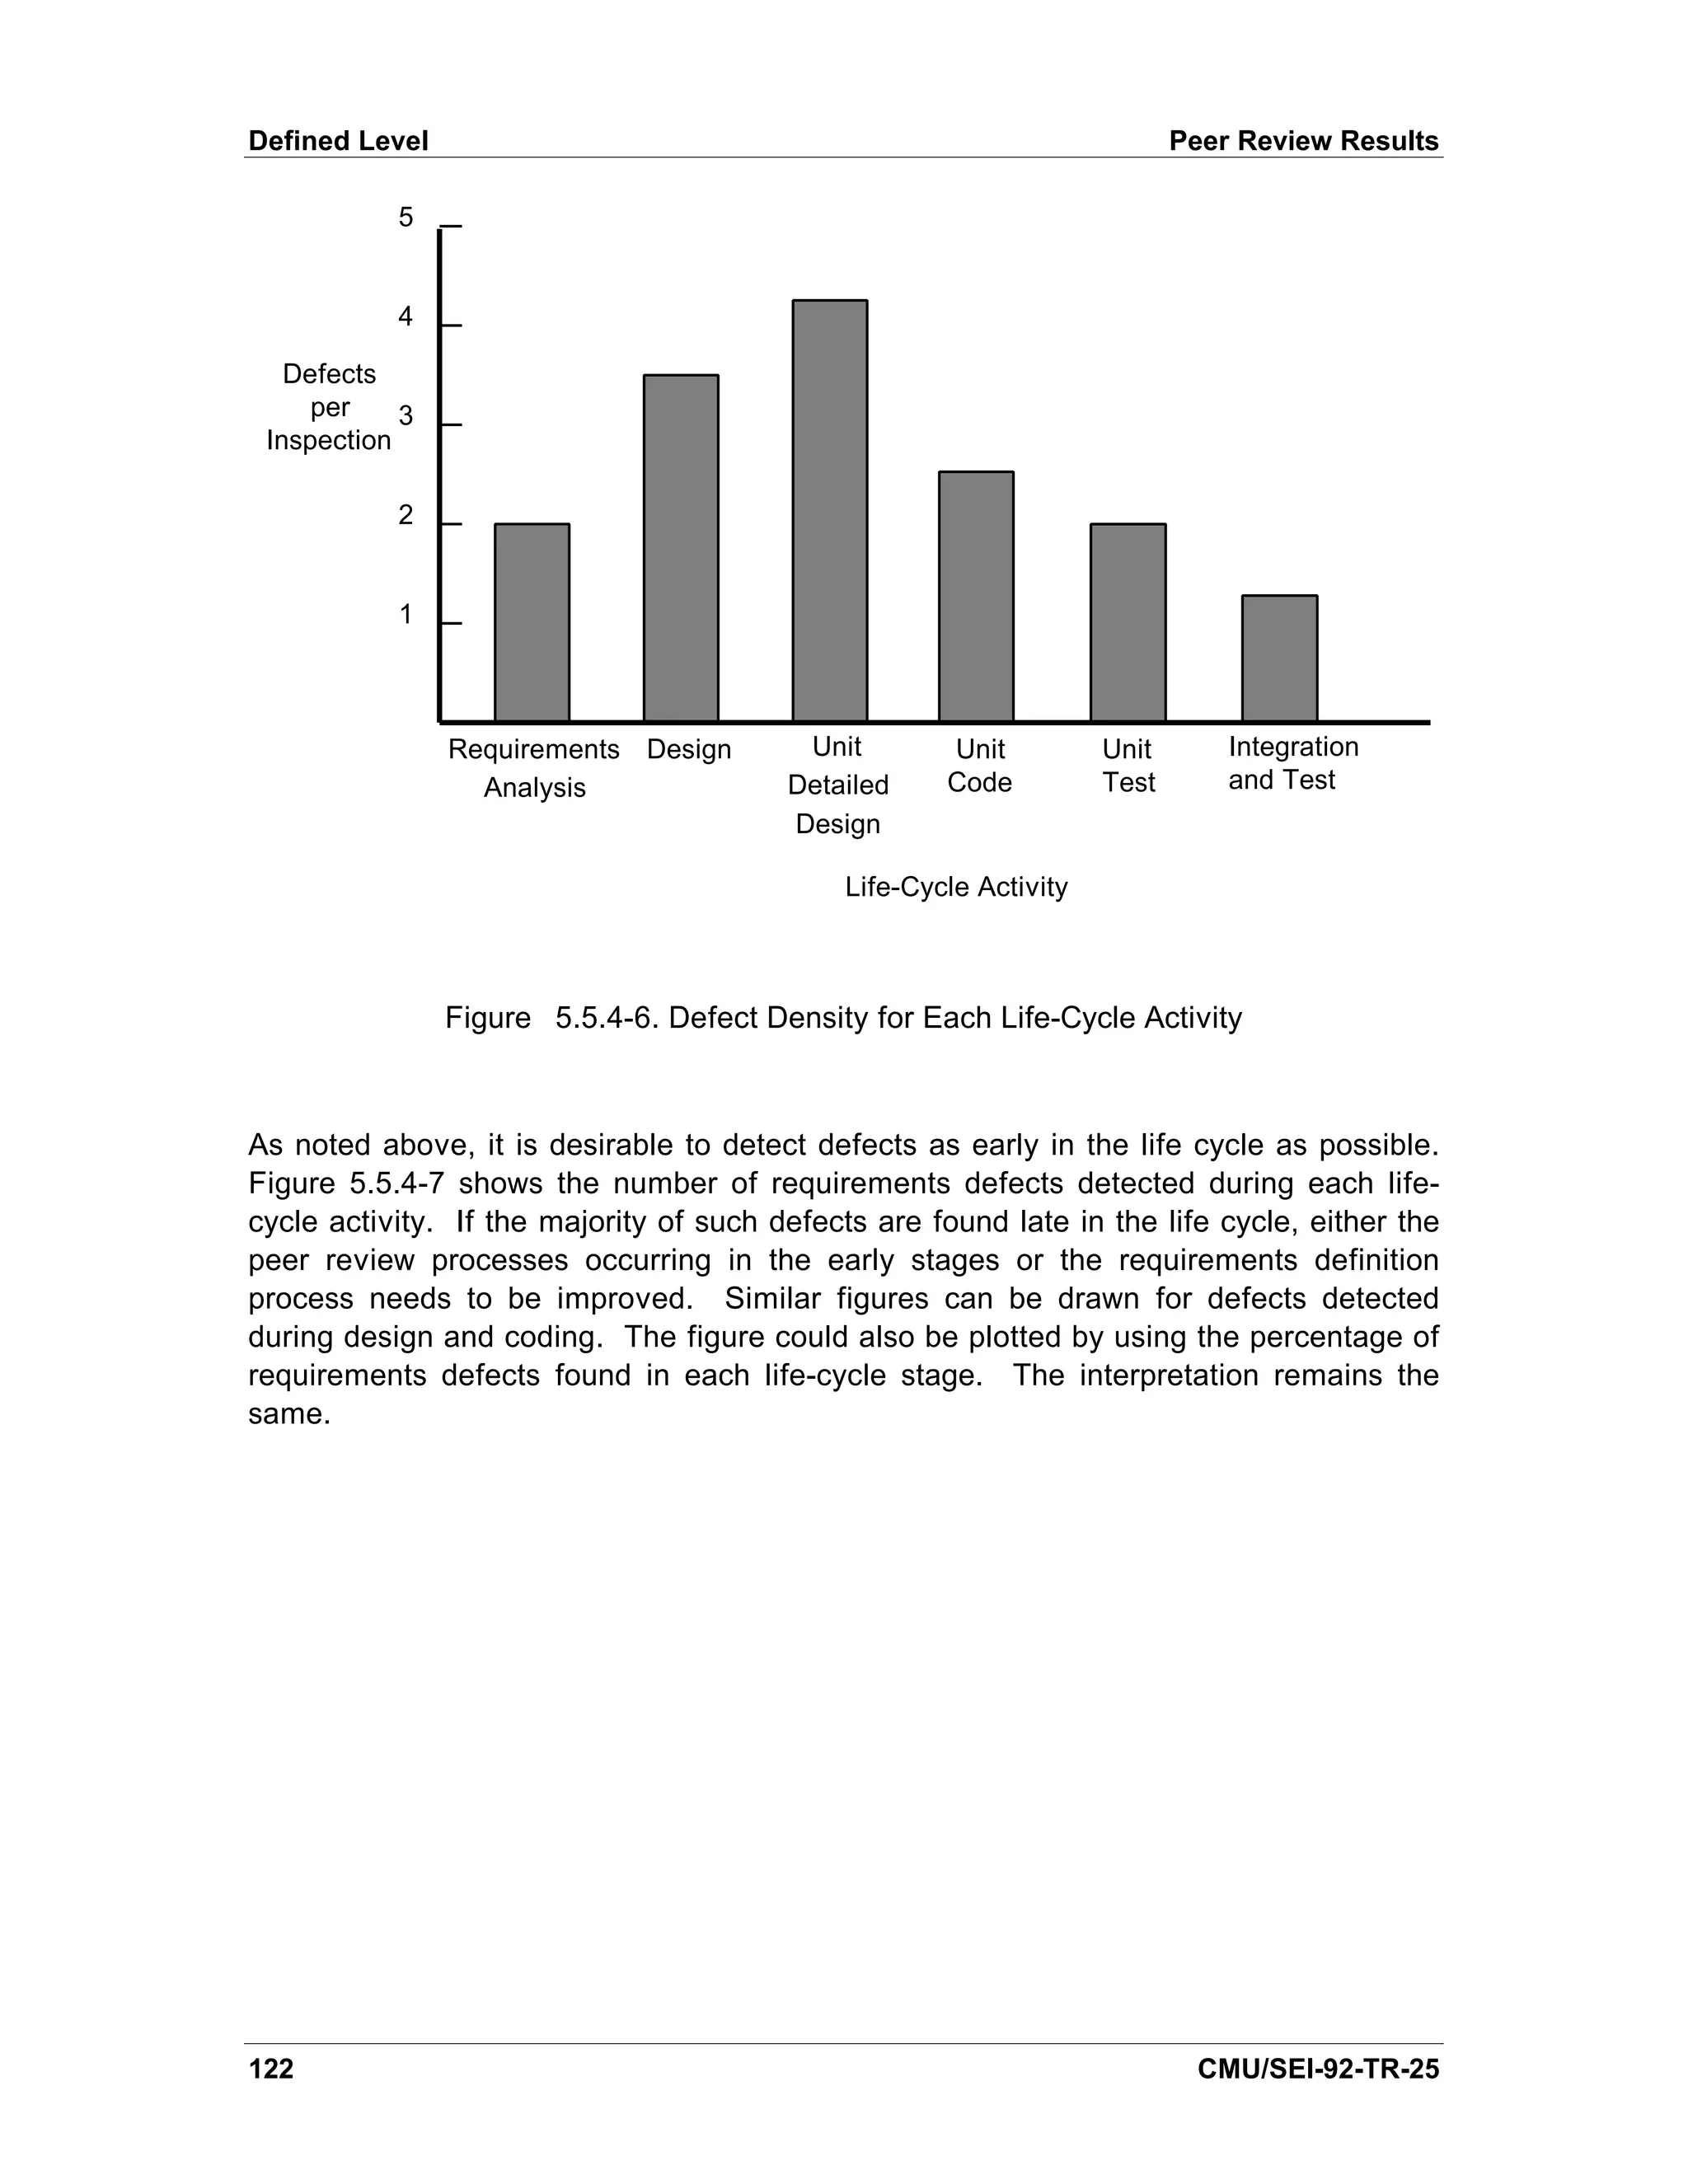
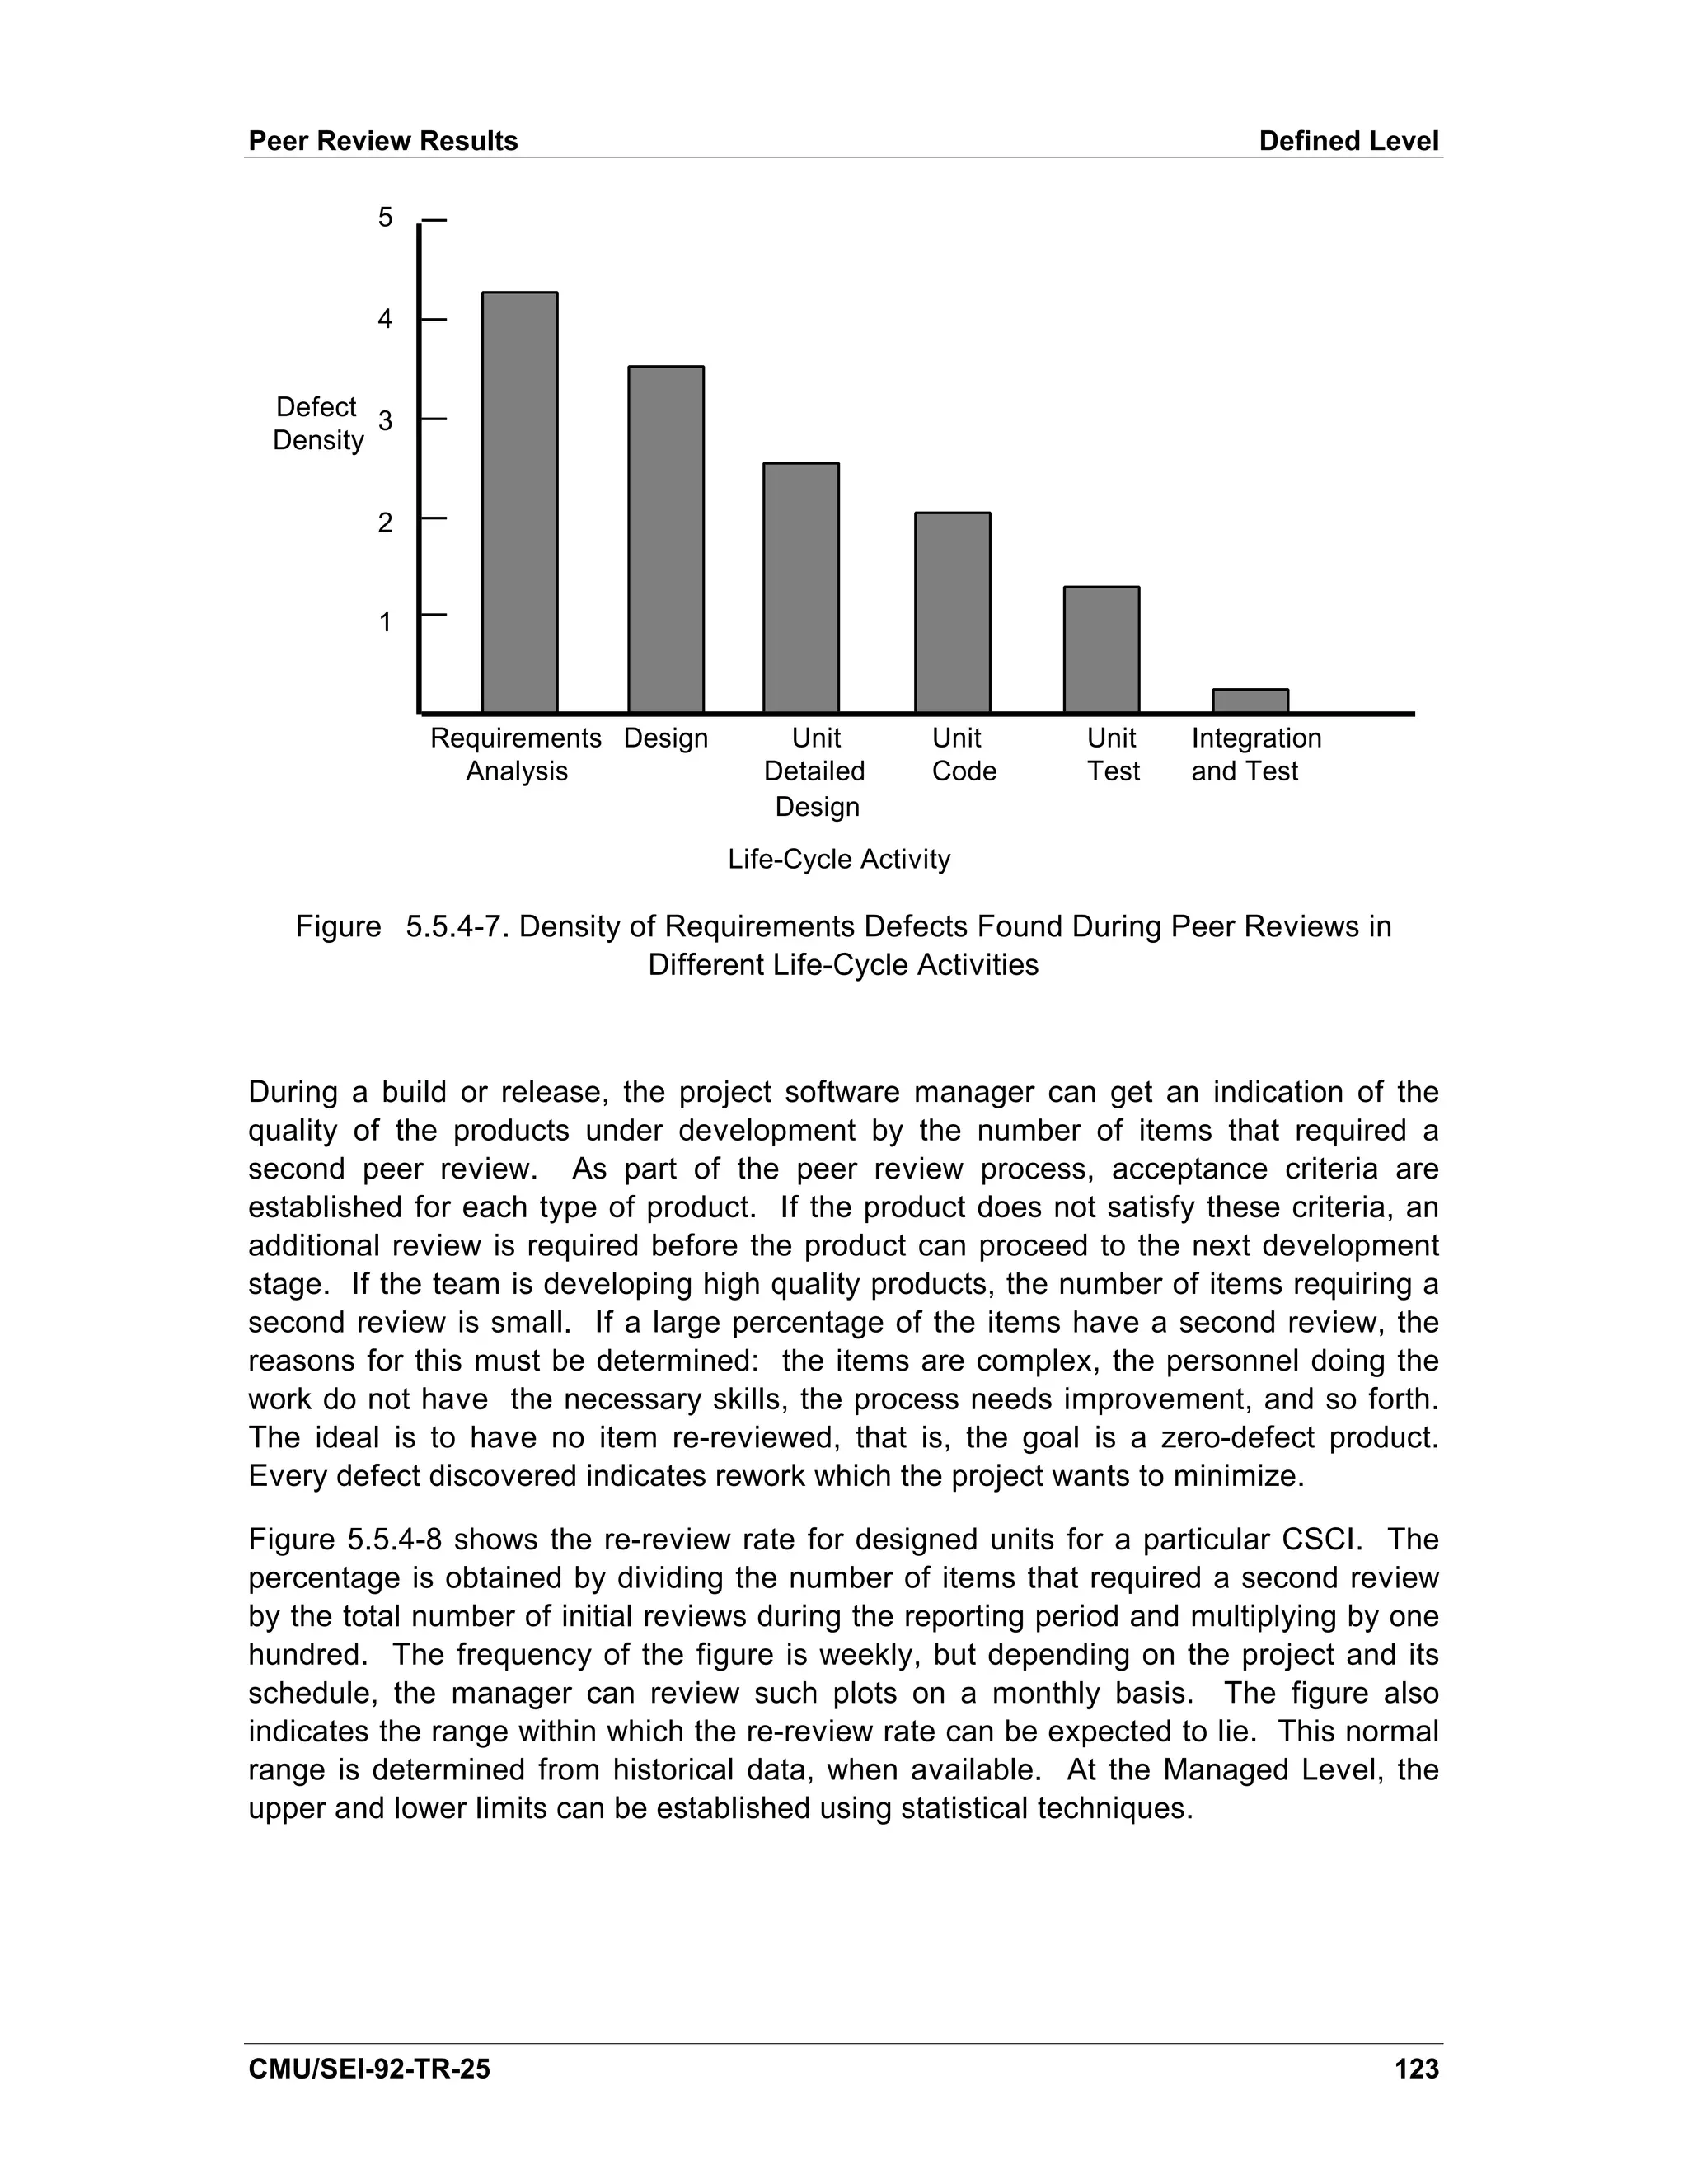
![Peer Review Results Defined Level
60
50
% of
Defects
Detected 40
in Peer
Reviews
30
20
10
1 2 3 4 5 6 7 8 9 10
Months
Figure 5.5.4-9. Peer Review Efficiency
Sources
[Decker 91] and [Florac 92] were the major sources of information for this section.
[AFSC 87], [Buckley 90], [Card 90], [Grady 87], [IEEE 1061], [Landis 90], [Pfleeger 89],
and [Rozum 92] discuss concepts on tracking and analyzing trouble reports that are
applicable to peer review data.
[IEEE 1044] was consulted for the types of inspection data to be collected.
[Pyzdek 89] discusses Pareto analysis.
CMU/SEI-92-TR-25 125](https://image.slidesharecdn.com/softwaremeasuresandthecapabilitymaturitymodel-1992johnh-baumertsei-110103031855-phpapp02/75/Software-measures-and-the-capability-maturity-model-1992-john-h-baumert-sei-143-2048.jpg)
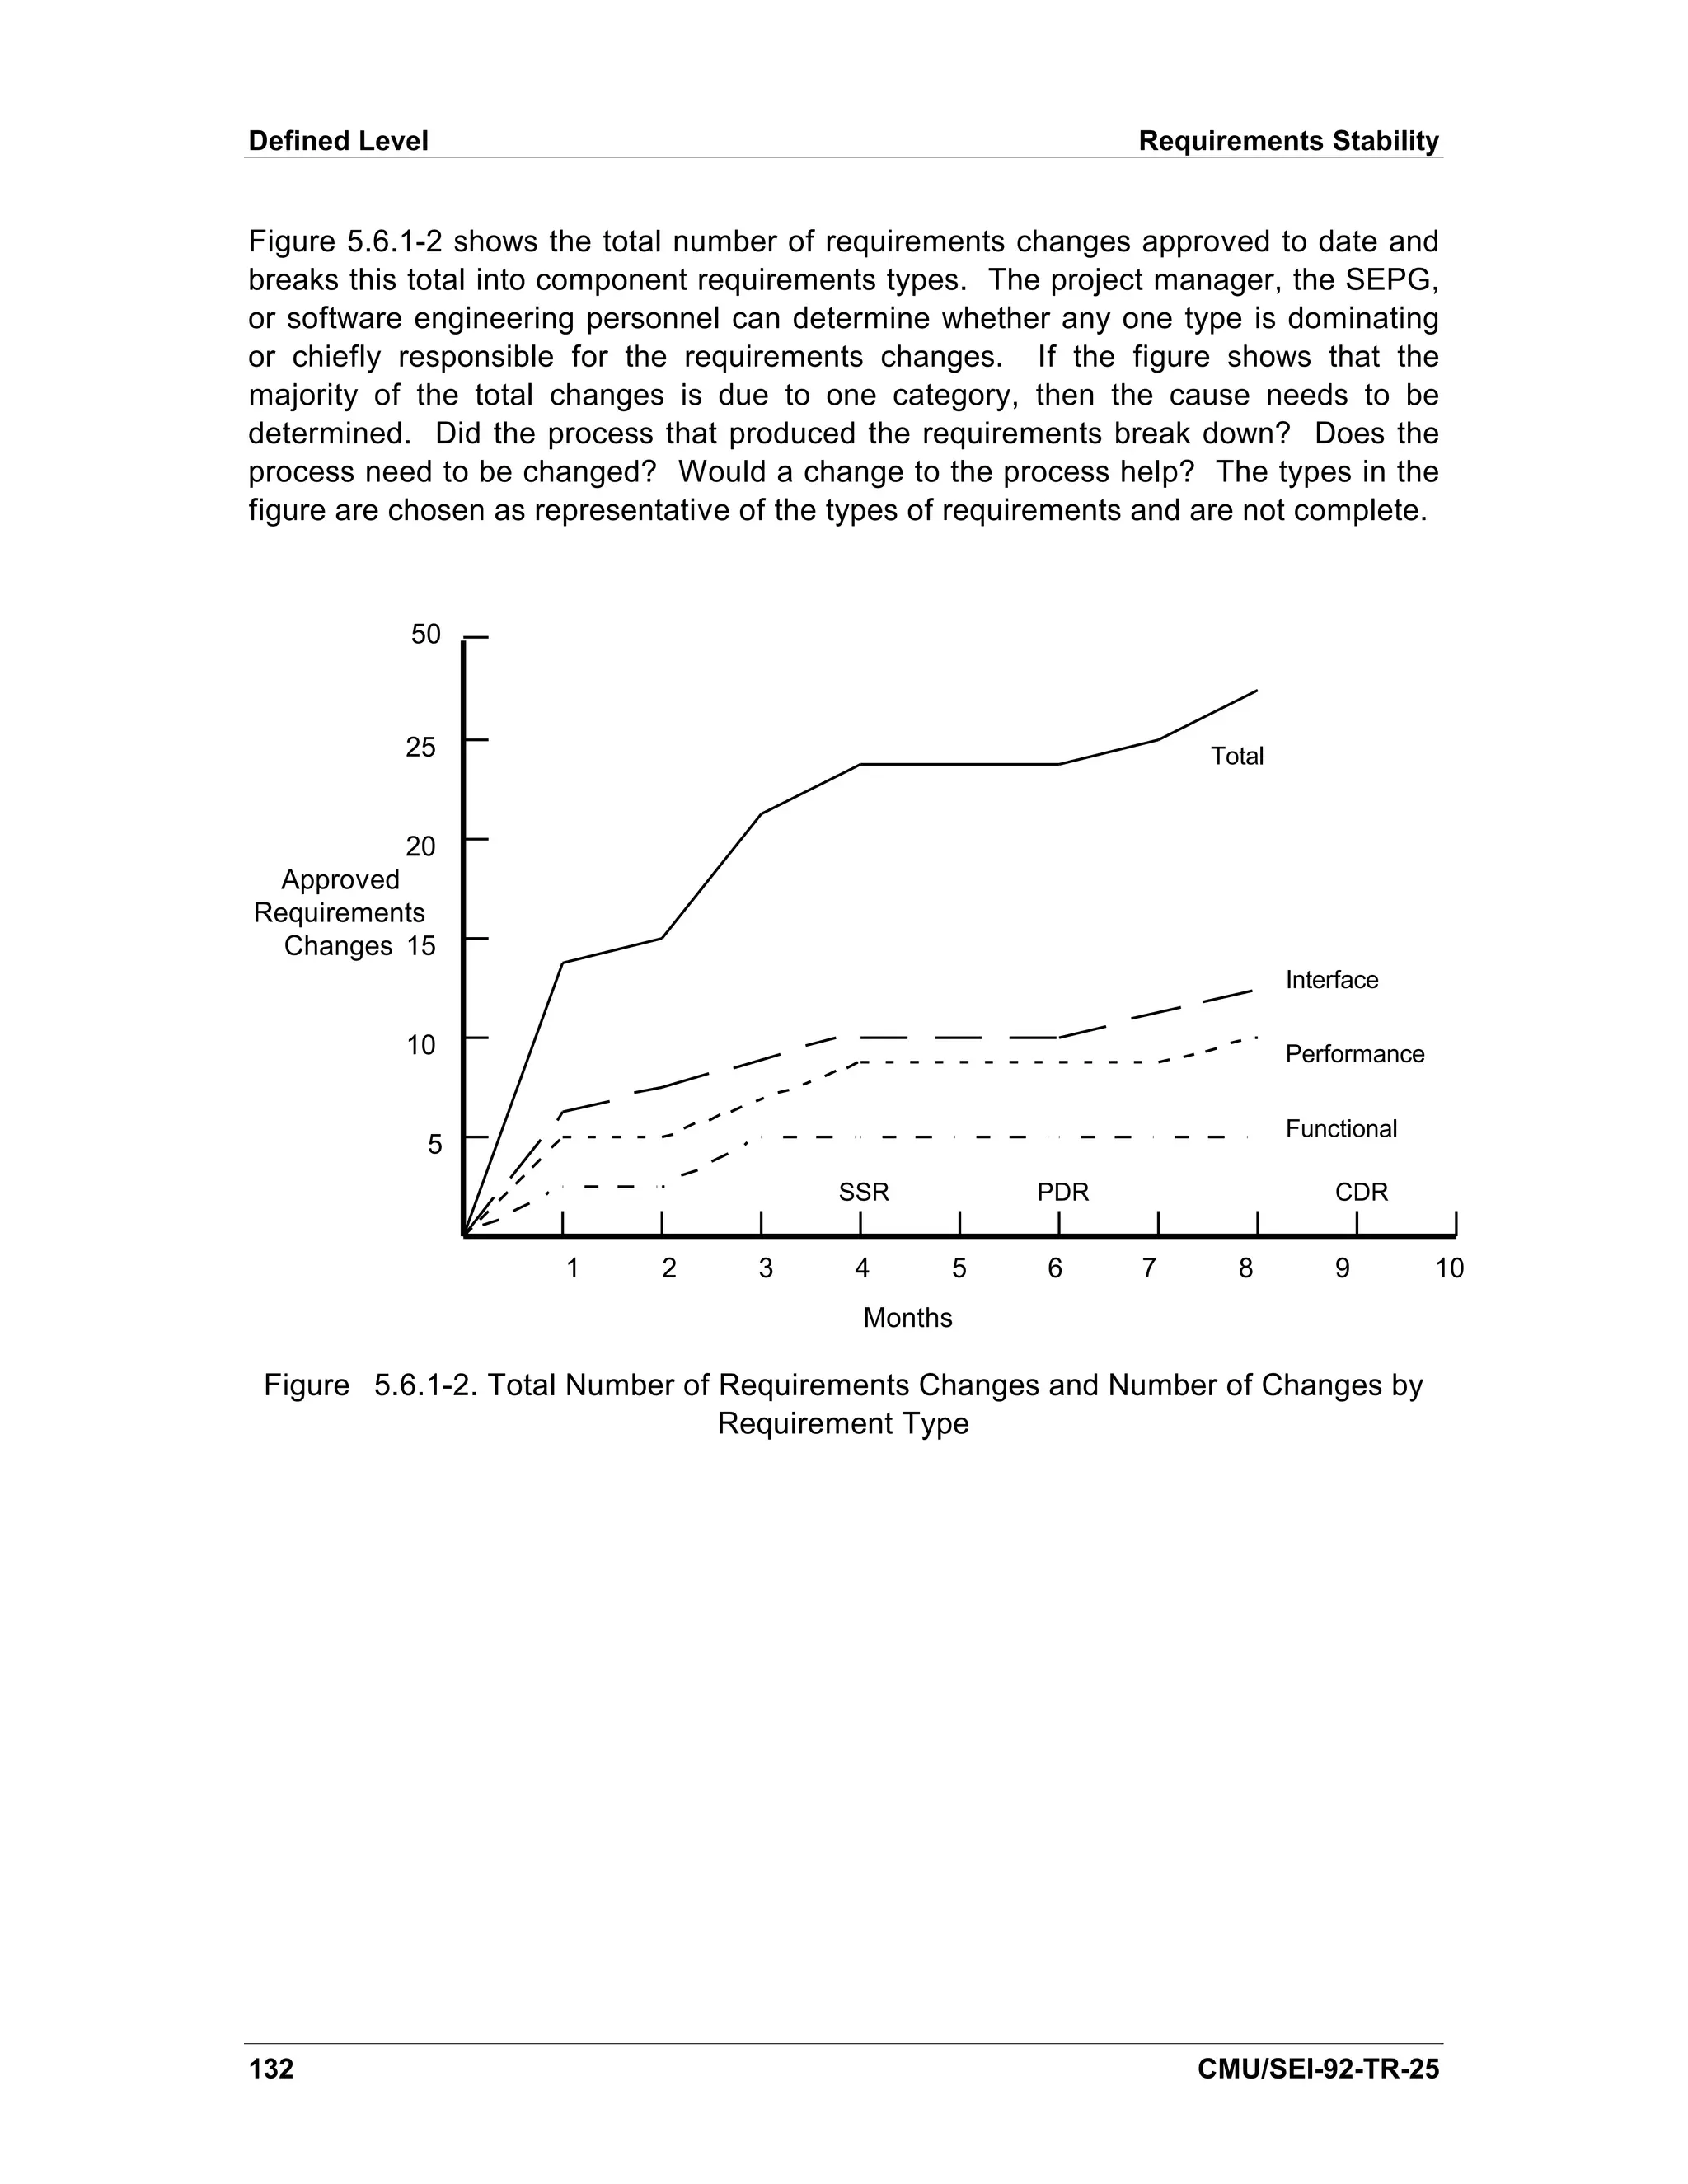
![Requirements Stability Defined Level
Sources
[AFSC 86] has a similar indicator that uses software size.
[Decker 91] discusses a software volatility/software requirements measure.
[Grady 87] uses a requirements stability as an input to Hewlett-Packard’ difficulty
s
metric.
[Landis 90] has two indicators that are related to this but use software size in their trend
chart.
[Pfleeger 89] discusses a requirements volatility metric.
[Schultz 88] discusses a software volatility metric.
CMU/SEI-92-TR-25 135](https://image.slidesharecdn.com/softwaremeasuresandthecapabilitymaturitymodel-1992johnh-baumertsei-110103031855-phpapp02/75/Software-measures-and-the-capability-maturity-model-1992-john-h-baumert-sei-153-2048.jpg)

![Size Stability Defined Level
Figure 5.6.2-2 shows an alternate way to analyze the size growth data. The figure is
based on the work of Landis et al and shows the Software Engineering Laboratory
(SEL) Size Estimate Model [Landis 90]. Growth is expressed as a percentage and is
determined at key points in the life cycle. Their data show that as the details of the
unknown portions of the requirements (the to-be-determineds) become known, the size
growth grows more rapidly. Hence, the range of accepted growth narrows as the
system becomes better defined.
+50
+40
+30
+20
+10
Size
Growth 0
%
-10 PDR
-20
System Acceptance
Design Implementation Test Test
3 6 9 12 15 18 21 24 27 30
Months
Figure 5.6.2-2. Software Size Growth
If the actual growth is greater than planned, the manager can look for an incomplete
design (especially during implementation) or numerous changes in the requirements.
The manager can use the requirements stability indicator for the latter. If there is little
or no growth in the size estimate after the preliminary design reviews, the project may
be fortunate to have an experienced team that is familiar with the application and/or
has a set of stable, well-defined requirements. The manager can use the requirements
stability indicator or the effort indicator to verify these assumptions.
CMU/SEI-92-TR-25 139](https://image.slidesharecdn.com/softwaremeasuresandthecapabilitymaturitymodel-1992johnh-baumertsei-110103031855-phpapp02/75/Software-measures-and-the-capability-maturity-model-1992-john-h-baumert-sei-157-2048.jpg)
![Defined Level Size Stability
Figures 5.6.2-1 and 5.6.2-2 show the data for the entire project. They can also be
drawn for each CSCI.
Sources
From the Repeatable Level:
[AFSC 86], [Decker 91], [Landis 90], [Pfleeger 89], and [Schultz 88] all discuss tracking
software size.
140 CMU/SEI-92-TR-25](https://image.slidesharecdn.com/softwaremeasuresandthecapabilitymaturitymodel-1992johnh-baumertsei-110103031855-phpapp02/75/Software-measures-and-the-capability-maturity-model-1992-john-h-baumert-sei-158-2048.jpg)
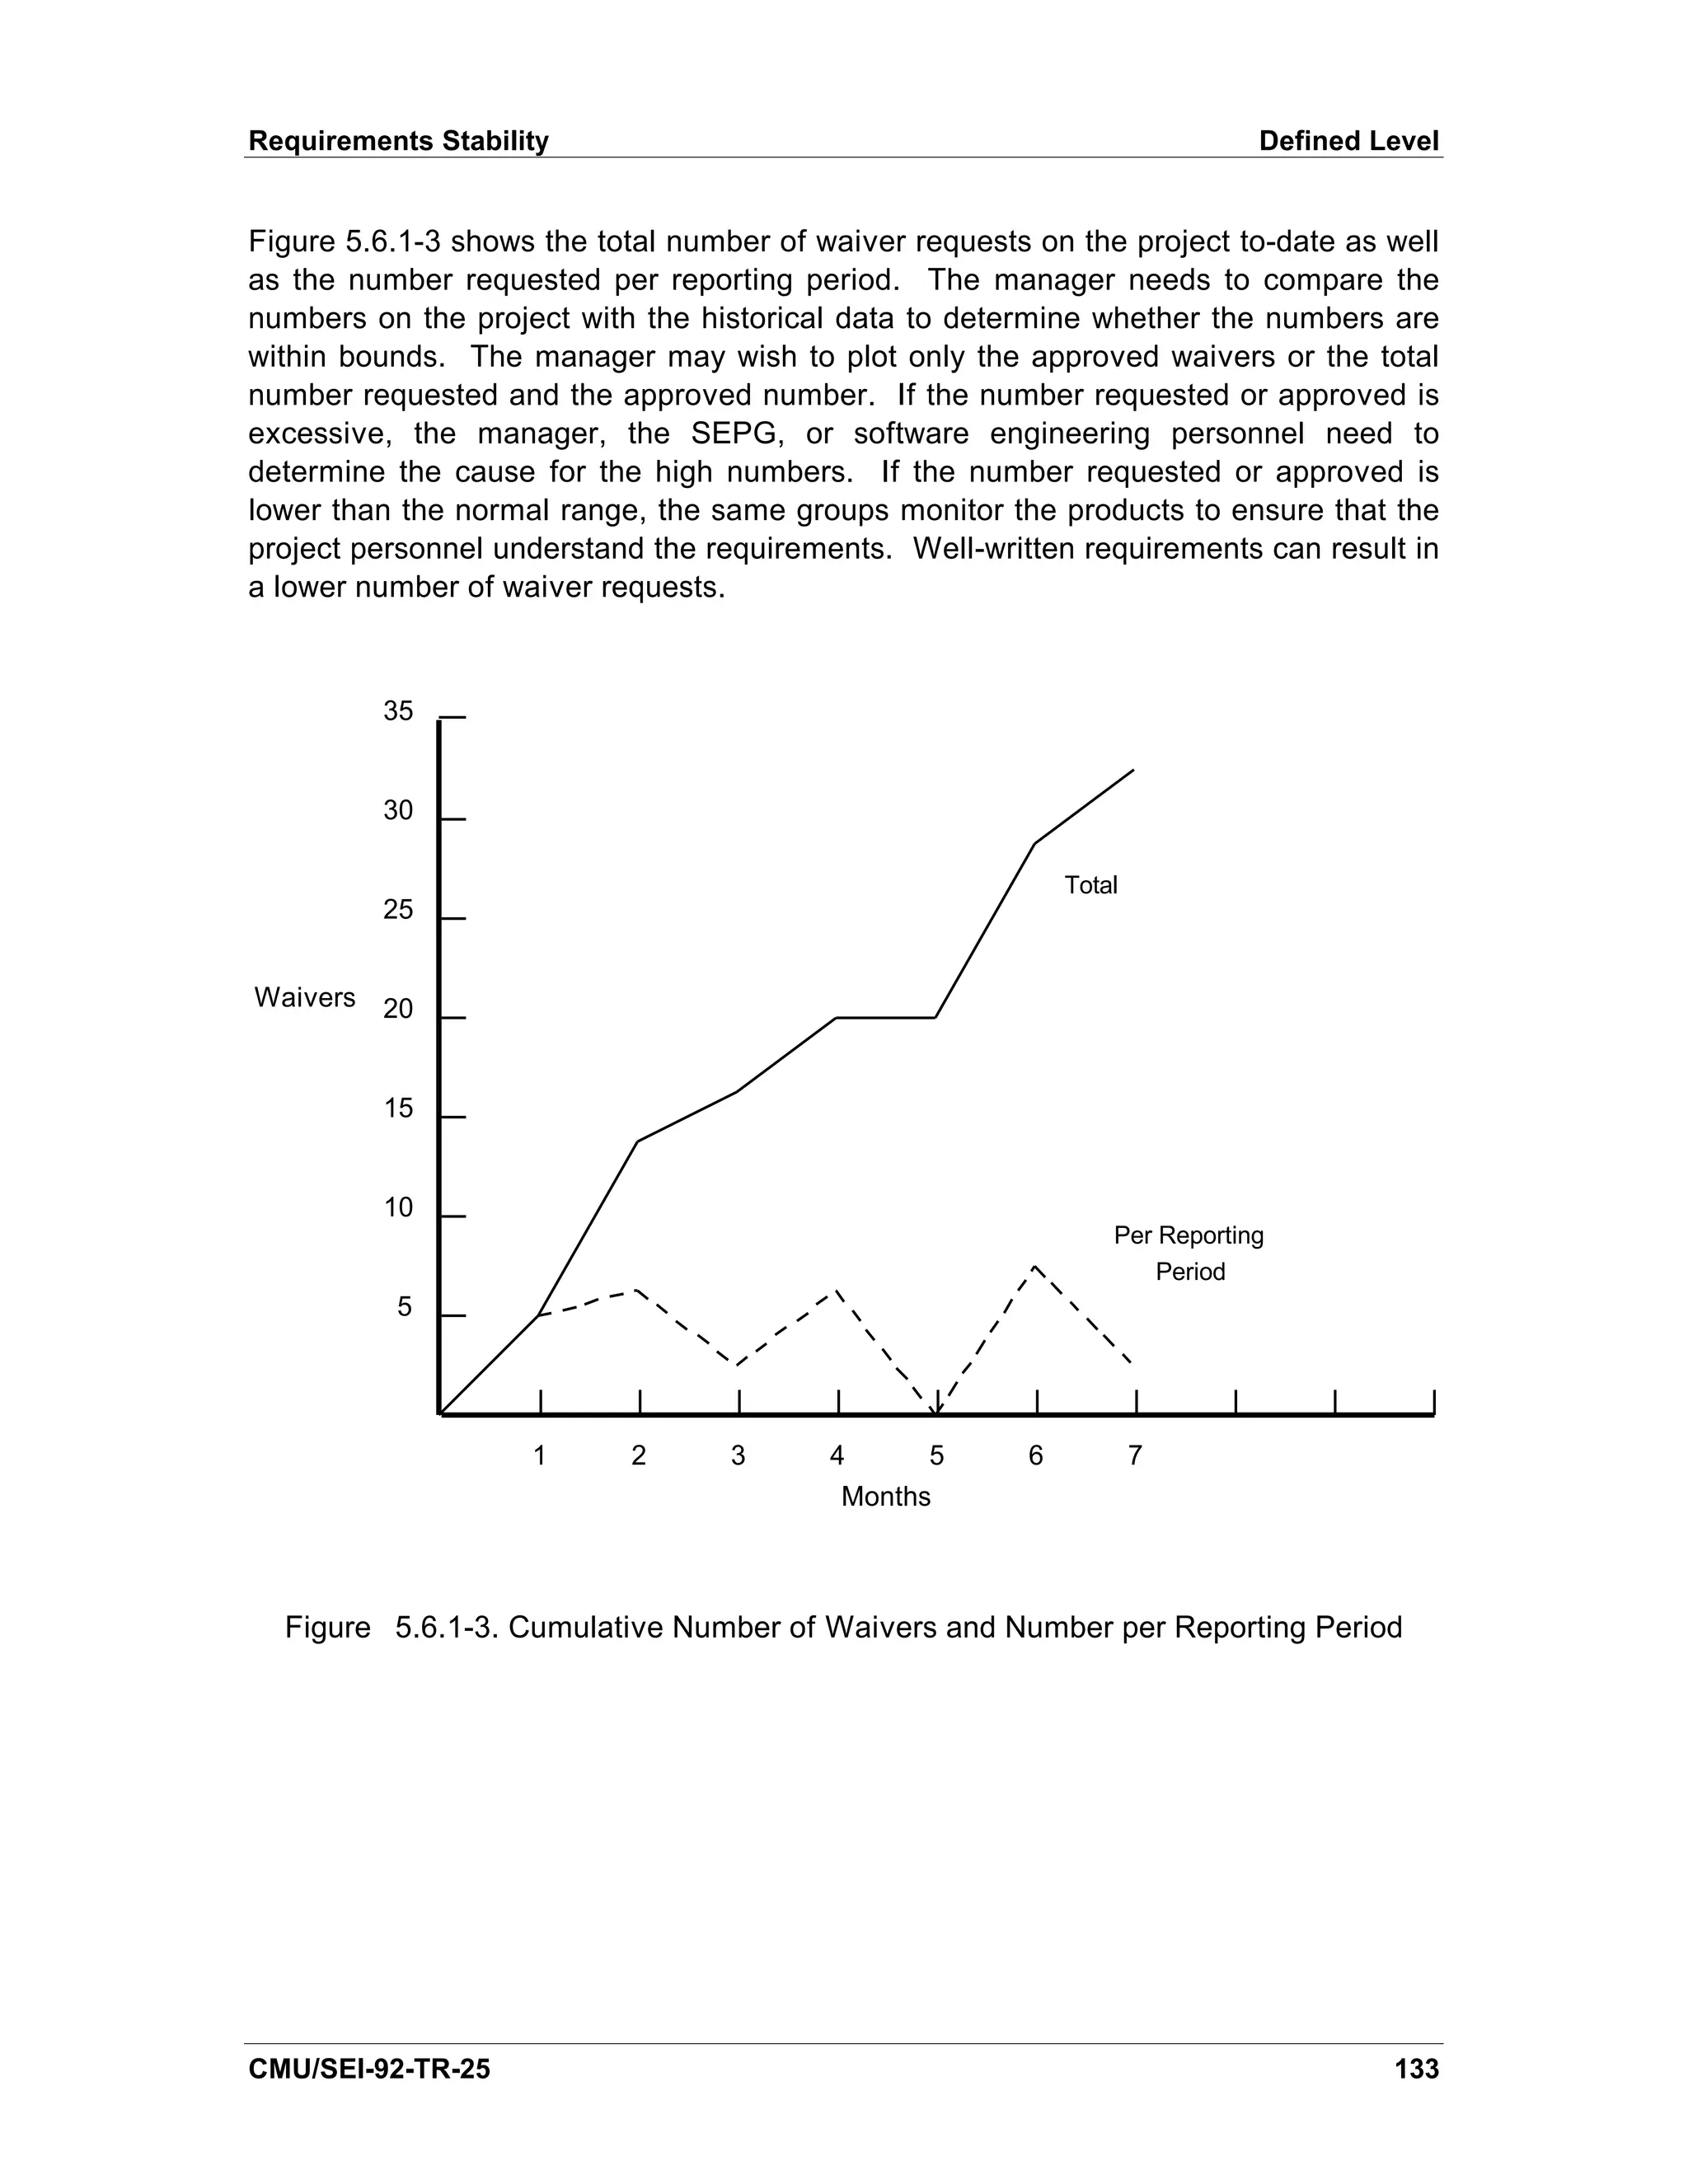
![Defined Level Process Stability
Figure 5.6.3-2 shows the total number of requests for waivers and the number of
approved requests per reporting period. A high number of requests for waiver indicates
that the process may be inappropriate or that the process may be appropriate but is not
designed for flexibility. A high number of approved waivers indicates that the process
may be unstable and may in fact be changing in an uncontrolled manner. The figure
can also be plotted with cumulative change requests.
60
50
Requested
40
Waivers
30
20 Approved
10
1 2 3 4 5 6 7 8 9 10
Months
Figure 5.6.3-2. Waivers from Process Standards
Sources
[Humphrey 89] discusses the role of the SEPG in process development and monitoring.
144 CMU/SEI-92-TR-25](https://image.slidesharecdn.com/softwaremeasuresandthecapabilitymaturitymodel-1992johnh-baumertsei-110103031855-phpapp02/75/Software-measures-and-the-capability-maturity-model-1992-john-h-baumert-sei-162-2048.jpg)
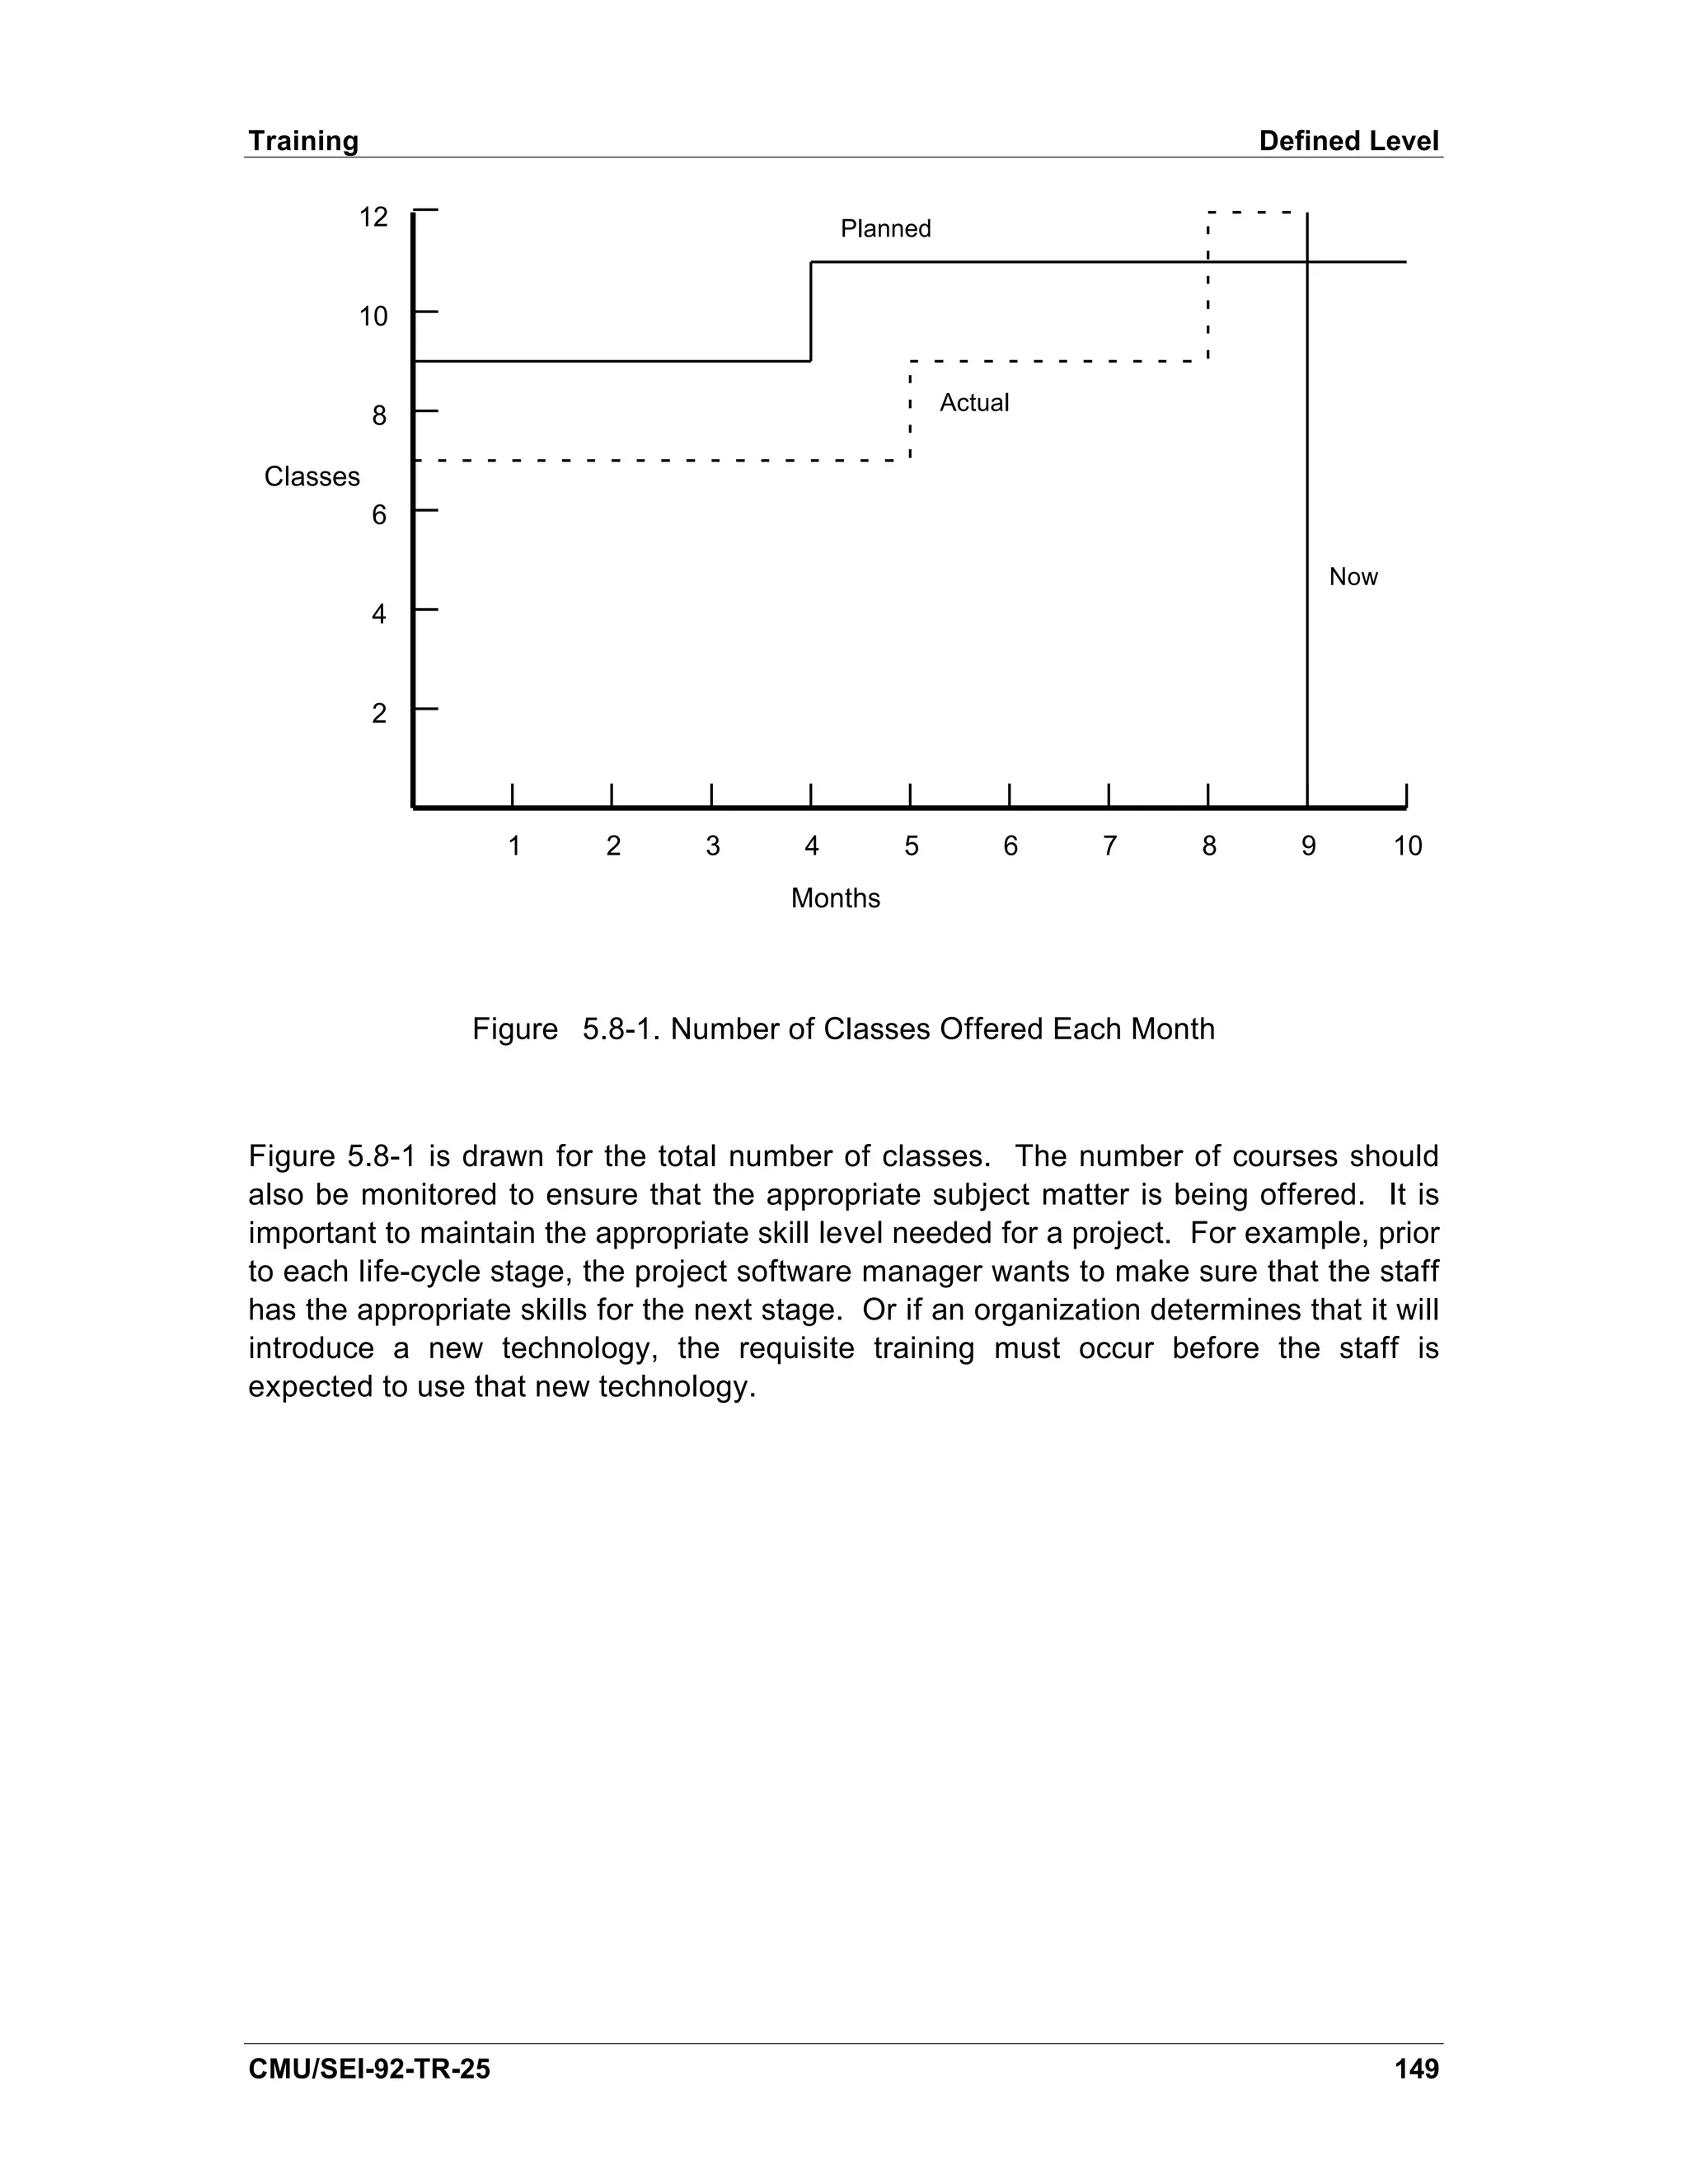
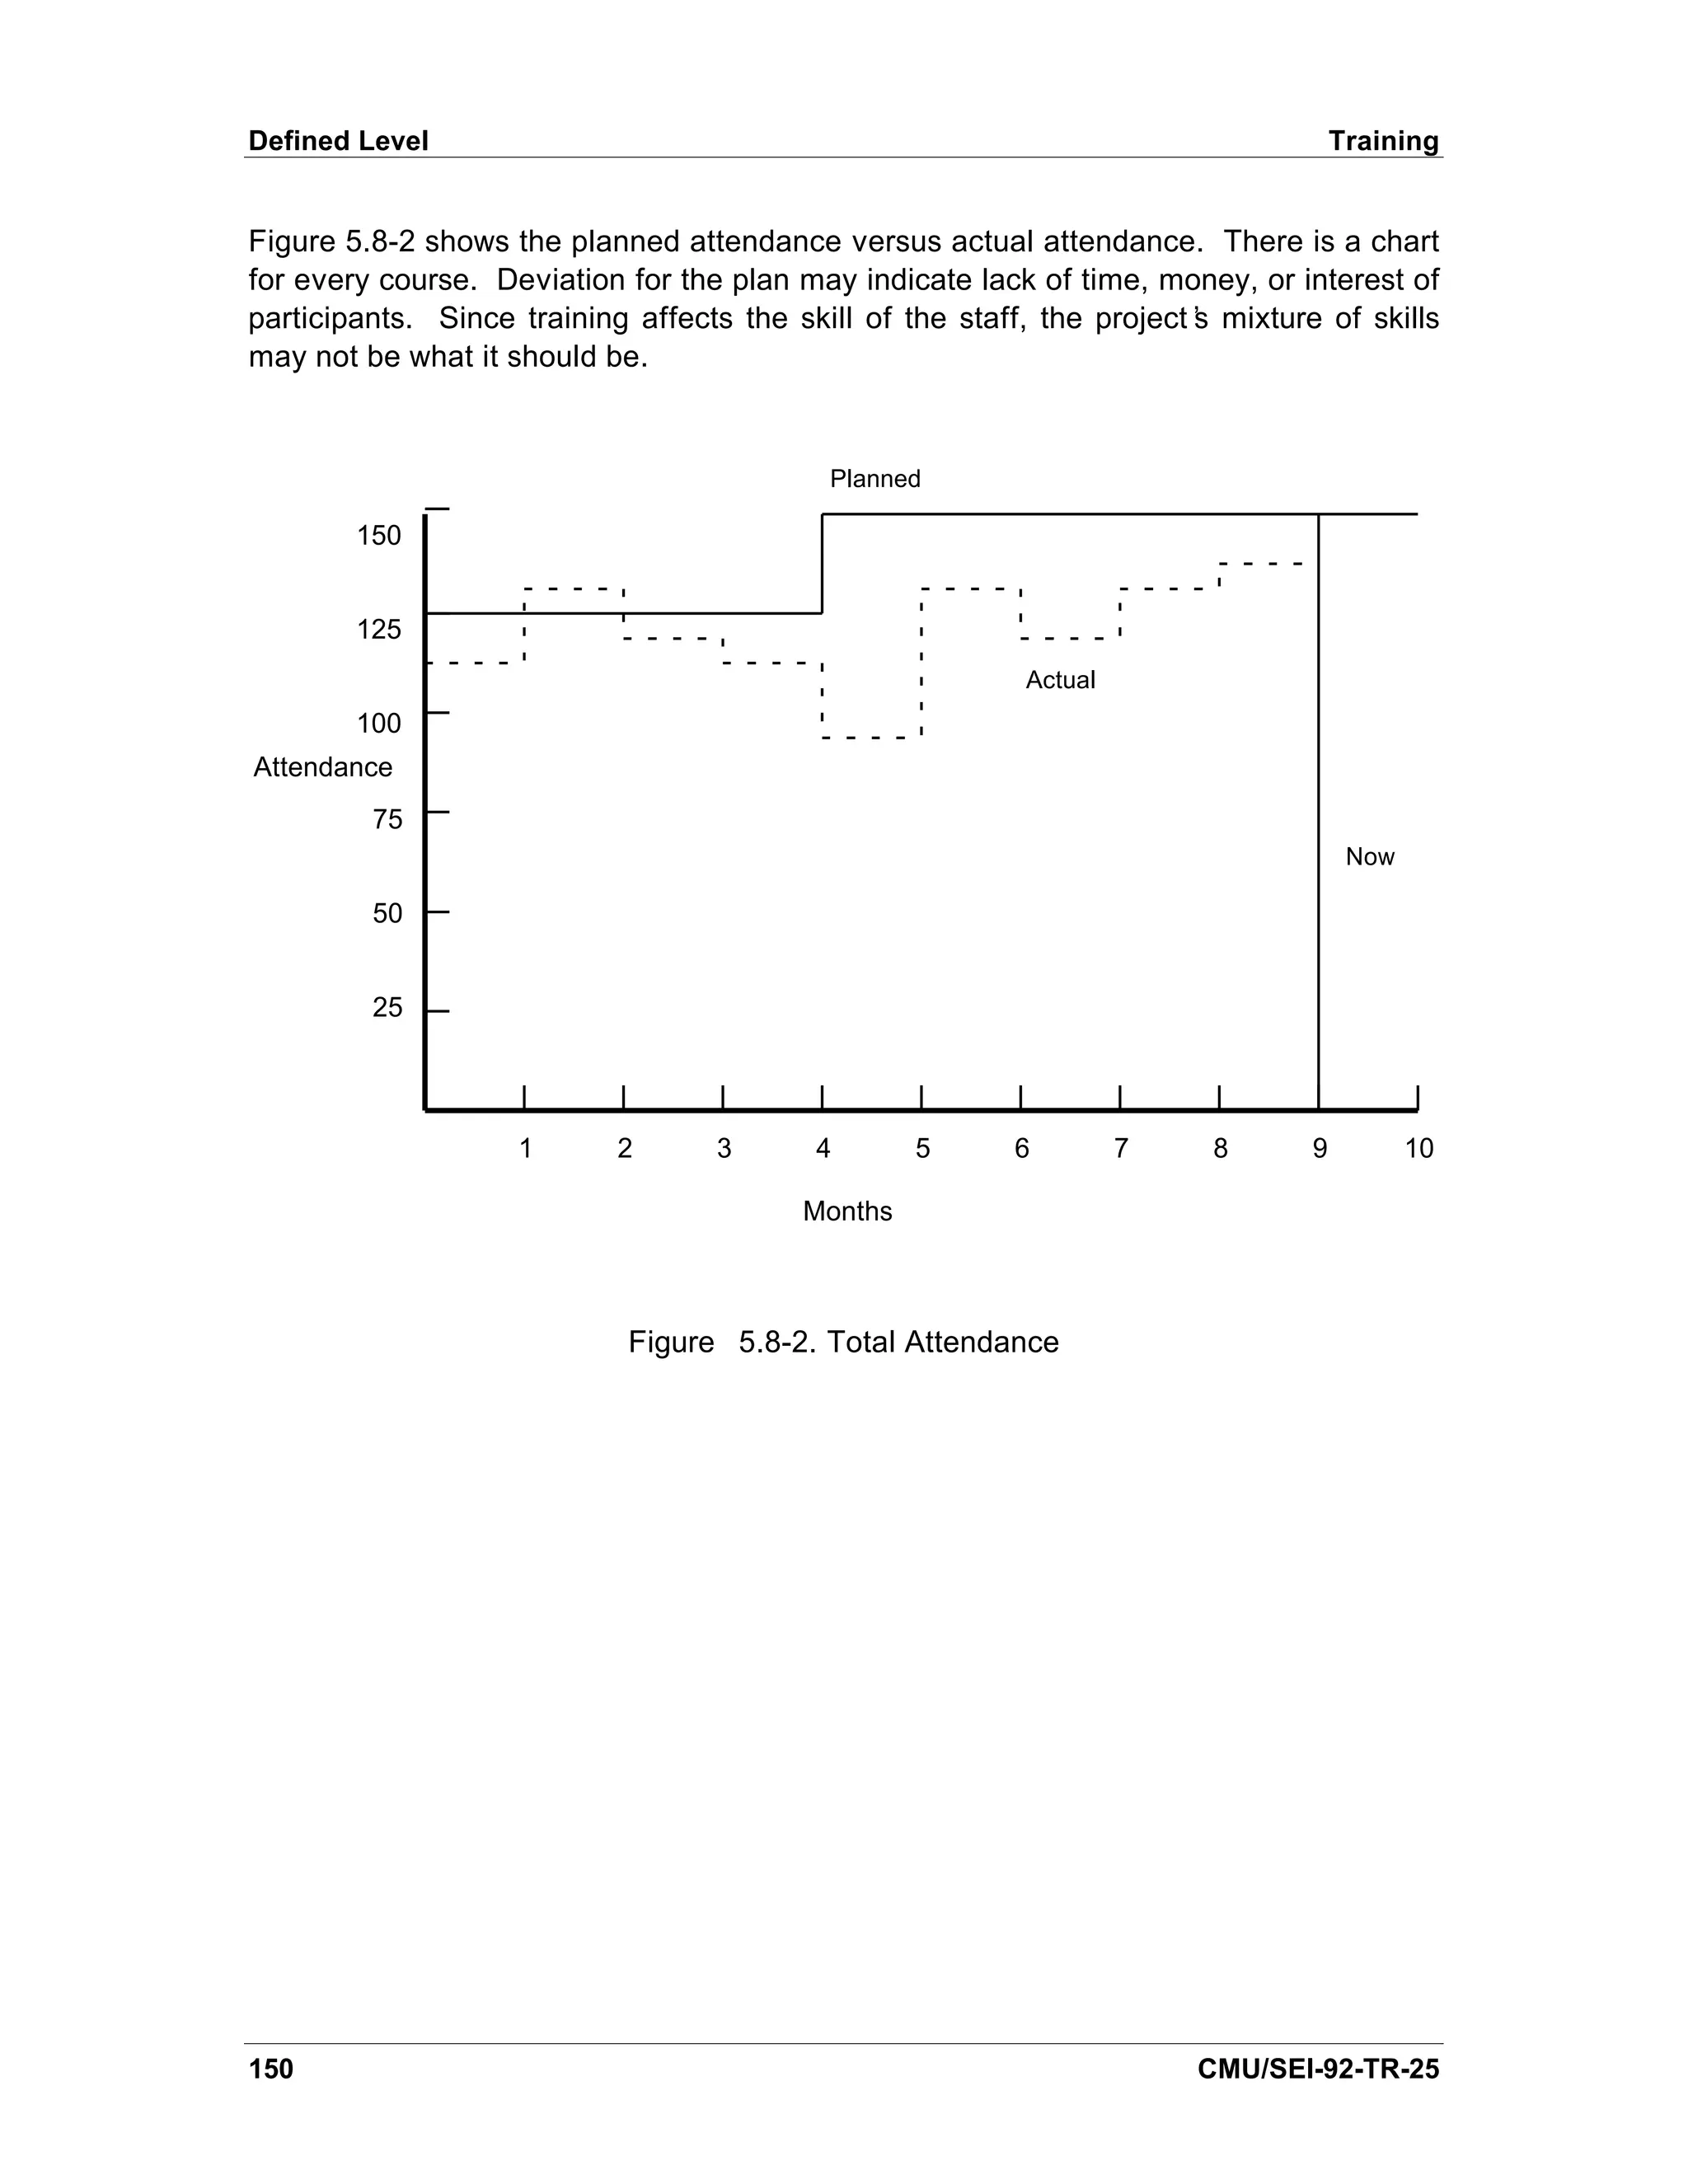
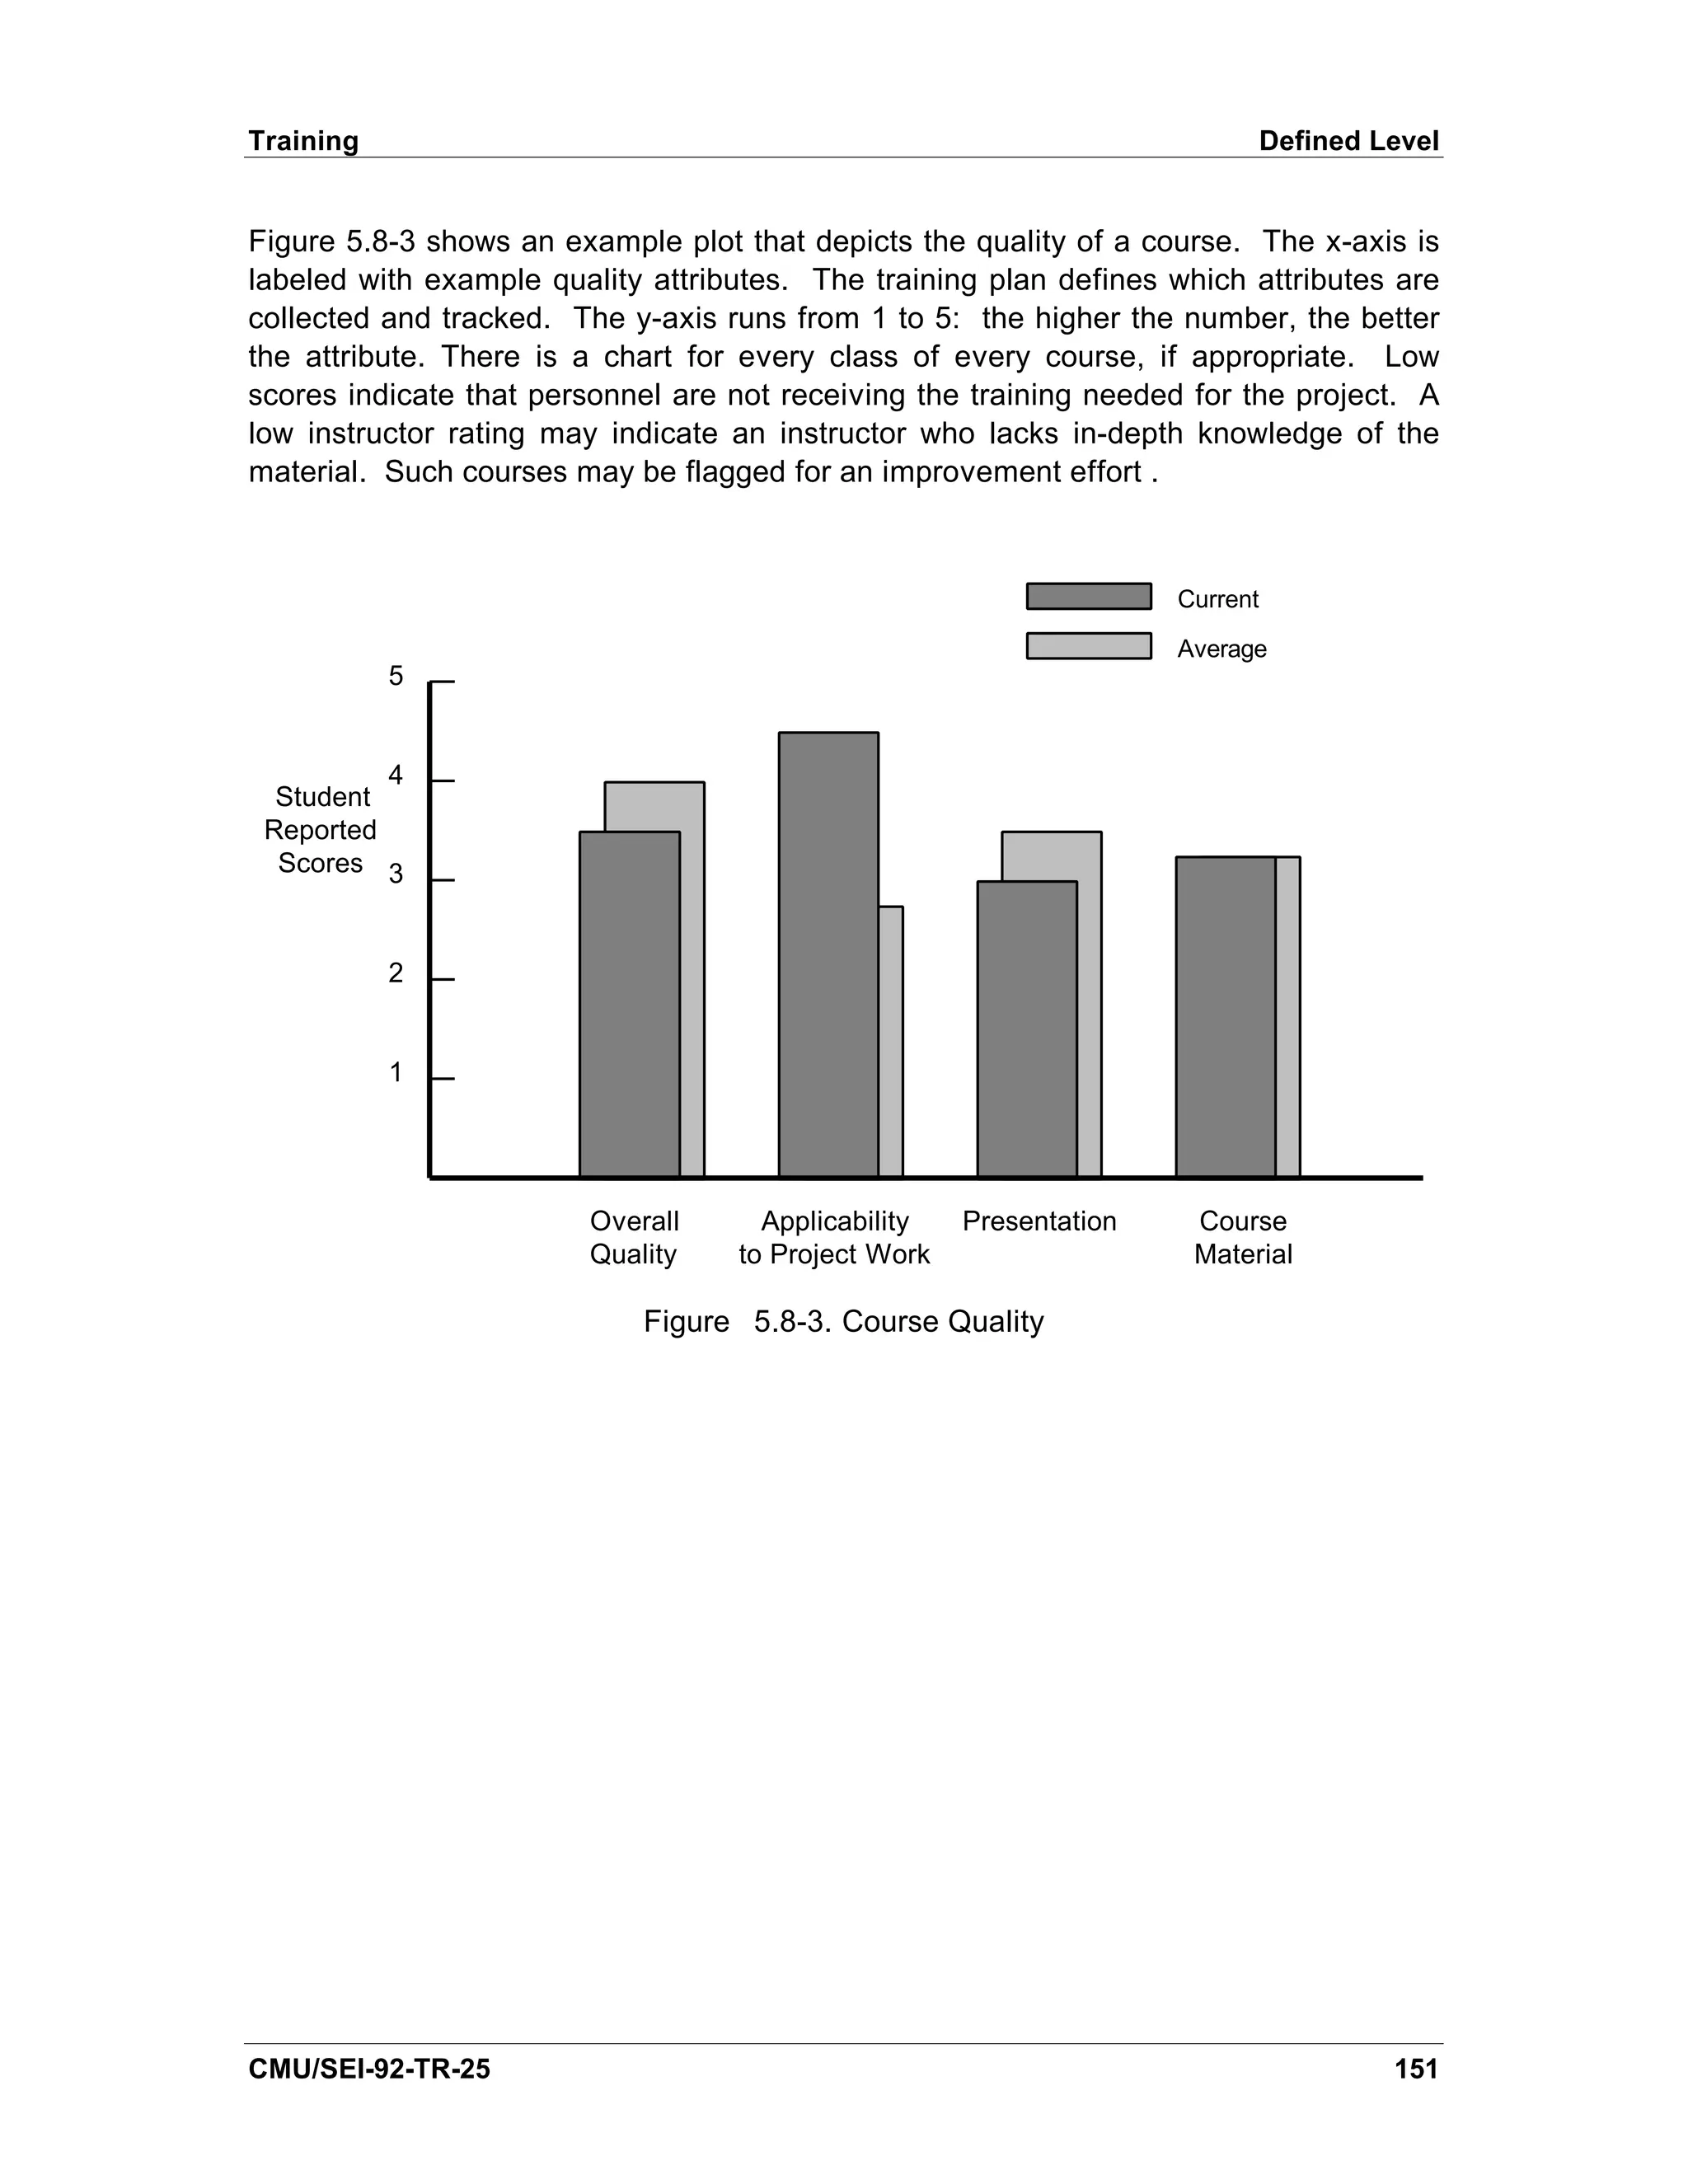
![Defined Level Training
Figure 5.8-4 shows the number of waivers requested and the number approved. There
should be a chart for every project, course, or labor category where appropriate. A high
number of requests may be indicative of a low quality, ineffective, or inappropriate
course. If so, the training plan should be reevaluated. A high number of approved
requests also indicates that the training plan has become unstable or unenforced.
This may lead to a mismatch in a project’ mixture of skills.
s
60
50
Requested
40
Waivers
30
Approved
20
10
1 2 3 4 5 6 7 8 9 10
Months
Figure 5.8-4. Waivers from Training Courses
Sources
[London 89] discusses high-quality, cost-effective employee training in organizations.
152 CMU/SEI-92-TR-25](https://image.slidesharecdn.com/softwaremeasuresandthecapabilitymaturitymodel-1992johnh-baumertsei-110103031855-phpapp02/75/Software-measures-and-the-capability-maturity-model-1992-john-h-baumert-sei-170-2048.jpg)
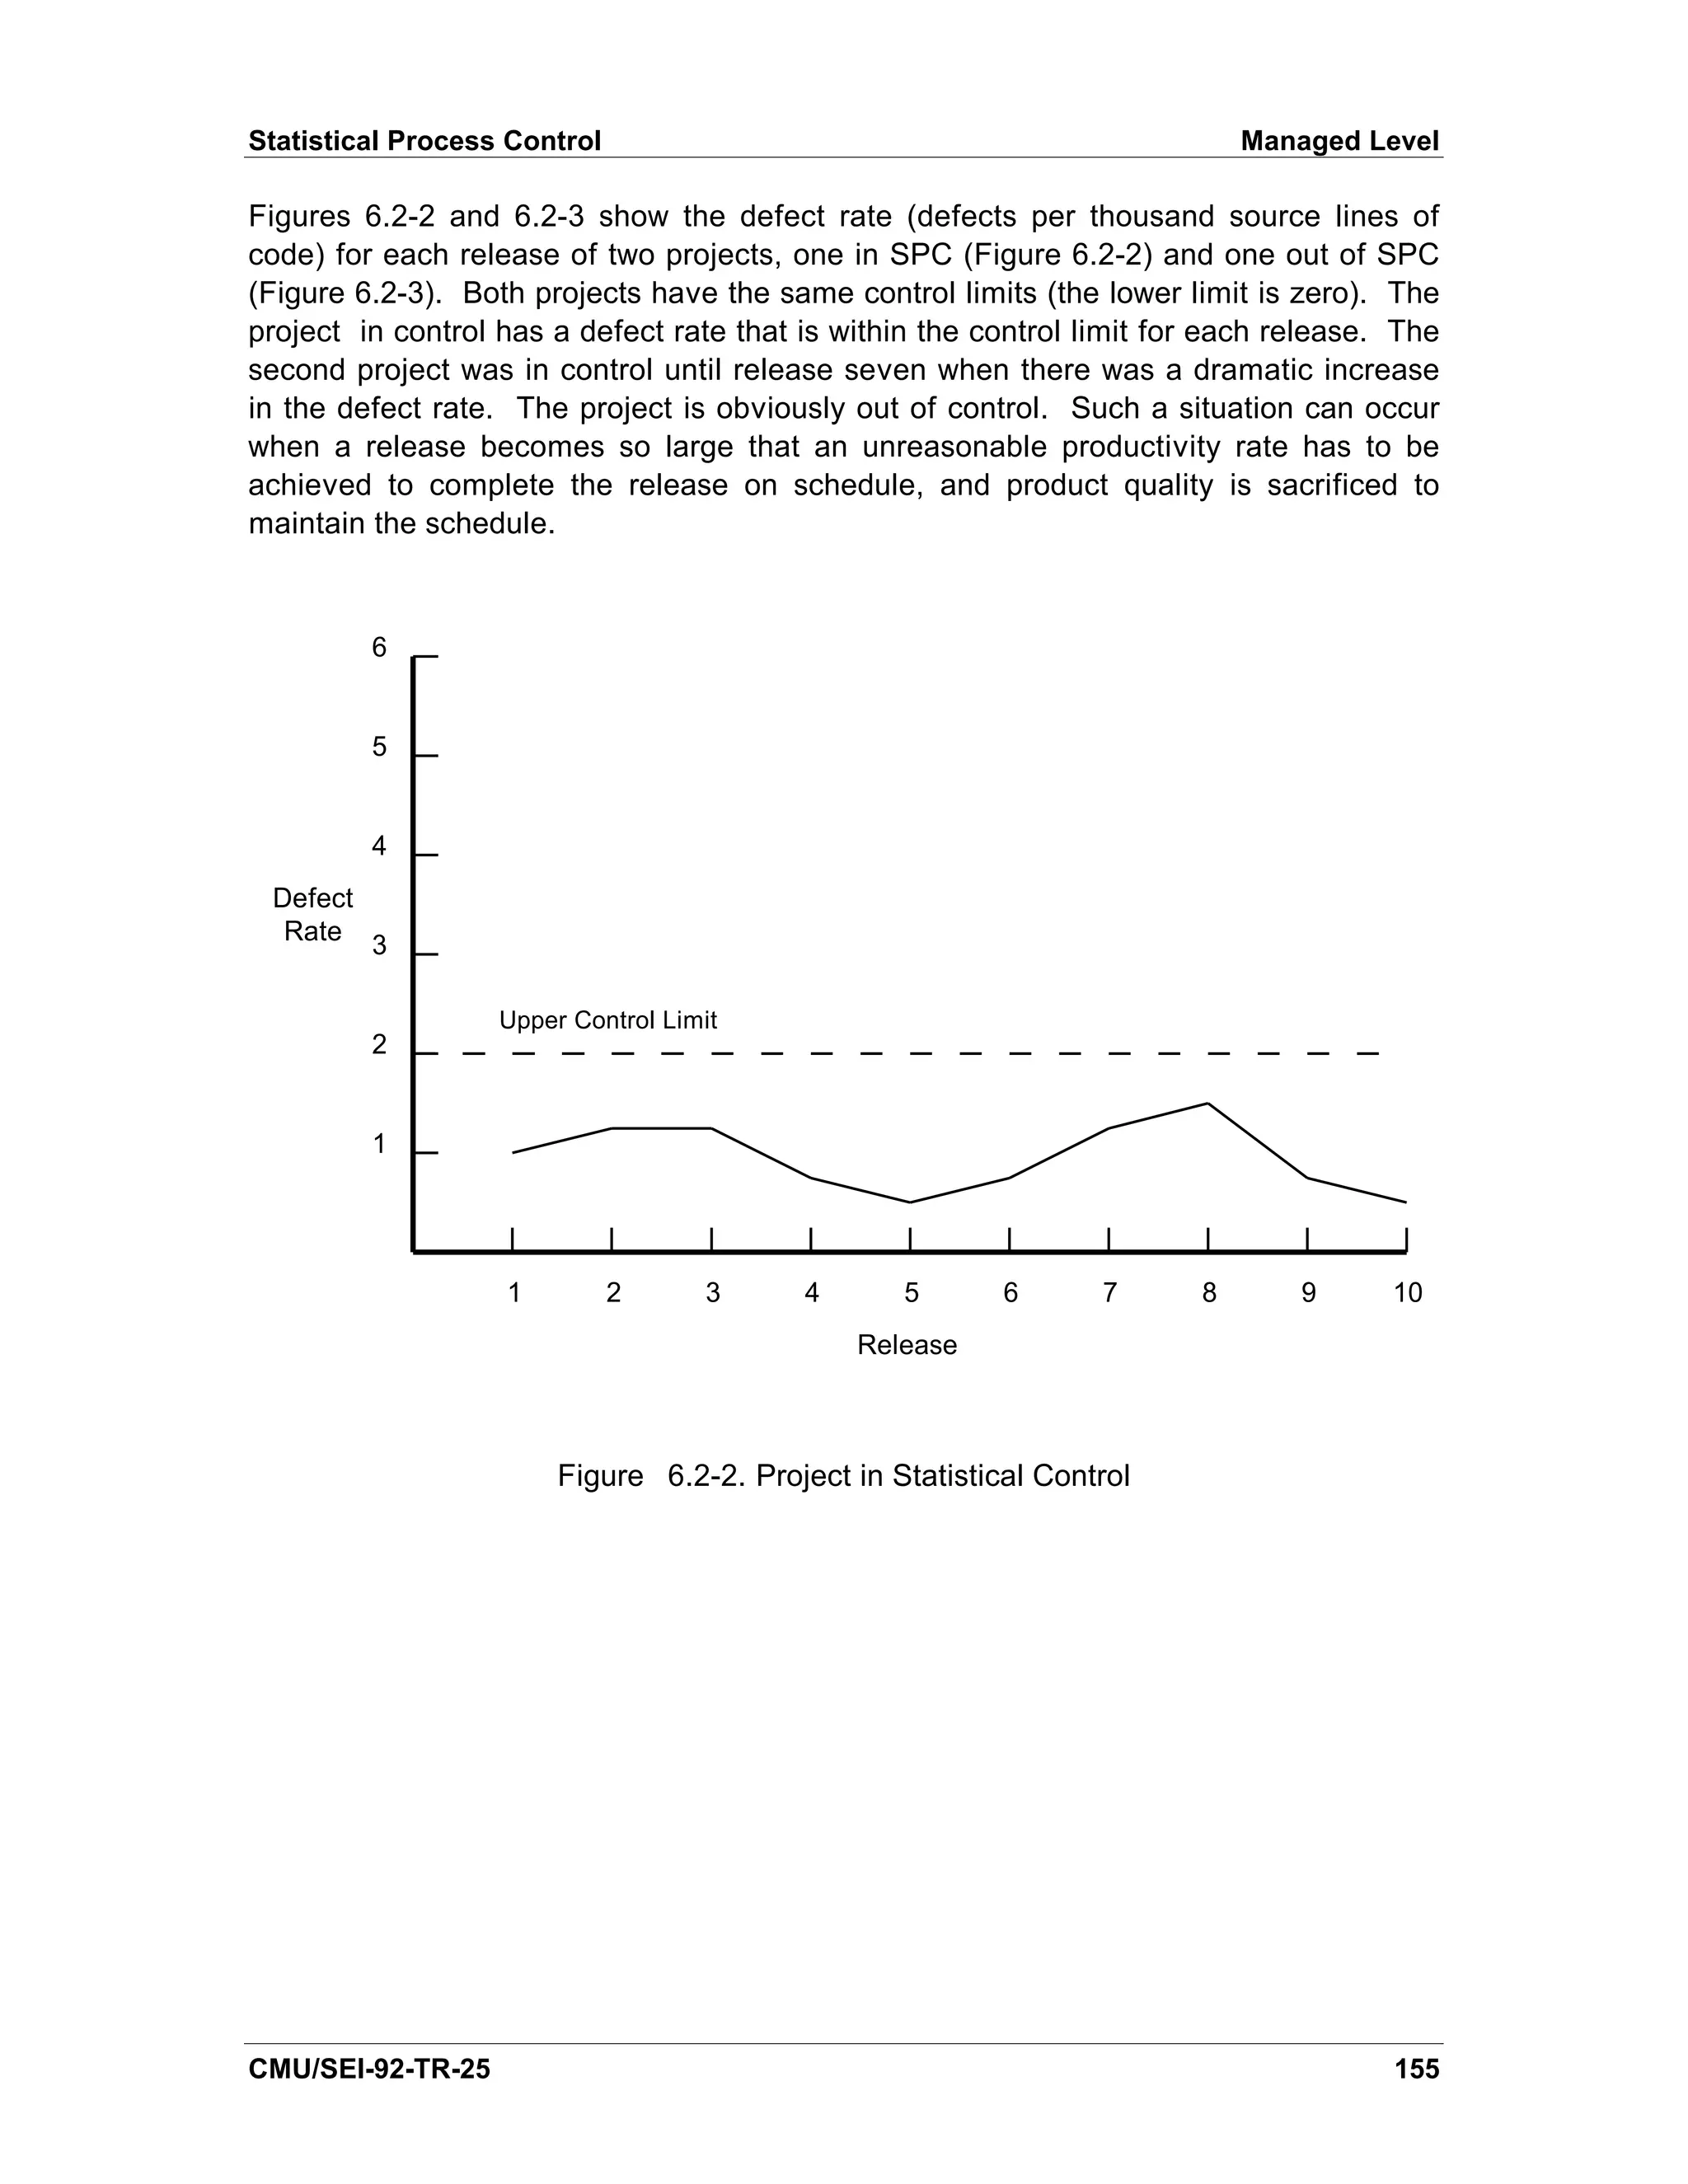
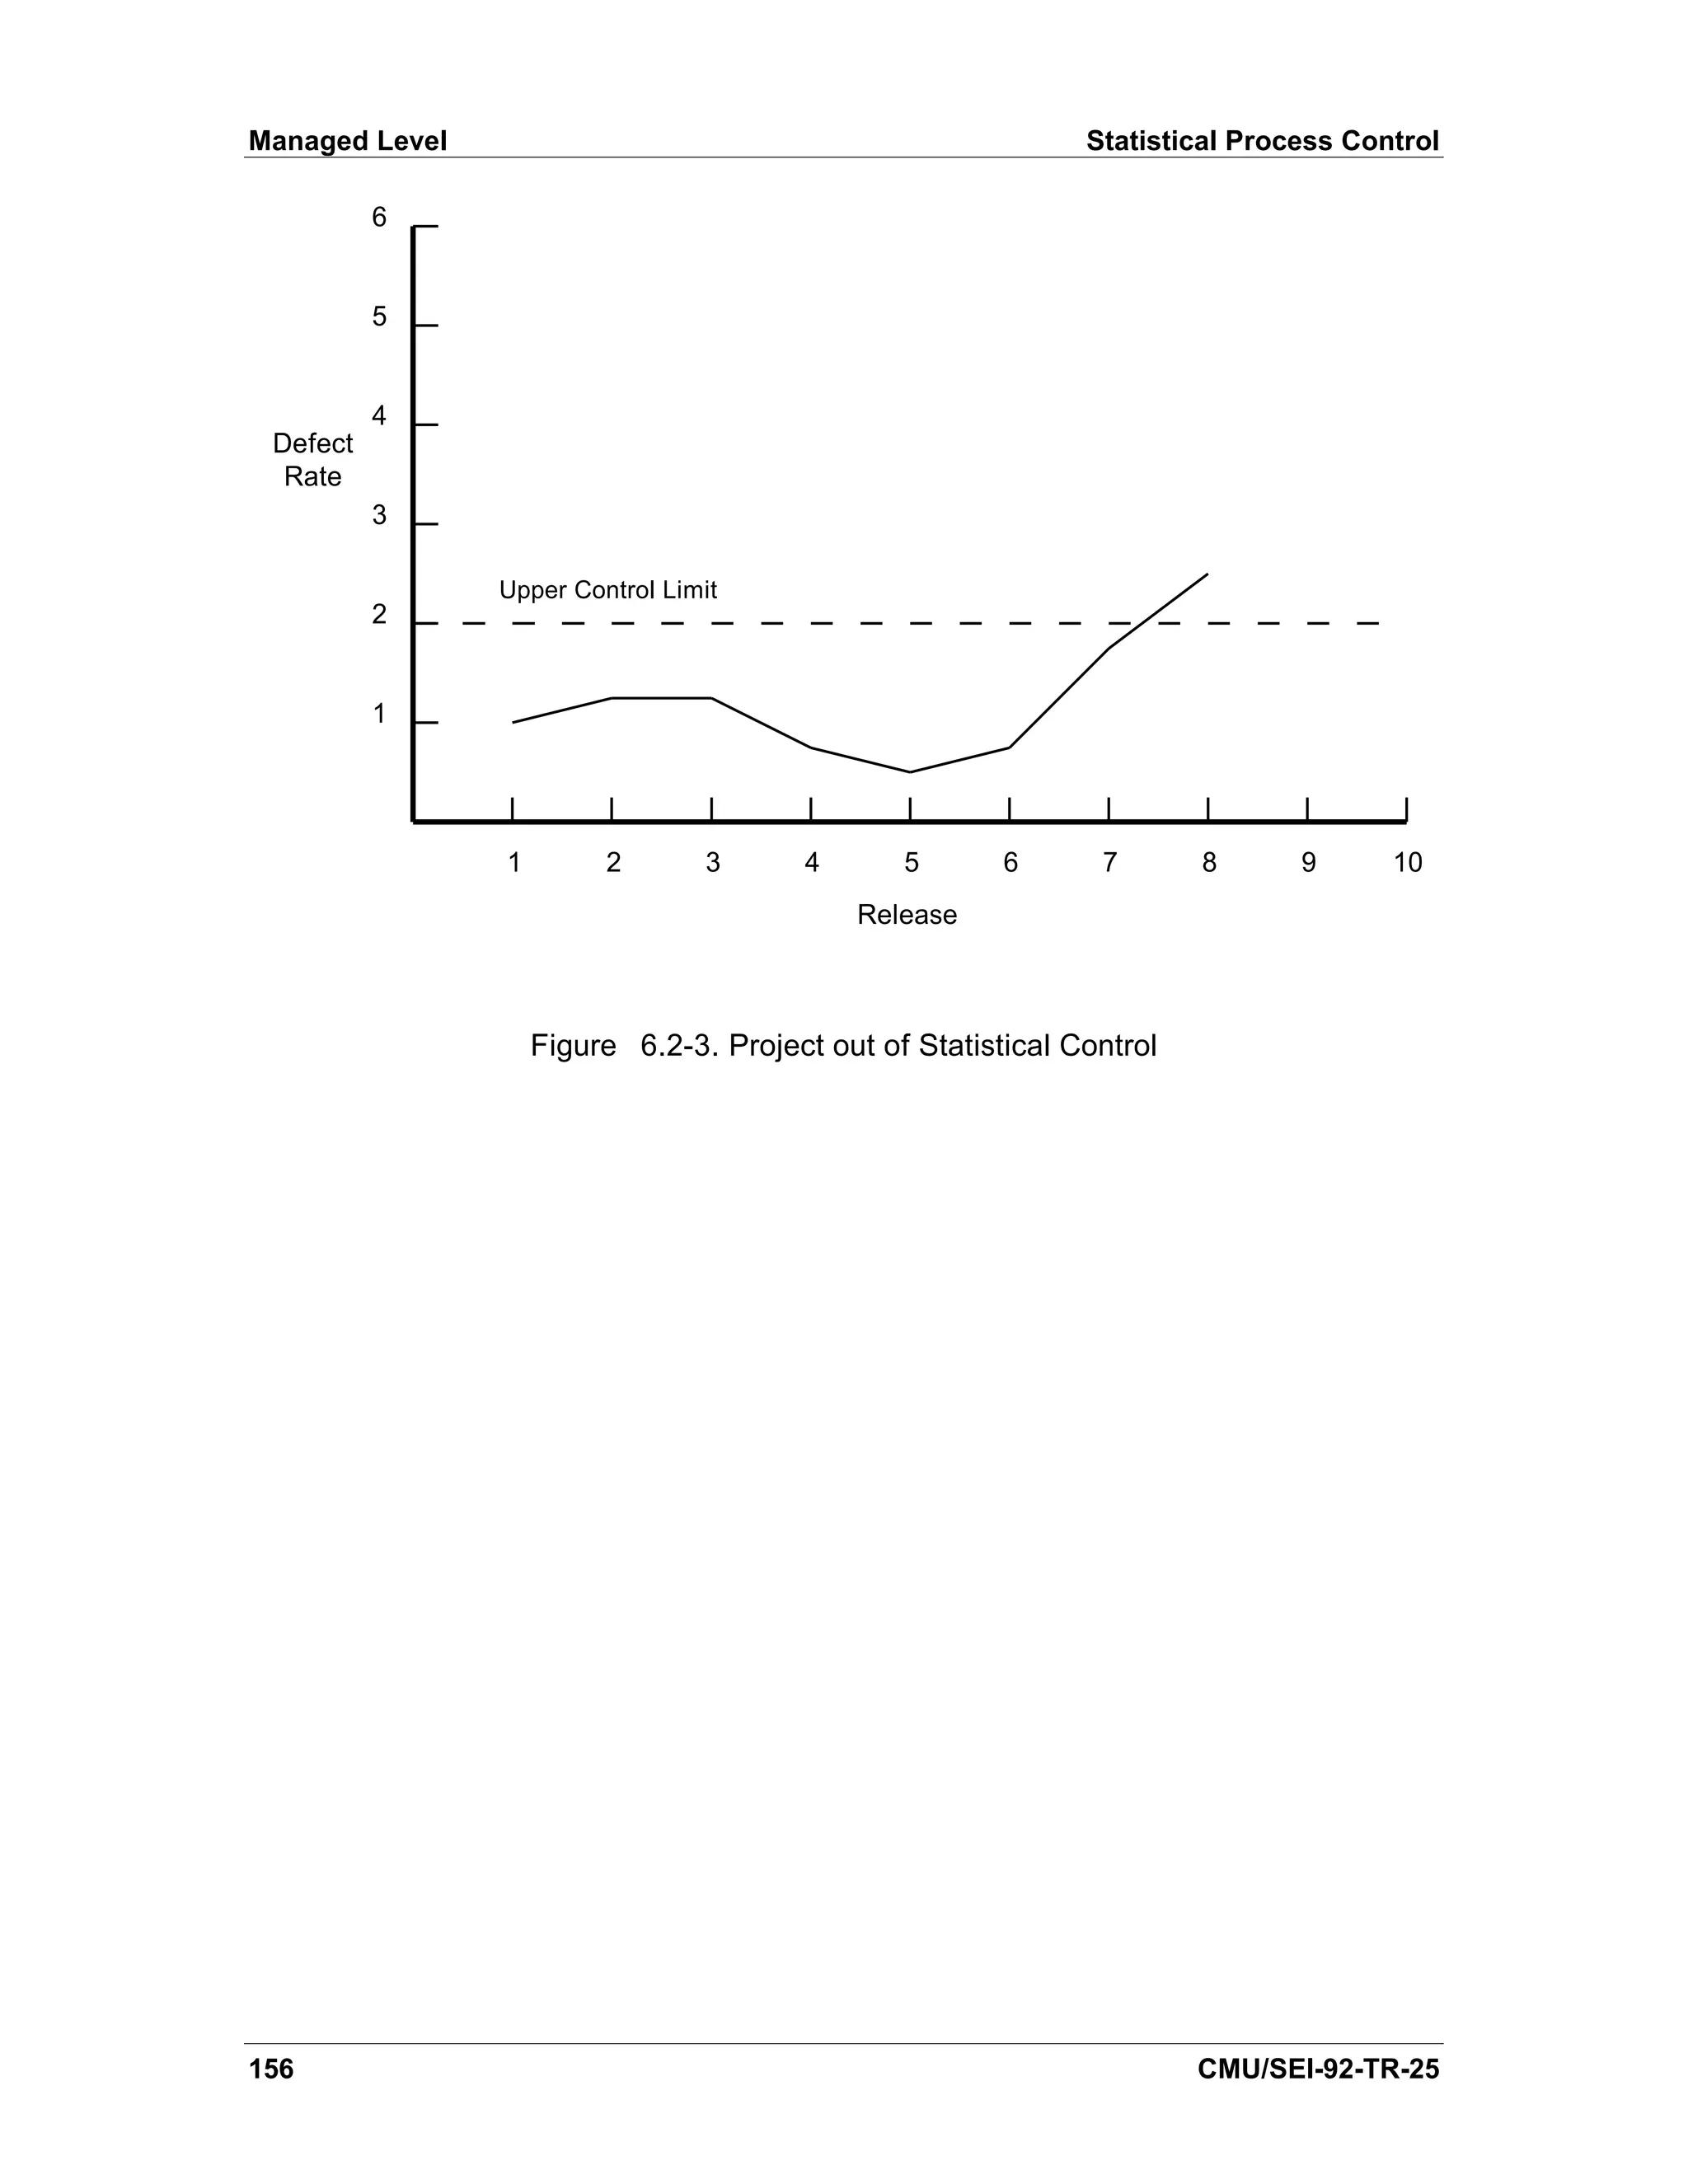
![6. The Managed Level— Maturity Level 4
This chapter summarizes the characteristics of an organization with a managed
process, provides a brief introduction to statistical process control, and discusses the
indicators that are appropriate for the Managed Level.
6.1. Characteristics of a Managed-Level Organization
An organization with a managed process is characterized as one that sets quantitative
quality goals for software products, measures productivity and quality for important
software process activities across all projects in the organization, and uses a process
database to collect and analyze data. A Managed-Level organization uses a set of
well-defined and consistently-defined measures to establish acceptable quantitative
boundaries for product and process performance. This allows meaningful performance
variation to be distinguished from random variation.
Indicators appropriate for a Managed-Level organization are progress, effort, cost,
quality, stability, computer resource utilization, and training. As noted in Chapter 1,
there are few examples of proven indicators for this maturity level. Some discussion of
indicators in this chapter is based on expected practice. As organizations mature,
experience with indicators at this maturity level will increase, and the information in this
chapter could change.
6.2. Statistical Process Control— An Overview
At the Defined Level, the concept of ranges of the planned items was introduced. At
that level, historical data are used to select a range around the plan based on some
percentage of the planned value. At the Managed Level, however, the organization
can use statistical methods to establish ranges and set the limits of variation around the
plan. The organization makes extensive use of statistical process control (SPC)
techniques.
Pyzdek defines SPC as the use of statistical methods to identify the existence of
special causes of variation in a process [Pyzdek 89]. SPC has a basic rule: variation
from common cause systems should be left to chance, but special causes of variation
should be identified and eliminated. In other words, an organization uses SPC to
identify when a process is out of control by looking at control charts to determine when
an observed variation from the plan is due to special cause and not normal, random
variation.
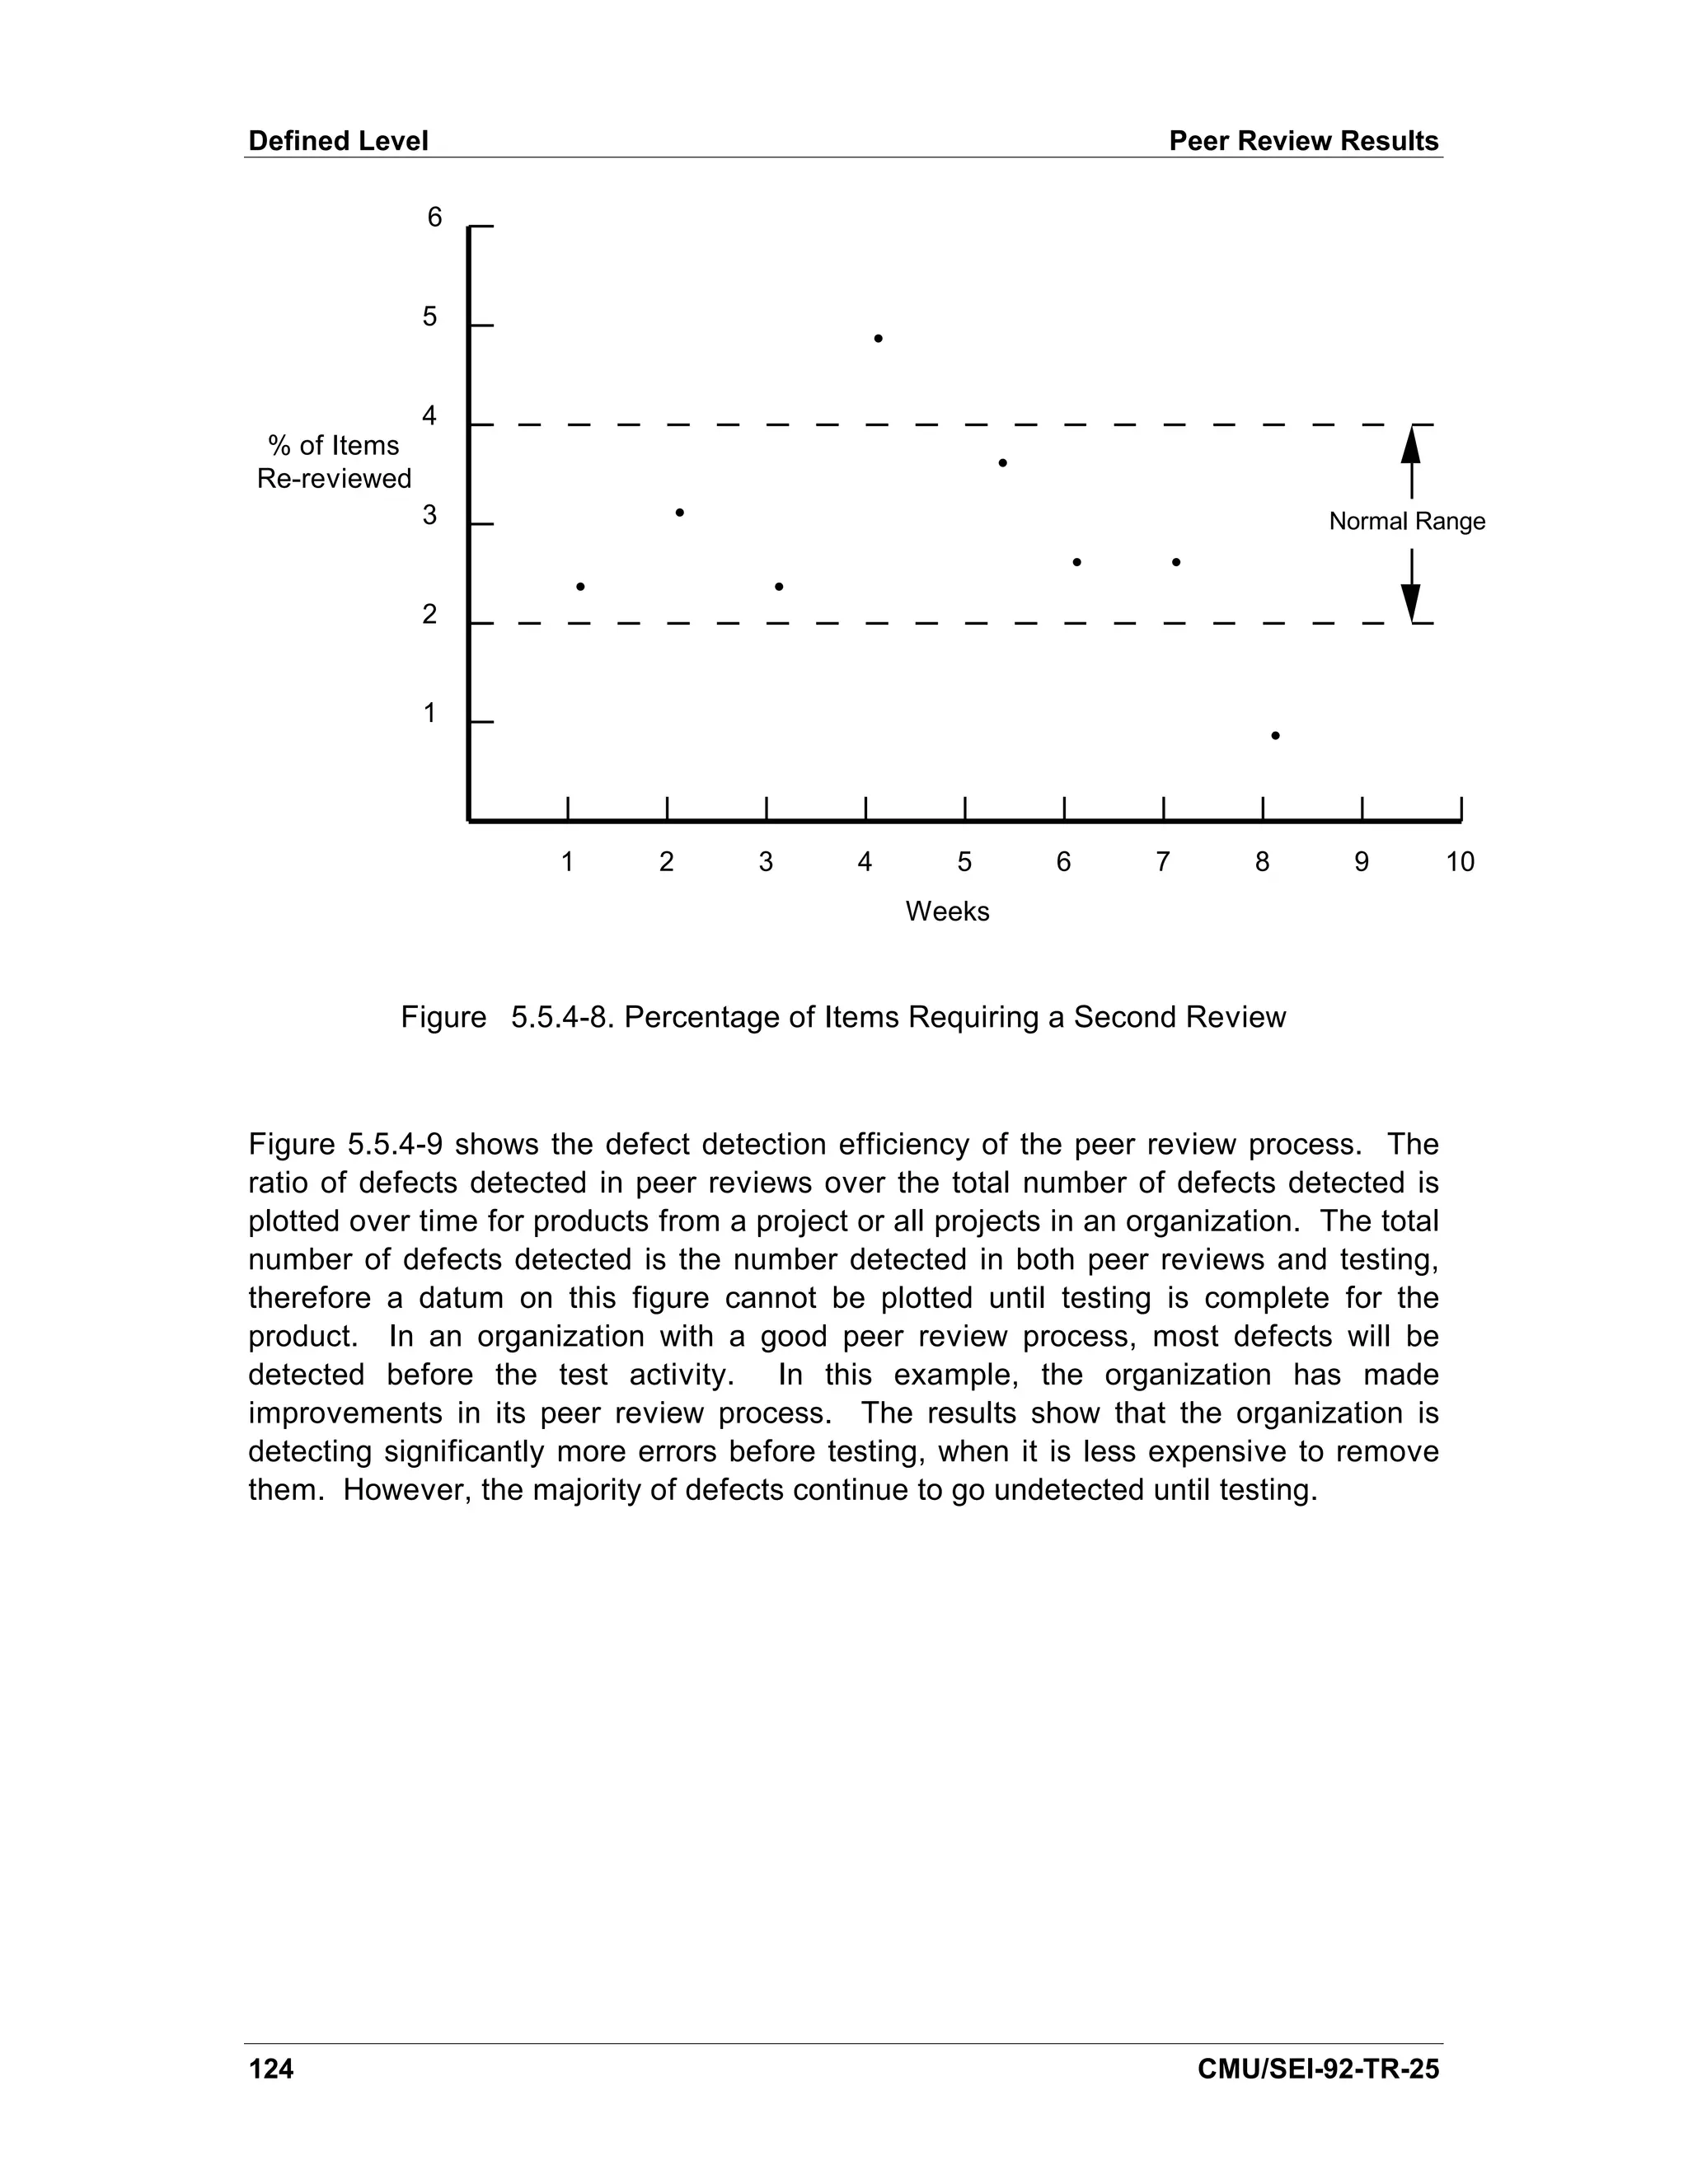
Figure 5.5.4-8 shows an example of a control chart for the percentage of items re-
reviewed during each reporting period. In the figure, the manager visually determined
the control limits. Most of the values were around three percent, so the manager
CMU/SEI-92-TR-25 153](https://image.slidesharecdn.com/softwaremeasuresandthecapabilitymaturitymodel-1992johnh-baumertsei-110103031855-phpapp02/75/Software-measures-and-the-capability-maturity-model-1992-john-h-baumert-sei-171-2048.jpg)
![Managed Level Statistical Process Control
established ±1 percent control limits around the three percent value. There is no firm
basis for this assumption other than “ looks reasonable.” In SPC, the manager can
it
determine an average value and the standard deviation. According to the normal
distribution, 99 percent of all values lie within ±3 standard deviations. SPC uses this
fact to establish the upper and lower control limits as three standard deviations above
and below the average values, respectively. Log-normal distribution can be used to
calculate the lower control limit so that it does not go below zero. Likewise, for figures
that have a natural upper bound (e.g., one hundred percent), beta distribution can be
used to prevent the upper control limit from going above the boundary.
Figure 6.2-1 summarizes the concepts attached to a control chart. Normal fluctuations
are those that lie within the control limits, that is, they are natural variations. Any value
lying above the upper control limit or below the lower control limit may indicate a
process problem. The cause of the variation must be determined.
Determine Cause of Deviation
Upper Control Limit
3 Standard Deviations
Average Normal
Variation
Measure
3 Standard Deviations
Lower Control Limit
Determine Cause of Deviation
Time
Figure 6.2-1. Control Chart
According to Pyzdek [Pyzdek 84], the following criteria indicate when a process is out
of control:
• Any value exceeds a three standard deviation control line
• Four of five consecutive values exceed the ±1 standard deviation line
• Two of three consecutive values exceed a ±2 standard deviation line
• S even or more consecutive values lie on same side of the average
154 CMU/SEI-92-TR-25](https://image.slidesharecdn.com/softwaremeasuresandthecapabilitymaturitymodel-1992johnh-baumertsei-110103031855-phpapp02/75/Software-measures-and-the-capability-maturity-model-1992-john-h-baumert-sei-172-2048.jpg)
![Cost Managed Level
- Defect prevention activities (for the Optimizing Level)
- Technology innovation activities (for the Optimizing Level)
Interpretation
The graphs and their interpretation are the same as those for the Defined Level.
The cost data for each project element allows the organization to determine cost of
quality and to make informed decisions regarding tradeoffs. A Managed-Level
organization has complete, accurate cost data for each activity on a project. For
example, it knows how much it is spending on the collection and analysis of data, how
much is spent on peer review activities and rework, and how much it saved by detecting
defects early in the life cycle.
As part of the activities of a Managed-Level organization, quantitative product and
process quality goals are established. When these quality goals conflict, (i.e., one goal
cannot be achieved without compromising another), the project reviews and analyzes
the software requirements, design, development plan and its quality plan, makes the
necessary tradeoffs, and revises the quality goals appropriately. In order to make an
informed decision, the costs for achieving the goals are part of software project
planning. The cost information comes from the historical data. As part of the analysis,
the project and the organization consider the customer and end users as well as the
long-term business strategy and short-term priorities.
Sources
From the Defined Level:
[AFSC 86] has a discussion of these indicators.
[DoD 80] discusses the basics of ACWP, BCWP, and BCWS.
[DSDM 89] served as the major source of information in this section.
CMU/SEI-92-TR-25 161](https://image.slidesharecdn.com/softwaremeasuresandthecapabilitymaturitymodel-1992johnh-baumertsei-110103031855-phpapp02/75/Software-measures-and-the-capability-maturity-model-1992-john-h-baumert-sei-179-2048.jpg)
![Managed Level Trouble Reports
6
5 Historical
Comparison
Number of 4
Trouble
Reports per
KLOC 3
2
1
Documentation Logic Does Data Interface
Error Not
Satisfy
Requirement
Figure 6.6.3-1. Number of Trouble Reports per Type of Defect
Once the defect type of each trouble report has been defined, the SEPG can determine
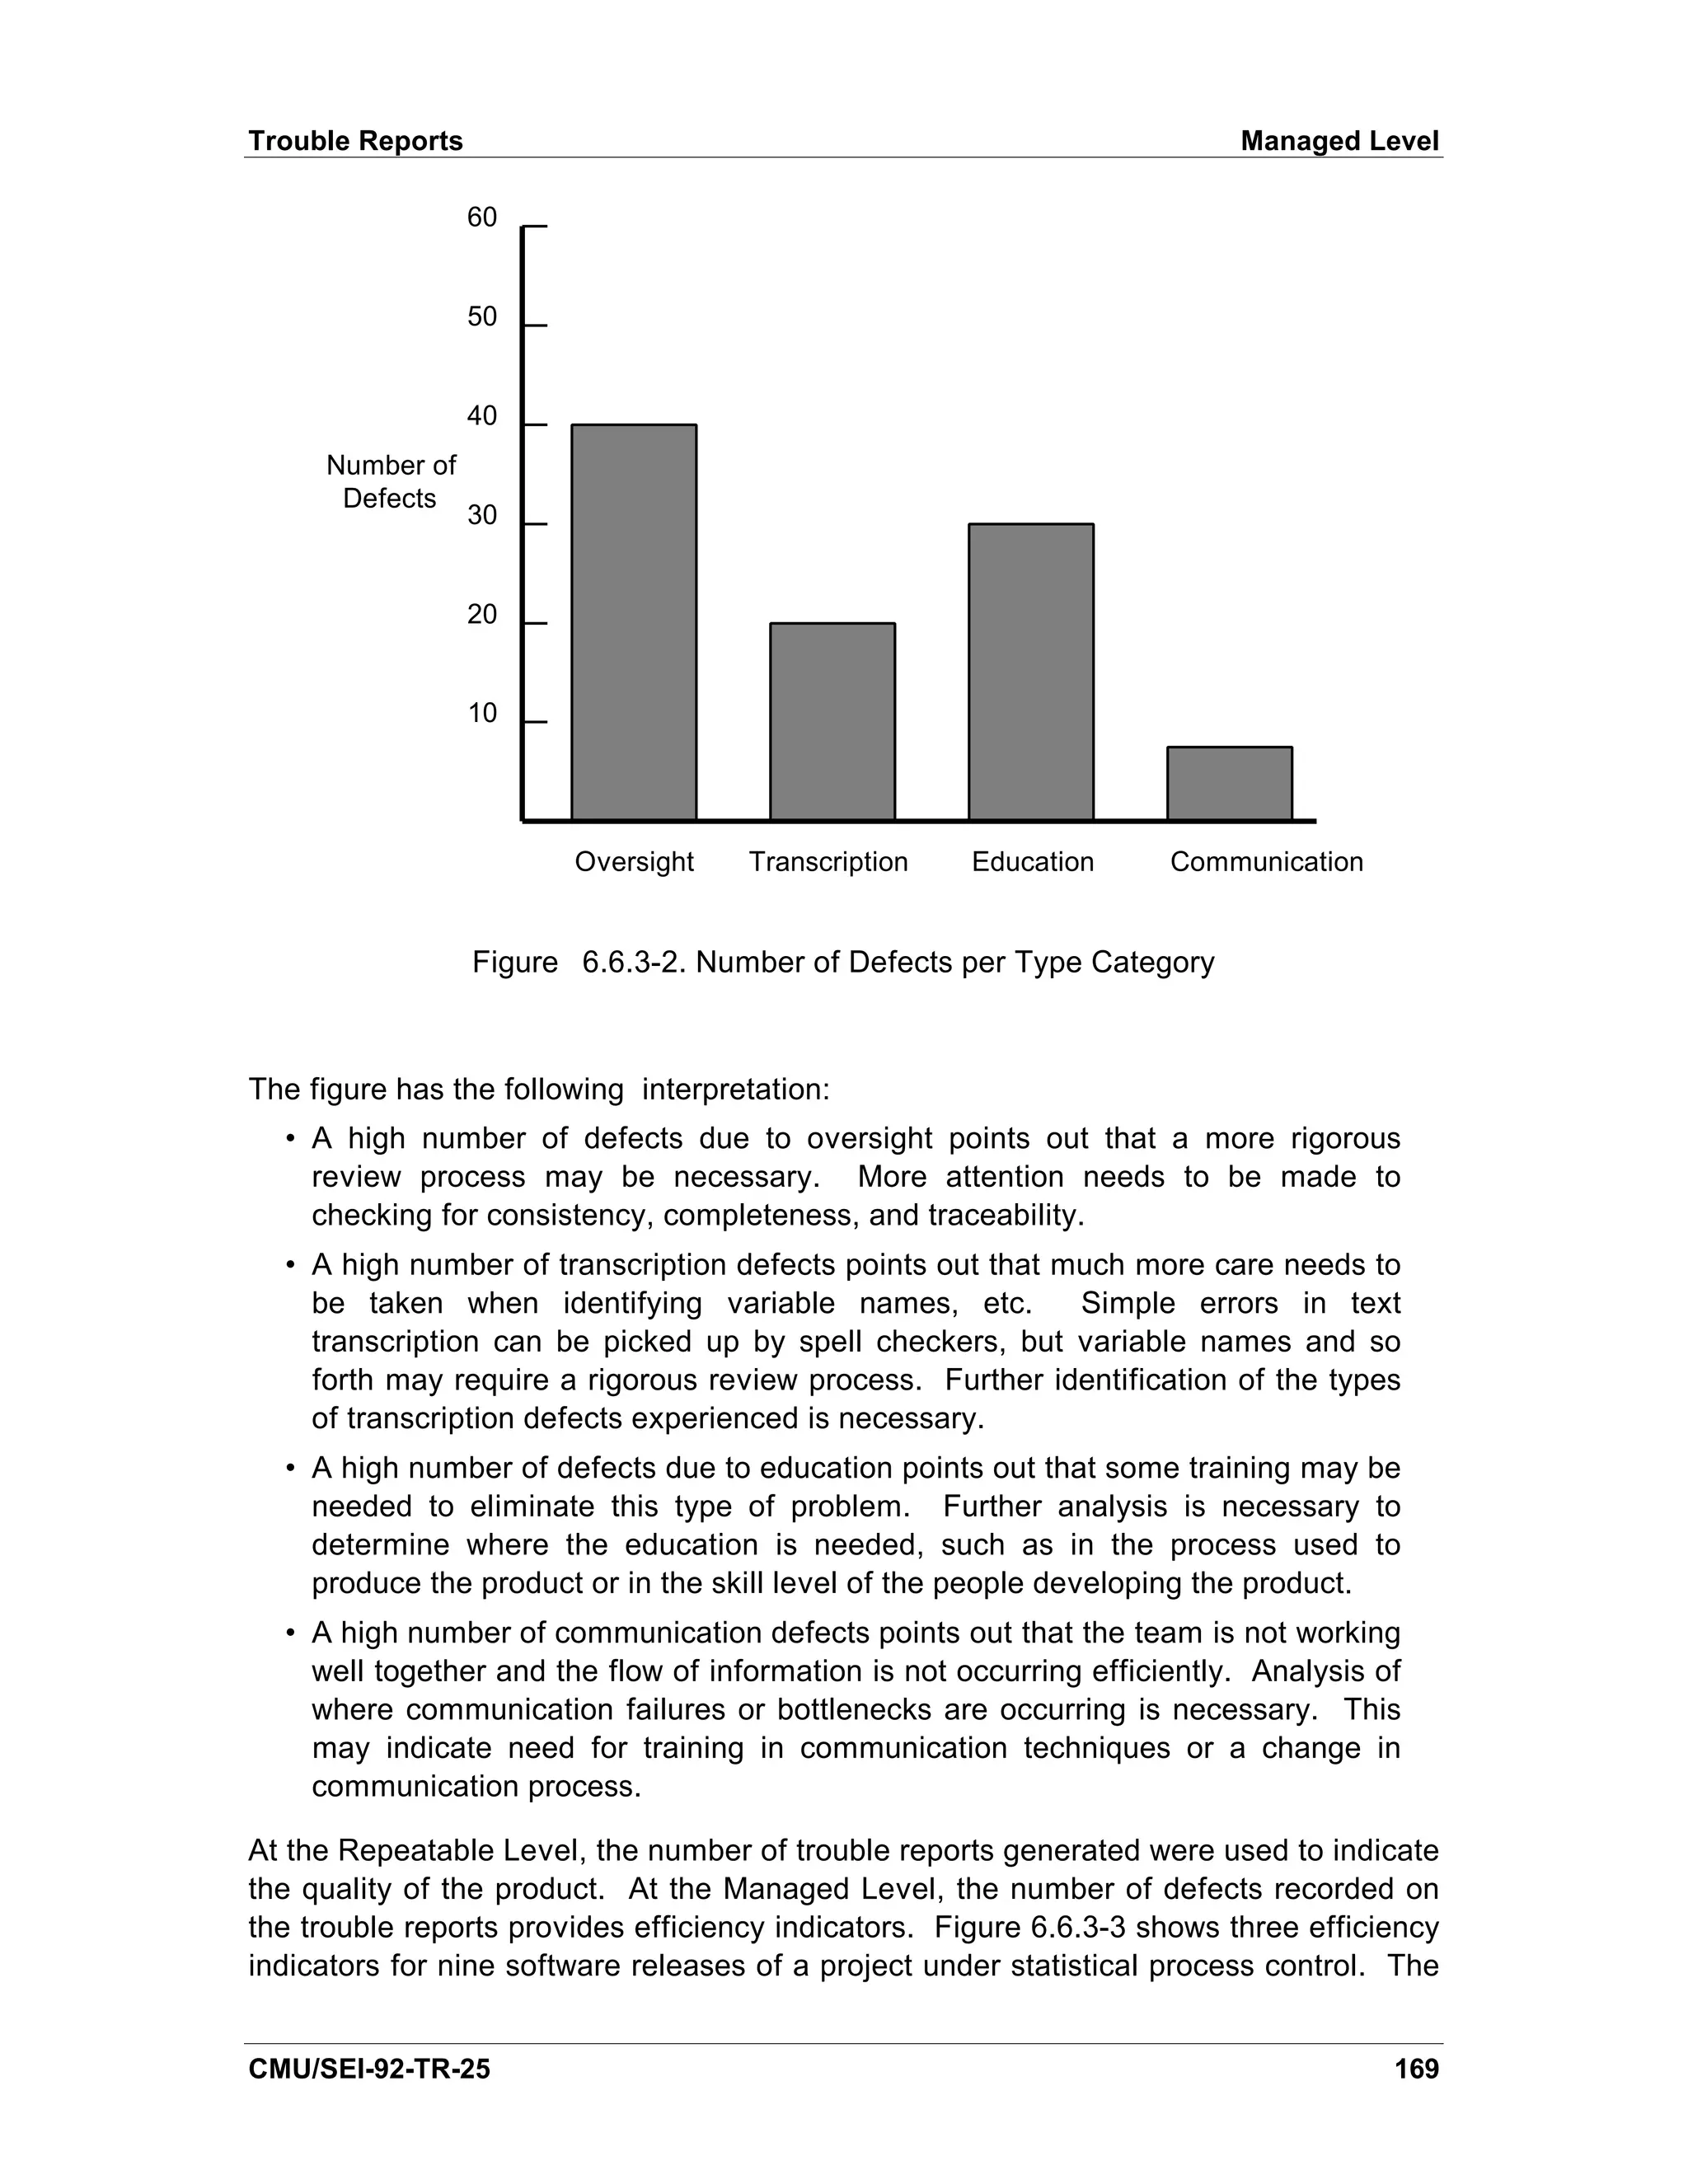
the areas that are the sources of the trouble reports. Figure 6.6.3-2 shows the number
of defects by type category [Mays 90].
168 CMU/SEI-92-TR-25](https://image.slidesharecdn.com/softwaremeasuresandthecapabilitymaturitymodel-1992johnh-baumertsei-110103031855-phpapp02/75/Software-measures-and-the-capability-maturity-model-1992-john-h-baumert-sei-186-2048.jpg)
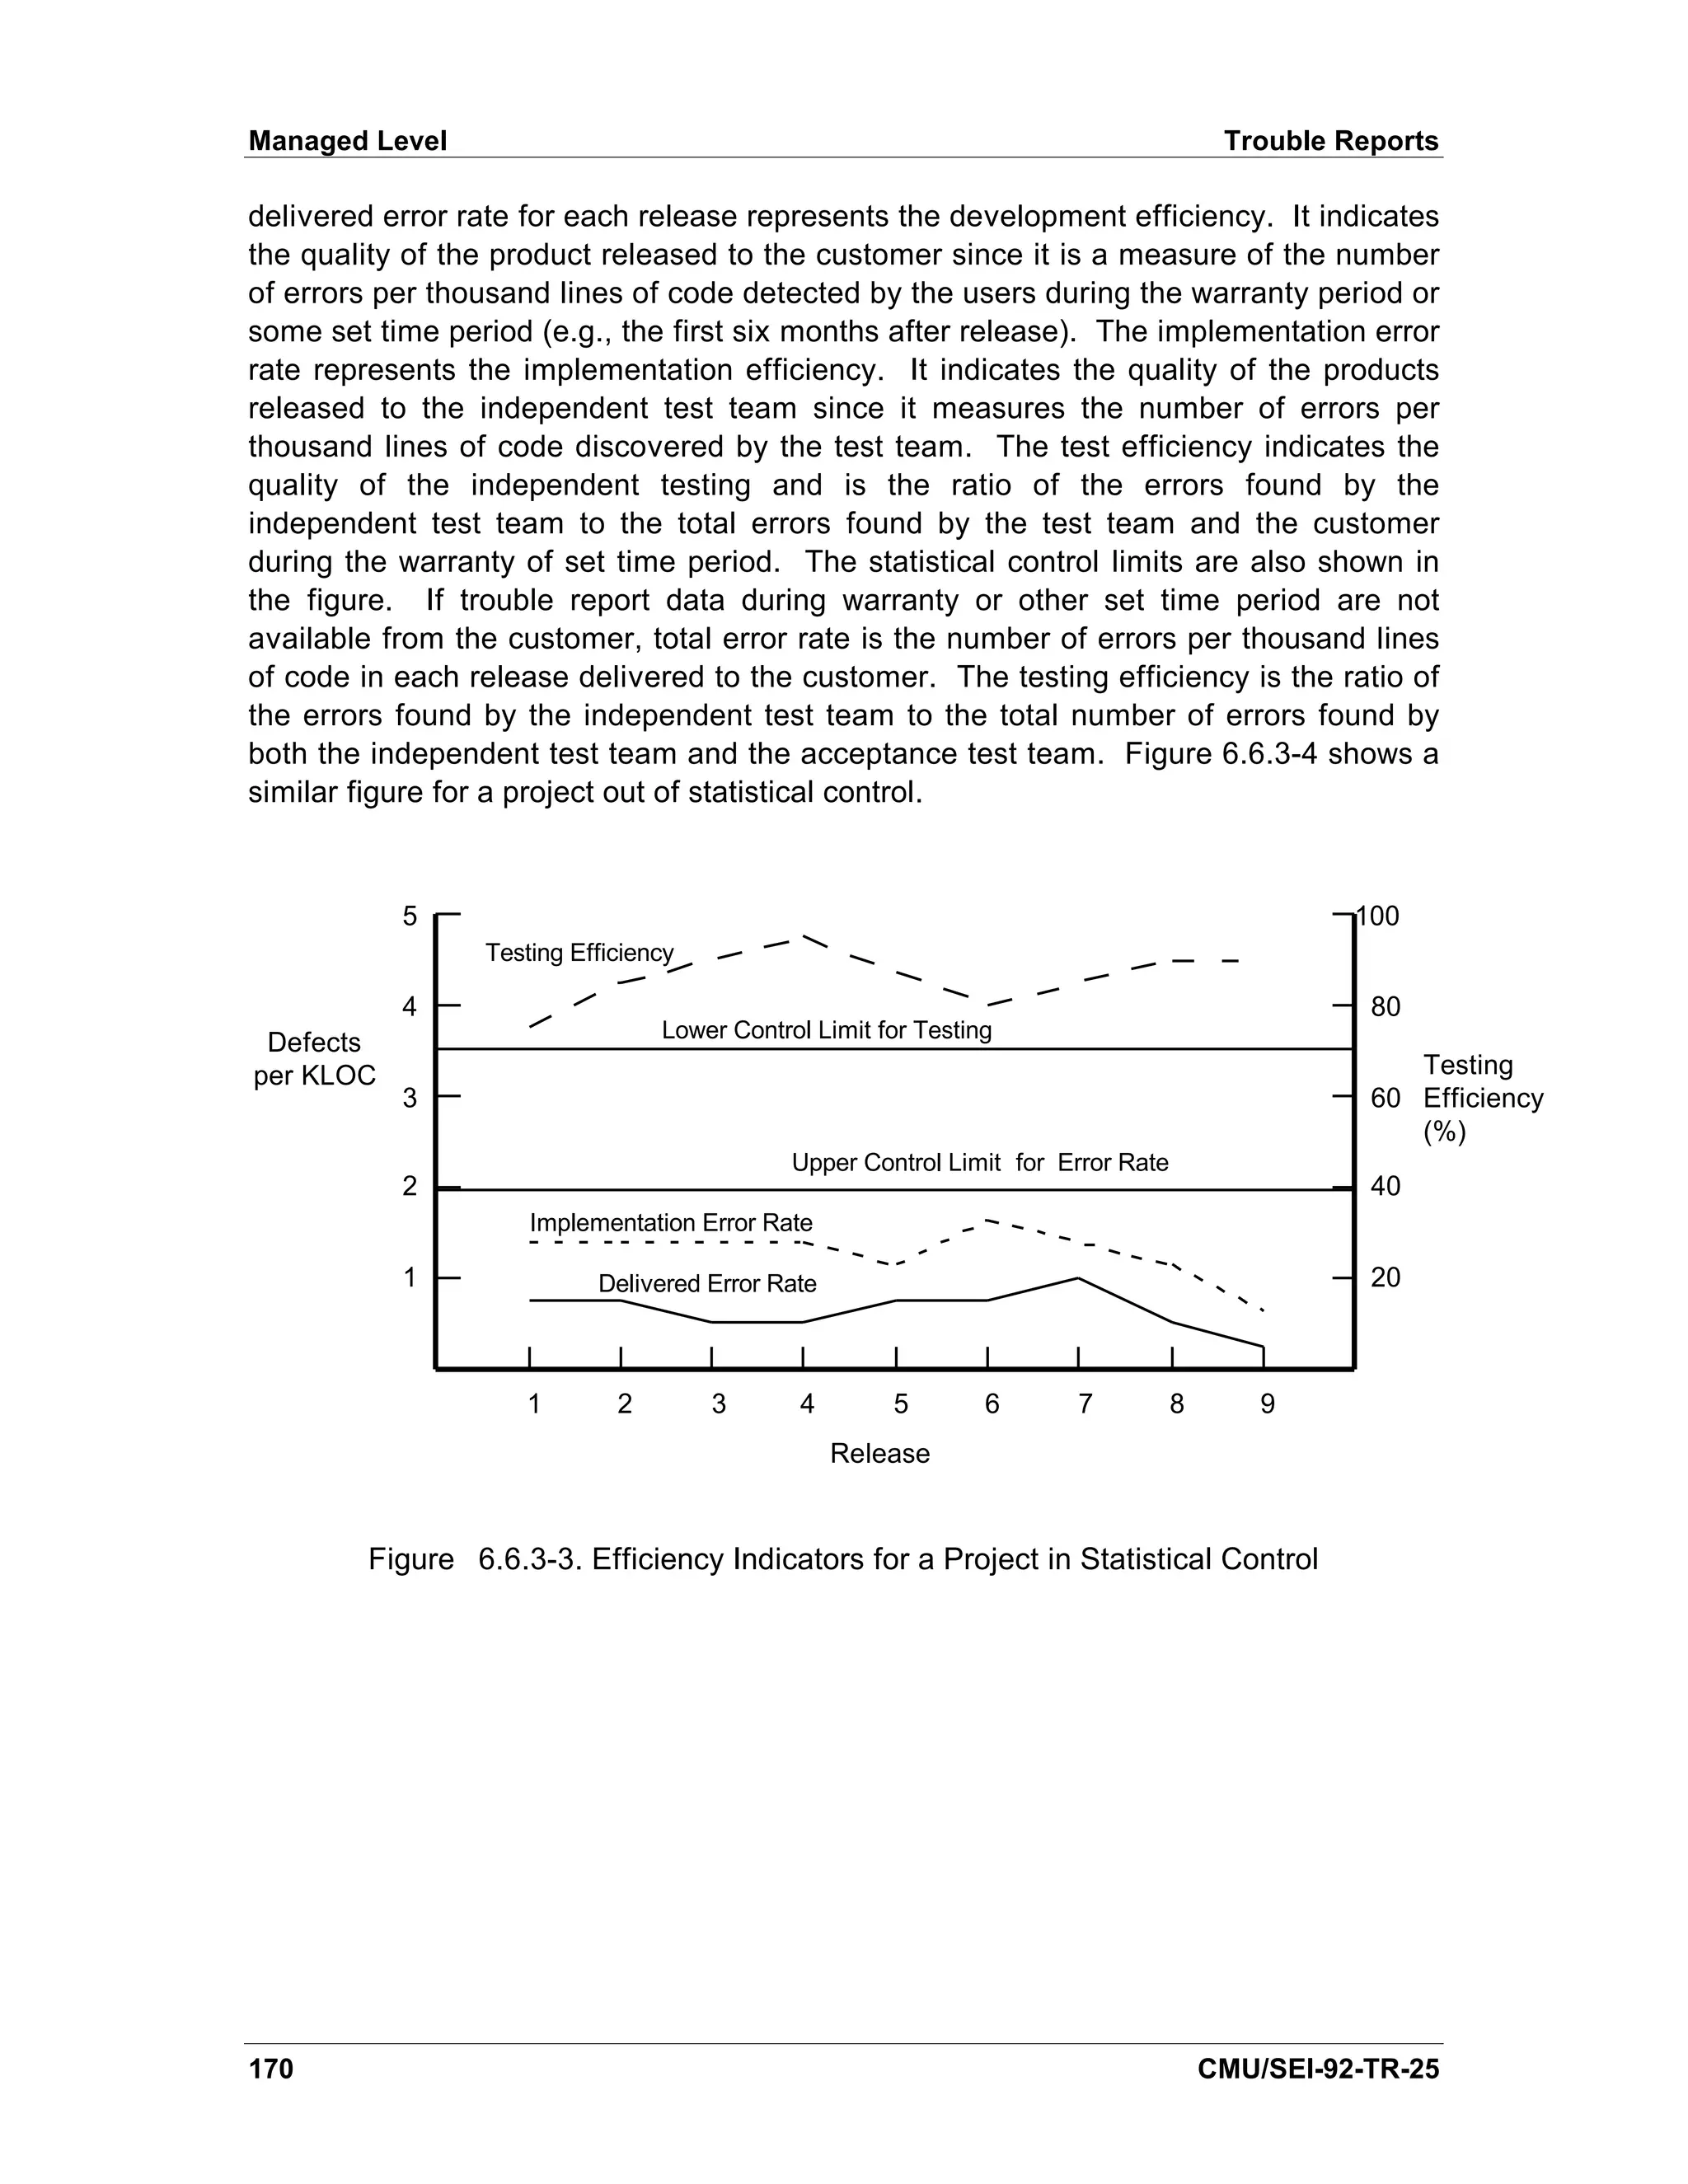
![Trouble Reports Managed Level
5 100
Testing Efficiency
4 80
Defects Testing
Lower Control Limit for Testing
per 3 60 Efficiency
KLOC (%)
Upper Control Limit for Error Rate
2 40
Implementation Error Rate
1 20
Delivered Error Rate
1 2 3 4 5 6 7 8 9
Release
Figure 6.6.3-4. Efficiency Indicators for a Project out of Statistical Control
When interpreting efficiency indicators, the project software manger needs to
remember to always look for process defects, not personnel defects. There may be a
number of causes responsible for the defects. For example, an unrealistic
implementation schedule or lack of appropriate resources can result in poor
implementation efficiency, and inadequate time or resources for independent testing
can result in poor testing efficiency.
Sources
From the Defined Level:
[AFSC 87], [Buckley 90], [Card 90], [Decker 91], [Grady 87], [IEEE 1061], [Landis 90],
[Pfleeger 89], and [Rozum 92] discuss trouble reports.
[Florac 92] has a thorough discussion of trouble reports and serves as the main source
of information for this section.
[Florac 92] has a thorough discussion of problem reports.
[IEEE 1044] was used to determine the inputs for this indicator.
For the Managed Level:
[DSDM 89] served as the source of information for the efficiency indicators.
[Mays 90] provided the categories in Figure 6.6.3-2.
CMU/SEI-92-TR-25 171](https://image.slidesharecdn.com/softwaremeasuresandthecapabilitymaturitymodel-1992johnh-baumertsei-110103031855-phpapp02/75/Software-measures-and-the-capability-maturity-model-1992-john-h-baumert-sei-189-2048.jpg)

![Peer Review Results Managed Level
• For each defect:
- Severity
- Type
- Rework effort
- Life-cycle stage in which it was introduced into product
- Number of units affected by defect
- Number of units containing defect
• Number of peer reviews
• Number of re-reviews
Interpretation
At the Managed Level, the organization continues to use the peer review indicators
from the Defined Level, but now focuses on the characteristics of the peer review
process. For example, each project can determine the following:
• The number KLOC reviewed per each hour in a review (KLOC/review-hour)
• The number KLOC reviewed per each hour of preparation (KLOC/preparation-
hour)
• The number of hours it takes to detect a major defect (hours/major defect)
• The ratio of major to minor defects
A project can compare the values it has for these items and can compare them to the
values for the organization as a whole and/or the project can compare the values it
obtains for each release. For the latter, the project software manager can expect an
improvement in each of the quantities since the project staff gain expertise both with
the technical application and with the review process.
In Chapter 15, Humphrey has additional examples [Humphrey 89]. He shows plots of
the number of errors per thousand lines of code (errors/KLOC) versus the review rate
(KLOC/hour), review rate (KLOC/hour) versus preparation rate (KLOC/hour of
preparation), and review rate (lines/hour) versus preparation time (hours/KLOC).
Figure 6.6.4-1 shows how defect detection efficiency varies with the inspection rate.
The efficiency of each product review is plotted by its review rate. There is a curve
fitted to the points that shows the overall view. This figure shows that as the review
rate increases, the efficiency drops. It also shows that as the inspection rate
decreases, the efficiency increases only to a point. Slower review rates are not cost
effective. In this example, the lower defect detection efficiency for reviews that
inspected source code at less than 75 LOC/hour may indicate that those review teams
are not adequately trained in peer reviews. Preparation rate may also be used in
addition to, or instead of, review rate.
CMU/SEI-92-TR-25 175](https://image.slidesharecdn.com/softwaremeasuresandthecapabilitymaturitymodel-1992johnh-baumertsei-110103031855-phpapp02/75/Software-measures-and-the-capability-maturity-model-1992-john-h-baumert-sei-193-2048.jpg)
![Managed Level Peer Review Results
A figure similar to Figure 6.6.4-1 can be used to plot defect detection rates (defects
detected/hour) versus review rates. The same interpretation may be used.
Defect data also lends itself to statistical process control techniques since the sample is
large enough, and the data are homogeneous (at least for a particular type of review).
Humphrey also shows example control charts for the number of lines of code reviewed
per hour, the number of defects detected per total review hours, the number of defects
detected per thousand lines of code, and the number of hours of preparation per hour
of review for each component of a project [Humphrey 89].
60
50
Defect
Detection 40
Efficiency
%
30
20
10
Average
25 50 75 100 125 150 175 200 225 250
LOC Reviewed per Hour
Figure 6.6.4-1. Defect Detection Efficiency vs. Review Rate
Sources
From the Defined Level:
[Decker 91] and [Florac 92] were the major sources of information for this section.
[AFSC 87], [Buckley 90], [Card 90], [Grady 87], [IEEE 1061], [Landis 90], [Pfleeger 89],
and [Rozum 92] discuss concepts on tracking and analyzing trouble reports that are
applicable to peer review data.
[IEEE 1044] was consulted for the types of inspection data to be collected.
176 CMU/SEI-92-TR-25](https://image.slidesharecdn.com/softwaremeasuresandthecapabilitymaturitymodel-1992johnh-baumertsei-110103031855-phpapp02/75/Software-measures-and-the-capability-maturity-model-1992-john-h-baumert-sei-194-2048.jpg)
![Peer Review Results Managed Level
[Pyzdek 89] discusses Pareto analysis.
For the Managed Level:
[Humphrey 89] discusses measurement of the peer review process.
CMU/SEI-92-TR-25 177](https://image.slidesharecdn.com/softwaremeasuresandthecapabilitymaturitymodel-1992johnh-baumertsei-110103031855-phpapp02/75/Software-measures-and-the-capability-maturity-model-1992-john-h-baumert-sei-195-2048.jpg)


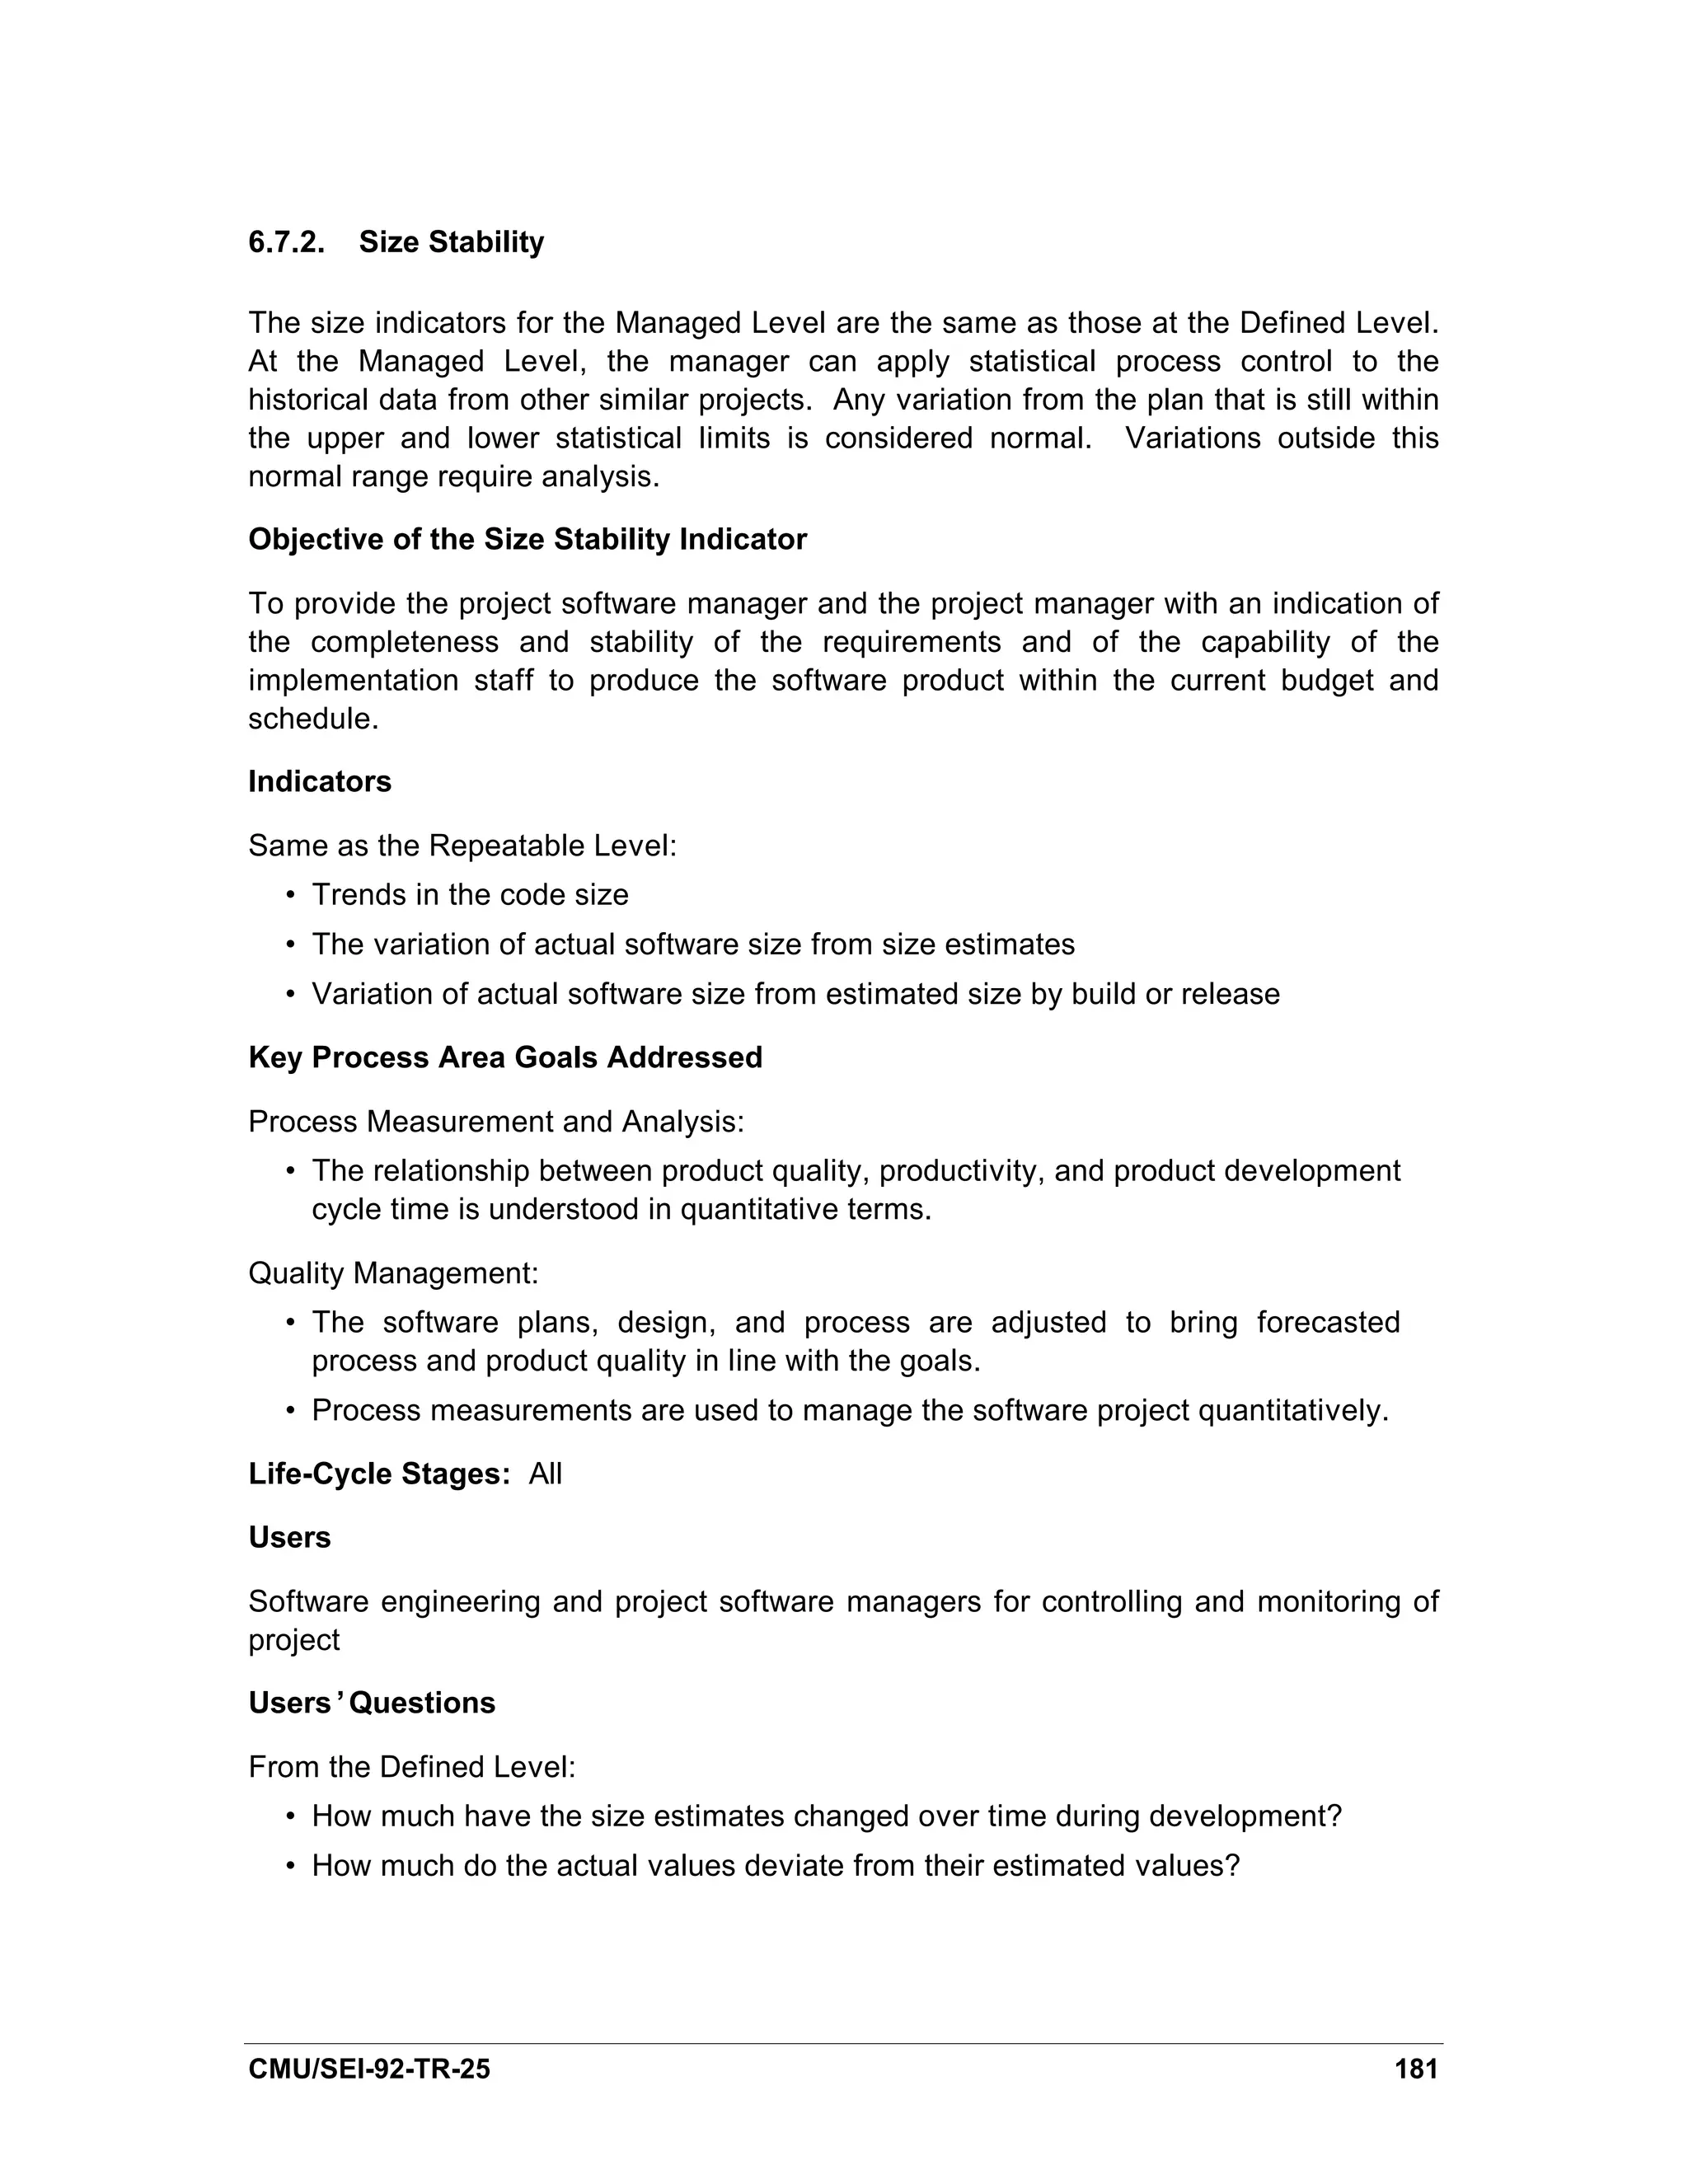
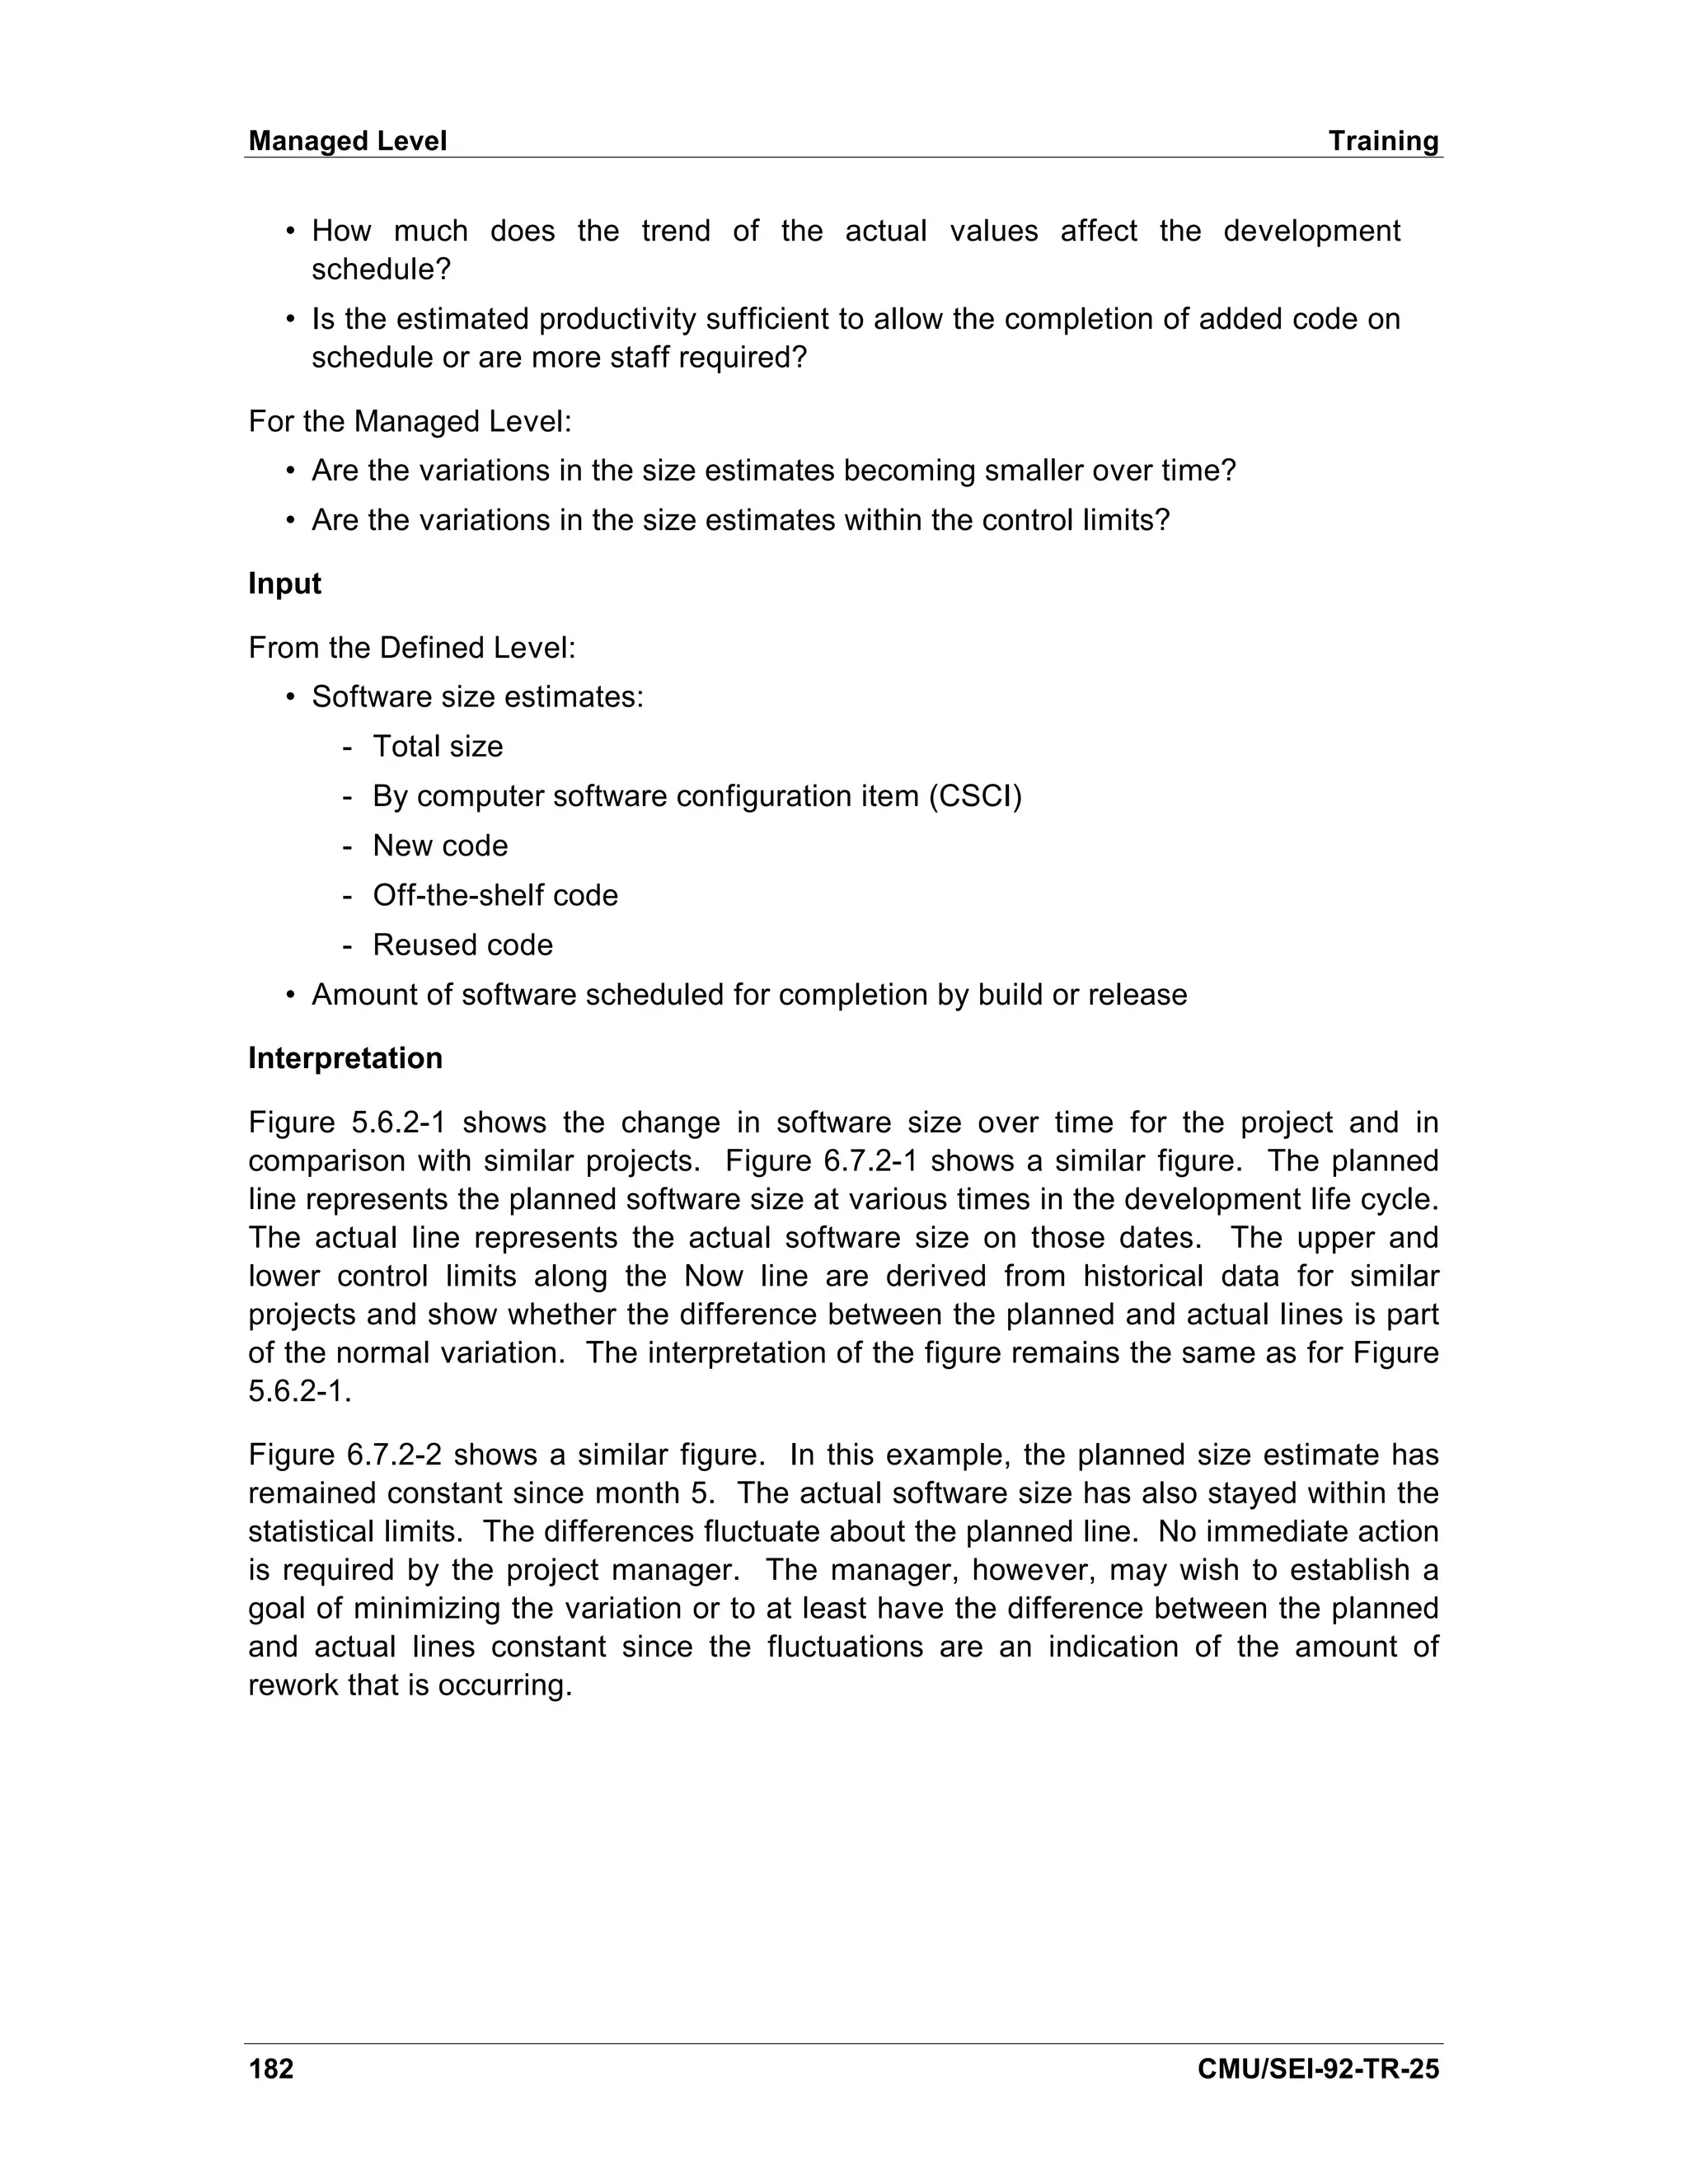
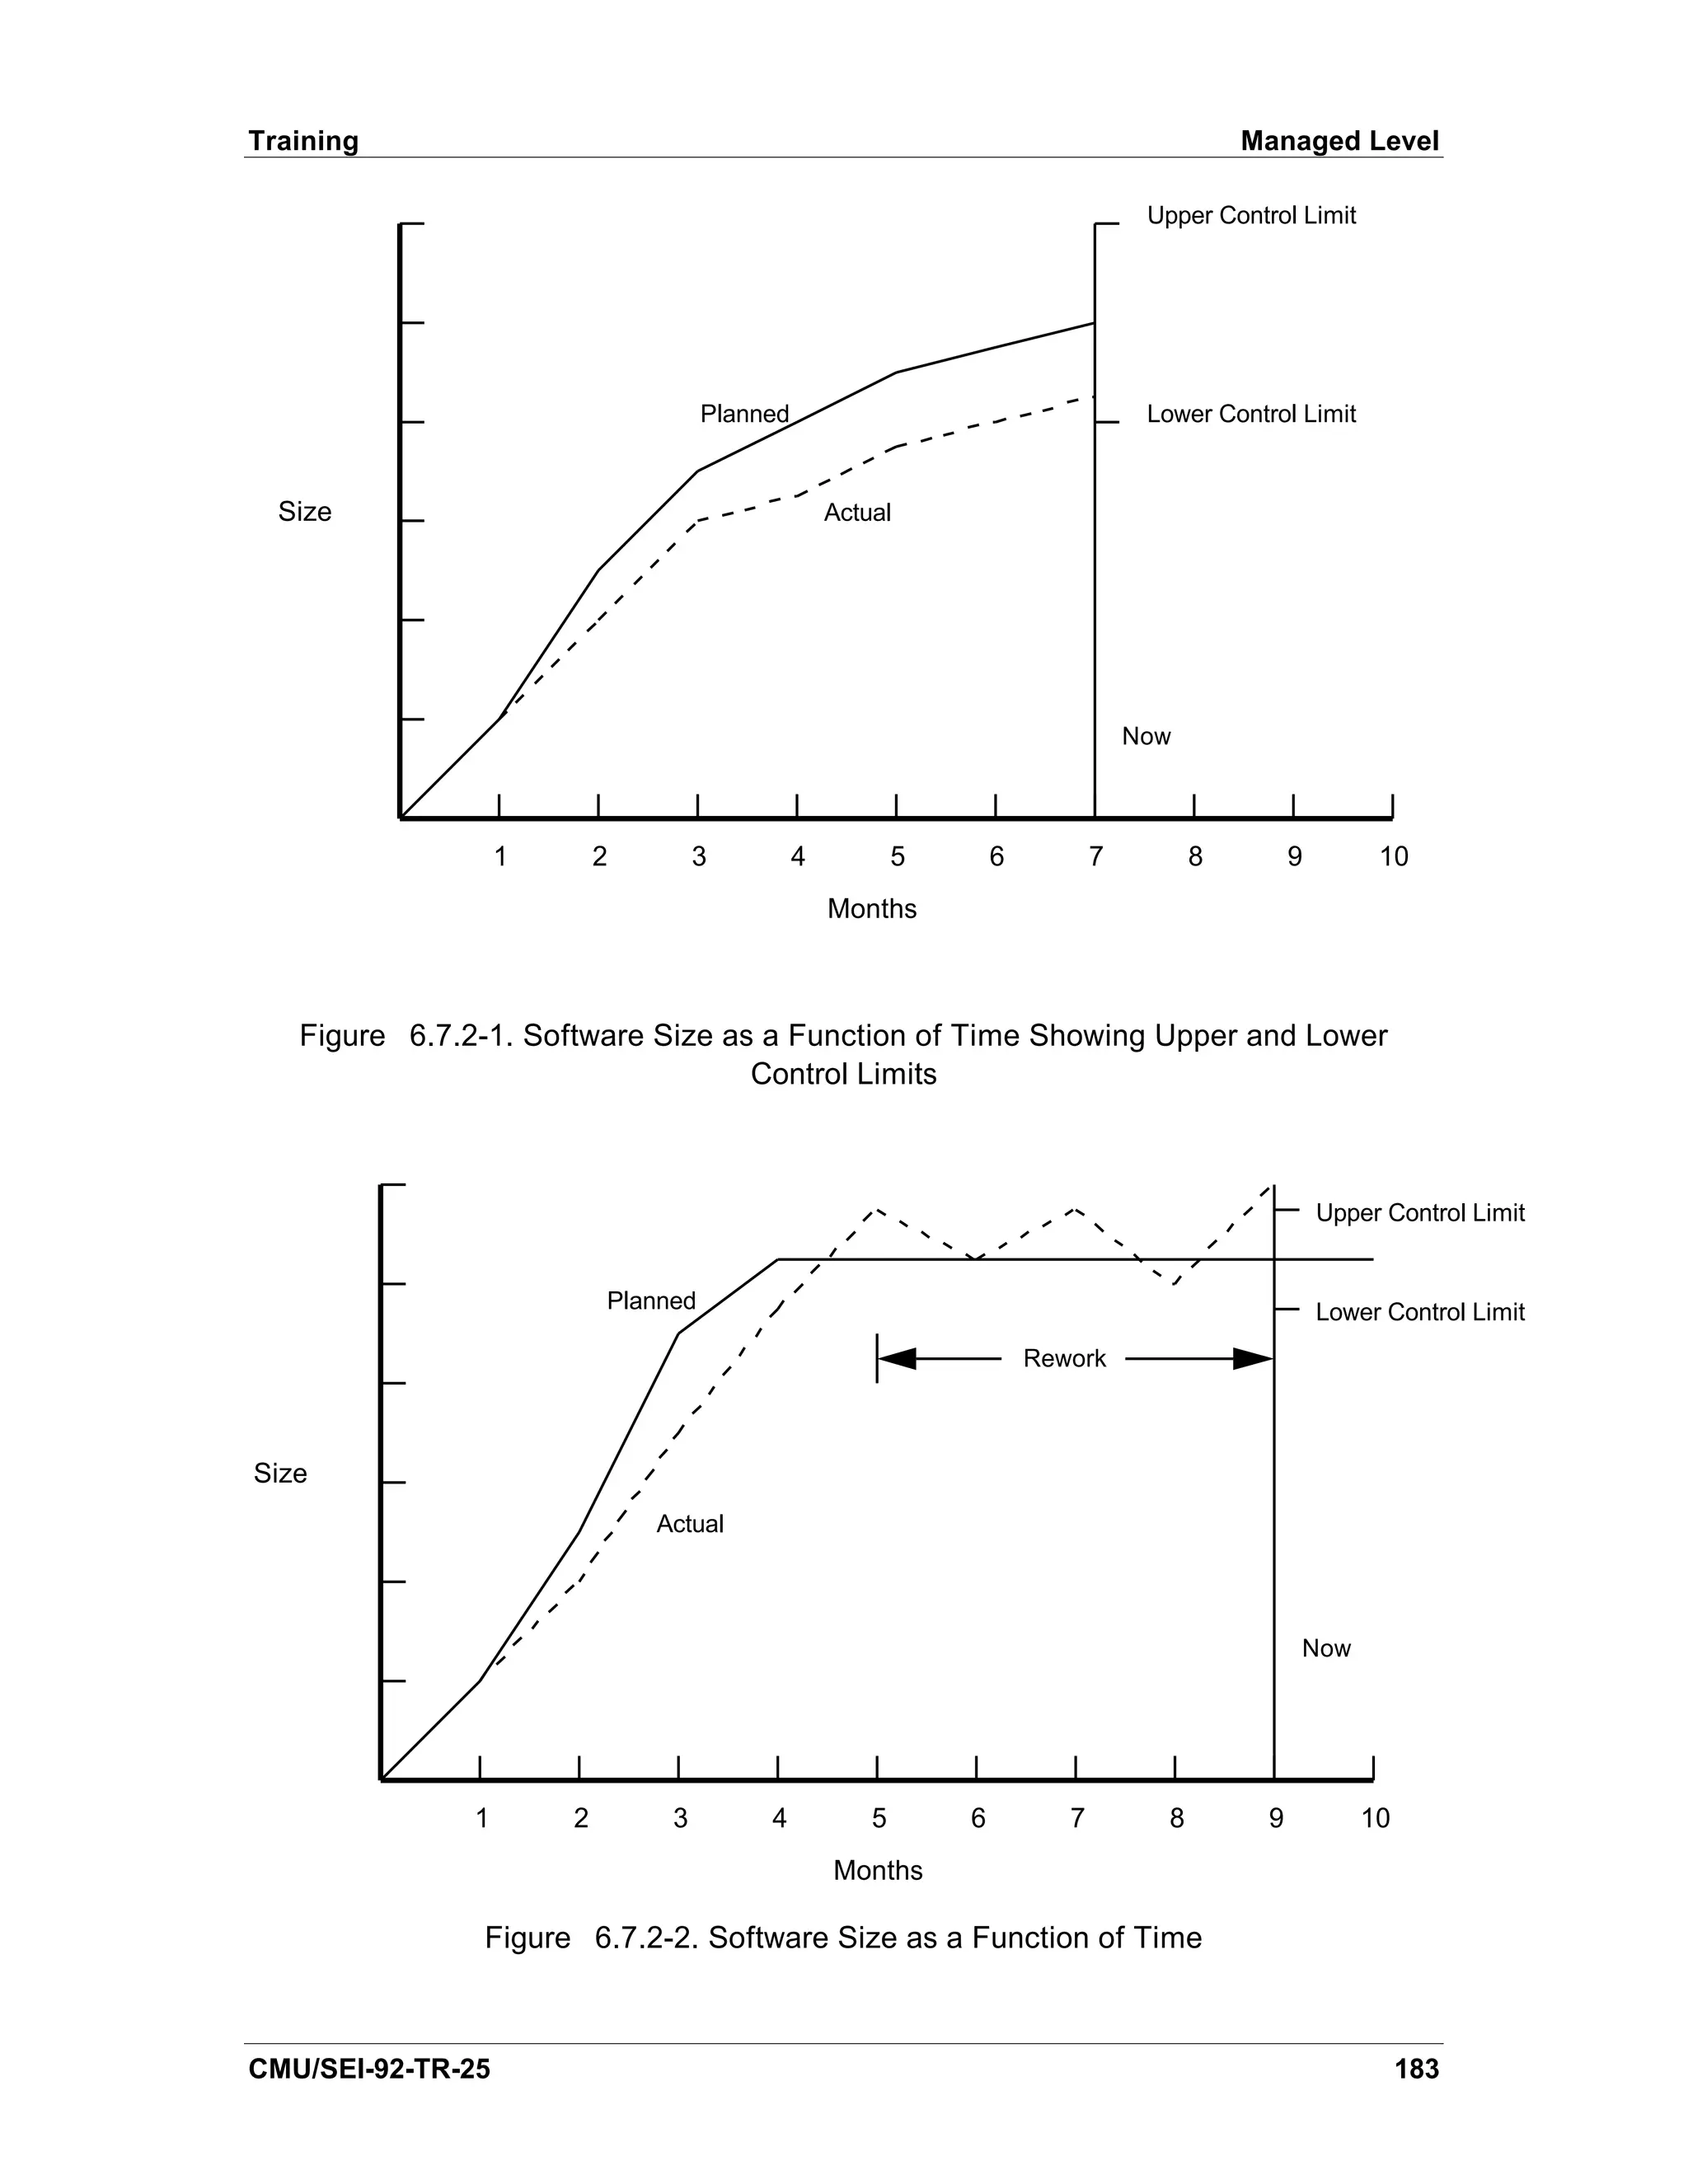
![Managed Level Training
Sources
From the Repeatable Level:
[AFSC 86], [Decker 91], [Landis 90], [Pfleeger 89], and [Schultz 88] all discuss tracking
software size.
6.7.3. Process Stability
The process stability indicators are the same as the Defined Level (see Section 5.6.3).
184 CMU/SEI-92-TR-25](https://image.slidesharecdn.com/softwaremeasuresandthecapabilitymaturitymodel-1992johnh-baumertsei-110103031855-phpapp02/75/Software-measures-and-the-capability-maturity-model-1992-john-h-baumert-sei-202-2048.jpg)

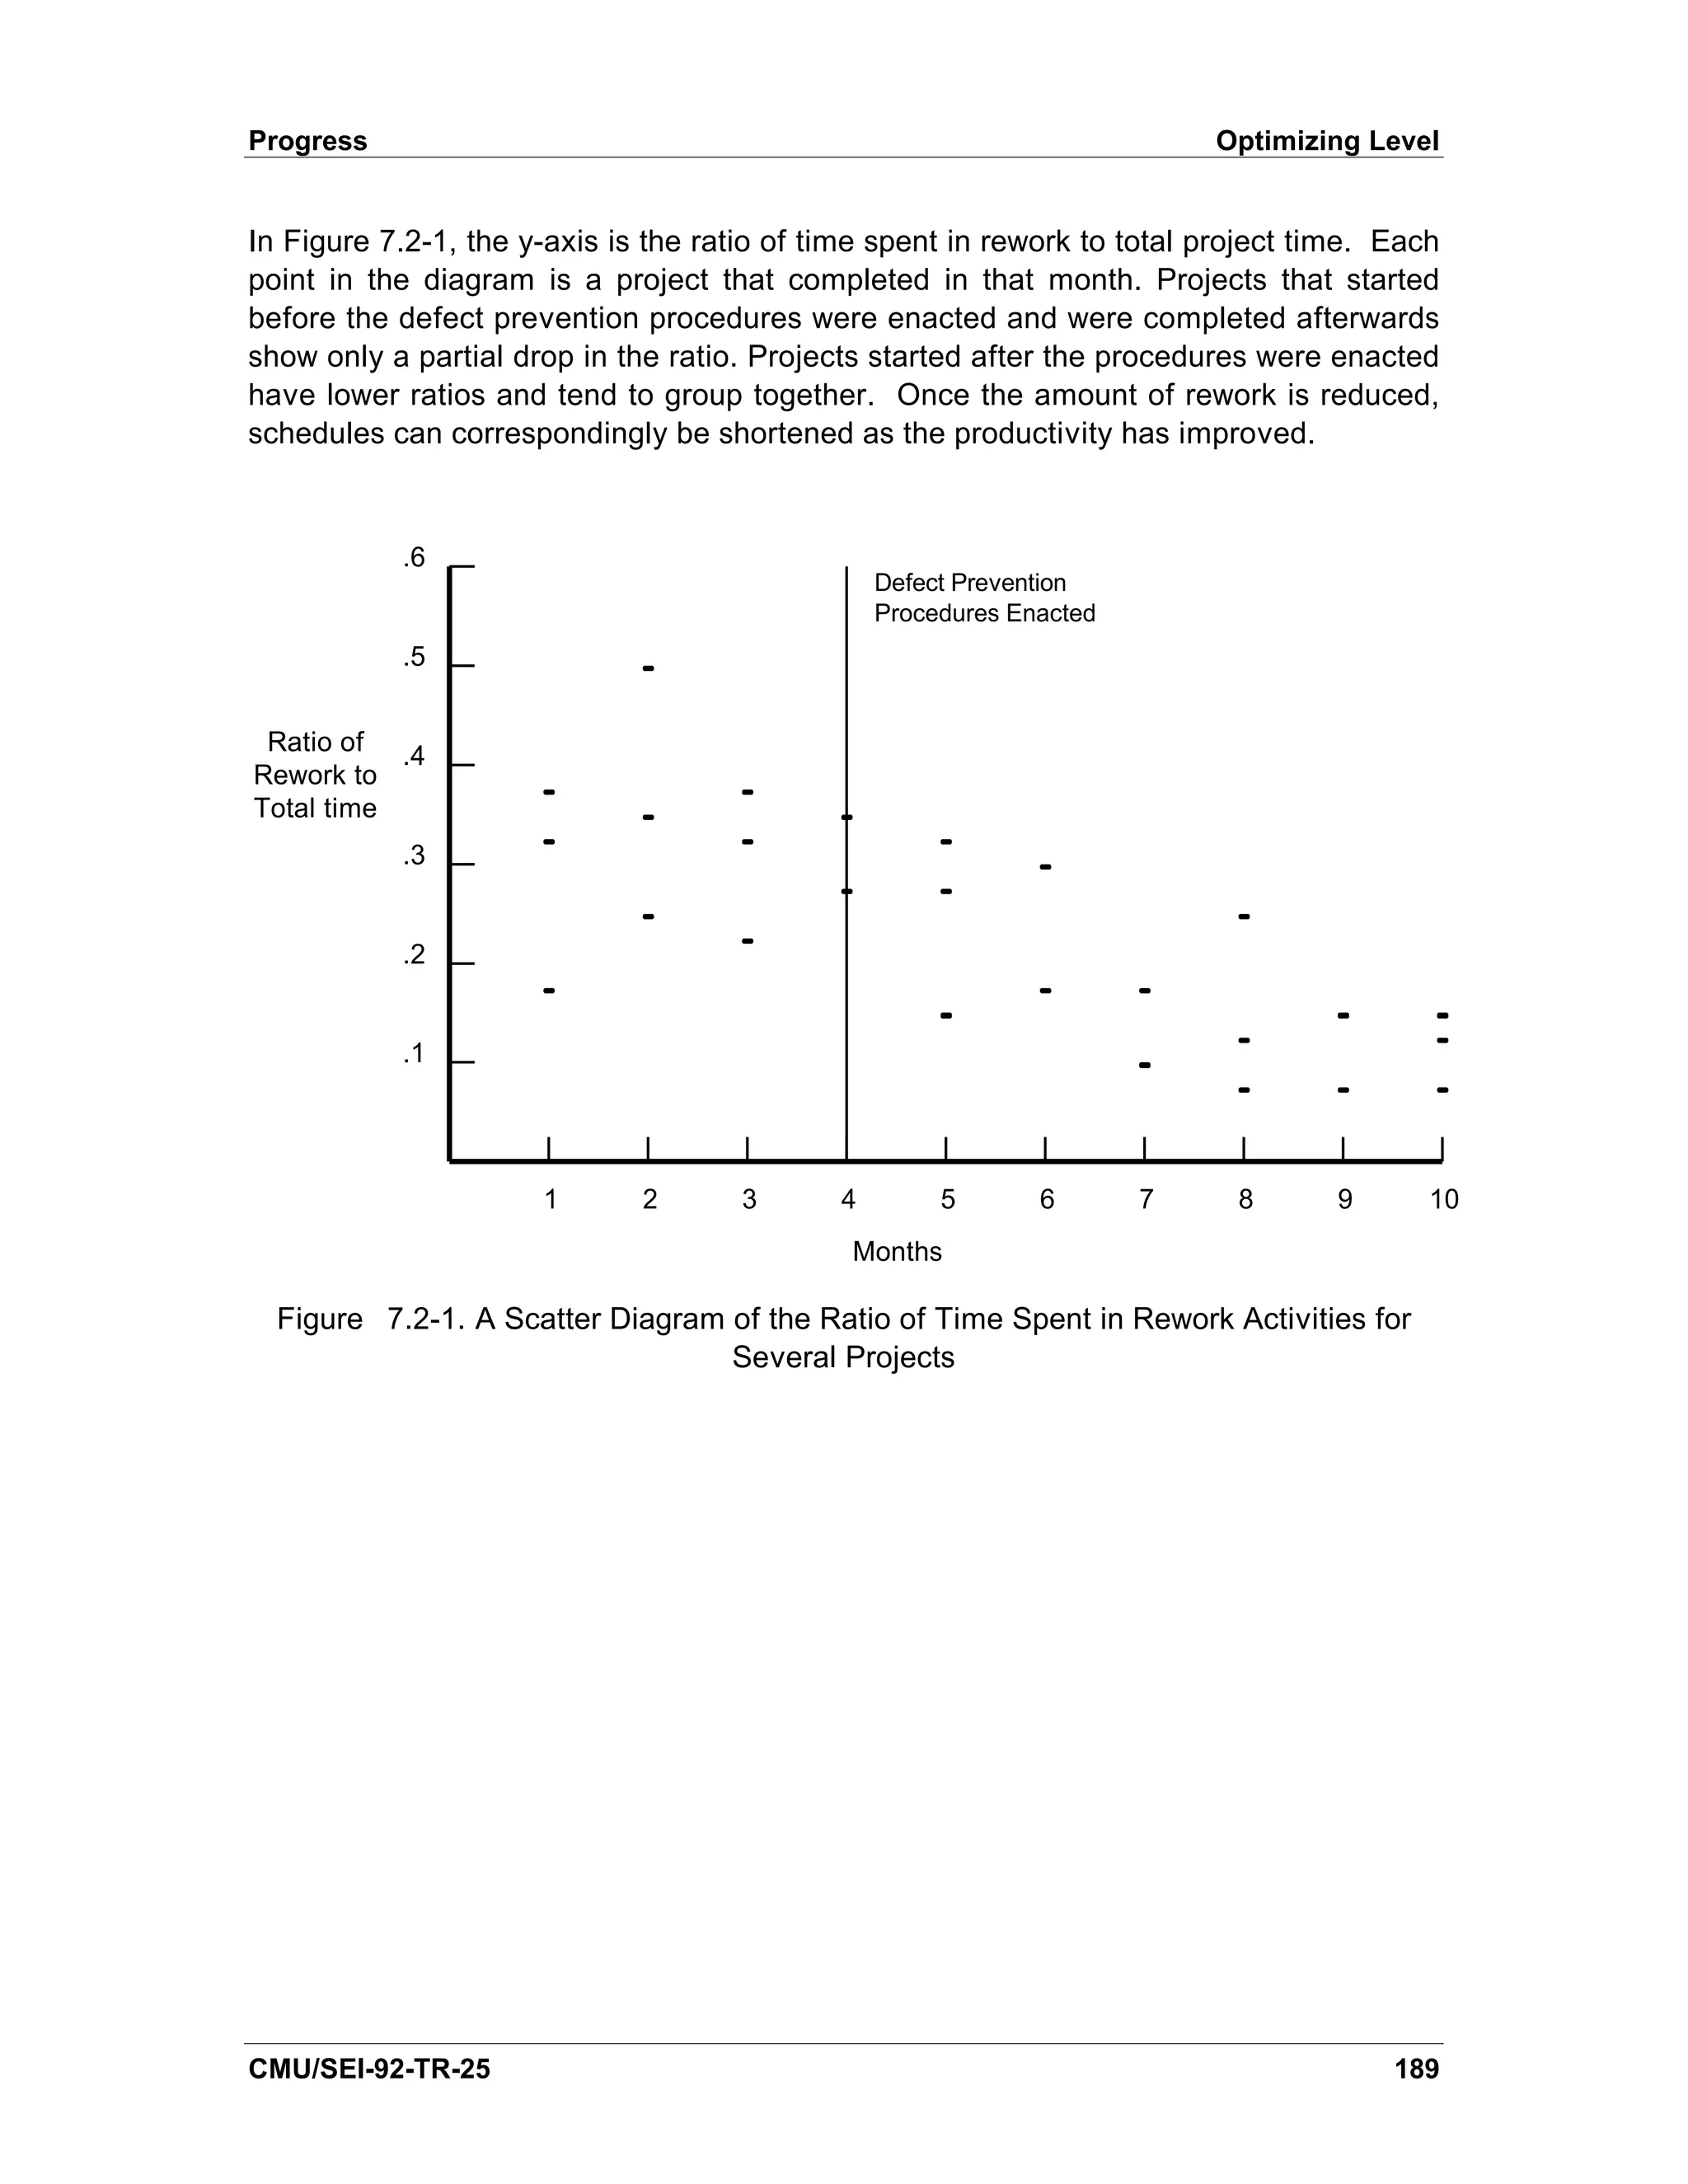
![Optimizing Level Progress
Figure 7.2-2 shows the same diagram with control limits and an average line derived
from the data. Before month 4, the ratios are high and vary widely. Defect prevention
procedures are enacted during month 5. Although there is still large variation during
month 5 through month 7, the trend indicates that the procedures are effective. By
month 8, the new procedures have stabilized, the ratios have dropped to a steady state
and new control limits are established.
.6
Defect Prevention
Upper Control Limit Procedures Enacted
.5
Ratio of
.4
Rework to
Total time
.3
Average Ratio
.2 Upper Control Limit
.1 Lower Control Limit
Lower Control Limit
1 2 3 4 5 6 7 8 9 10
Months
Figure 7.2-2. The Ratio of Time Spent in Rework Activities for Several Projects with
Control Limits
This figure can also be used to track the ratios of peer reviews, coding, testing, and
other activities to the total development time. In turn, this allows an organization to
determine its performance with respect to preventive and reactive efforts, that is, the
organization can compare the time spent in design as opposed to coding or the time
spent in peer reviews to testing. The emphasis should be on preventive activities.
Sources
From the Repeatable Level:
[AFSC 86] discusses planned and actual completions graphs at the computer software
configuration item (CSCI) level.
190 CMU/SEI-92-TR-25](https://image.slidesharecdn.com/softwaremeasuresandthecapabilitymaturitymodel-1992johnh-baumertsei-110103031855-phpapp02/75/Software-measures-and-the-capability-maturity-model-1992-john-h-baumert-sei-208-2048.jpg)
![Progress Optimizing Level
[Decker 91] lists requirements diagrams; function specifications; design diagrams; test
cases; units designed, coded, and tested; modules tested; and computer software
components tested as items tracked on planned and actual completions graphs.
[Grady 87] states that calendar measures are part of the Hewlett-Packard metrics
program.
[Landis 90] discusses planned and actual completions graphs for units coded, read,
and tested.
[Rozum 92] has a discussion on Gantt charts in their milestone performance metric and
a discussion of planned and actuals in their development progress metric.
[Schultz 88] discusses software requirements documented in his design progress
metric and the number of computer software units (CSU) designed, coded, tested, and
integrated in his CSU development progress metric. He also discusses the planned
and actual completions of CSCIs integrated in his test progress metric.
[STEP 91] discusses a schedule metric upon which Figure 4.2-2 is based and a
development progress metric.
From the Defined Level:
[Lockyer 84] discusses Gantt charts and the critical path method.
For the Optimizing Level:
[Pyzdek 89] discusses SPC techniques.
CMU/SEI-92-TR-25 191](https://image.slidesharecdn.com/softwaremeasuresandthecapabilitymaturitymodel-1992johnh-baumertsei-110103031855-phpapp02/75/Software-measures-and-the-capability-maturity-model-1992-john-h-baumert-sei-209-2048.jpg)

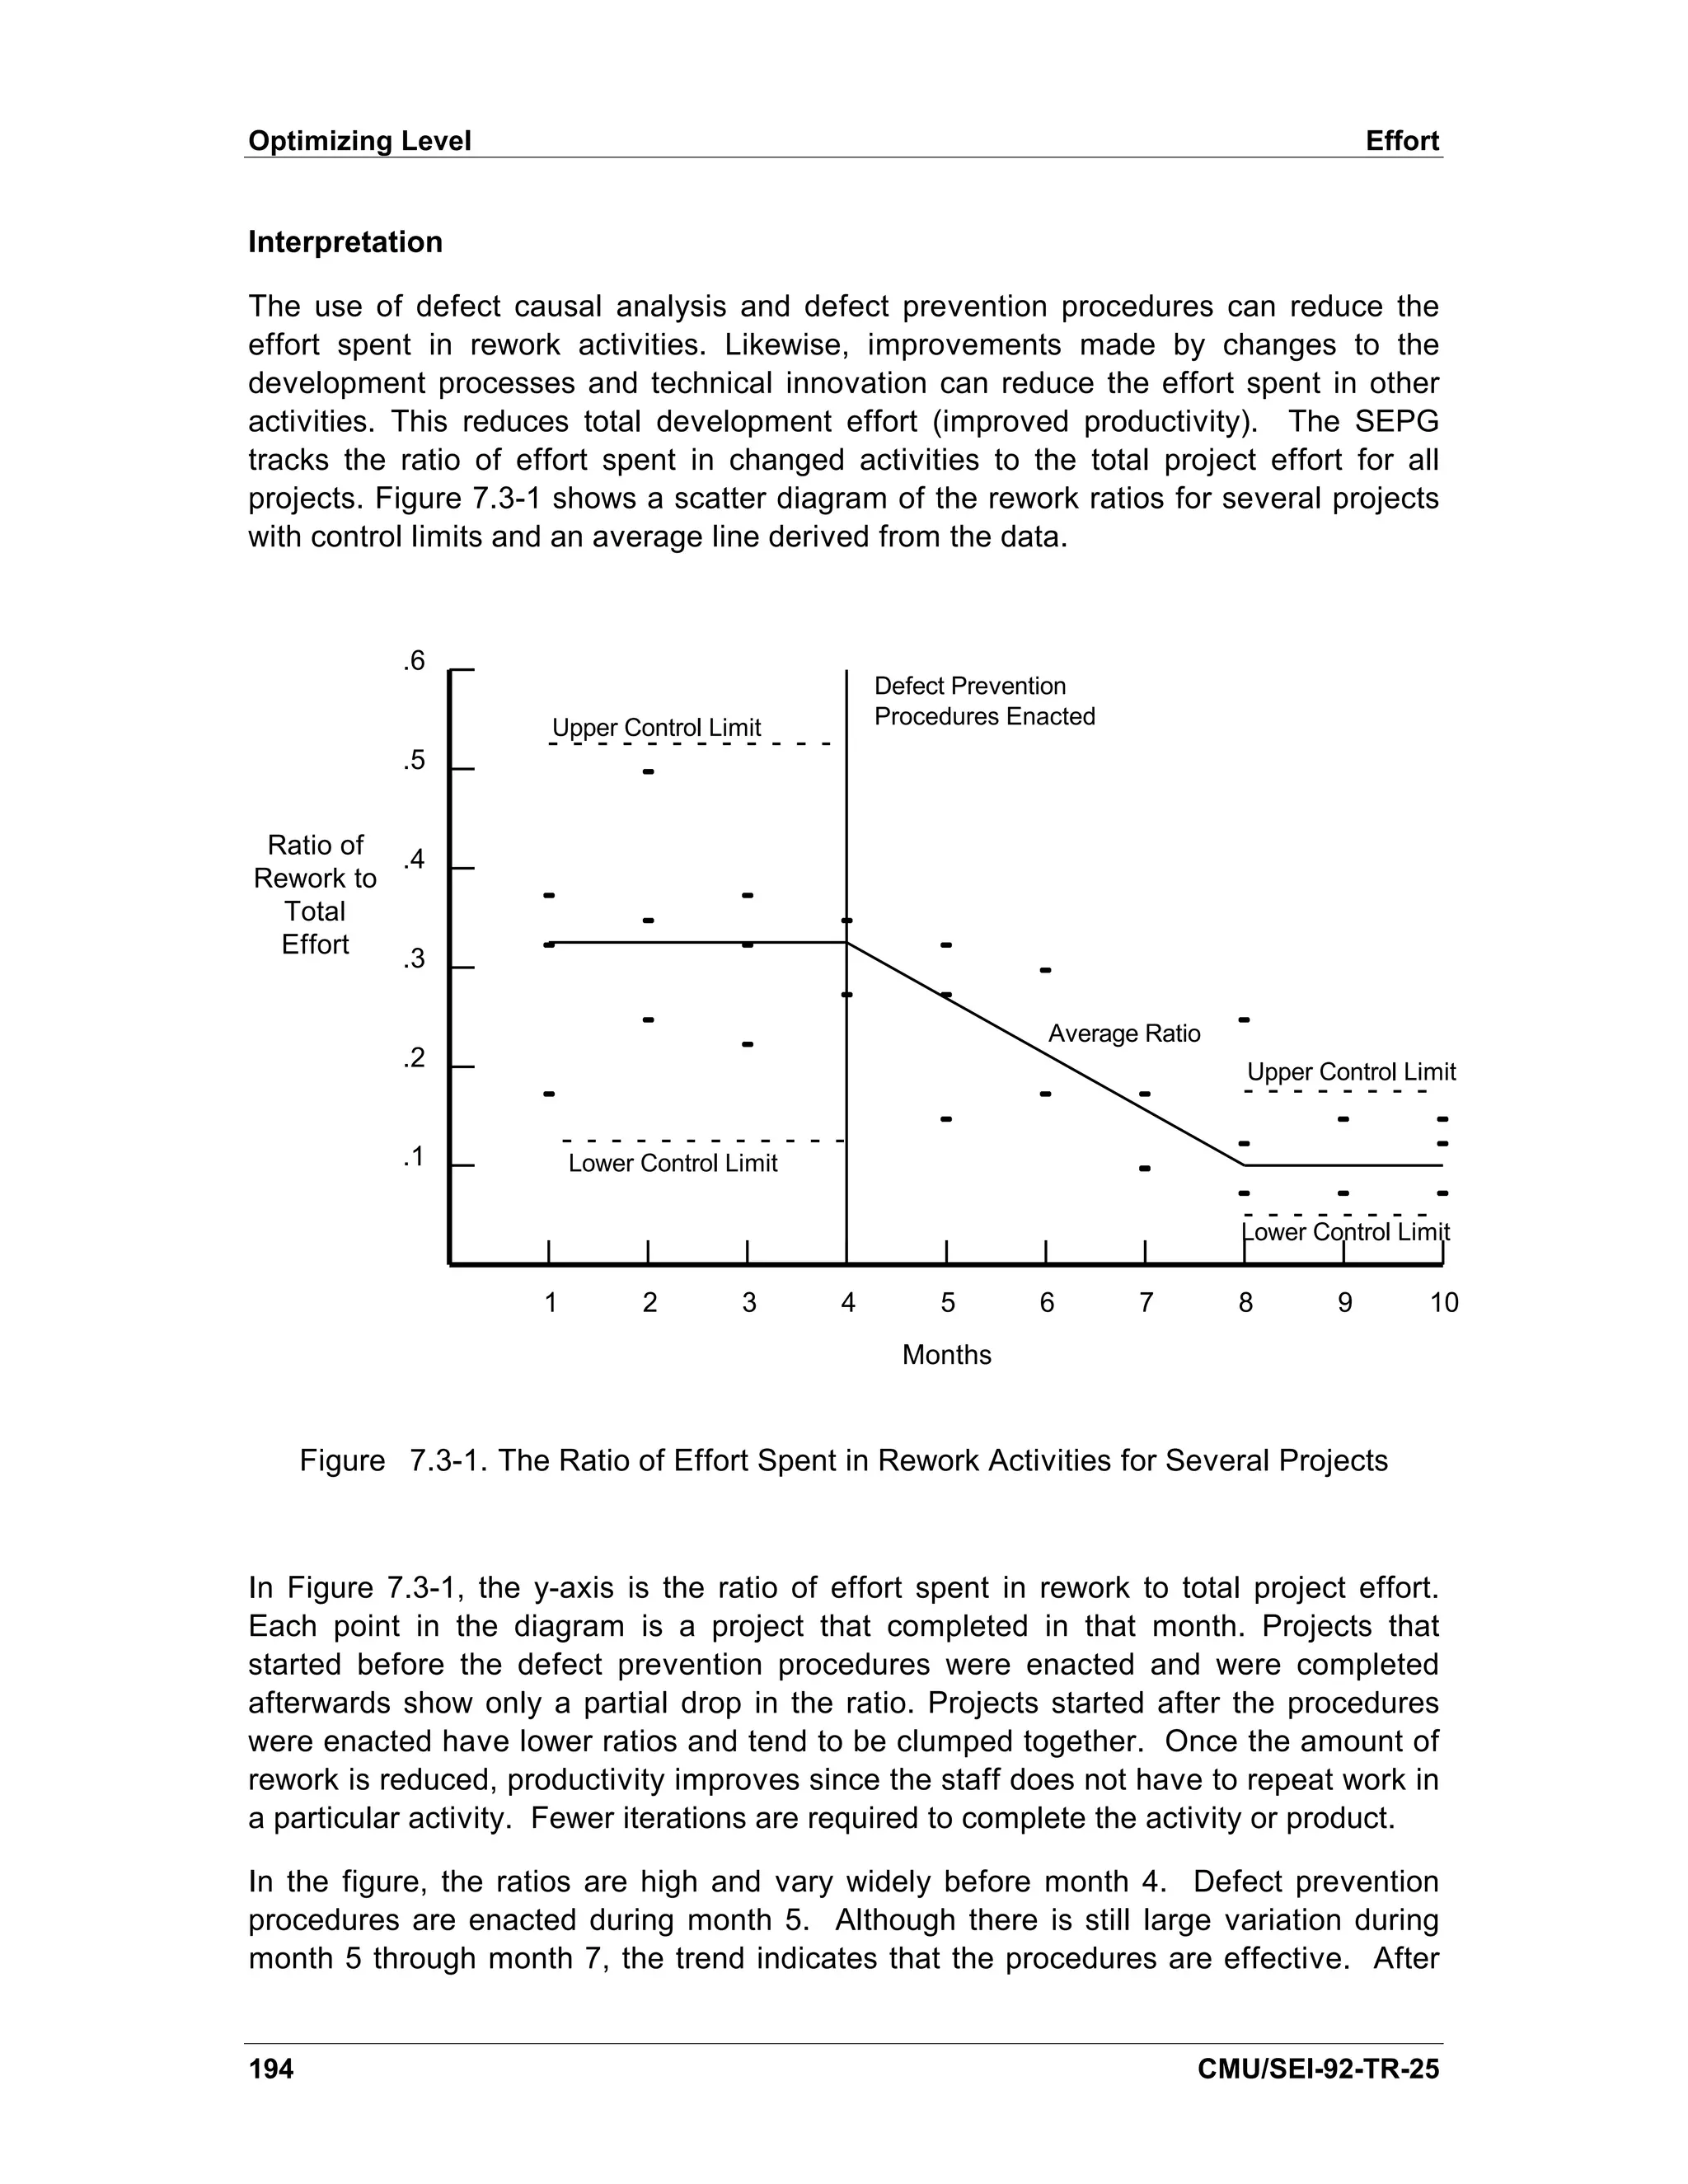
![Effort Optimizing Level
month 8, the ratios have dropped to a steady state and new control limits are
established.
This figure can also be used to track the ratios of the effort spent in peer reviews,
coding, testing, and other activities to the total development effort. In turn, this allows
an organization to determine its performance with respect to preventive and reactive
efforts; that is, the organization can compare the effort expended in design as opposed
to coding or the effort expended in peer reviews to testing. The emphasis should be on
the preventive activities.
Sources
From the Repeatable Level:
[AFSC 86] discusses planned and actual staffing total profiles and staffing losses in its
software development personnel indicator.
[Decker 91], [Landis 90], and [Pfleeger 89] discuss the use of planned and actual
staffing profiles.
[Grady 87] reports that staff issues are part of the Hewlett-Packard software metrics
program.
[IEEE 1045] discusses the experience level, size, and turnover rates of the project staff.
[Rozum 92] discusses planned and actual staffing total profiles, experience profiles,
and also planned and actual staffing losses in their effort and staffing metrics.
[Schultz 88] discusses planned and actual staffing total profiles, experience profiles,
and also planned and actual staffing losses in his software personnel metric.
For the Optimizing Level:
[Pyzdek 89] discusses SPC techniques.
CMU/SEI-92-TR-25 195](https://image.slidesharecdn.com/softwaremeasuresandthecapabilitymaturitymodel-1992johnh-baumertsei-110103031855-phpapp02/75/Software-measures-and-the-capability-maturity-model-1992-john-h-baumert-sei-213-2048.jpg)

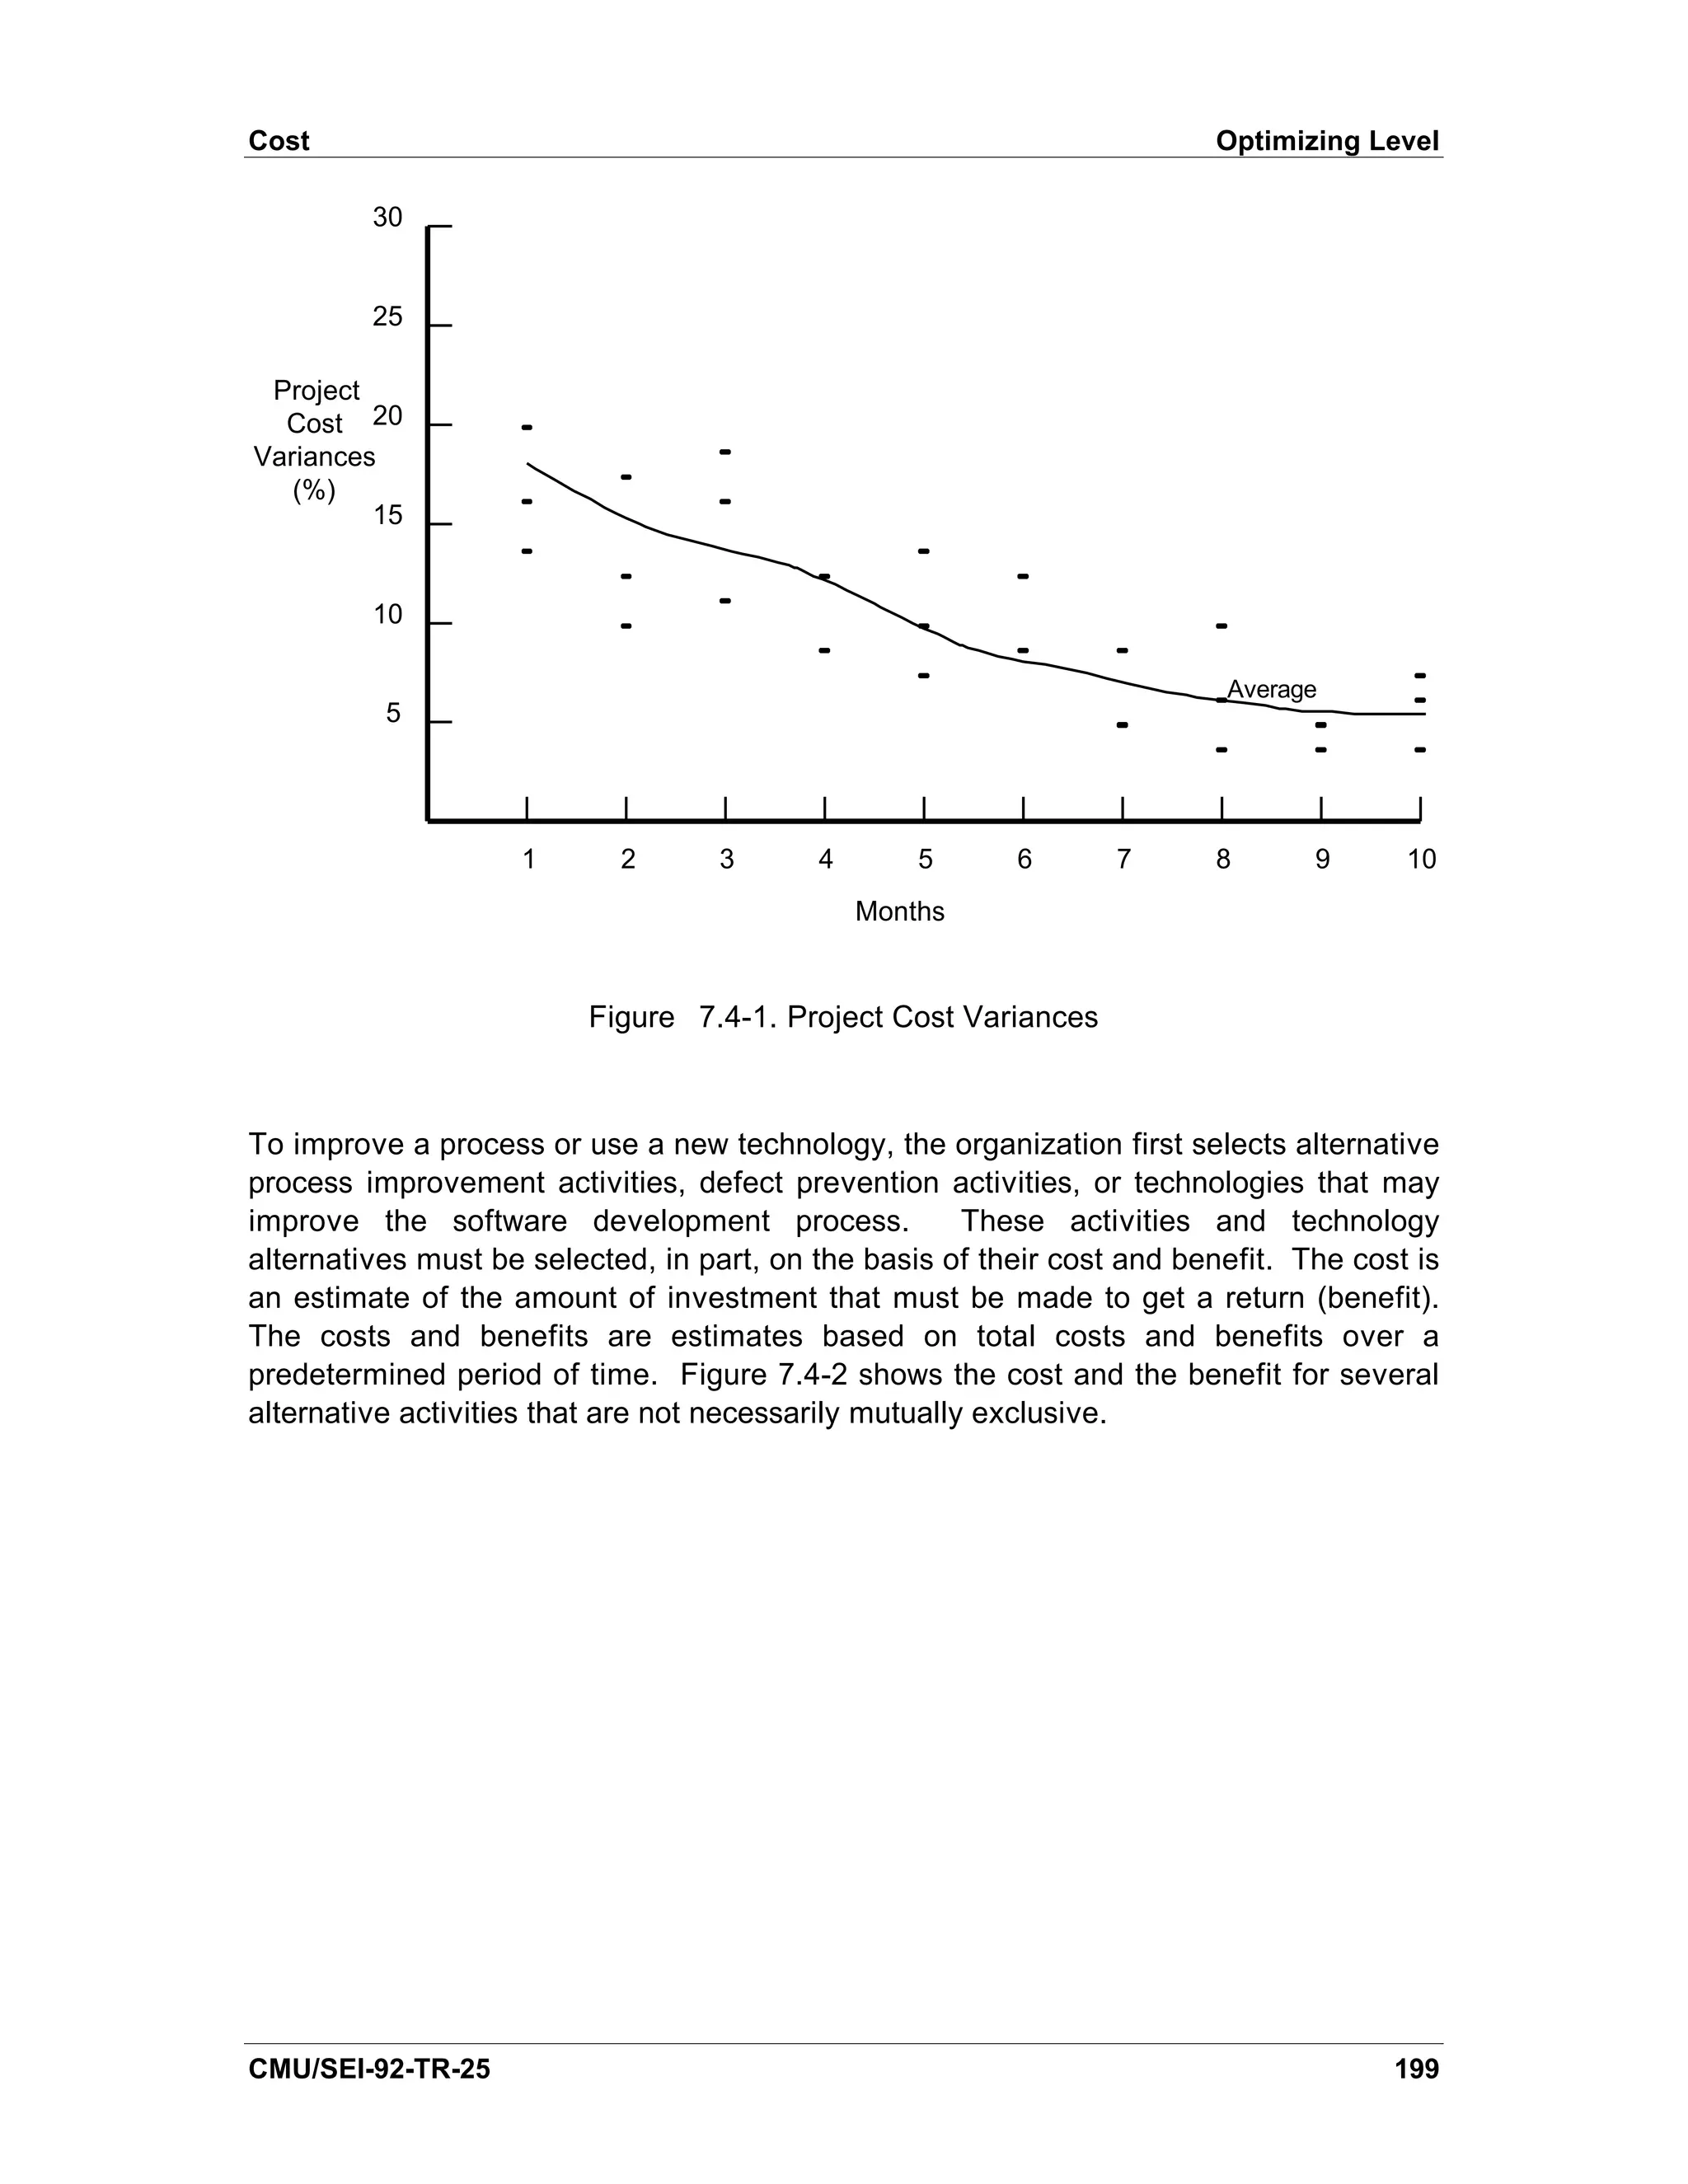
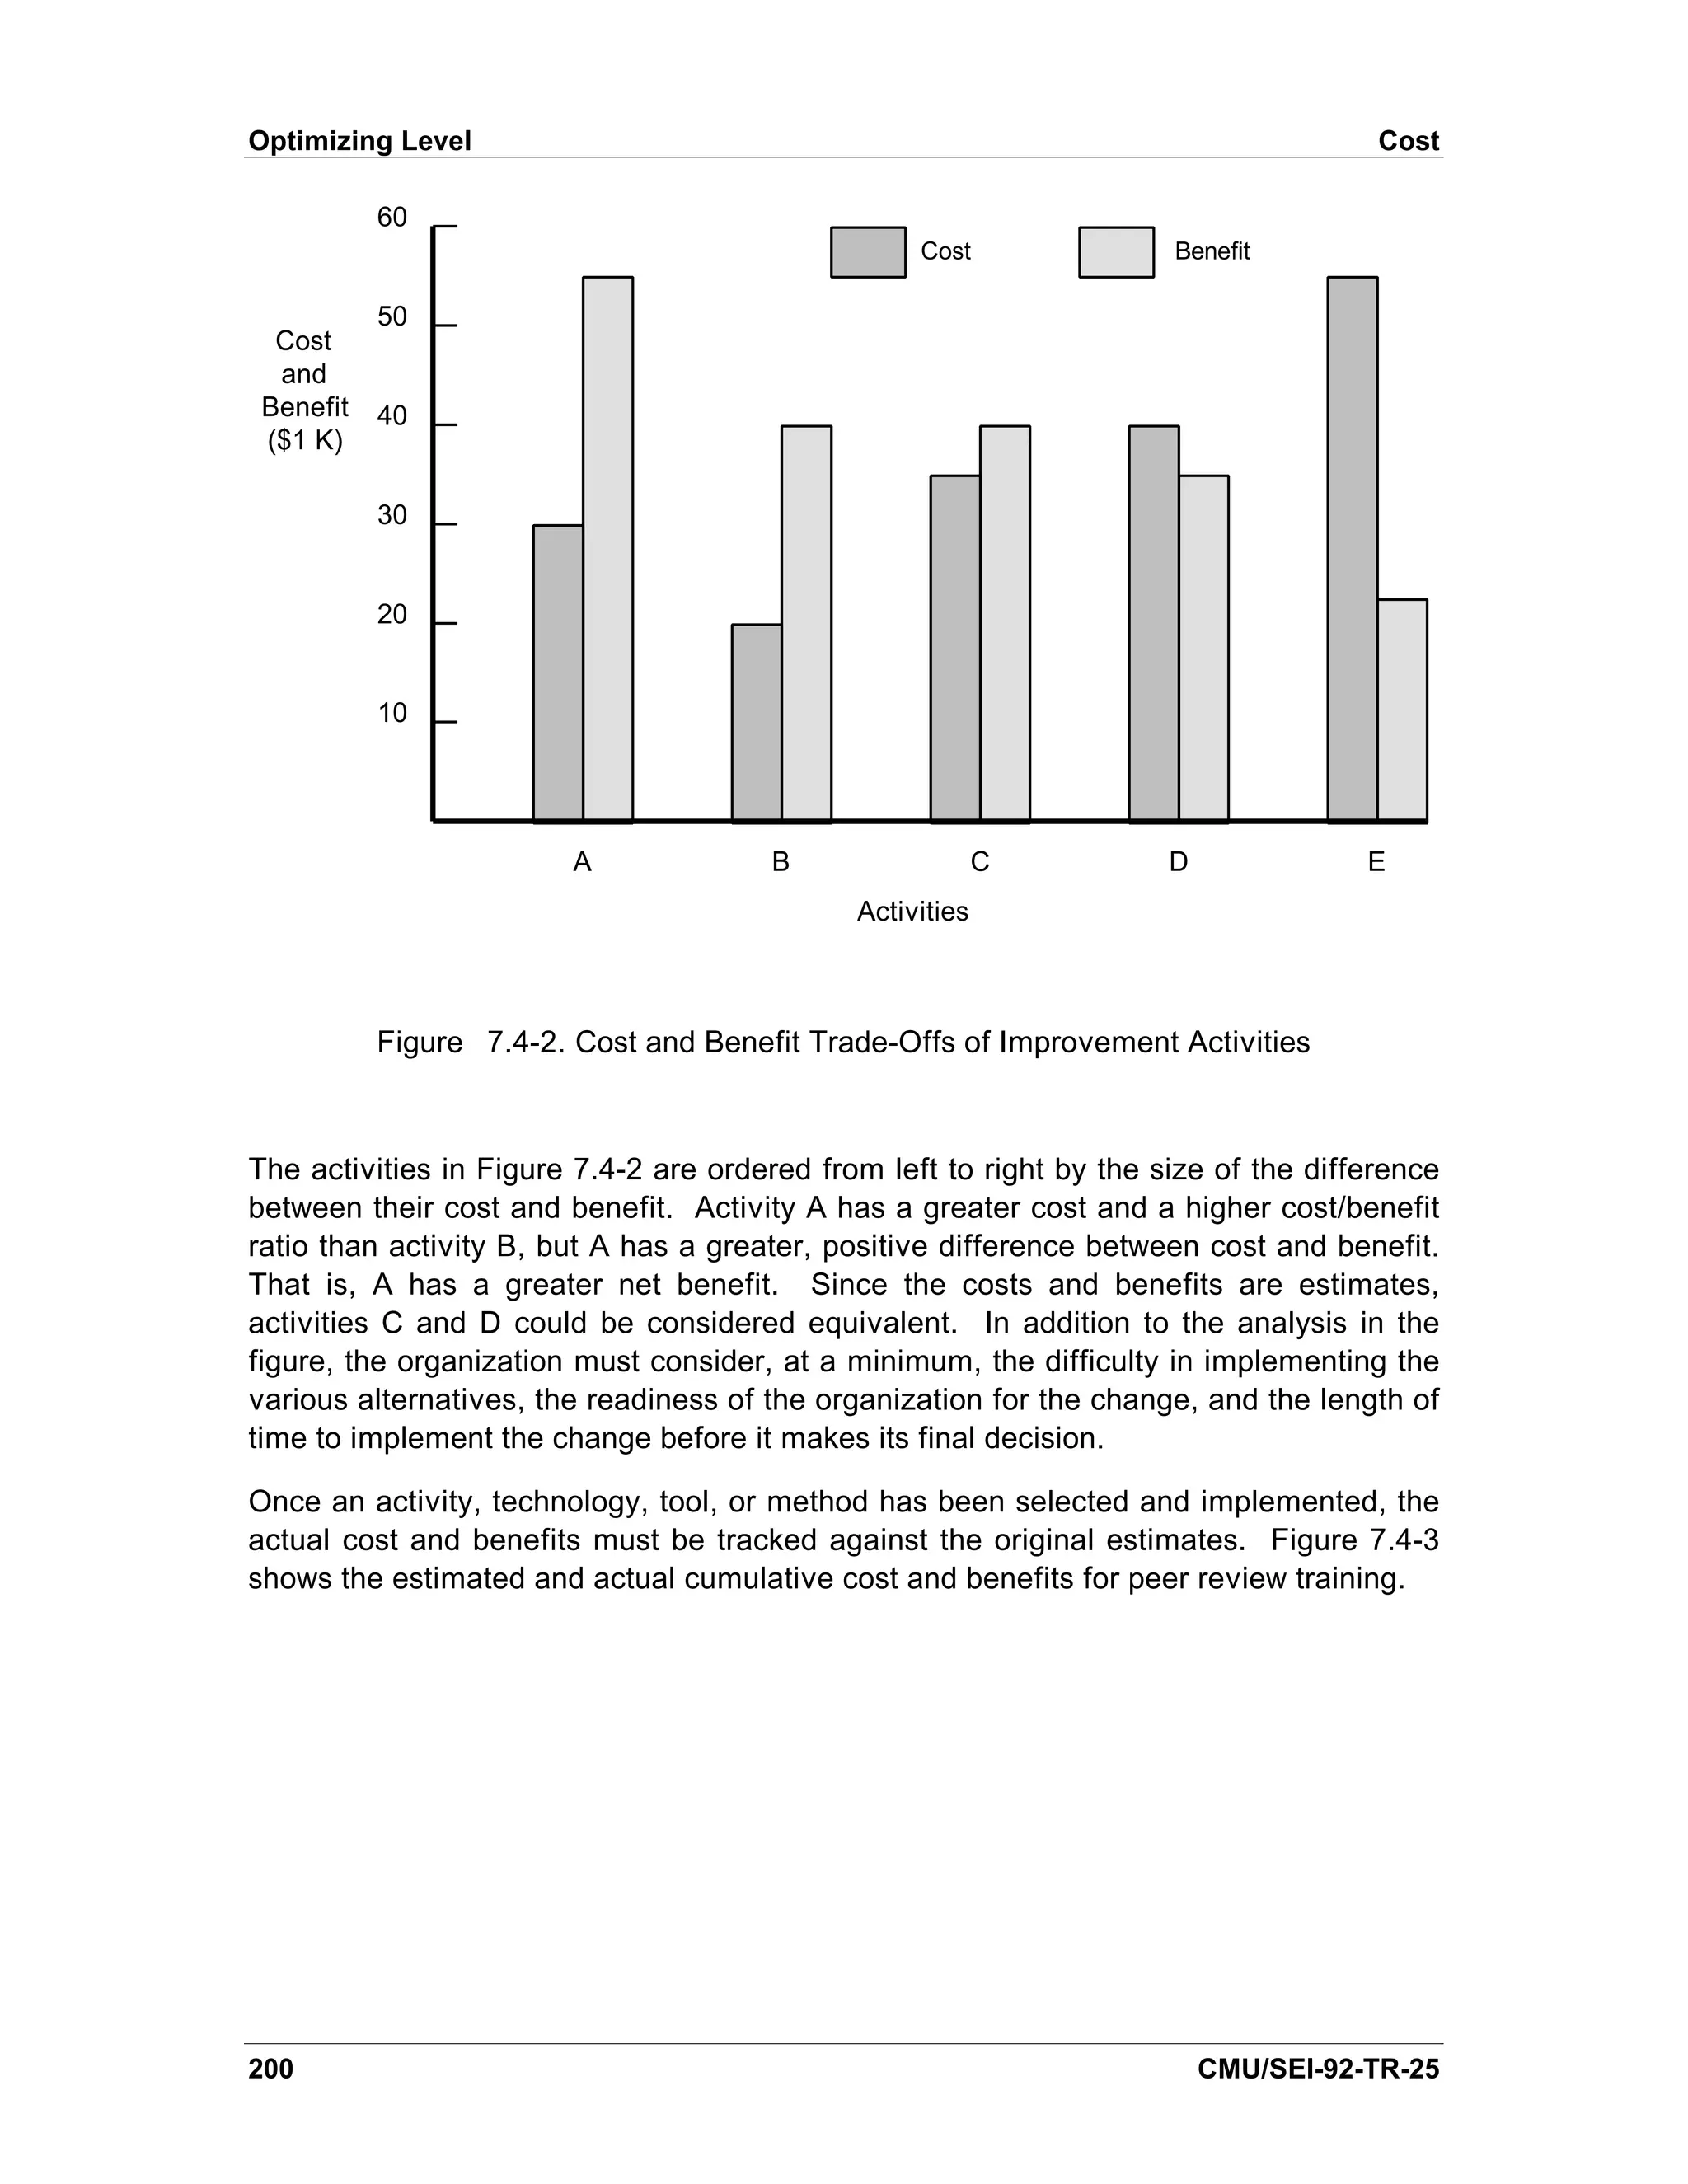
![Cost Optimizing Level
60 Estimated Benefit
Benefit
50
Cost
Cost 40 Estimated Cost
and
Benefit
($1 K) 30
20
10
1 2 3 4 5 6 7 8 9 10
Months
Figure 7.4-3. Cost and Benefits of Peer Review Training
The estimated cost and benefit lines in Figure 7.4-3 represent the total cost and benefit
over time. In this example, the cost of the training has already exceeded the original
estimate but is no longer growing. The benefit due to early, lower-cost defect removal
has not yet reached the original estimate but is approaching it.
Sources
From the Repeatable Level:
[AFSC 86] and [DoD 80] discuss the basics of ACWP, BCWP, and BCWS.
[DSDM 89] discusses the basics of cost and schedule variance.
CMU/SEI-92-TR-25 201](https://image.slidesharecdn.com/softwaremeasuresandthecapabilitymaturitymodel-1992johnh-baumertsei-110103031855-phpapp02/75/Software-measures-and-the-capability-maturity-model-1992-john-h-baumert-sei-219-2048.jpg)

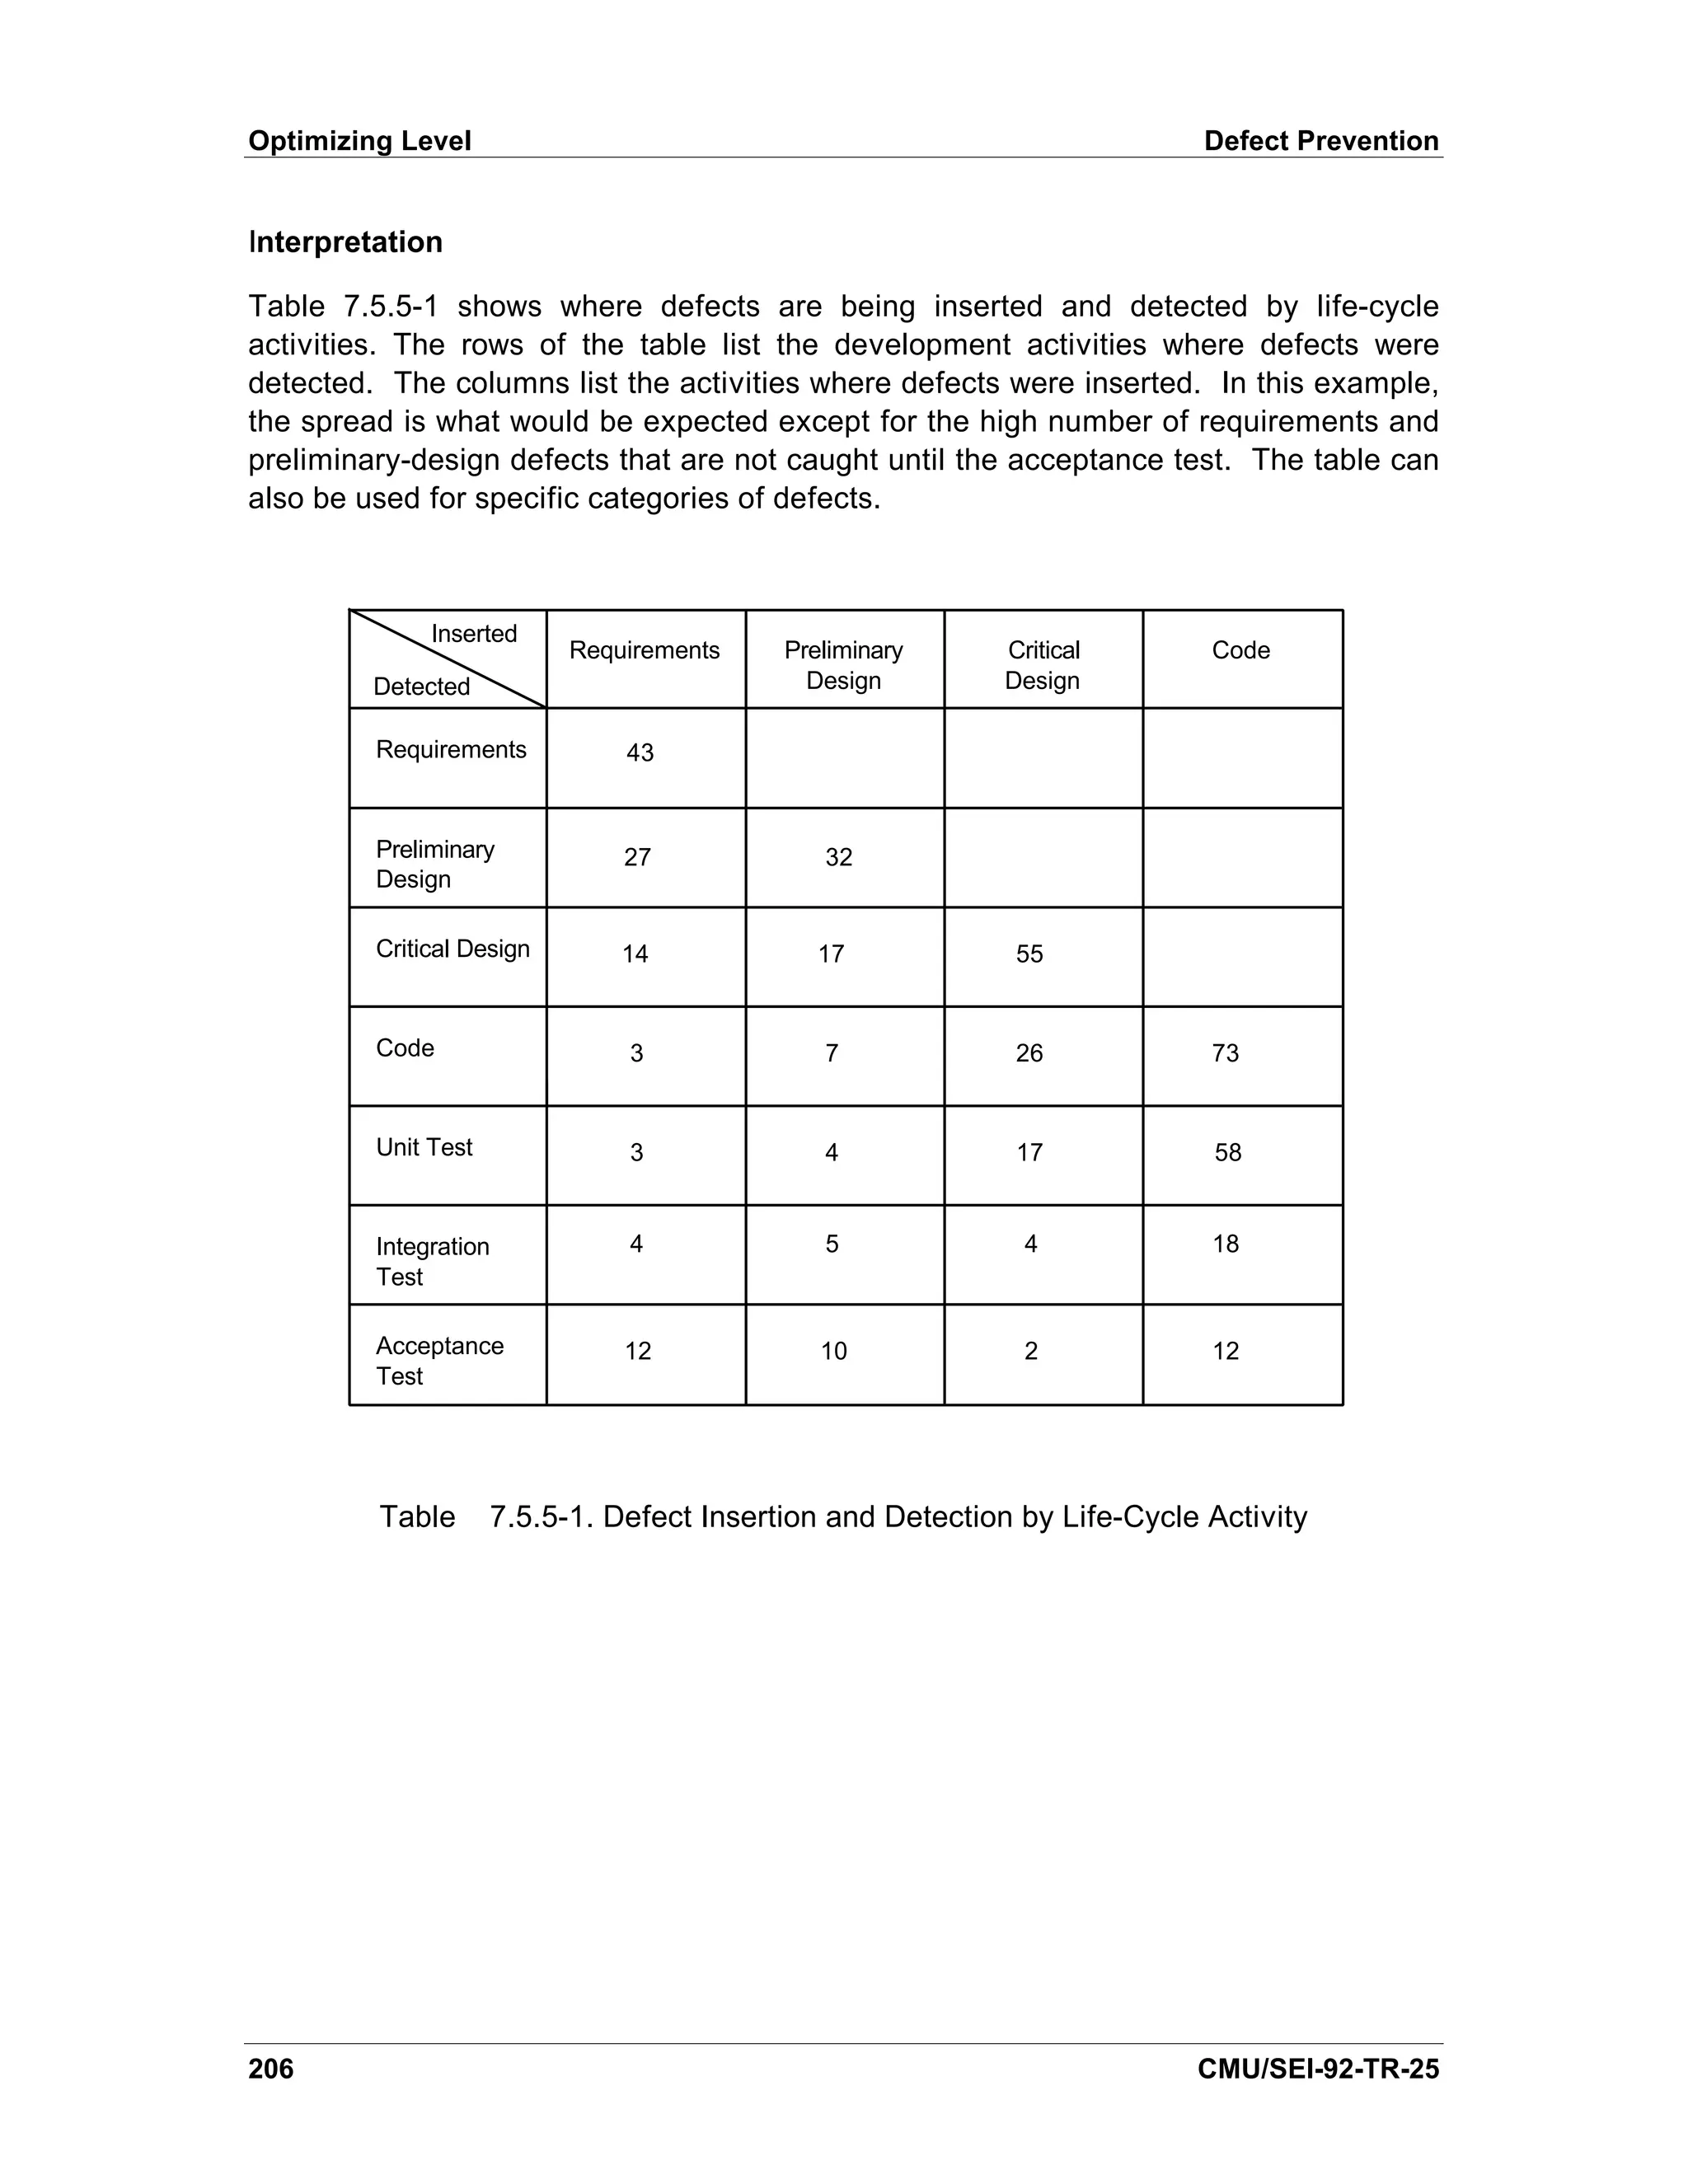
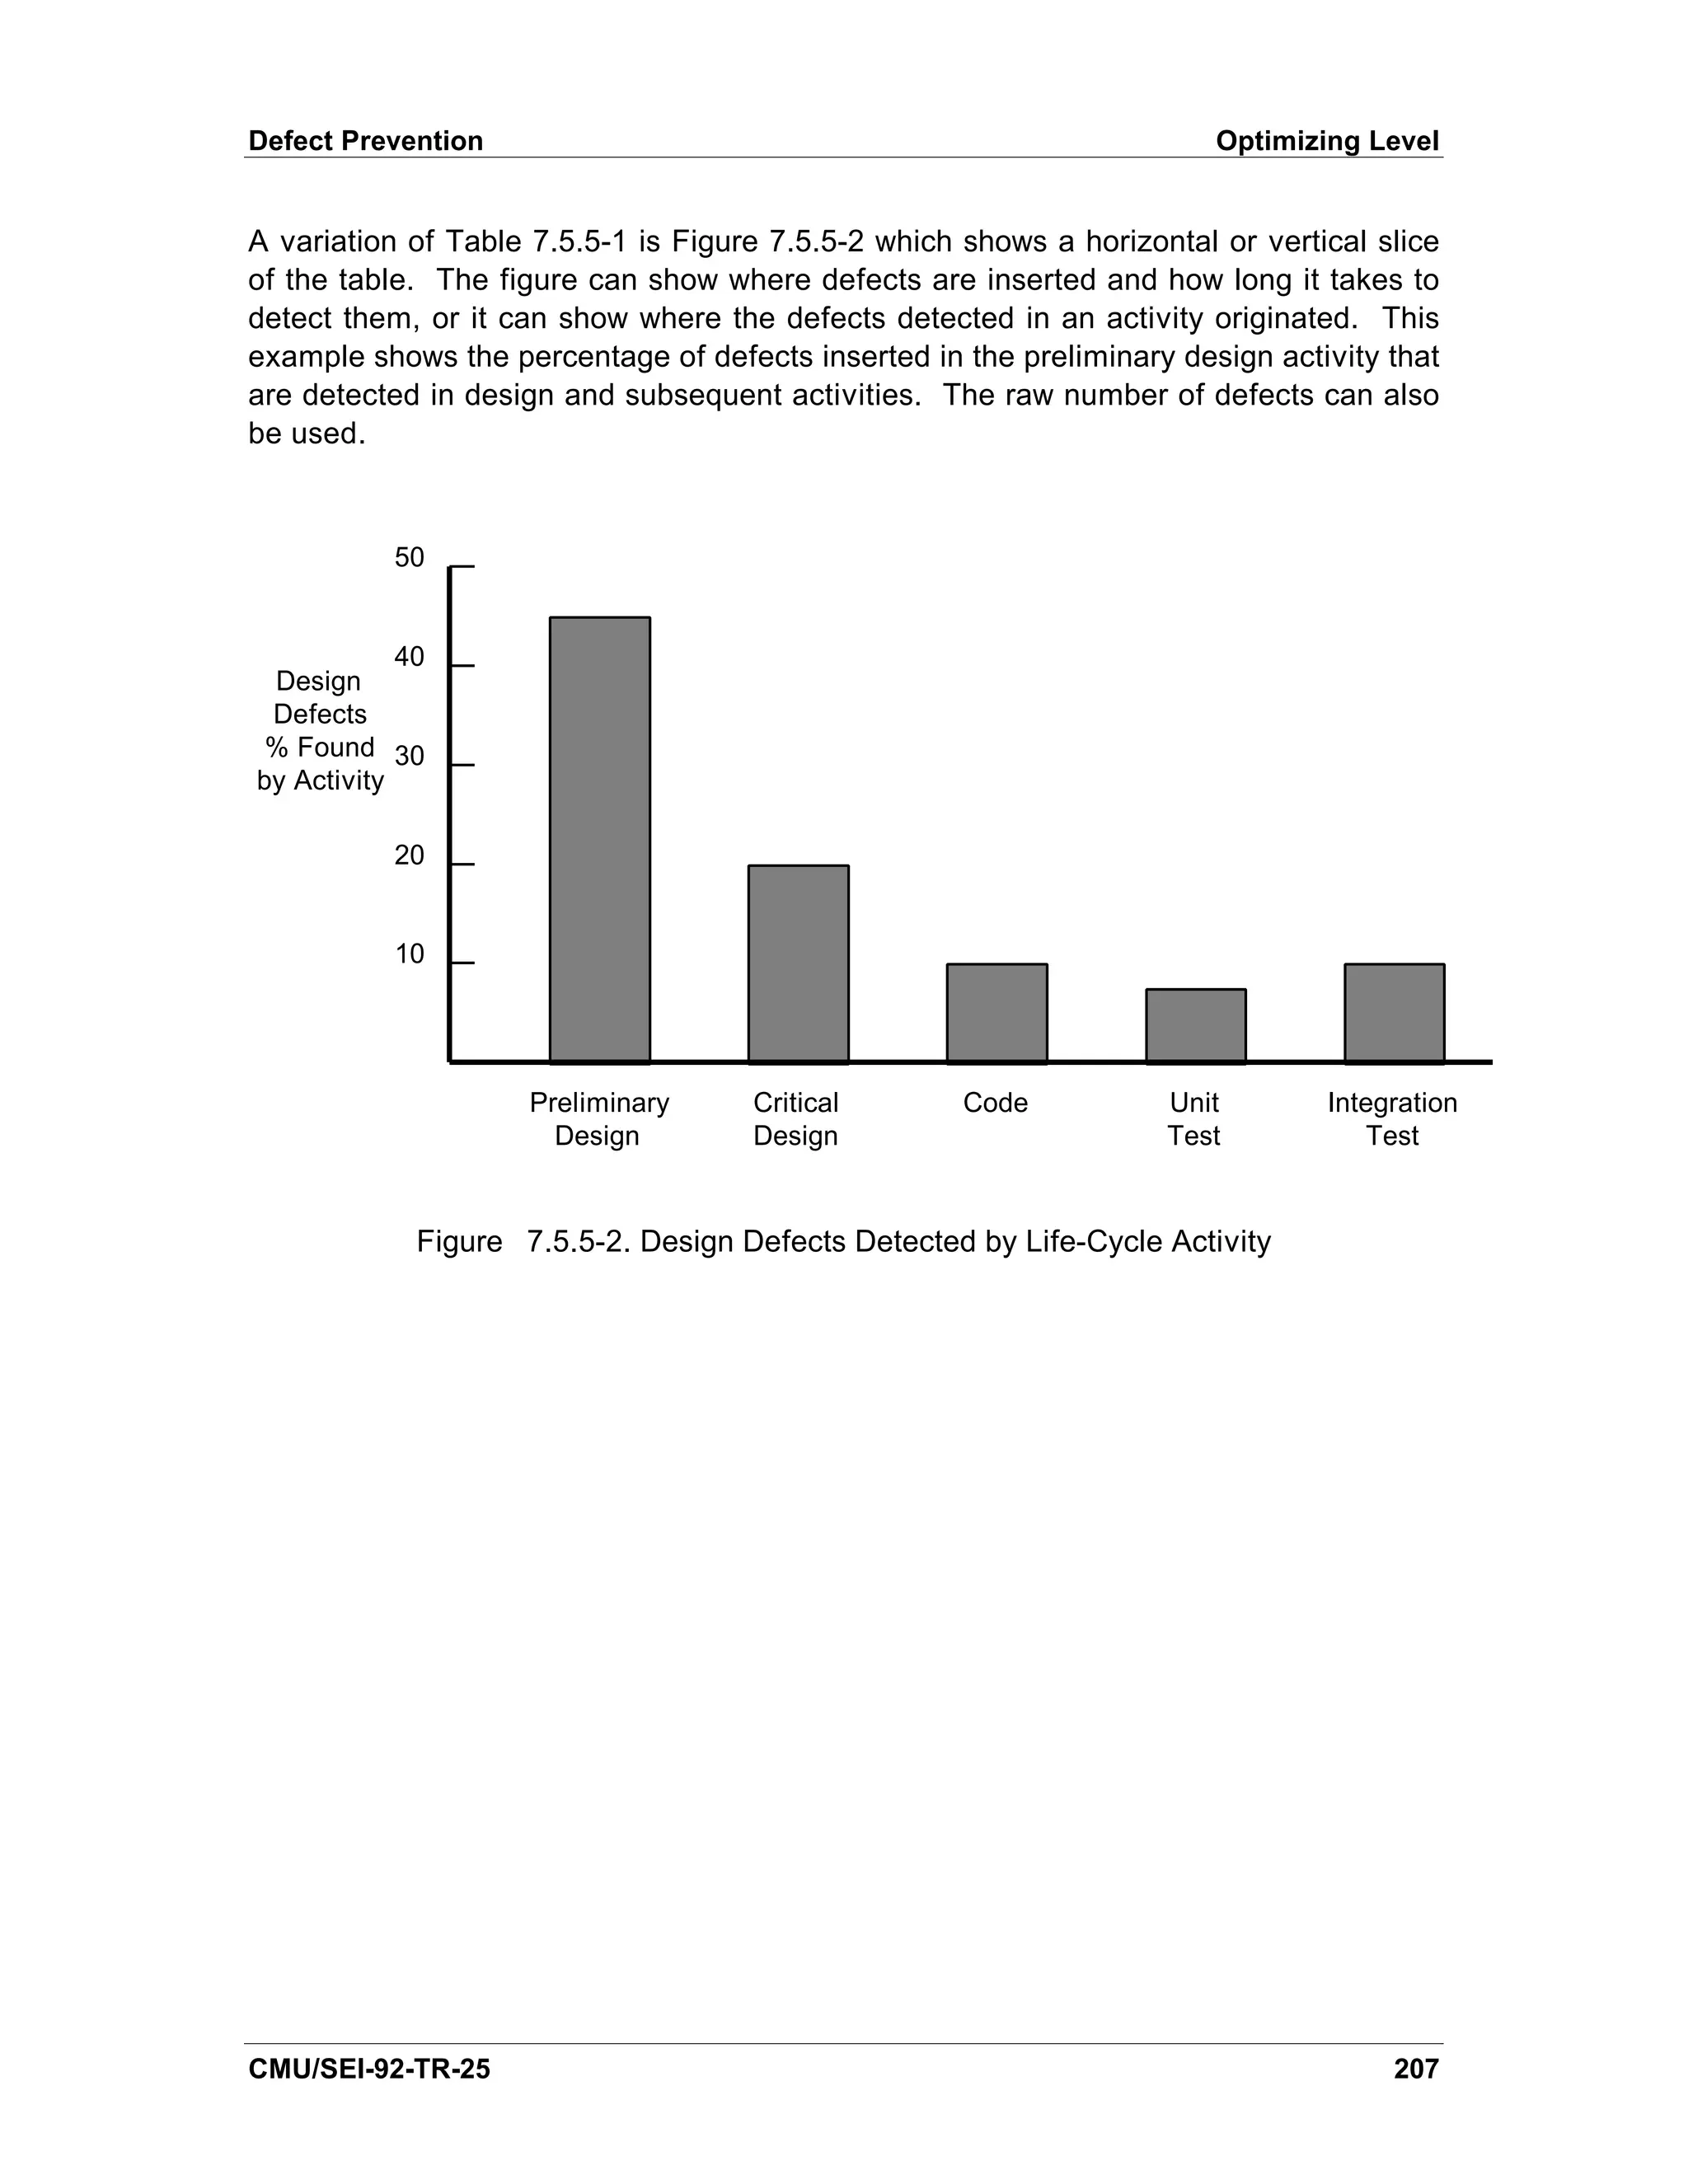
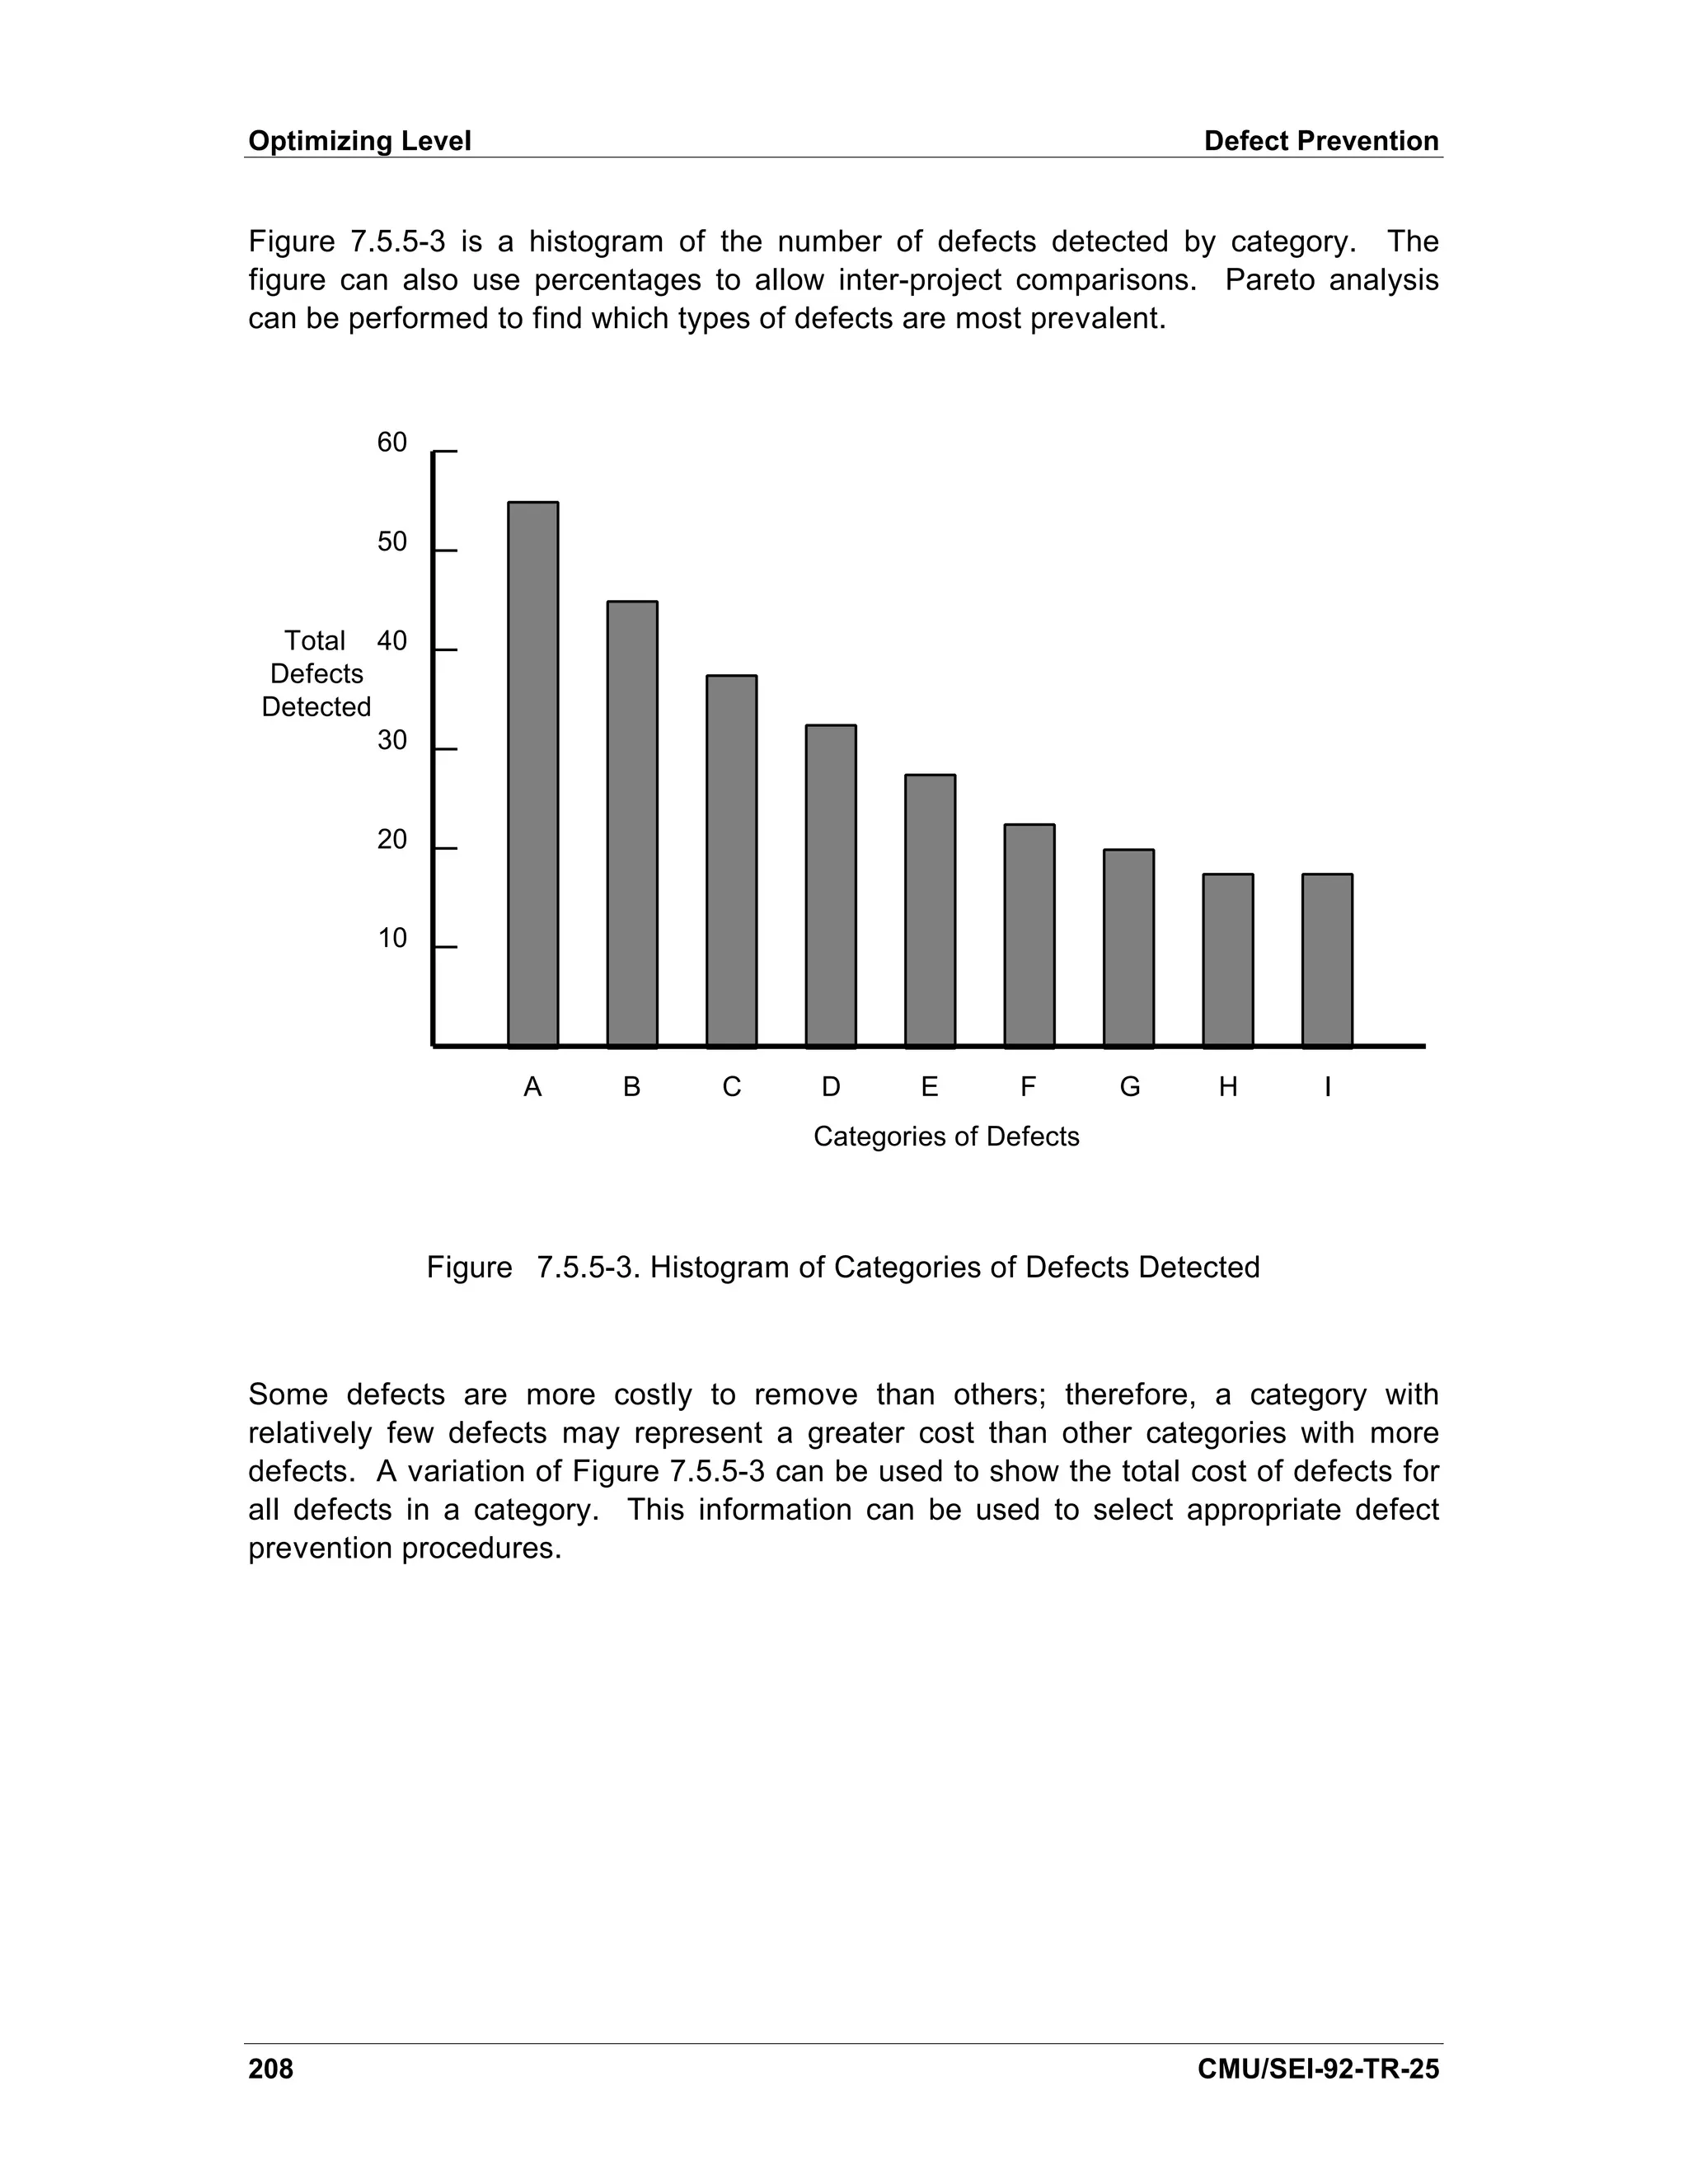
![Defect Prevention Optimizing Level
Figure 7.5.5-4 addresses the defect prevention process. It shows what happens to a
particular defect category when defect prevention procedures are enacted. The x-axis
is time or stages. The y-axis is the raw number of defects inserted or the number of
defects inserted normalized by size. In this example, prior to month 4, there is a high
insertion rate which varies widely from month to month for type A defects. After the
defect prevention procedures were enacted, the insertion rate dropped. By month 7
the rate stabilized and new, narrower control limits were placed on the rate.
60
50 Upper Control Limit
Defect Prevention
Defect Procedures Enacted
Insertion
Rate for 40
Category
A Defects
30 Lower Control Limit
Upper Control Limit
20
Lower Control Limit
10
1 2 3 4 5 6 7 8 9 10
Months
Figure 7.5.5-4. Defect Insertion Rate for Category A Defects
Sources
[Mays 90] discusses defect prevention.
CMU/SEI-92-TR-25 209](https://image.slidesharecdn.com/softwaremeasuresandthecapabilitymaturitymodel-1992johnh-baumertsei-110103031855-phpapp02/75/Software-measures-and-the-capability-maturity-model-1992-john-h-baumert-sei-227-2048.jpg)

![References
[AFSC 86] Department of the Air Force. Air Force Systems Command
Software Management Indicators (AFSC Pamphlet 800-43).
Washington, DC: Andrews Air Force Base, 1986.
[AFSC 87] Department of the Air Force. Air Force Systems Command
Software Quality Indicators (AFSC Pamphlet 800-14).
Washington, DC: Andrews Air Force Base, 1987.
[Basili 84] Basili, Victor R.; & Weiss, David M. “ Methodology for
A
Collecting Valid Software Engineering Data.”IEEE
Transactions on Software Engineering SE-10, 6 (November
1984): 728-738.
[Brooks 82] Brooks, F. P. Jr. The Mythical Man-Month: Essays on
Software Engineering. Reading, MA: Addison-Wesley
Publishing Co., 1982.
[Buckley 89] Buckley, Fletcher J. “Standard Set of Useful Software Metrics
is Urgently Needed.”IEEE Computer 22, 7 (July 1989): 88-89.
[Buckley 90] Buckley, Fletcher J. “Establishing a Standard Metrics
Program.”IEEE Computer 23, 6 (June 1990): 85-86.
[Card 88] Card, David N. “Software Product Assurance: Measurement
and Control.”Information and Software Technology 30, 6
(July/August 1988): 322-330.
[Card 90] Card, David N.; & Glass, Robert L. Measuring Software
Design Quality. Englewood Cliffs, N.J.: Prentice-Hall, Inc.,
1990.
[Card 91] Card, David N. “What Makes a Software Measure
Successful?”American Programmer 4, 9 (September 1991):
2-8.
[Decker 91] Decker, William J.; Baumert, John H.; Card, David N.;
Wheeler, J. Ladd; & Wood, Richard J. SEAS Software
Measurement System Handbook (CSC/TR-89/6166).
Beltsville, MD: Computer Sciences Corporation, 1991.
[DeMarco 82] DeMarco, Tom. Controlling Software Projects: Management,
Measurement, and Estimation. New York, NY: Yourdon Press,
1982.
[Deming 82] Deming, W. E. Quality, Productivity, and Competitive Position.
Cambridge, MA: MIT Press, 1982.
CMU/SEI-92-TR-25 213](https://image.slidesharecdn.com/softwaremeasuresandthecapabilitymaturitymodel-1992johnh-baumertsei-110103031855-phpapp02/75/Software-measures-and-the-capability-maturity-model-1992-john-h-baumert-sei-231-2048.jpg)
![References
[DoD 80] Departments of the Air Force, the Army, the Navy, and the
Defense Logistic Agency. Cost/Schedule Control Systems
Criteria Joint Implementation Guide (AFSC 173-5, AFLCP
173-5, DARCOM-P 715-5, NAVMAT P5240, DLAH 8315.2).
October 1, 1980.
[DSDM 89] Computer Sciences Corporation. Digital System Development
Methodology, Version 3. Falls Church, VA: December 1989.
[Dunn 90] Dunn, Robert H. Software Quality: Concepts and Plans.
Englewood Cliffs, N.J.: Prentice-Hall, Inc., 1990.
[Florac 92] Florac, William A.; The Quality Subgroup of the Software
Metrics Definition Working Group; & the Software Process
Measurement Project Team. Software Quality Measurement:
A Framework for Counting Problems and Defects (CMU/SEI-
92-TR-22, ESC-TR-22). Pittsburgh, PA: Software Engineering
Institute, Carnegie Mellon University, September 1992.
[Gilb 77] Gilb, Tom. Software Metrics. Cambridge, MA: Winthrop
Publishers, Inc., 1977.
[Goethert 92] Goethert, Wolfhart B.; Bailey, Elizabeth K.; Busby, Mary B.;
The Effort and Schedule Subgroup of the Software Metrics
Definition Working Group; & the Software Process
Measurement Project Team. Software Effort and Schedule
Measurement: A Framework for Counting Staff-Hours and
Reporting Schedule Information (CMU/SEI-92-TR-21, ESC-
TR-21). Pittsburgh, PA: Software Engineering Institute,
Carnegie Mellon University, September 1992.
[Grady 87] Grady, Robert B.; & Caswell, Deborah L. Software Metrics:
Establishing a Company-Wide Program. Englewood Cliffs,
N.J.: Prentice-Hall, Inc., 1987.
[Humphrey 89] Humphrey, Watts S. Managing the Software Process.
Reading, MA: Addison-Wesley, 1989.
[IEEE 610] Institute of Electrical and Electronics Engineers. IEEE
Standard Glossary of Software Engineering Terminology
(ANSI/IEEE std 610.12-1990). New York, NY: December 10,
1990.
[IEEE 1044] Institute of Electrical and Electronics Engineers. A Standard
Classification for Software Errors, Faults, and Failures (Draft)
(IEEE P1044/D3). New York, NY: 1987.
[IEEE 1045] Institute of Electrical and Electronics Engineers. Standard for
Software Productivity Metrics (Draft) (IEEE P1045/D4.0).
New York, NY: December 1990.
214 CMU/SEI-92-TR-25](https://image.slidesharecdn.com/softwaremeasuresandthecapabilitymaturitymodel-1992johnh-baumertsei-110103031855-phpapp02/75/Software-measures-and-the-capability-maturity-model-1992-john-h-baumert-sei-232-2048.jpg)
![References
[IEEE 1061] Institute of Electrical and Electronics Engineers. Standard for
Software Quality Metrics Methodology (Draft) (IEEE
P1061/D21). New York, NY: 1990.
[Jones 91] Jones, Capers. Applied Software Measurement. New York,
NY: McGraw-Hill, Inc., 1991.
[Kuntzmann 92] Kuntzmann-Combelles, Annie; Comer, Peter; Holdsworth,
Jacqueline; & Shirlaw, Stephen. Metrics Users’Handbook.
Cambridge, England: Application of Metrics in Industry (AMI),
1992.
[Landis 90] Landis, Linda; McGarry, Frank; Waligora, Sharon; Pajerski,
Rose; Stark, Mike; Kester, Rush; McDermott, Tim; & Miller,
John. Manager’ Handbook for Software Development,
s
Revision 1 (SEL-84-101). Greenbelt, MD: NASA Goddard
Space Flight Center, 1990.
[Lockyer 84] Lockyer, Keith. Critical Path Analysis and Other Project
Network Techniques, 4th ed. London, England: Pitman
Publishing, 1984.
[London 89] London, Manuel. Managing the Training Enterprise: High-
Quality, Cost-Effective Employee Training in Organizations.
San Francisco, CA: Jossey-Bass, 1989.
[Mays 90] Mays, R.G.; Holloway, G.J. & Studinski, D.P. “Experiences
with Defect Prevention.”IBM Systems Journal 29, 1 (1990): 4-
32.
[Murine 88] Murine, Gerald E. “Integrating Software Quality Metrics with
Software QA.”Quality Progress 21, 11 (November 1988): 38-
43.
[Park 92] Park, Robert E.; The Size Subgroup of the Software Metrics
Definition Working Group; & the Software Process
Measurement Project Team. Software Size Measurement: A
Framework for Counting Source Statements (CMU/SEI-92-
TR-20, ESC-TR-20). Pittsburgh, PA: Software Engineering
Institute, Carnegie Mellon University, September 1992.
[Paulk 91] Paulk, Mark C.; Curtis, Bill; Chrissis, Mary Beth; Averill,
Edward L.; Bamberger, Judy; Kasse, Timothy C.; Konrad,
Mike; Perdue, Jeffrey R.; Weber, Charles V.; & Withey James
V. Capability Maturity Model for Software (CMU/SEI-91-TR-
24, ADA240603). Pittsburgh, PA: Software Engineering
Institute, Carnegie Mellon University, 1991.
CMU/SEI-92-TR-25 215](https://image.slidesharecdn.com/softwaremeasuresandthecapabilitymaturitymodel-1992johnh-baumertsei-110103031855-phpapp02/75/Software-measures-and-the-capability-maturity-model-1992-john-h-baumert-sei-233-2048.jpg)
![References
[Pfleeger 89] Pfleeger, Shari Lawrence. Recommendations for an Initial Set
of Software Metrics (CTC-TR-89-017). Chantilly, VA: Contel,
1989.
[Pyzdek 84] Pyzdek, Thomas. An SPC Primer. Tucson, AZ: Quality
America, Inc., 1984.
[Pyzdek 89] Pyzdek, Thomas. Pyzdek’ Guide to SPC. Vol. 1,
s
Fundamentals. Tucson, AZ: Quality America, Inc., 1989.
[Rifkin 91] Rifkin, Stan; & Cox, Charles. Measurement in Practice
(CMU/SEI-91-TR-16, ADA 241781). Pittsburgh, PA: Software
Engineering Institute, Carnegie Mellon University, 1991.
[Rozum 92] Rozum, James A.; & Software Acquisition Metrics Working
Group. Software Measurement Concepts for Acquisition
Program Managers (CMU/SEI-92-TR-11, ESC-TR-11).
Pittsburgh, PA: Software Engineering Institute, Carnegie
Mellon University, September 1992.
[Schulmeyer 87] Schulmeyer, G. Gordon; & McManus, James I. Handbook of
Software Quality Assurance. New York, NY: Van Nostrand
Reinhold Company, Inc., 1987.
[Schultz 88] Schultz, Herman P. Software Management Metrics (ESD-TR-
88-001). Bedford, MA: MITRE Corporation, 1988.
[STEP 91] Betz, Henry P.; & O’ Neill, Patrick J. Army Software Test and
Evaluation Panel (STEP) Software Metrics Initiatives Report
(Draft). March 1991.
[Vincent 88] Vincent, James; Waters, Albert; & Sinclair, John. Software
Quality Assurance. Vol. 1, Practice and Implementation.
Englewood Cliffs, NJ: Prentice-Hall, Inc., 1988.
[Weber 91] Weber, Charles V.; Paulk, Mark C.; Wise, Cynthia J.; &
Withey, James V. Key Practices of the Capability Maturity
Model (CMU/SEI-TR-25, ADA240604). Pittsburgh, PA:
Software Engineering Institute, Carnegie Mellon University,
1991.
216 CMU/SEI-92-TR-25](https://image.slidesharecdn.com/softwaremeasuresandthecapabilitymaturitymodel-1992johnh-baumertsei-110103031855-phpapp02/75/Software-measures-and-the-capability-maturity-model-1992-john-h-baumert-sei-234-2048.jpg)
![Appendix B: Definitions
action item - Any review discrepancy, clarification, or issue that must be resolved by
the project or the customer. In the context of this document, an action item arises out
of formal reviews with the customer and from peer reviews. The review result indicator
only tracks action items from the formal reviews.
actual cost of work performed - The costs actually incurred and recorded in
accomplishing the work performed within a given time period [DoD 80].
budgeted cost at completion - The sum of the budgeted cost for all work to be
performed on the project.
budgeted cost for work performed - The sum of the budgets for completed work
packages and completed portions of open work packages, plus the appropriate portion
of the budgets for level of effort and apportioned effort [DoD 80].
budgeted cost for work scheduled - The sum of the budgets for all work packages,
planning packages, etc., scheduled to be accomplished (including in-process work
packages), plus the amount of effort and apportioned effort scheduled to be
accomplished within a given time period [DoD 80].
class - The number of times a particular course is offered. For example, there may be
six classes of the requirements analysis course in one month.
cost account - A management control point at which actual costs can be accumulated
and compared to budgeted cost for work performed. A cost account is a natural control
point for cost/schedule planning and control since it represents the work assigned to
one responsible organizational element on one contract work breakdown structure
element [DoD 80].
cost performance index - The ratio of the budgeted cost for work performed and the
actual cost of the work performed, expressed as a percentage.
cost variance - The difference between the budgeted cost for work performed and the
actual cost of work performed.
course - An offering in particular subject.
data - Something given or admitted, especially as a basis for reasoning or inference;
factual material used as a basis especially for discussion or decision; something used
as a basis for calculating or measuring.
defect - A product’ inconsistency with its specification. Examples include such things
s
as omissions and imperfections found in software during the early life-cycle phases and
faults contained in software sufficiently mature for test or operation.
error - (1) The difference between a computed, observed, or measured value or
condition and the true, specified, or theoretically correct value or condition. (2) An
CMU/SEI-92-TR-25 B-1](https://image.slidesharecdn.com/softwaremeasuresandthecapabilitymaturitymodel-1992johnh-baumertsei-110103031855-phpapp02/75/Software-measures-and-the-capability-maturity-model-1992-john-h-baumert-sei-237-2048.jpg)
![Appendix B: Definitions
incorrect step, process, or data definition. (3) An incorrect result. (4) A human action
that produces an incorrect result [IEEE 610].
estimated cost at completion - Actual costs to date plus the estimate of costs for
authorized work remaining (based on [DoD 80]).
failure - The inability of a system or component to perform its required functions within
specified performance requirements [IEEE 610].
fault - An incorrect step, process, or data definition in a computer program. In common
usage, the terms “ error”and “ bug”are used to express this meaning [IEEE 610].
first-line software manager - A manager who has direct management responsibility
(including providing technical direction and administering the personnel and salary
functions) for the staff and activities of a single department of software engineers and
other related staff.
formal review - A formal meeting at which a product is presented to the end user,
customer, or other interested parties for comment and approval. It can also be a review
of the management and technical activities and progress of the hardware/software
development project.
indicator - A representation of measurement data that provides insight into software
development processes and/or software process improvement activities.
labor category - A way of classifying labor. Labor categories can be direct or indirect,
or broken down by job classification or skill.
measure - n. A standard or unit of measurement; the extent, dimensions, capacity, etc.
of anything, especially as determined by a standard; an act or process of measuring; a
result of measurement. v. To ascertain the quantity, mass, extent, or degree of
something in terms of a standard unit or fixed amount, usually by means of an
instrument or process; to compute the size of something from dimensional
measurements; to estimate the extent, strength, worth, or character of something; to
take measurements.
measurement - The act or process of measuring something. Also a result, such as a
figure expressing the extent or value that is obtained by measuring.
metric - In this document, metric is used as a synonym for measure.
mid-level software manager - A manager who reports directly or indirectly (i.e.,
through another manager) to the project software manager and who has direct
management responsibility (including providing technical and management direction
and administering the personnel and salary functions) for other software managers.
noncompliance - The failure of an intermediate or final product to comply with a
standard or of an activity to comply with its process.
priority - The level of importance assigned to an item by an individual. Priority is
related to how quickly an item gets addressed.
B-2 CMU/SEI-92-TR-25](https://image.slidesharecdn.com/softwaremeasuresandthecapabilitymaturitymodel-1992johnh-baumertsei-110103031855-phpapp02/75/Software-measures-and-the-capability-maturity-model-1992-john-h-baumert-sei-238-2048.jpg)
![Appendix B: Definitions
problem - An unsettled question arising from a situation where it appears that a
change to the software, its documentation, or related hardware is necessary for
successful test or operation of the system [IEEE P1044].
process - A series of actions, changes, or functions that achieve an end or result.
project software manager - A manager who has total responsibility for all the software
activities for the entire project. The project software manager is the person the project
manager deals with in terms of software commitments, etc., and the person who
controls all the software development staff for a project.
quality audit - The review of a product or process for compliance with standards,
procedures, and progress reporting policy by an independent software quality
assurance group.
schedule performance index - The ratio of the budgeted cost for the work performed
and the budgeted cost for the work scheduled, expressed as a percentage.
schedule variance - The difference between the budgeted cost for the work performed
and the budgeted cost for work scheduled.
senior manager - A manager at a high enough level that his/her primary focus would
be expected to be the long-term vitality of the company and organization, rather than
short-term project and contractual concerns and pressures. In general, a senior
manager for engineering would have responsibility for multiple projects.
severity - The degree of impact that a requirement, module, error, fault, failure, or other
item has on the development or operation of a system [IEEE 610].
software engineering process group - A group of specialists who facilitate the
definition and improvement of the software process used by the organization.
staff-hour - An hour of time expended by a member of the staff [IEEE 1045].
statistical process control - The use of statistical methods to identify the existence of
special causes of variation in a process.
trouble report - A document (electronic or hard copy) used to recognize, record, track,
and close anomalies detected in the software and its accompanying documentation. In
this document, a trouble report is restricted to that written during integration and test,
and the acceptance test activities.
turnover - The number of unplanned staff losses during a reporting period.
variance - The difference between planned and actual performance which requires
further review, analysis, or action [DoD 80].
work breakdown structure - A product-oriented family tree division of hardware,
software, services, and other work tasks which organizes, defines, and graphically
displays the product to be produced as well as the work to be accomplished to achieve
the specified product [DoD 80].
CMU/SEI-92-TR-25 B-3](https://image.slidesharecdn.com/softwaremeasuresandthecapabilitymaturitymodel-1992johnh-baumertsei-110103031855-phpapp02/75/Software-measures-and-the-capability-maturity-model-1992-john-h-baumert-sei-239-2048.jpg)
![Appendix B: Definitions
work package - Detailed short-span jobs, or material items, identified by the contractor
for accomplishing work required to complete the contract [DoD 80].
B-4 CMU/SEI-92-TR-25](https://image.slidesharecdn.com/softwaremeasuresandthecapabilitymaturitymodel-1992johnh-baumertsei-110103031855-phpapp02/75/Software-measures-and-the-capability-maturity-model-1992-john-h-baumert-sei-240-2048.jpg)
![Appendix C: Mapping
Appendix C: Mapping of Software Measurement in the
Key Practices of the Capability Maturity Model to
Indicator Categories
This appendix provides the software measurement references contained within the key
process areas of the Capability Maturity Model for Software (CMM) [Weber 91]. The
information is provided in five columns. The first column repeats the goals of the key
process area from the CMM. The second column list questions that can be asked
about the goals. In most cases, these questions are concerned with measurement.
The third column lists the measures that are explicitly stated or inferred from the CMM
text. The reference for each measure is given in the fourth column. Each entry
consists of a letter indicating whether the measure is explicitly stated (E) or inferred (I)
in the CMM text and a citation code. This code has the format
key process area.common feature.top-level key practice number.subordinate key
practice number.item in subordinate key practice statement
Thus, E RM.MO.1.2.1 means that the measure number of requirements changes over
time is explicitly stated (E) in the Requirements Management (RM) key process area,
the Monitoring implementation (MO) common feature, top-level key practice statement
1, subordinate key practice statement 2, and item 1 within the subordinate key practice
statement. The code key for the CMM reference is given on the next page.
The five common features of the key practices for each key process area are the
following:
• Commitment to perform specifies the actions the organization must take to
ensure that the process is established and will endure.
• Ability to perform specifies the preconditions that must exist in the project or
organization to implement the process competently.
• Activities performed specifies the steps that must be performed to effectively
establish the key process area.
• Monitoring implementation specifies the steps that must be performed to
measure the process, analyze the measurements, and take action based on the
results.
• Verifying implementation specifies the steps that must be performed to guide
and ensure that the activities are performed in compliance with the process that
has been specified.
The last column lists the indicator category to which the measurement applies.
CMU/SEI-92-TR-25
C-1](https://image.slidesharecdn.com/softwaremeasuresandthecapabilitymaturitymodel-1992johnh-baumertsei-110103031855-phpapp02/75/Software-measures-and-the-capability-maturity-model-1992-john-h-baumert-sei-241-2048.jpg)
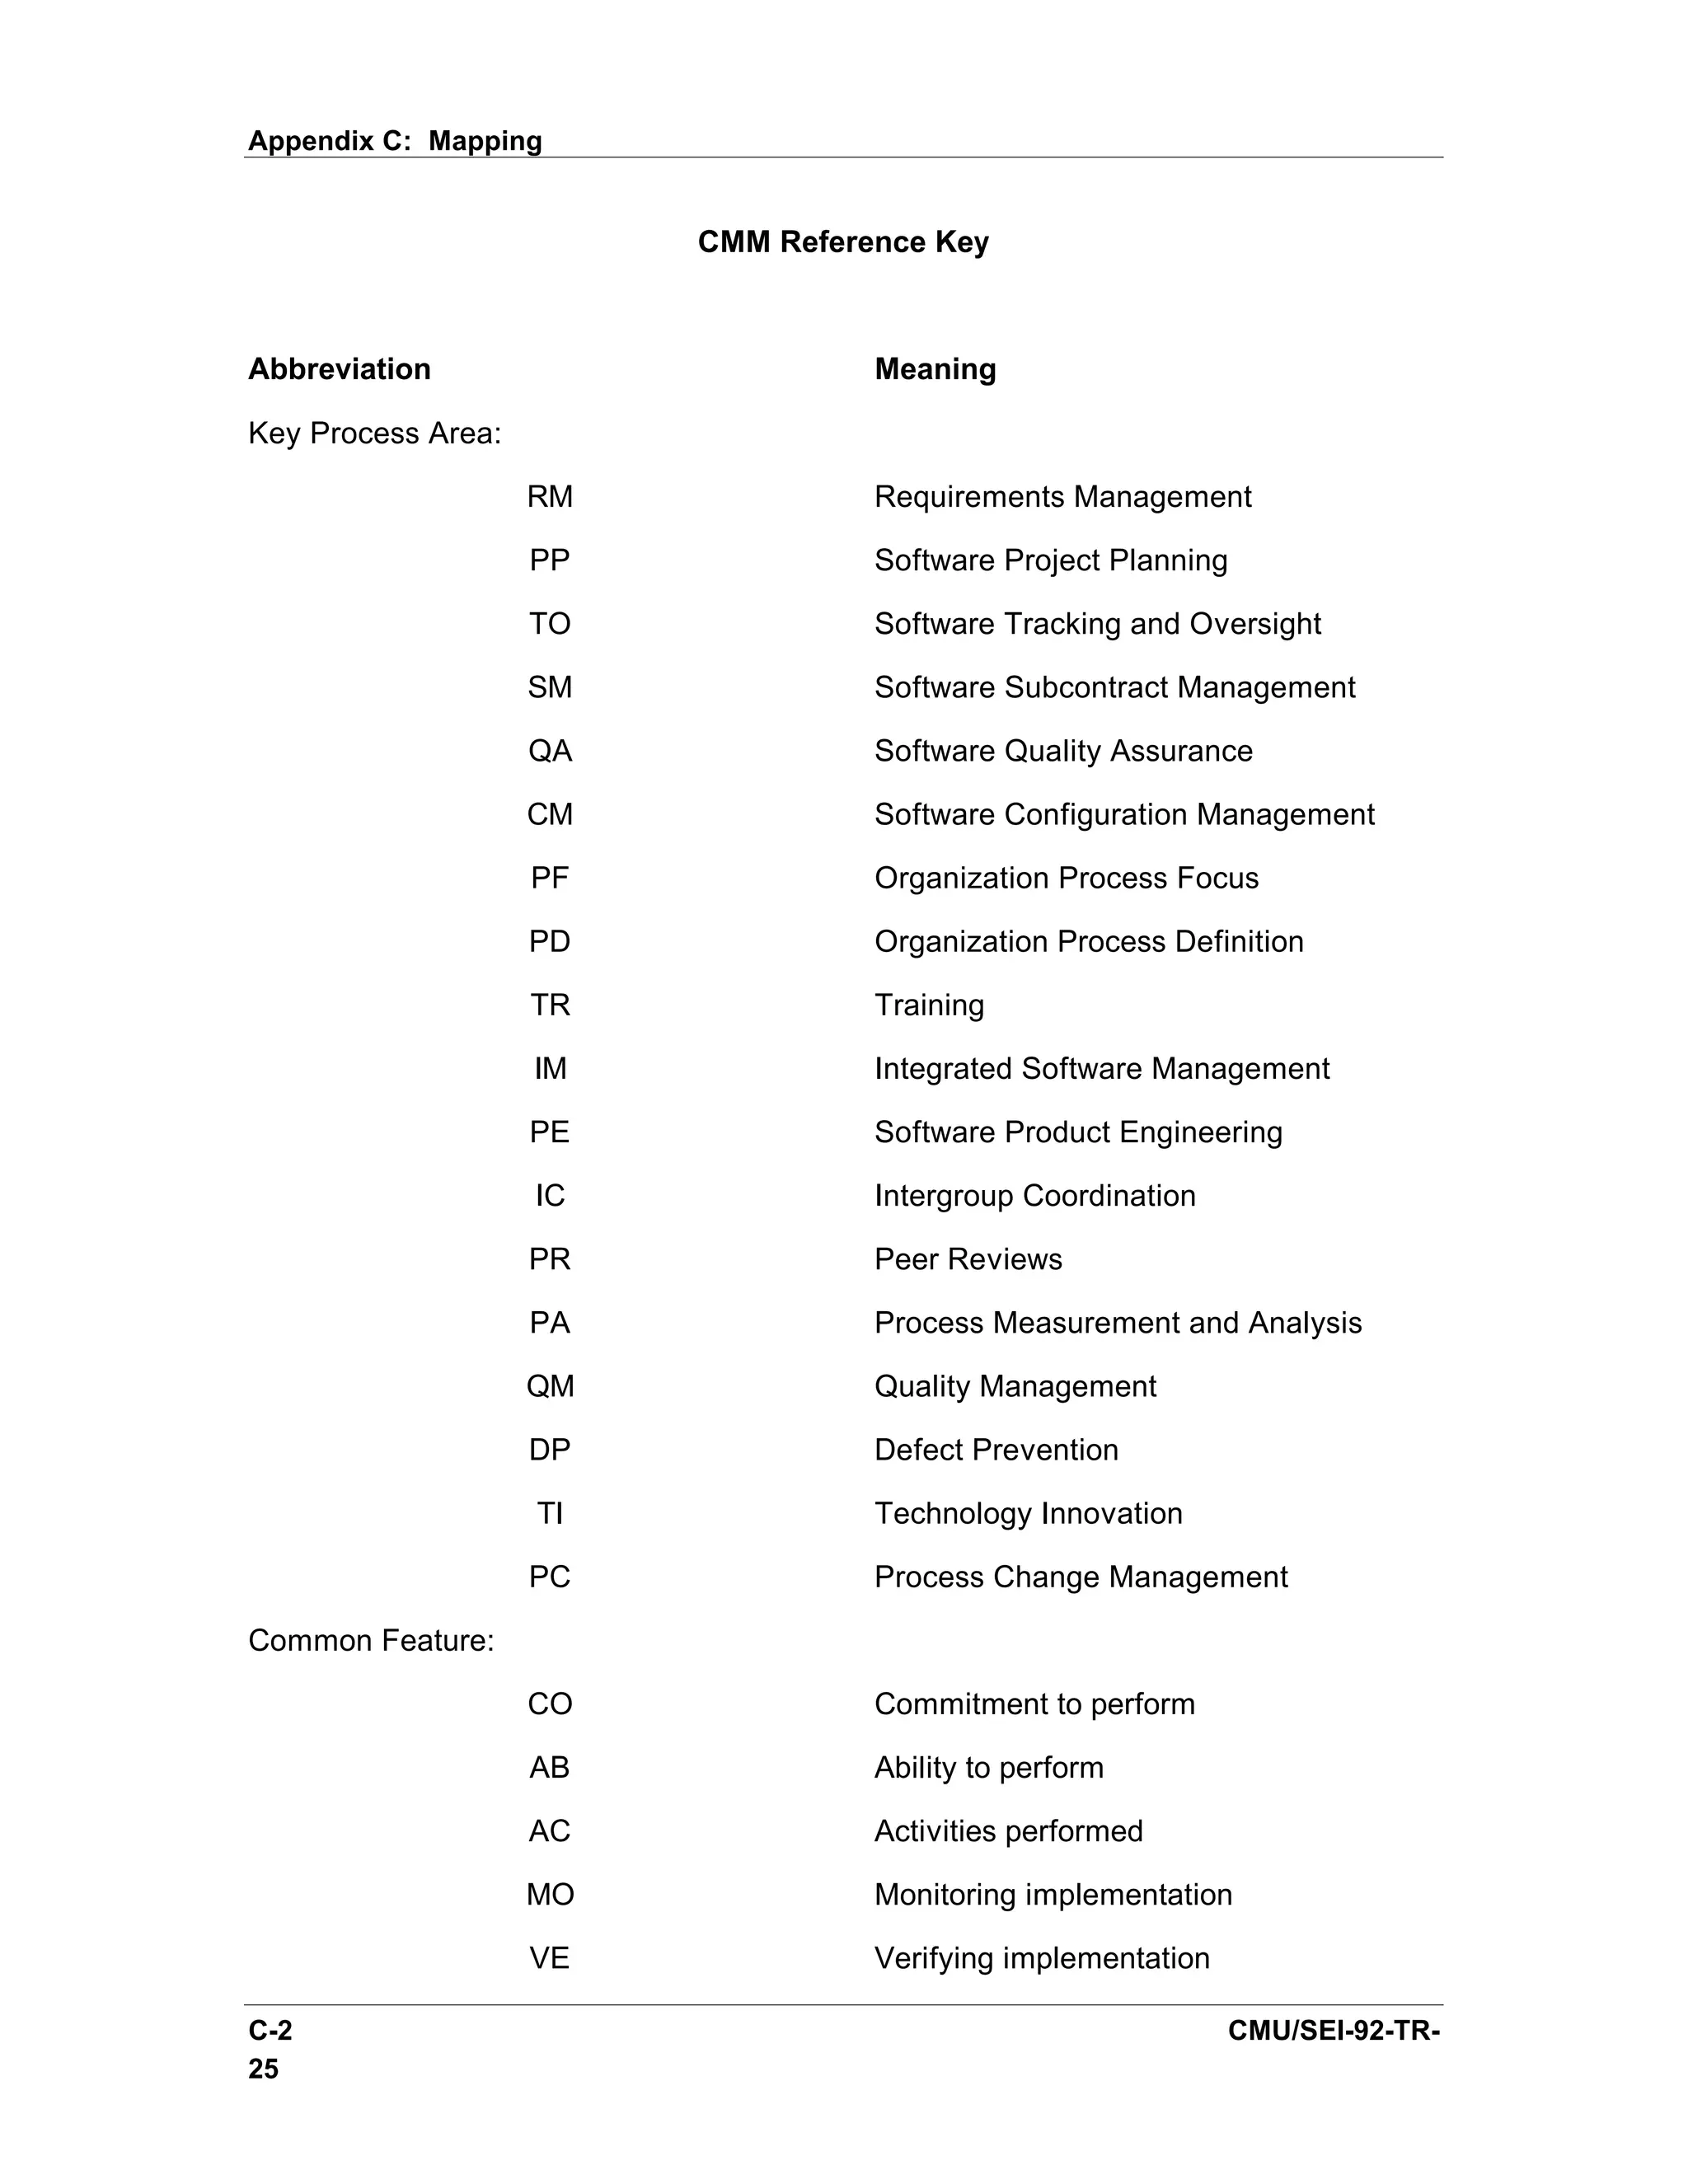
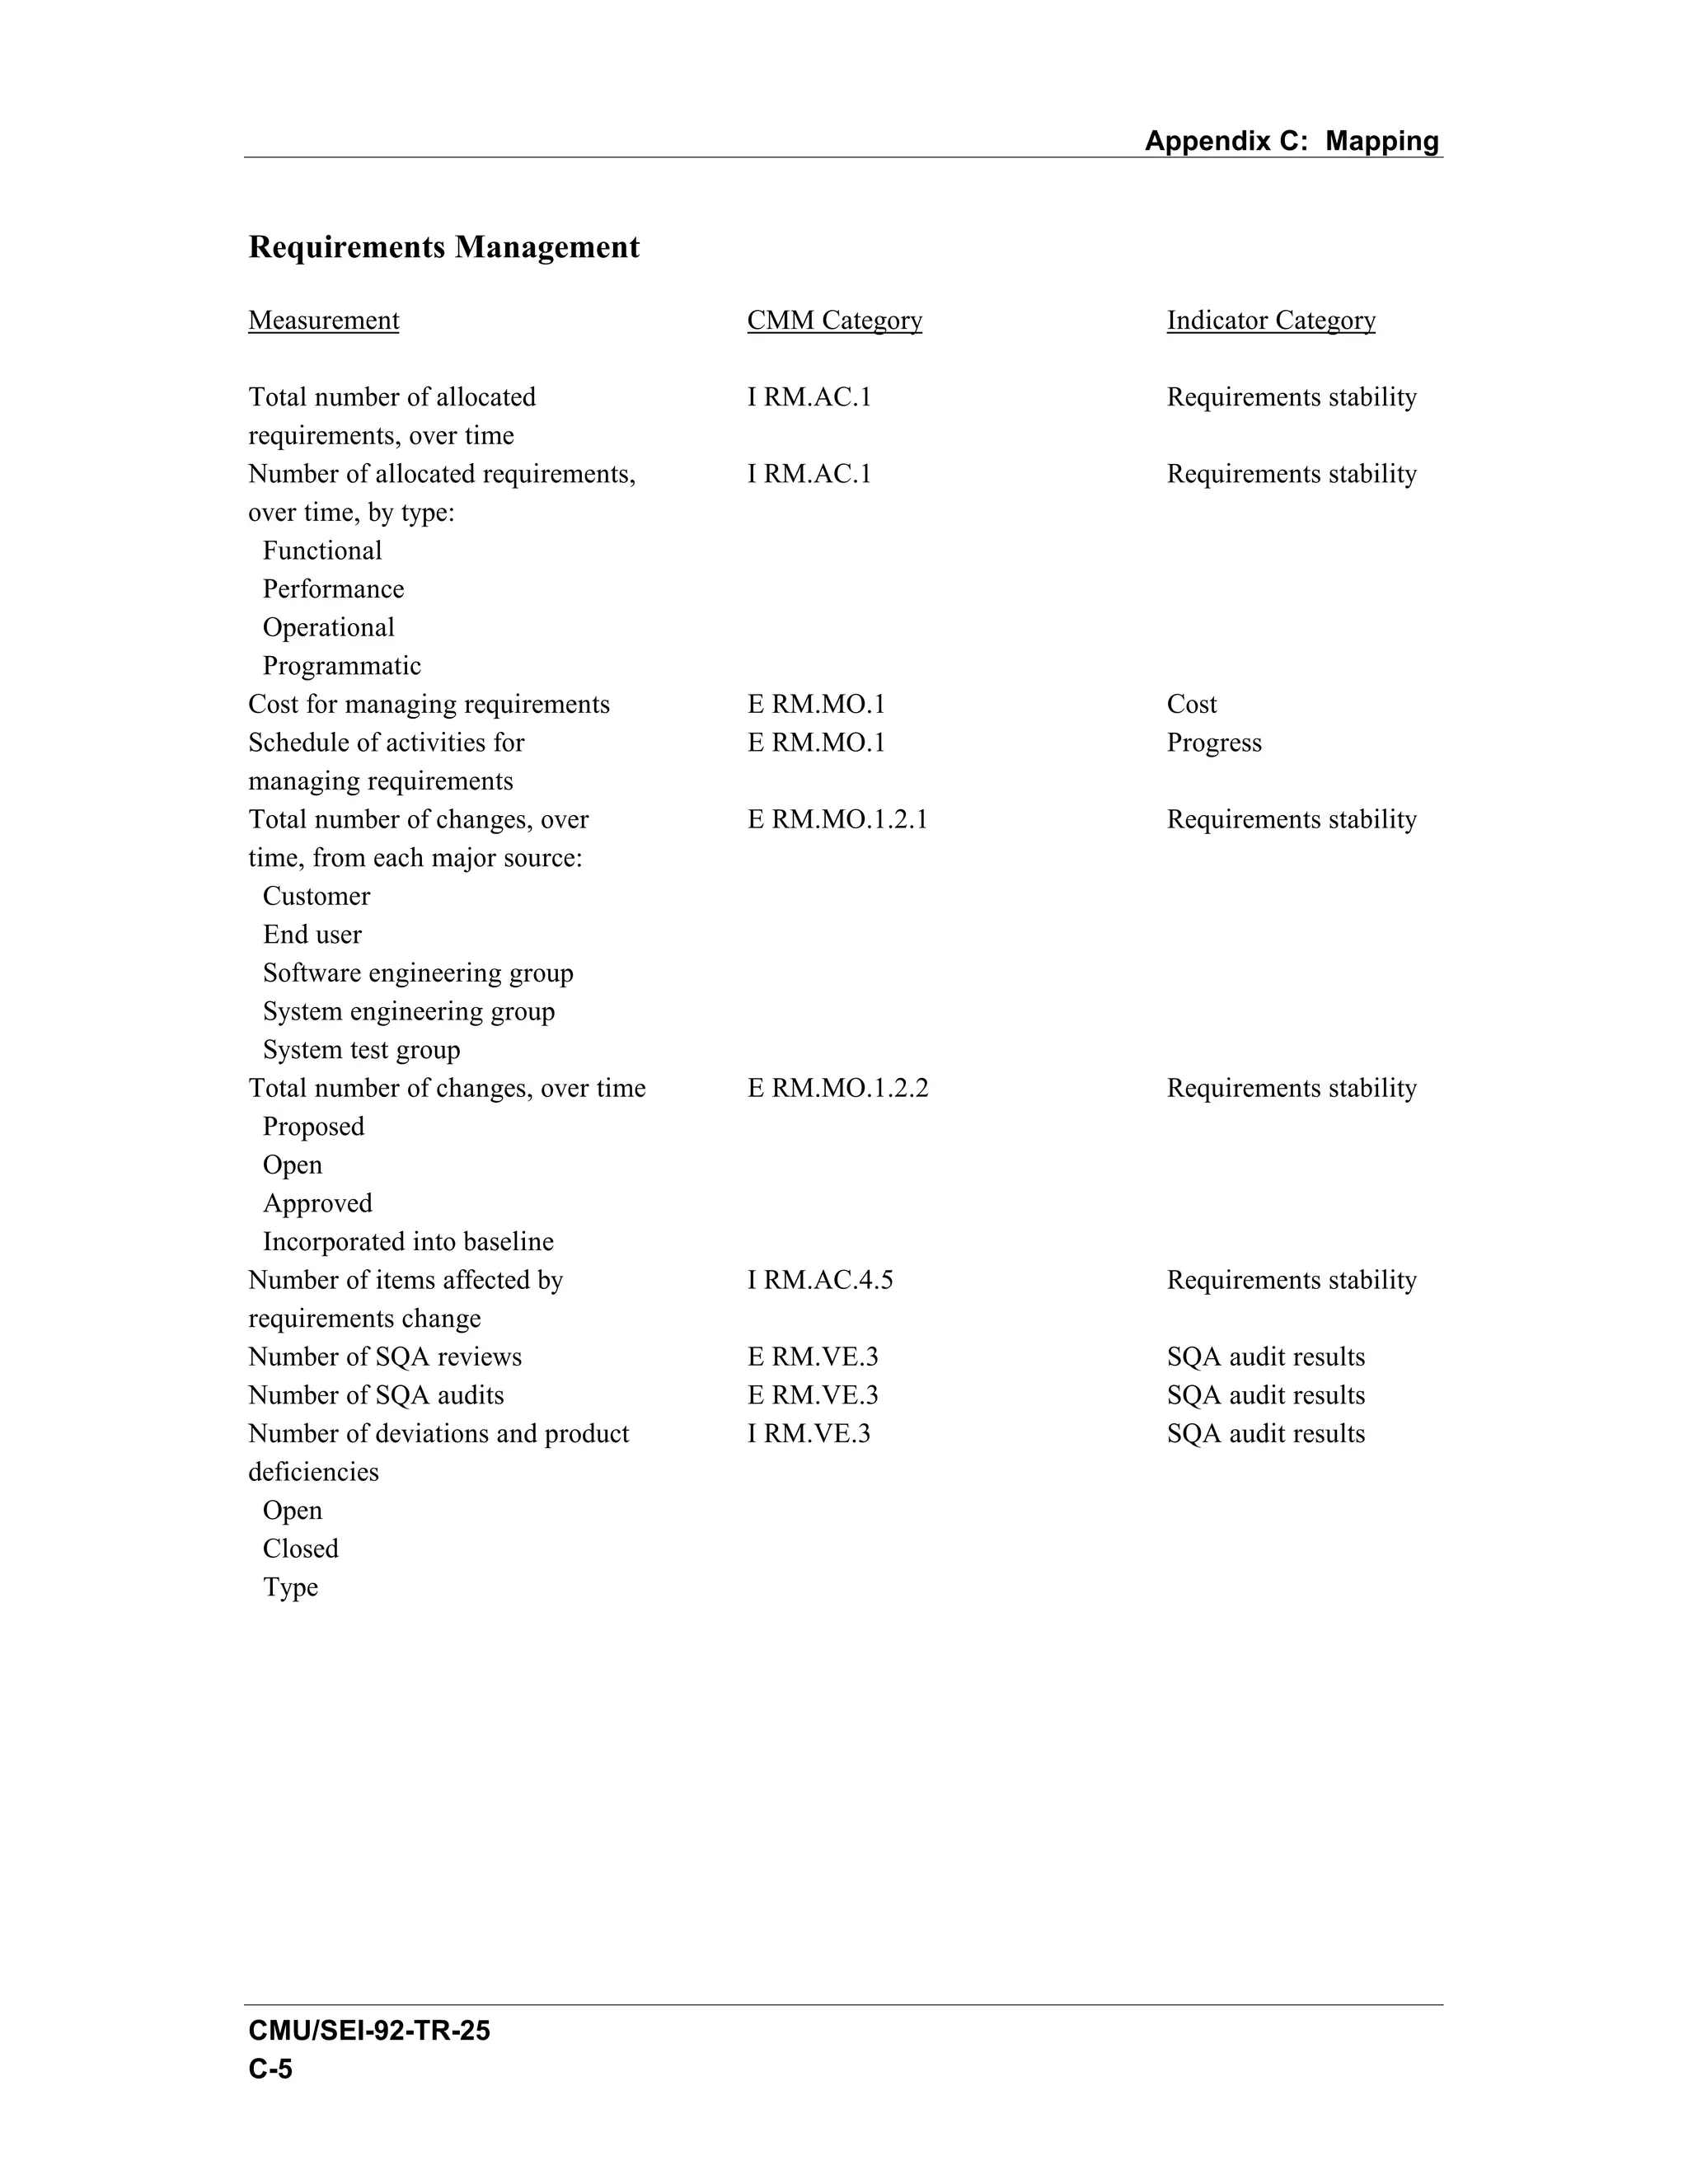
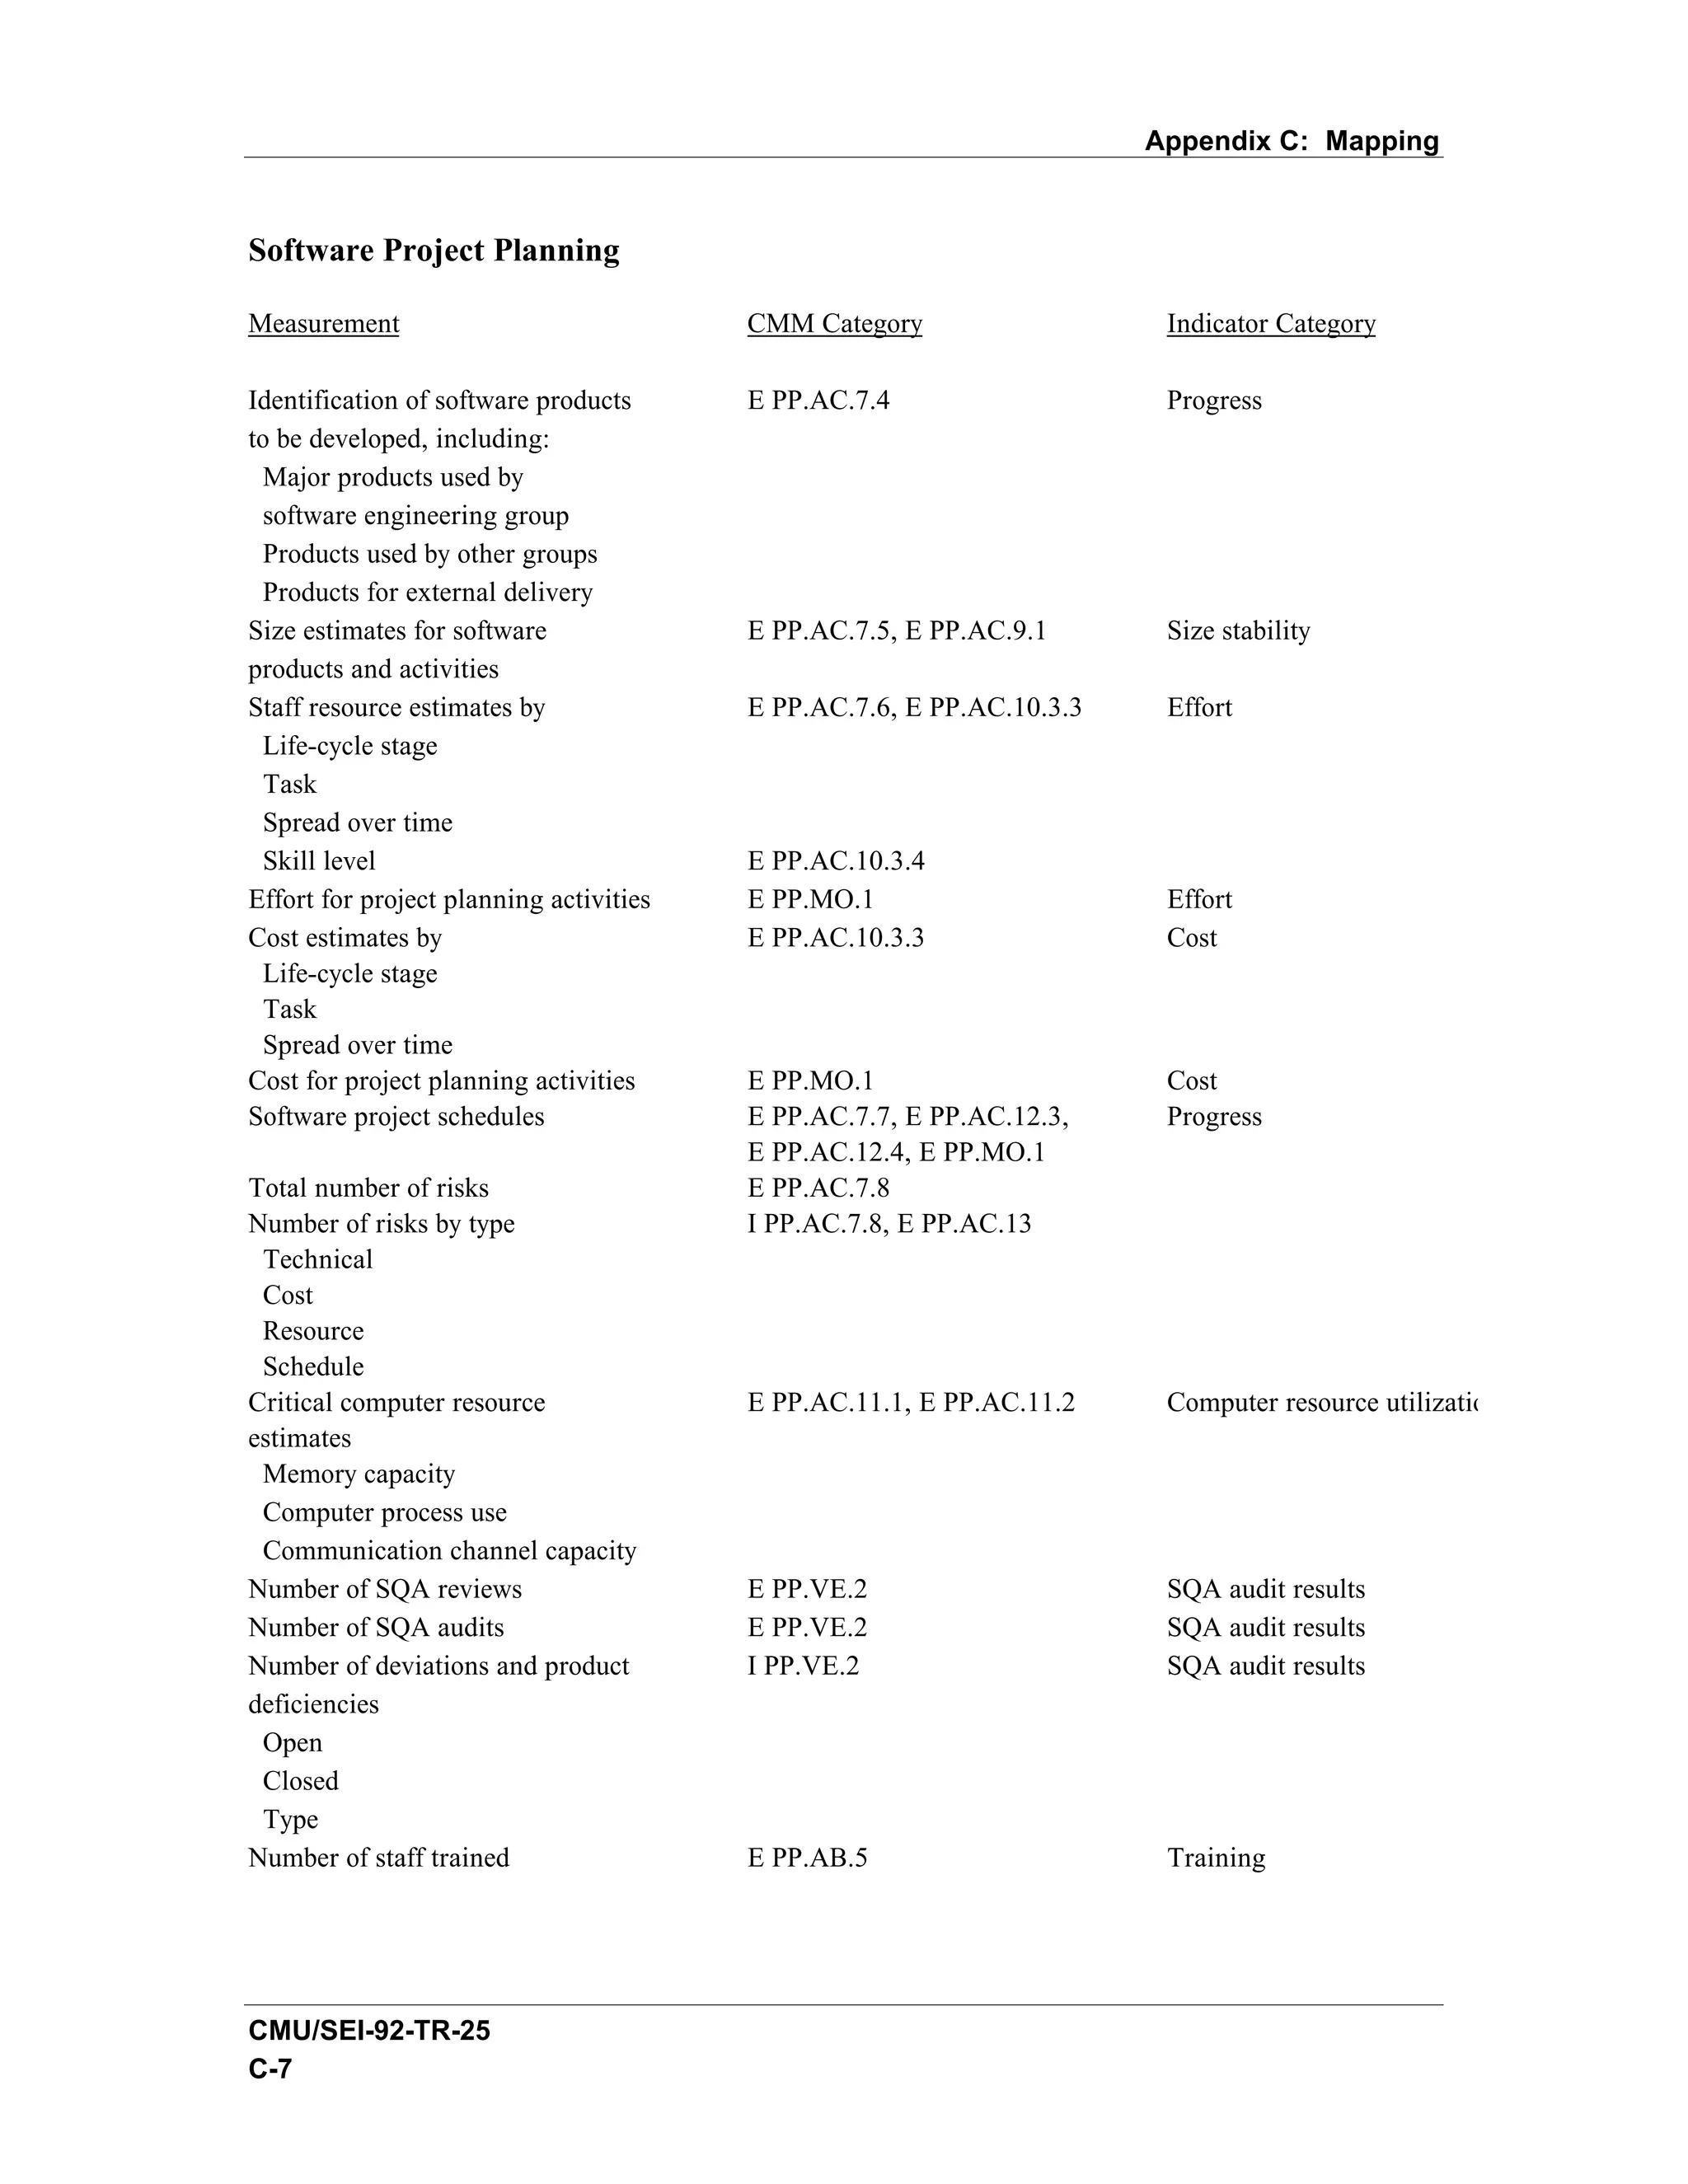
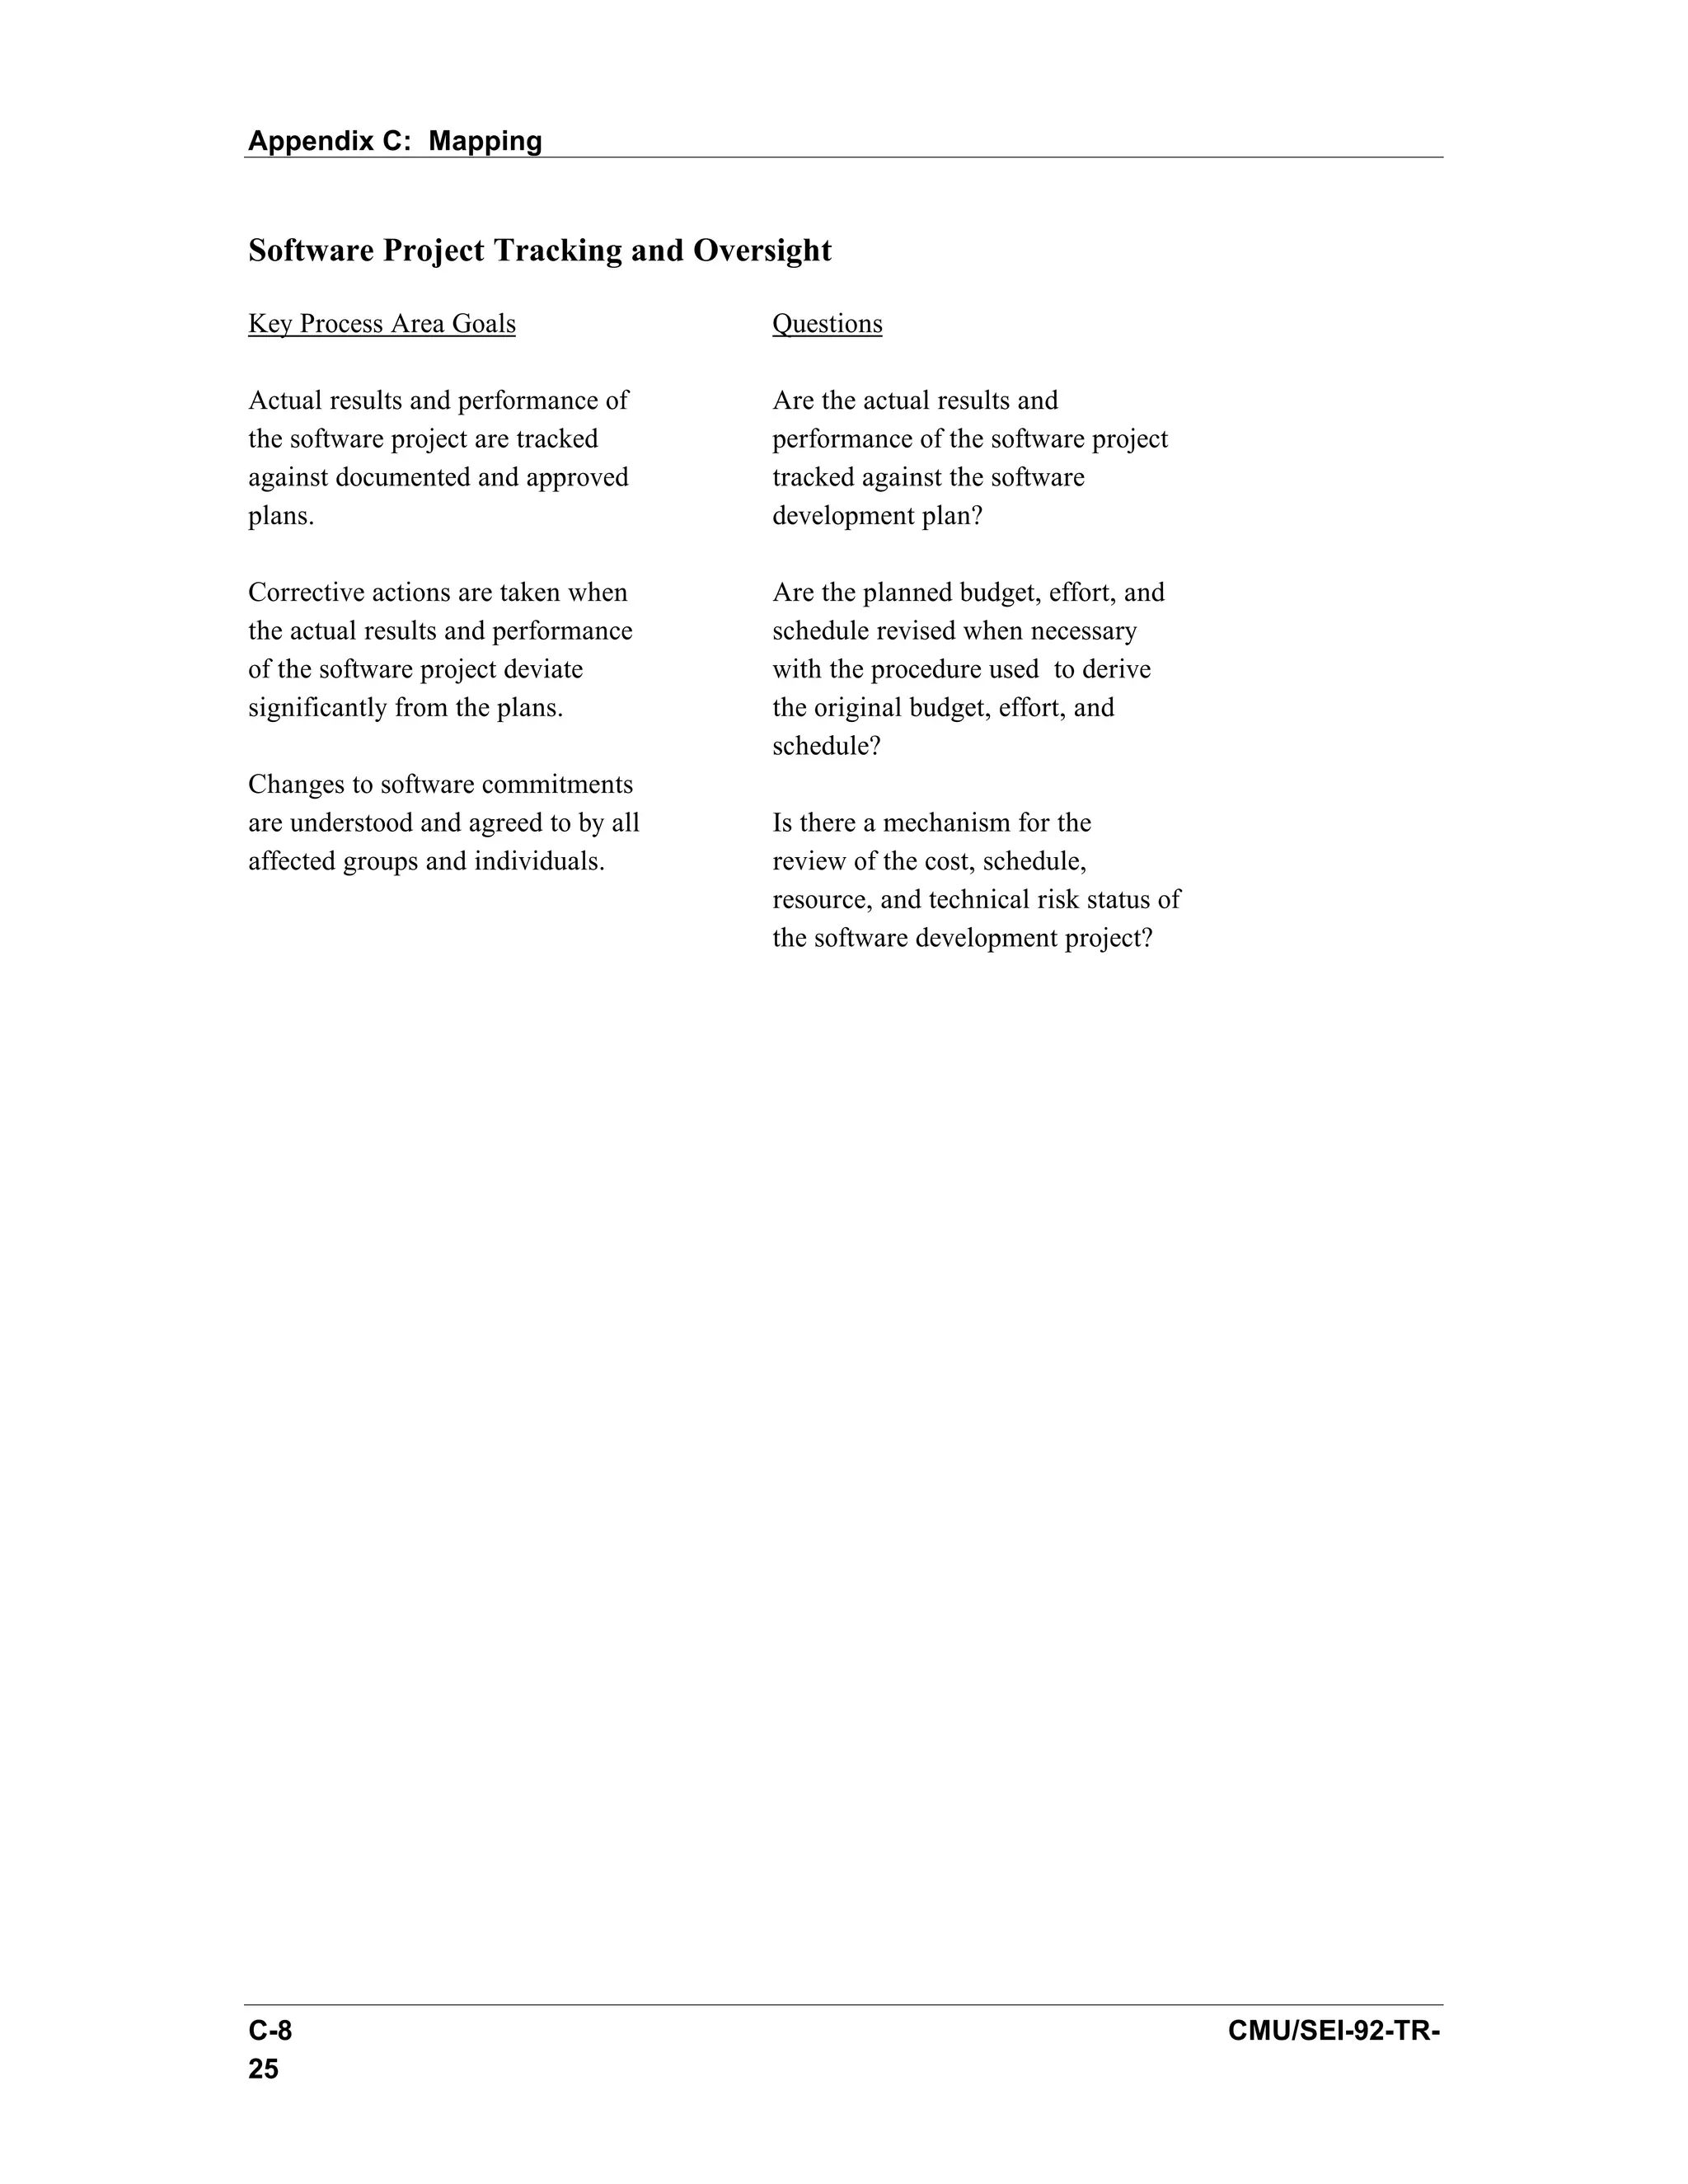
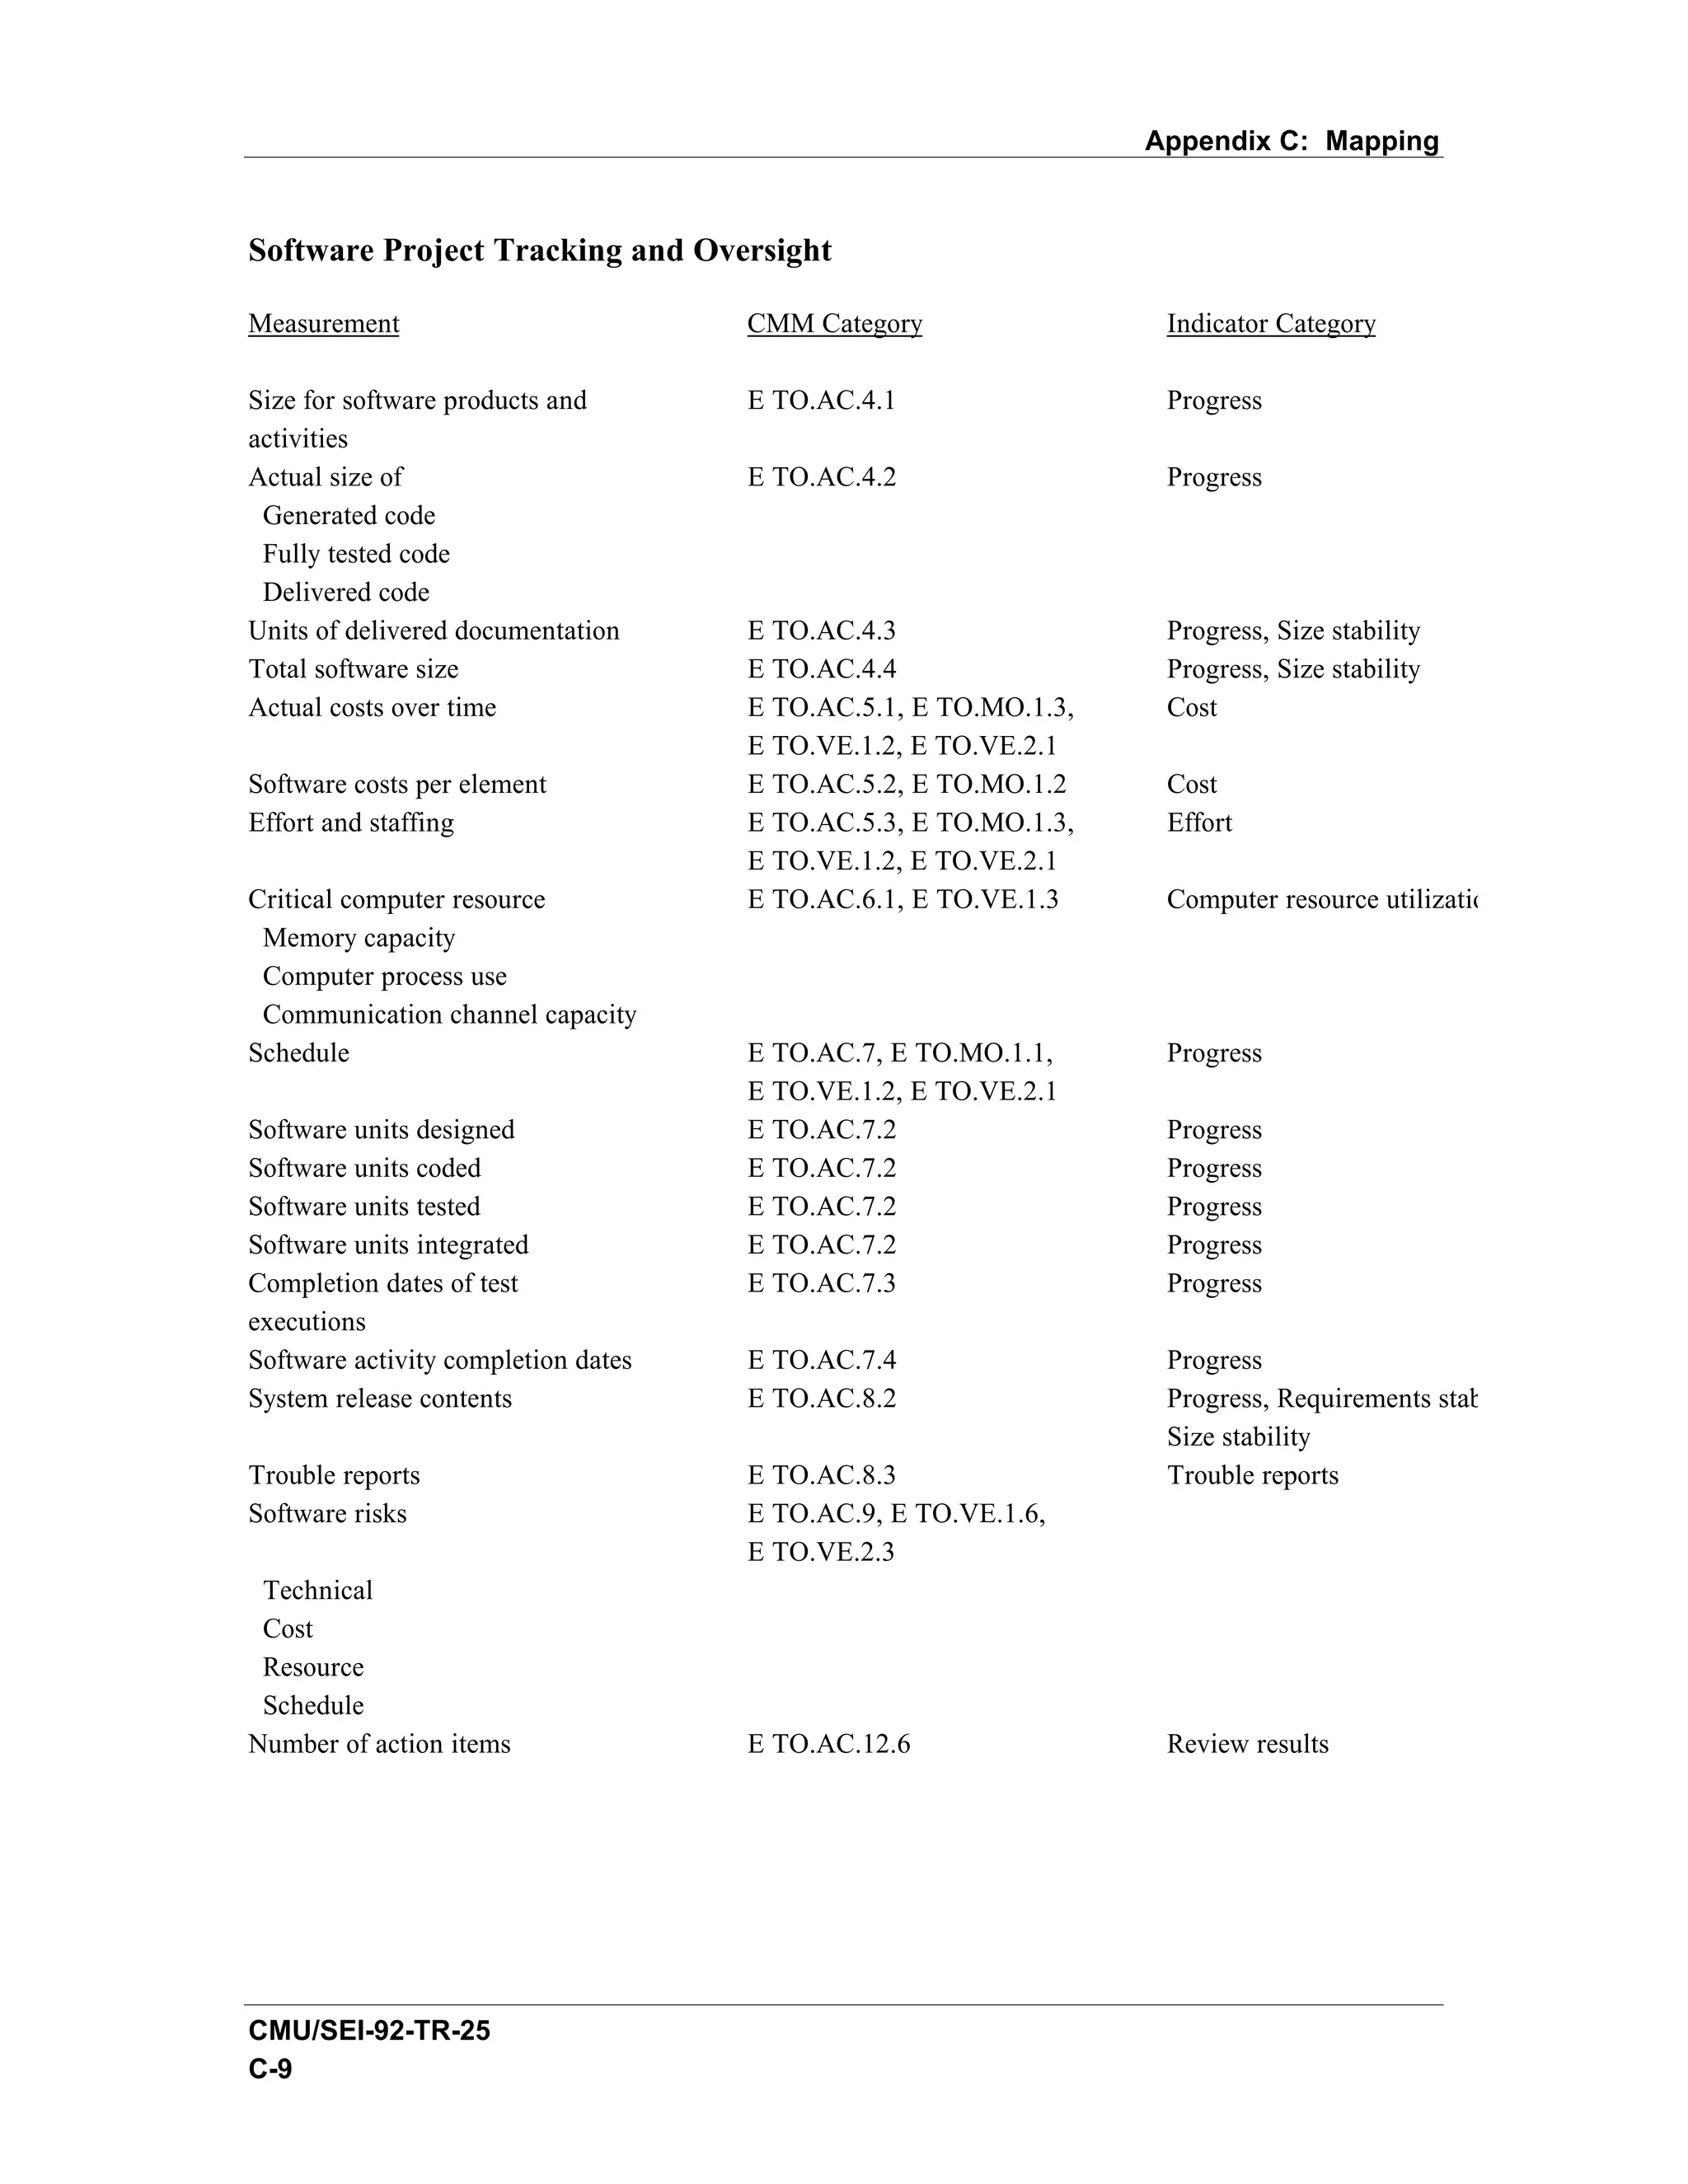
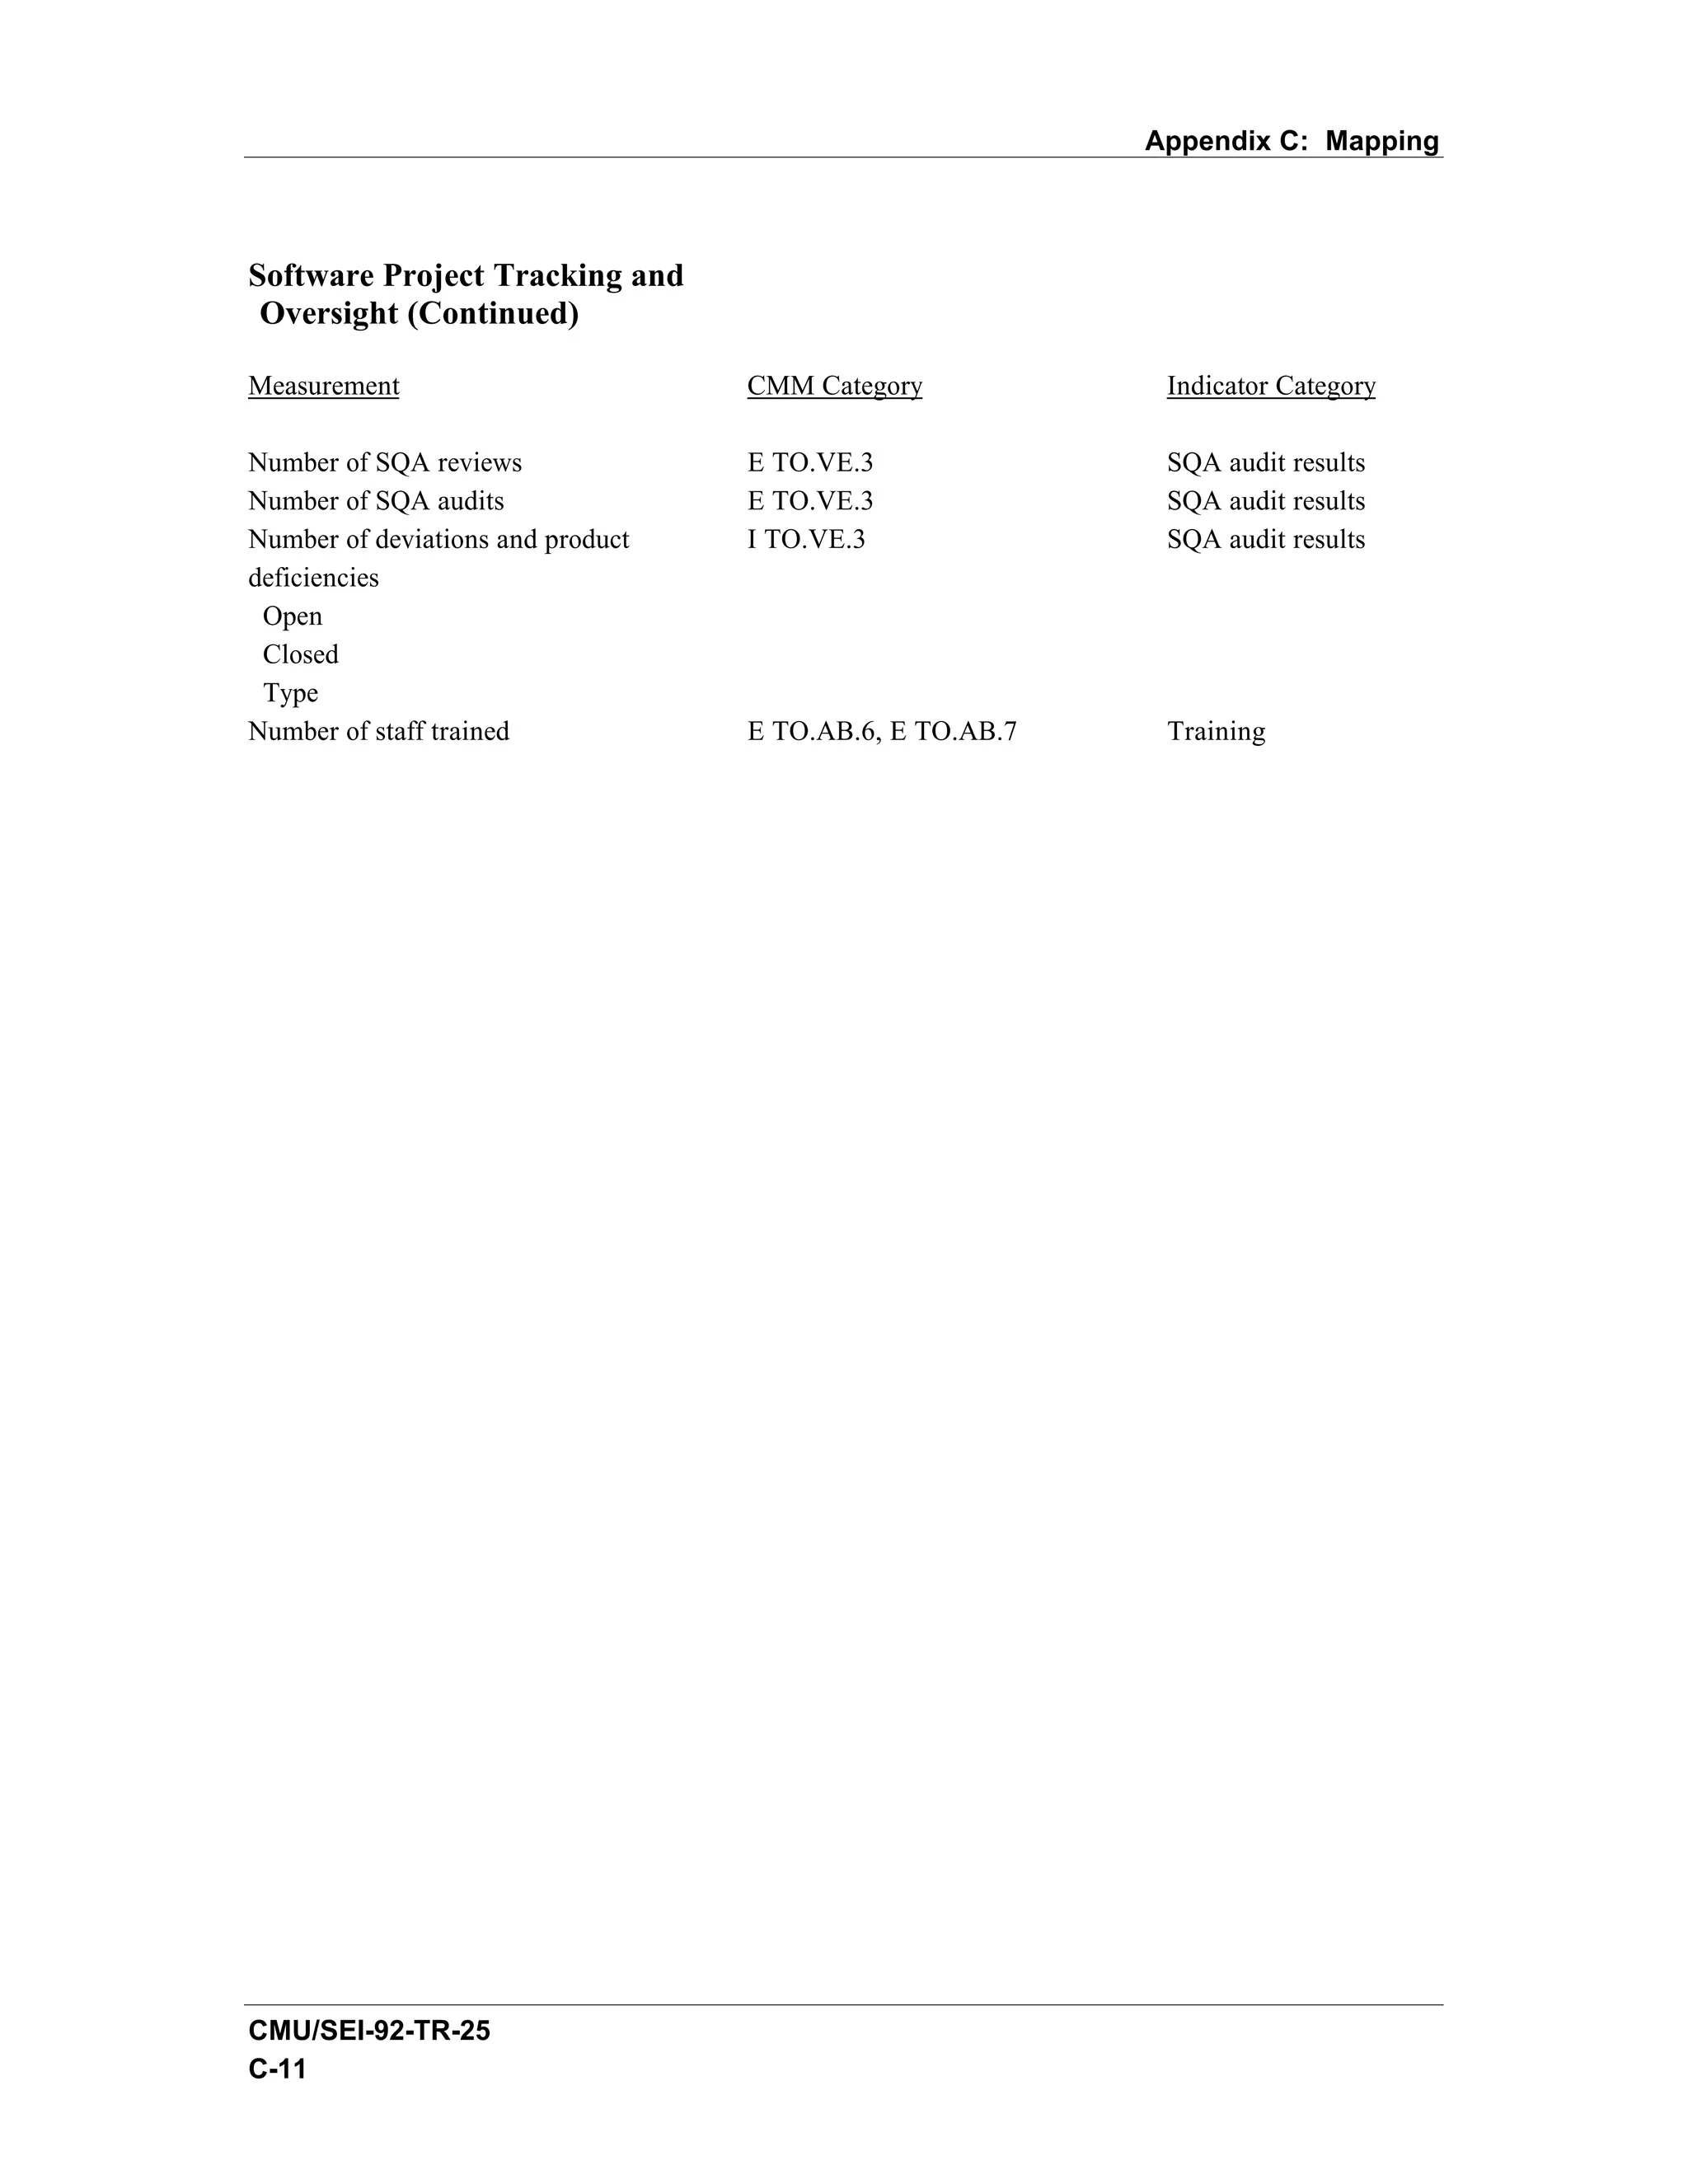
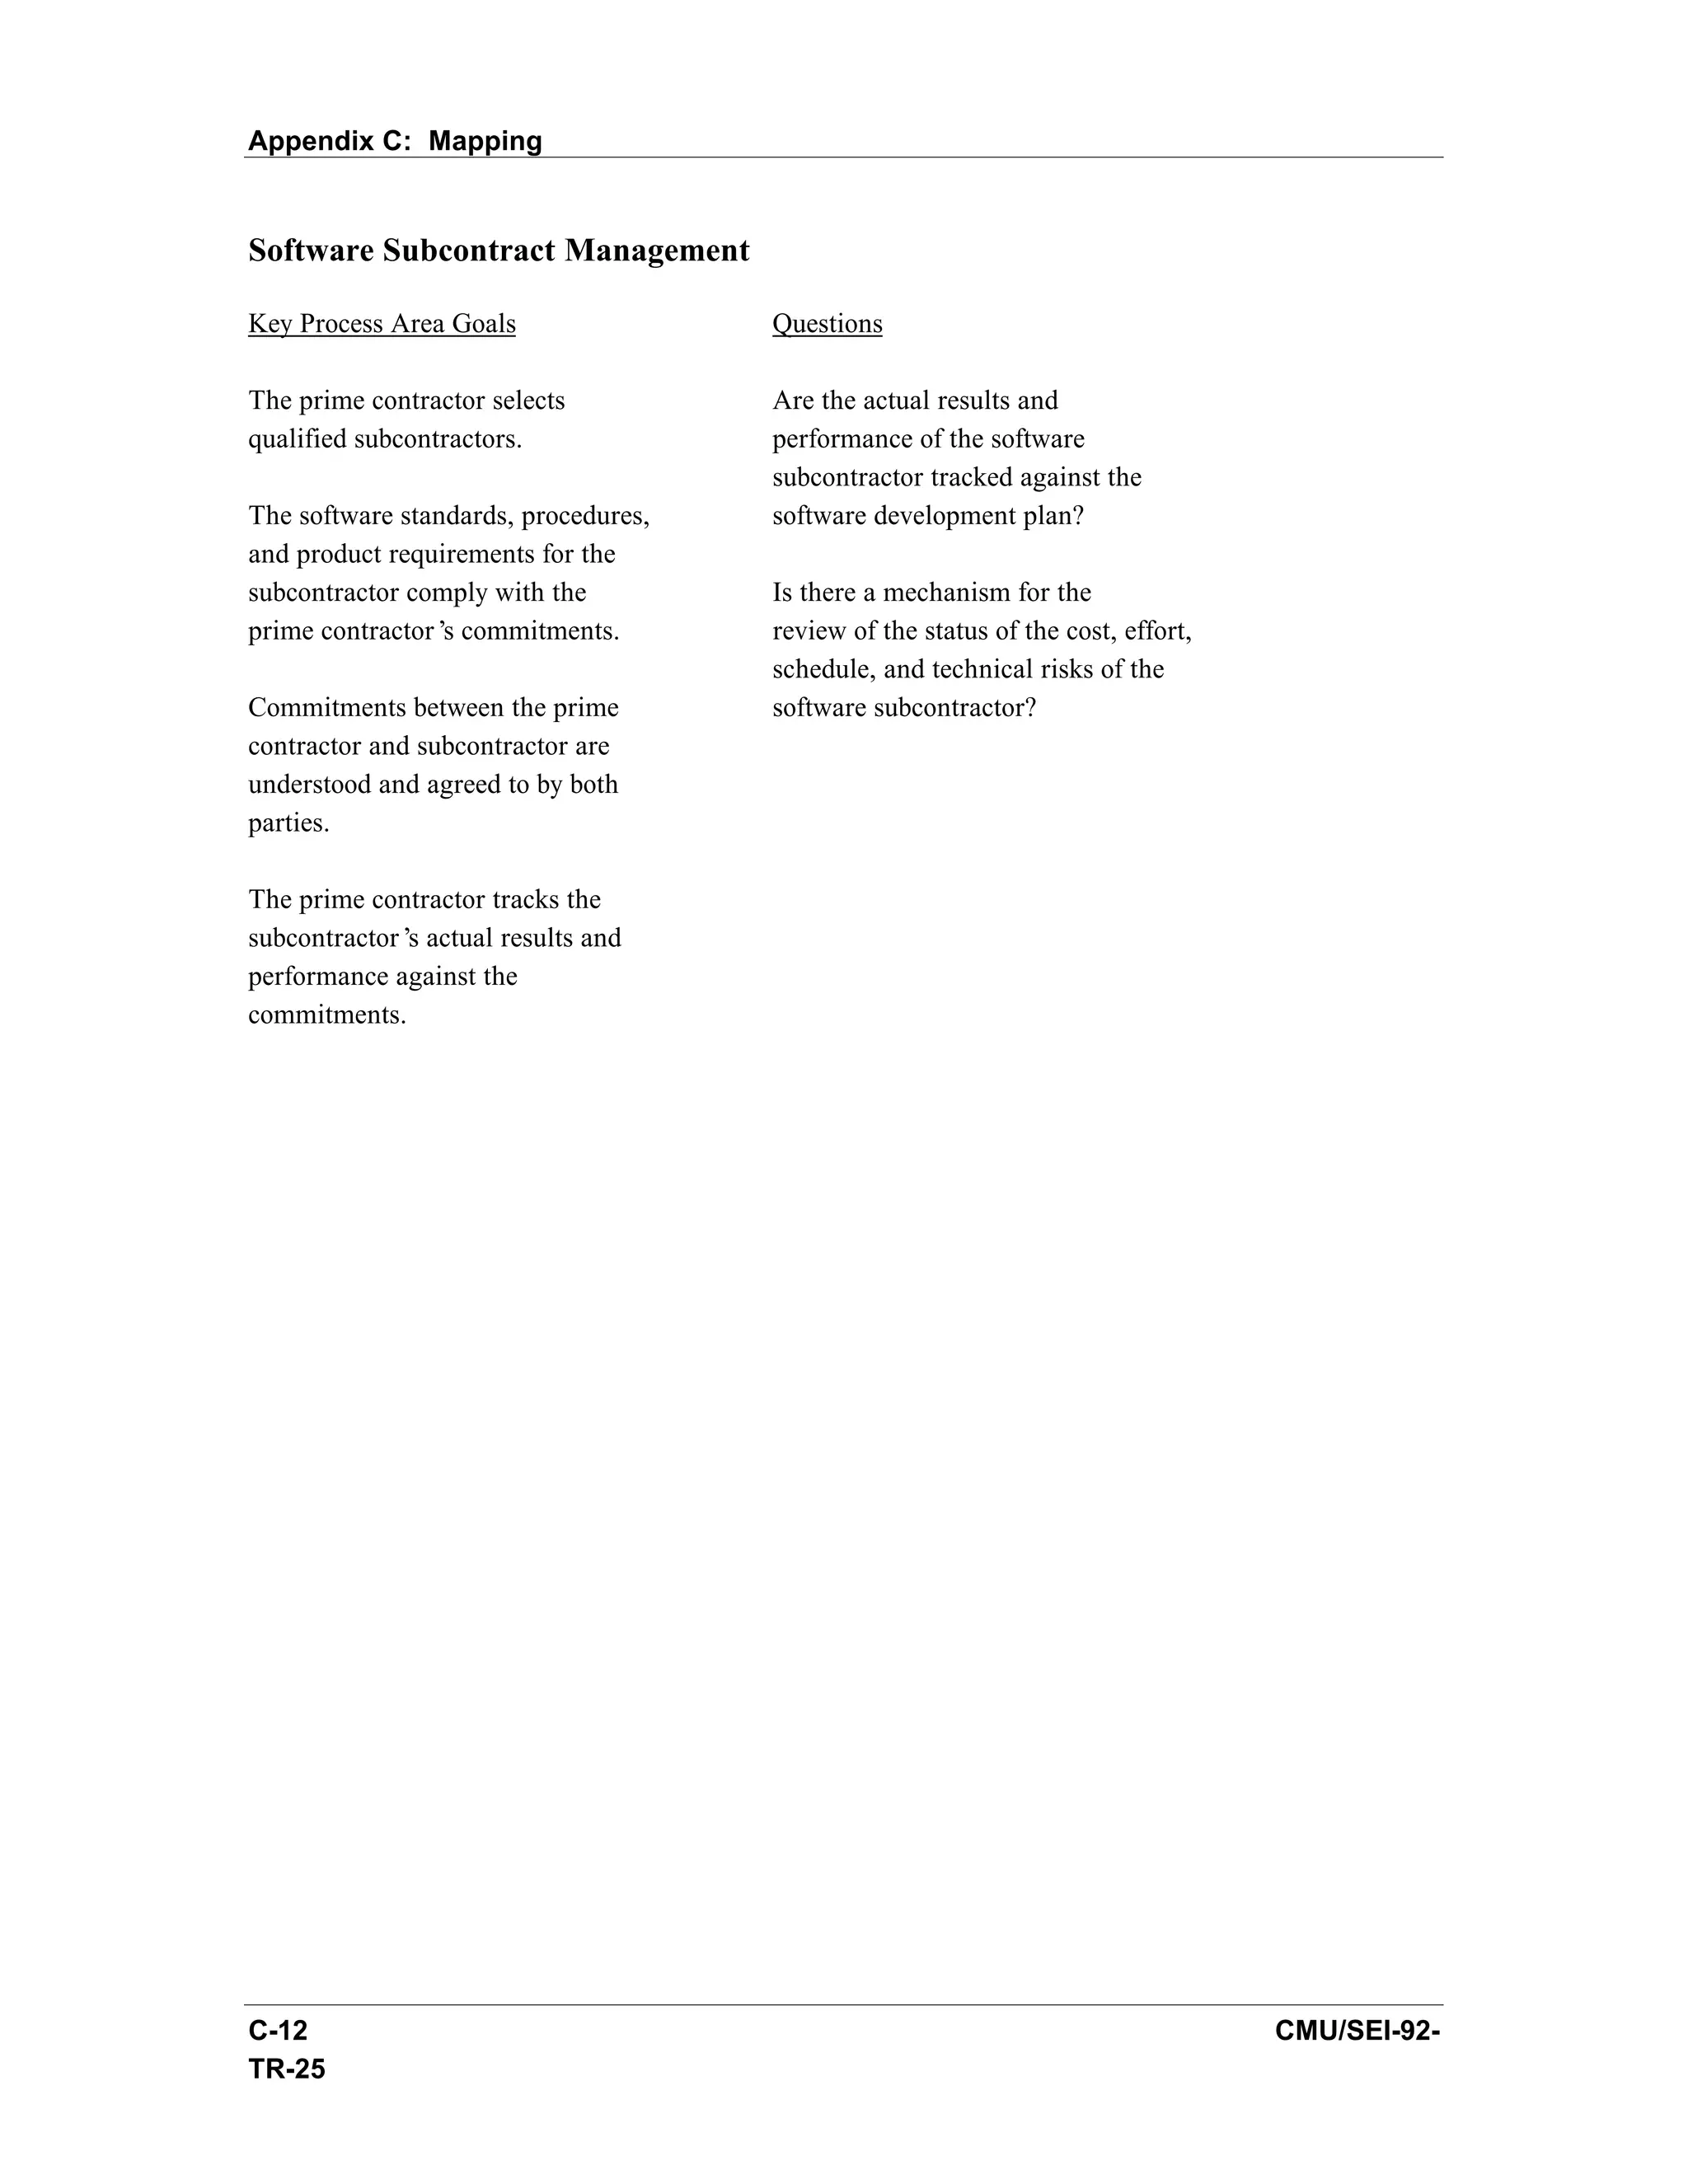
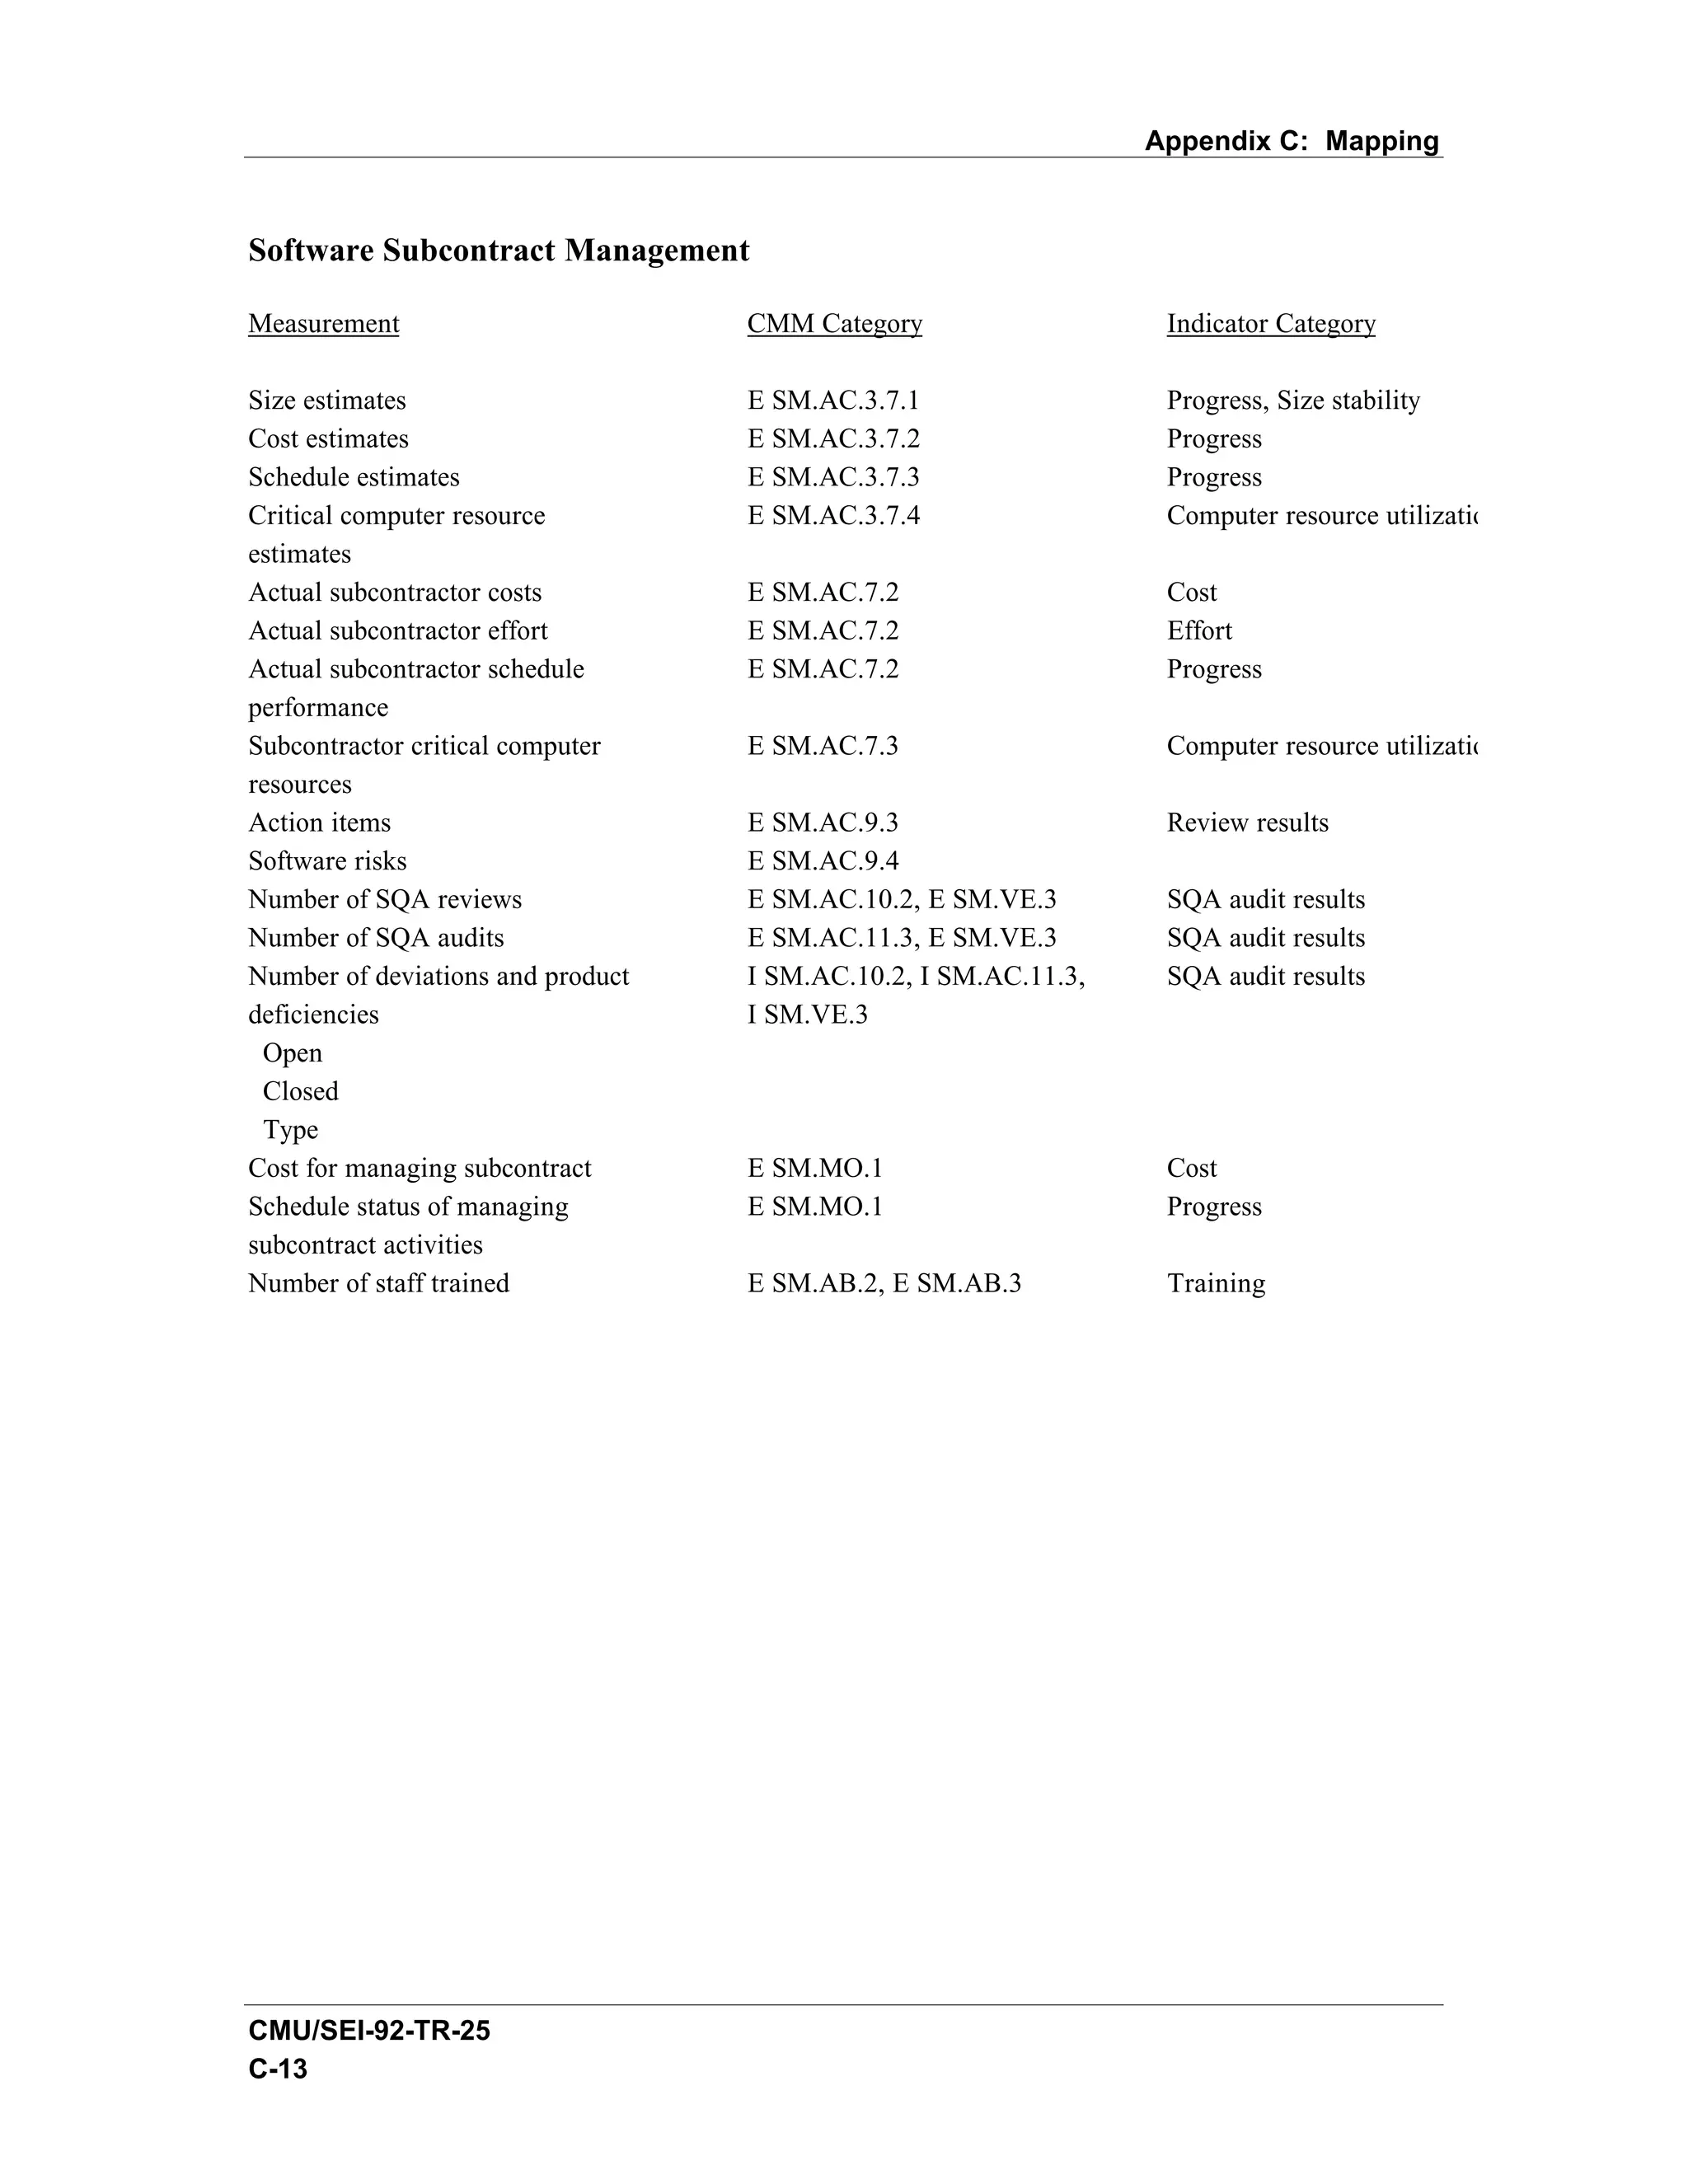
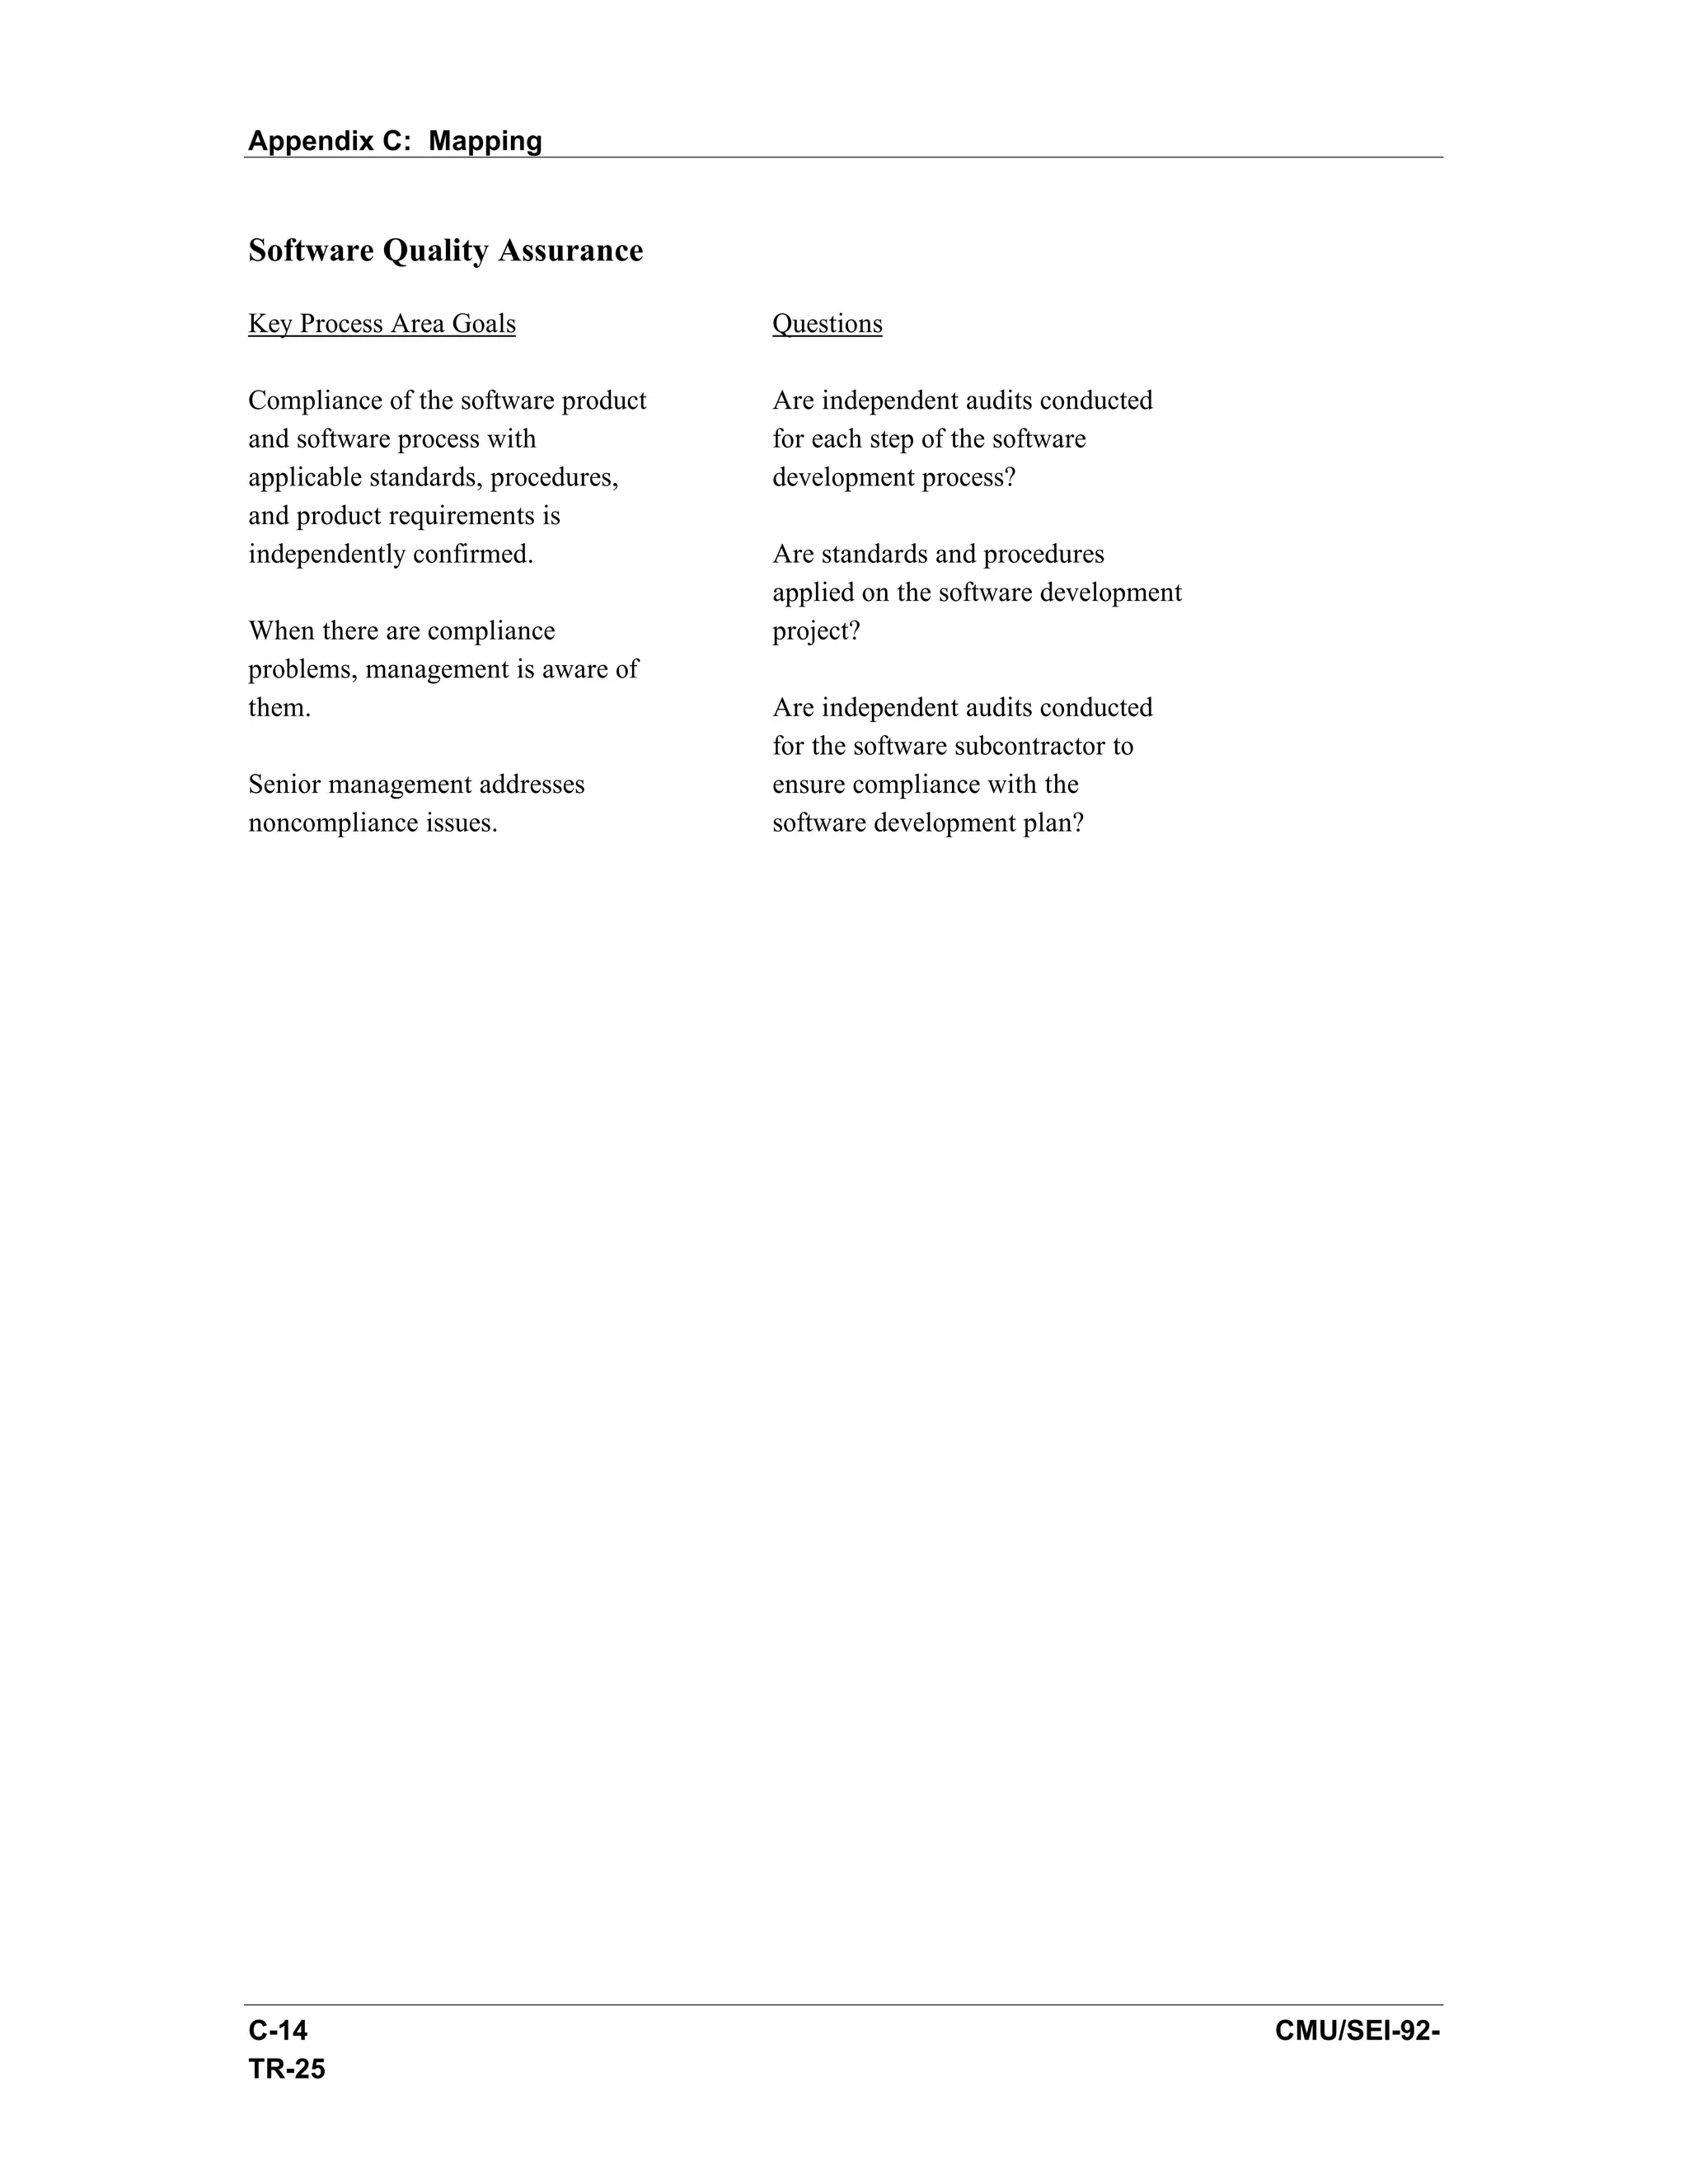
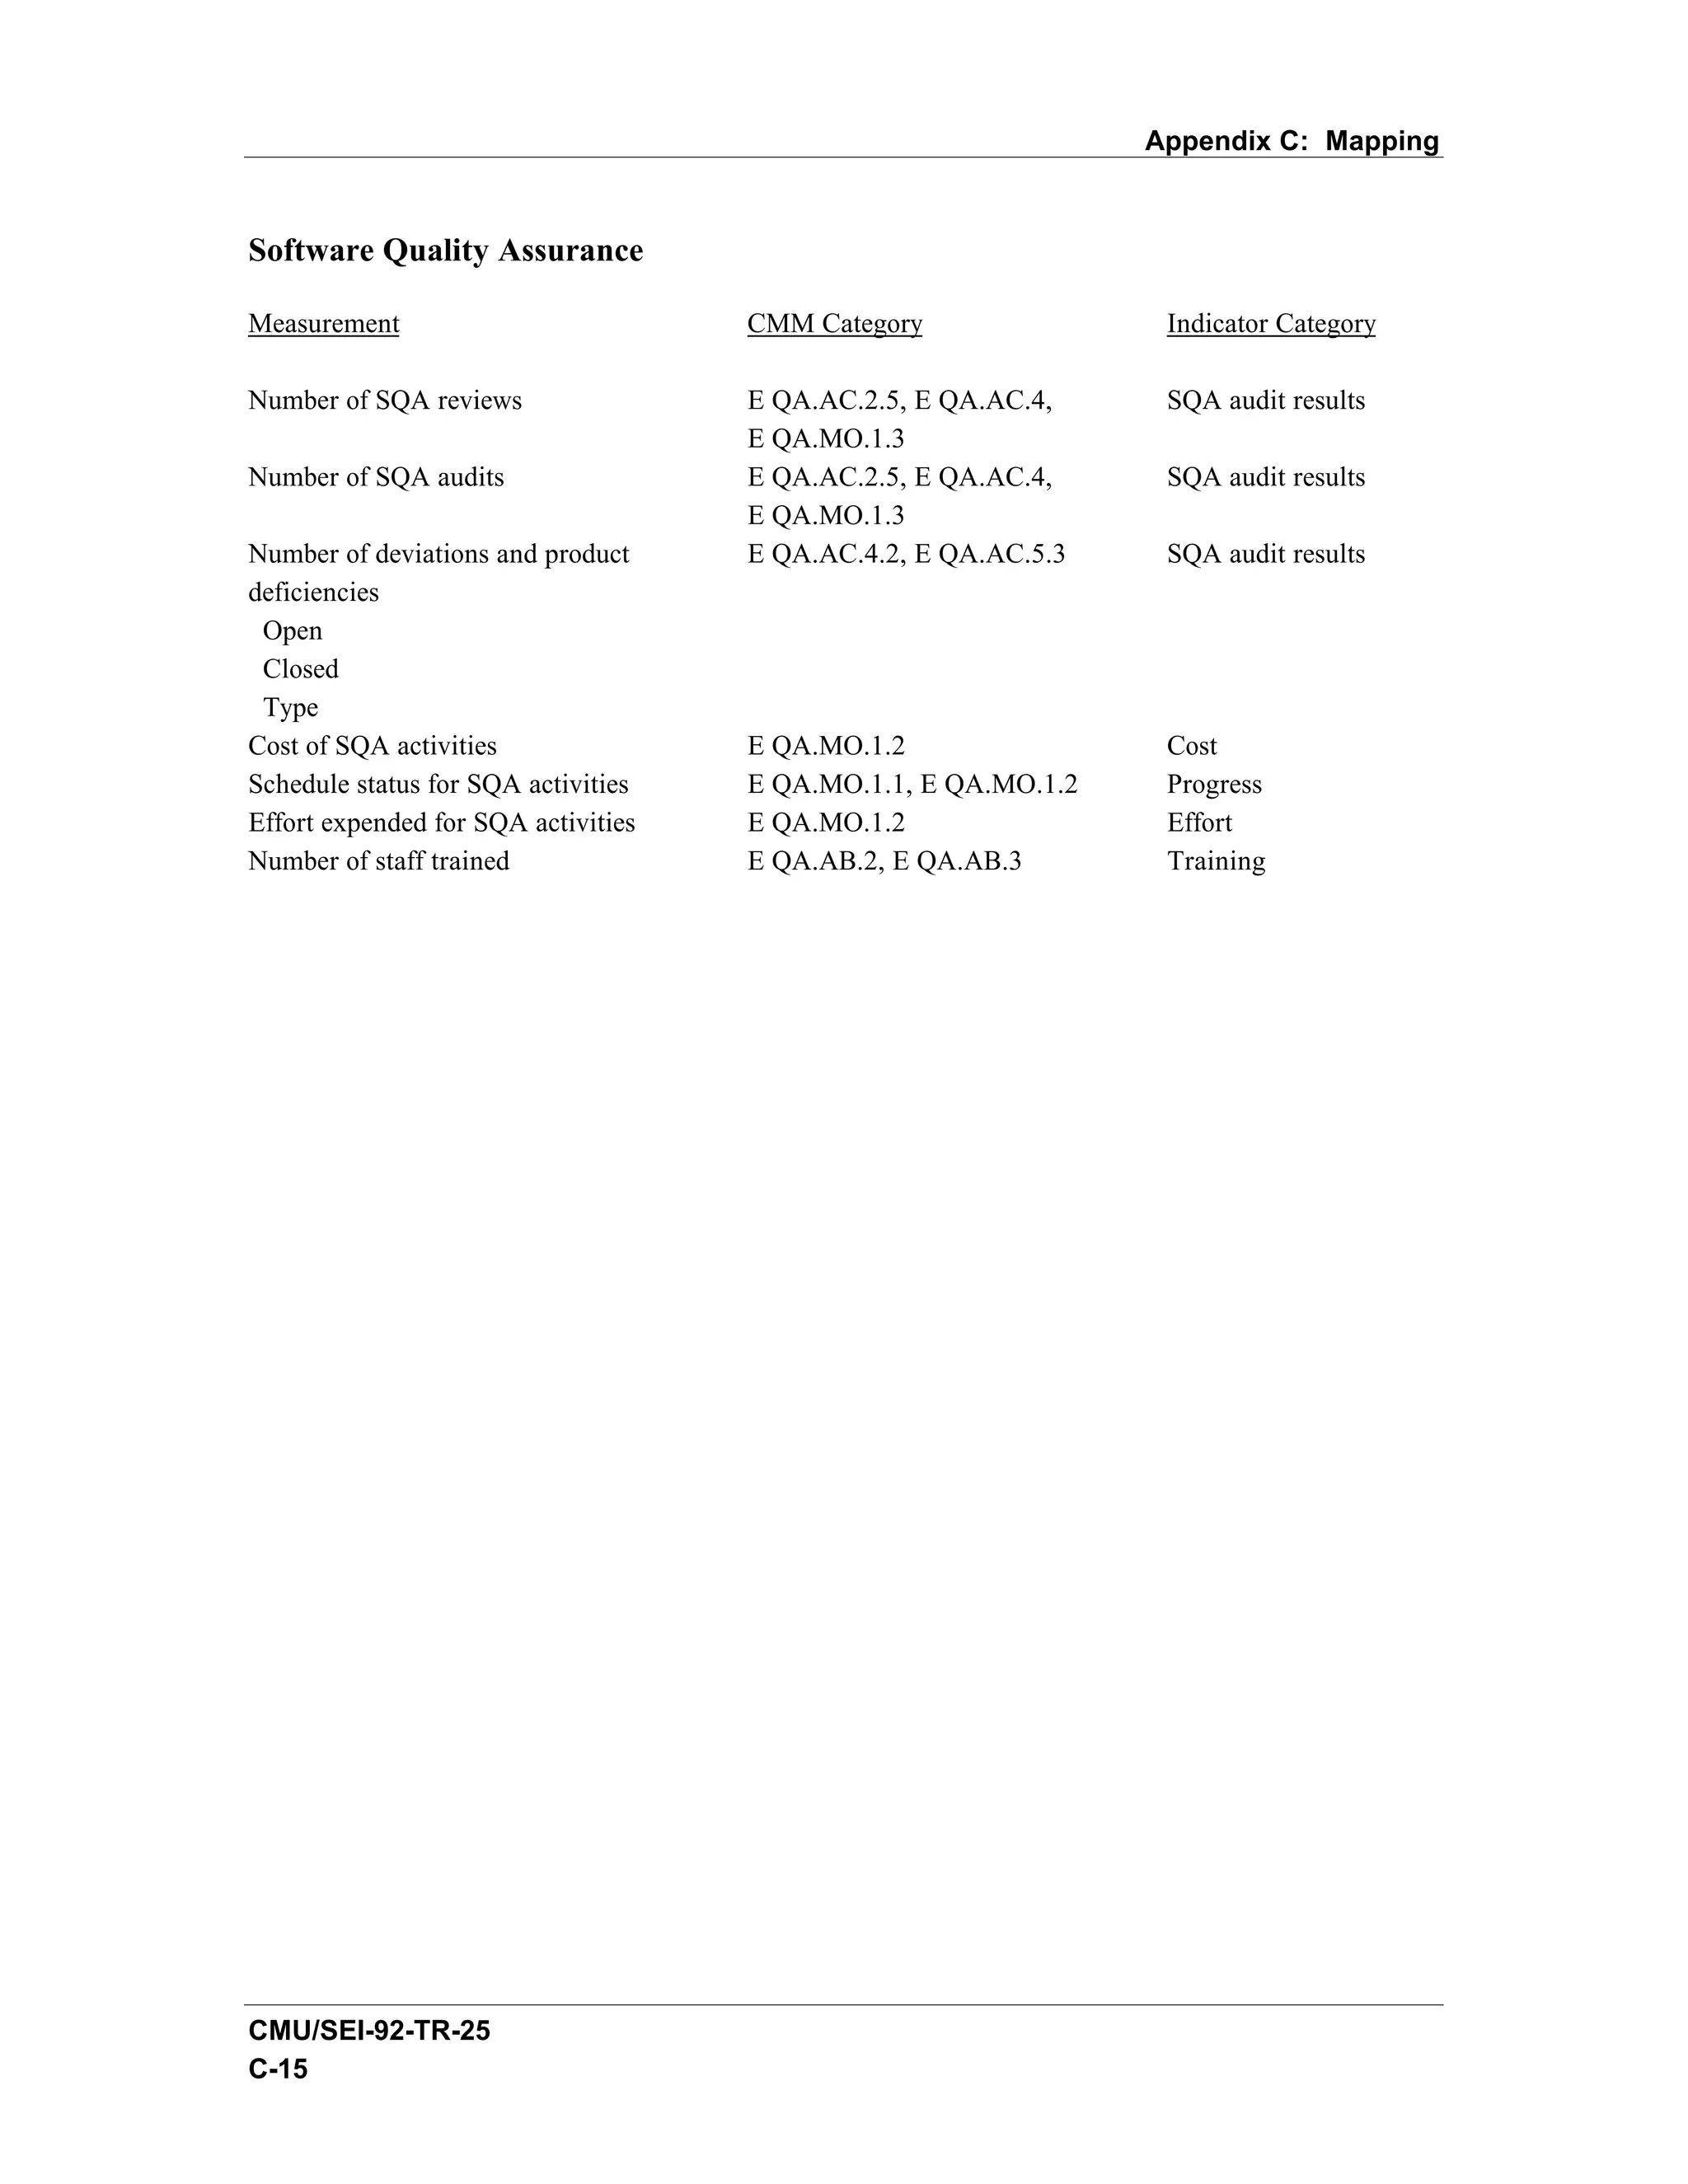
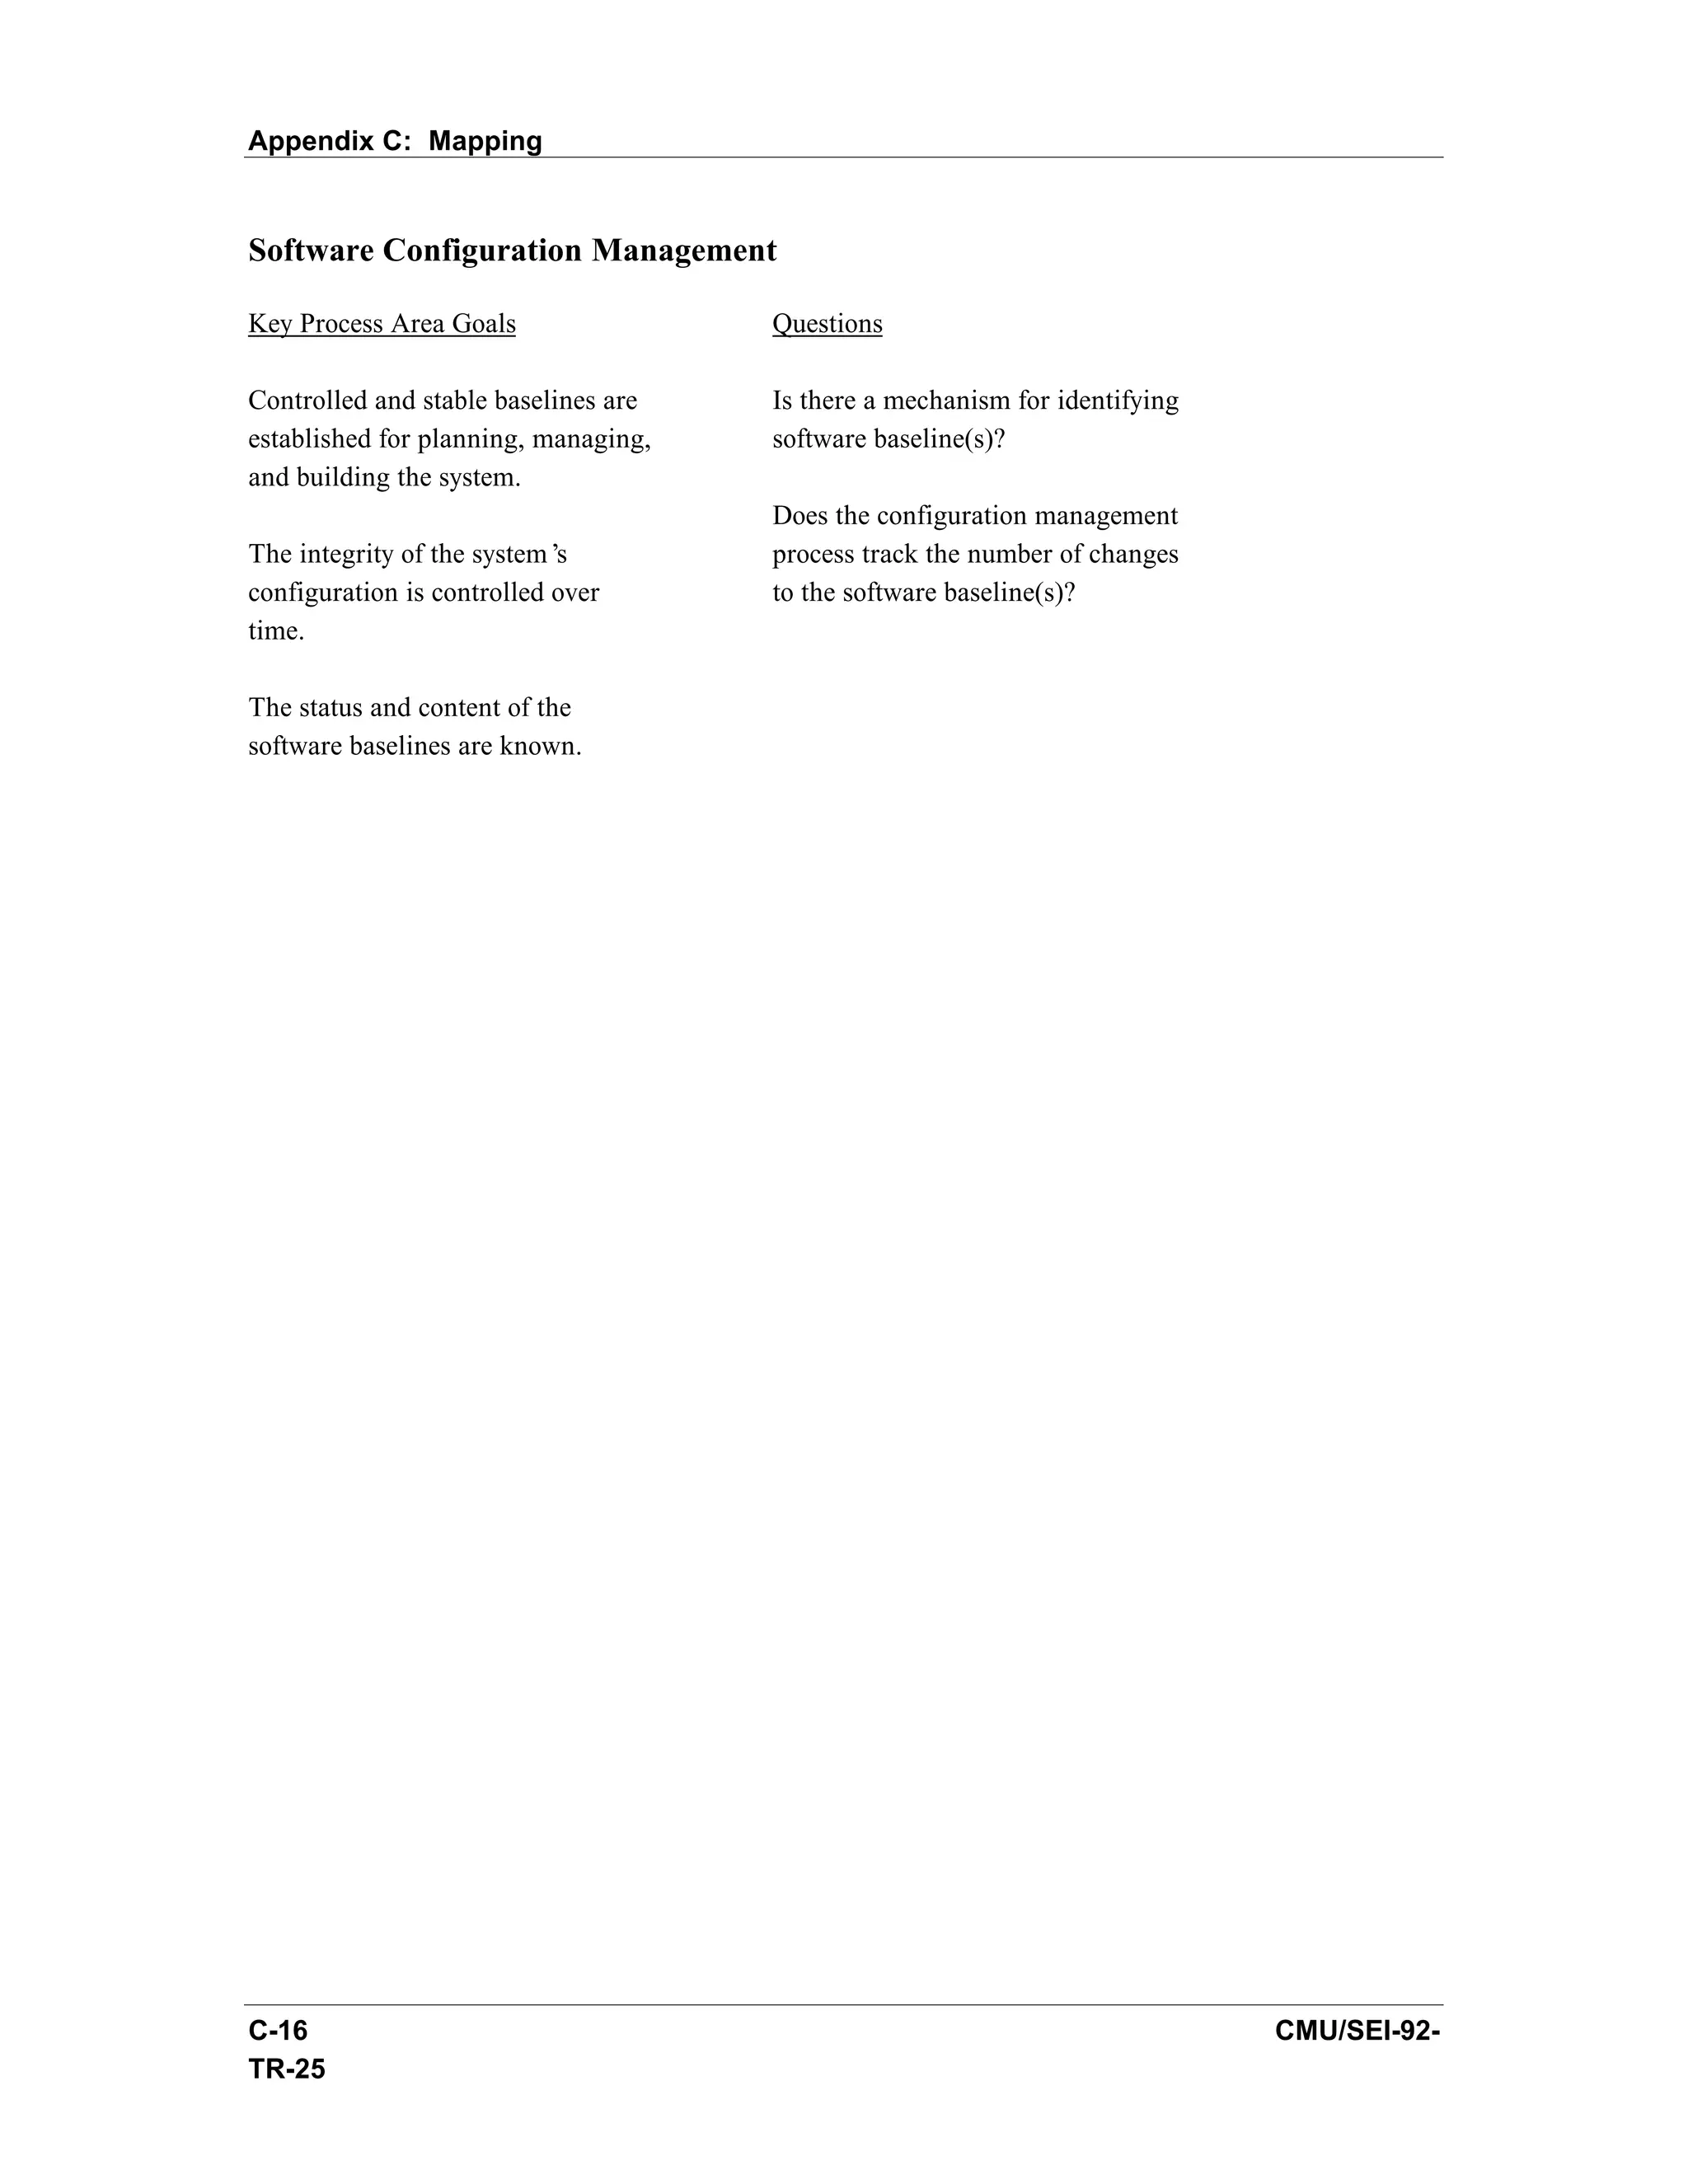
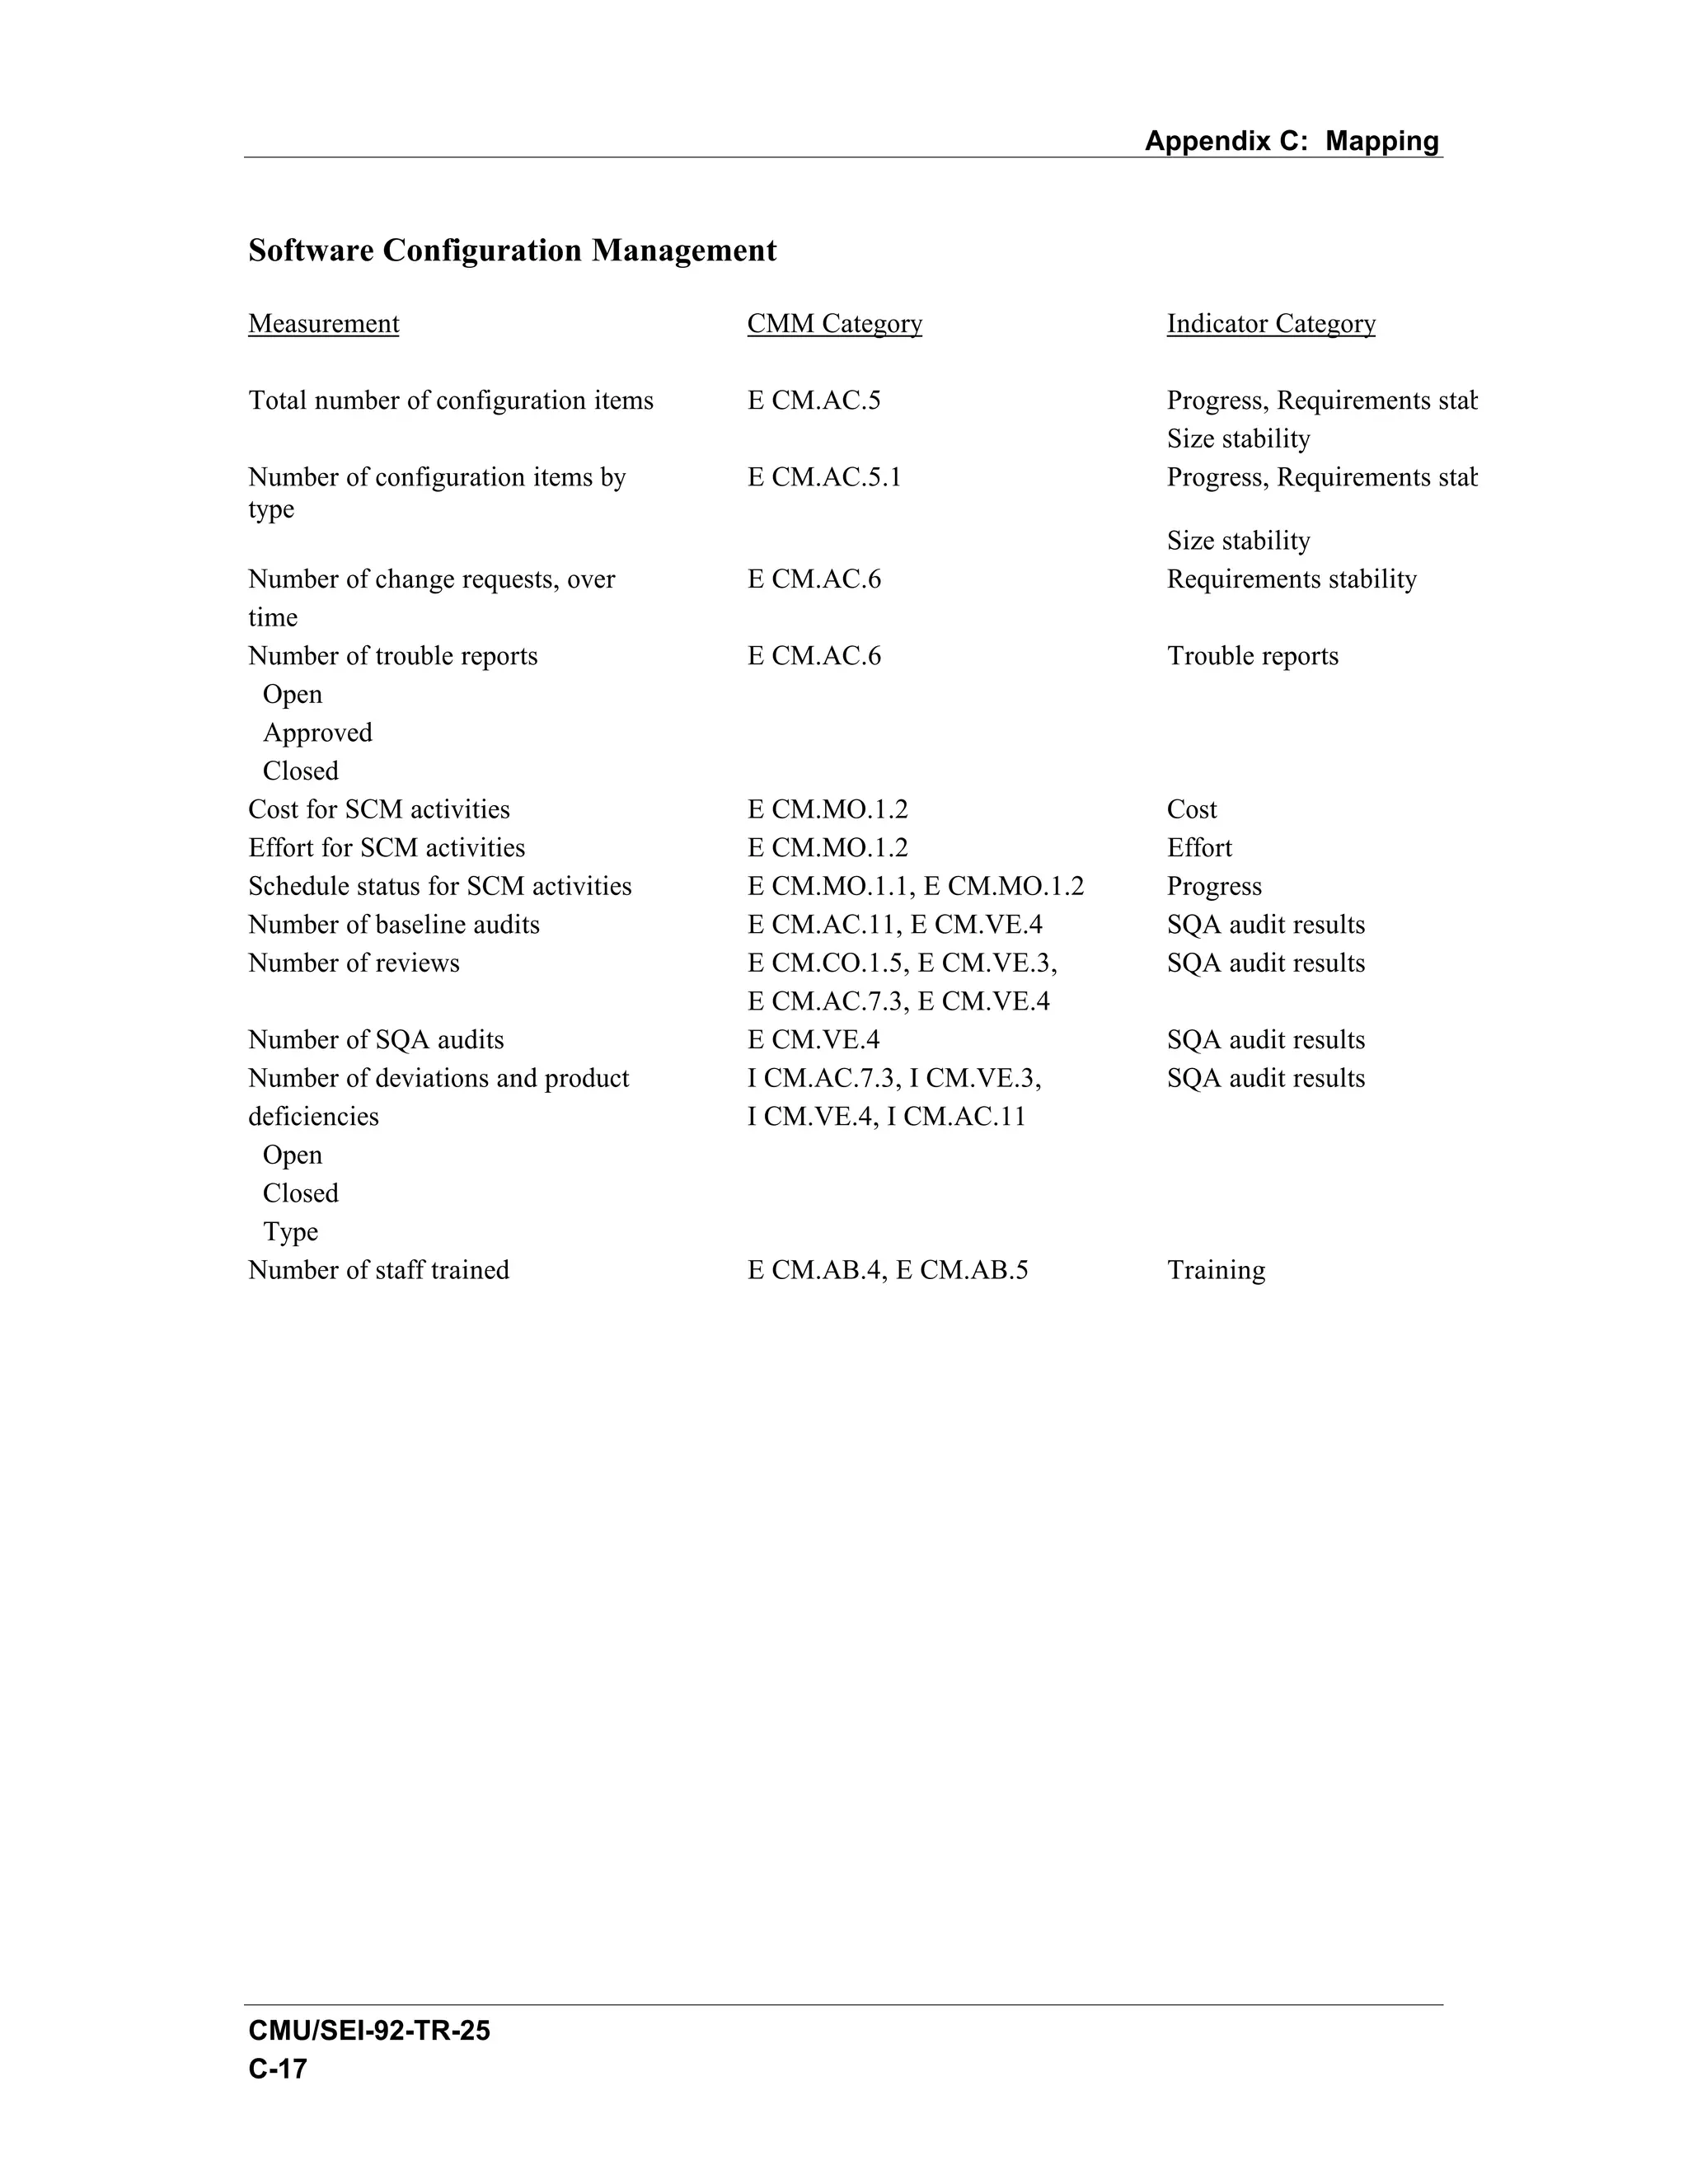
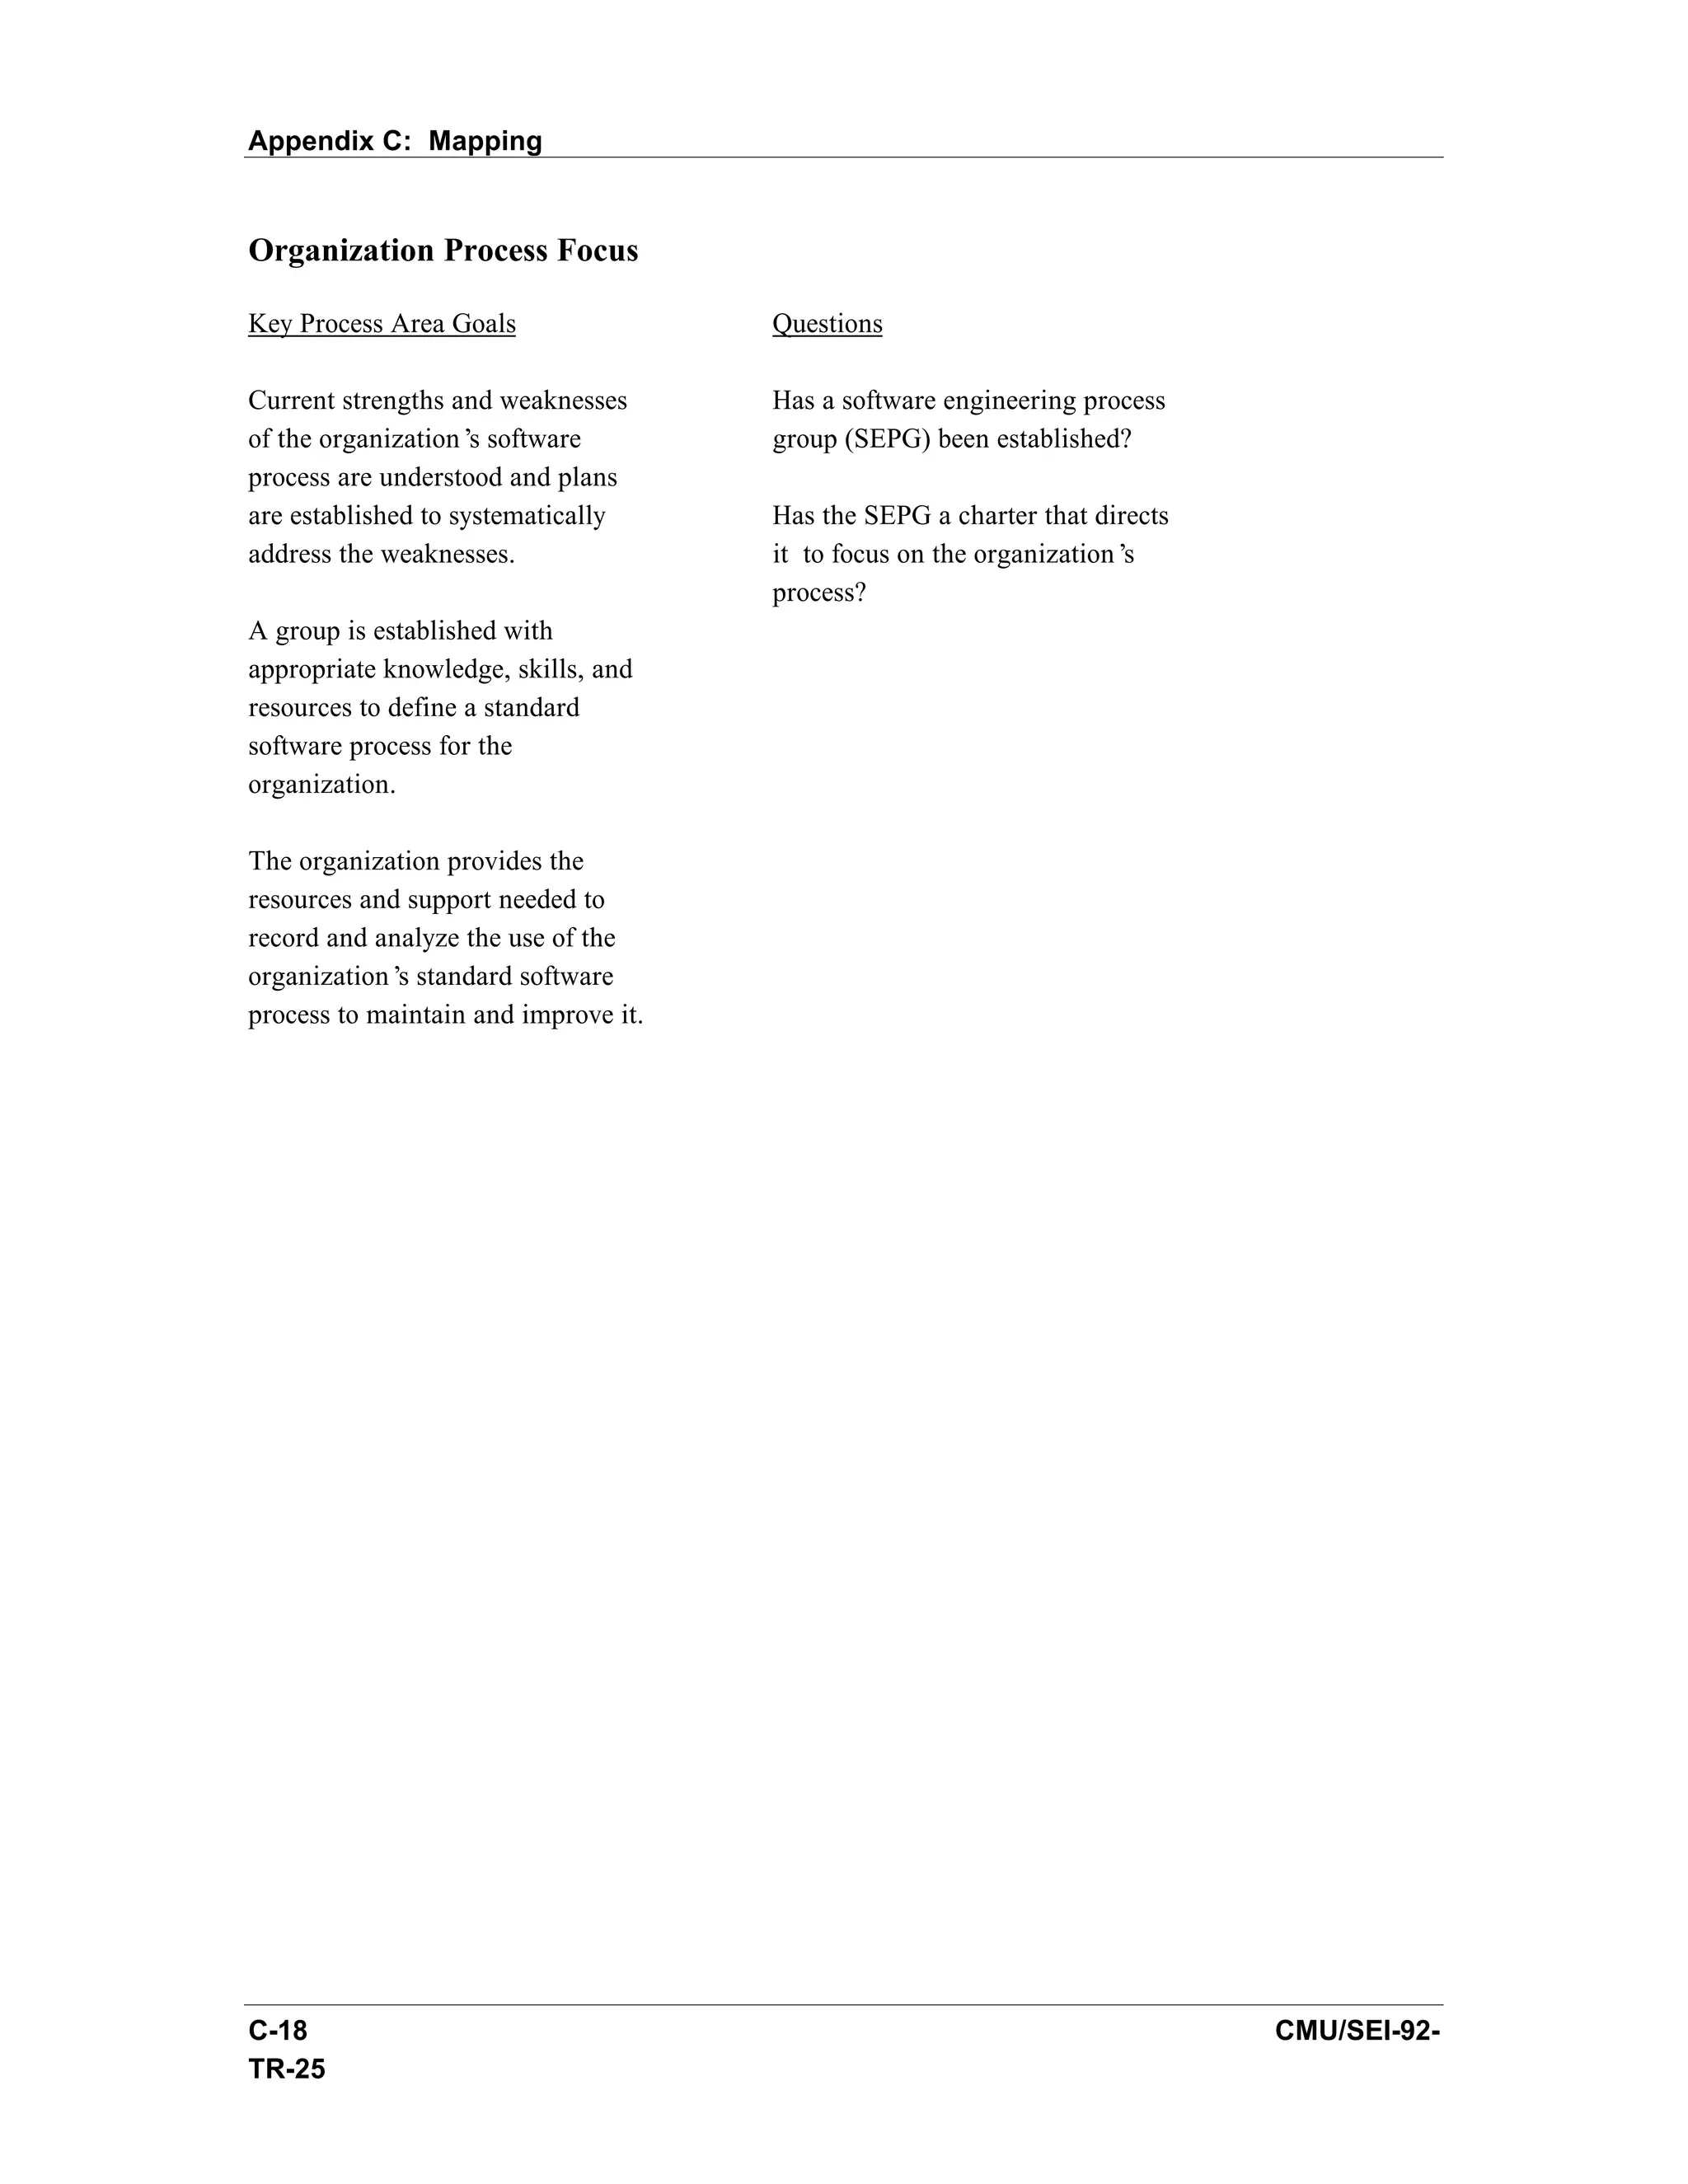
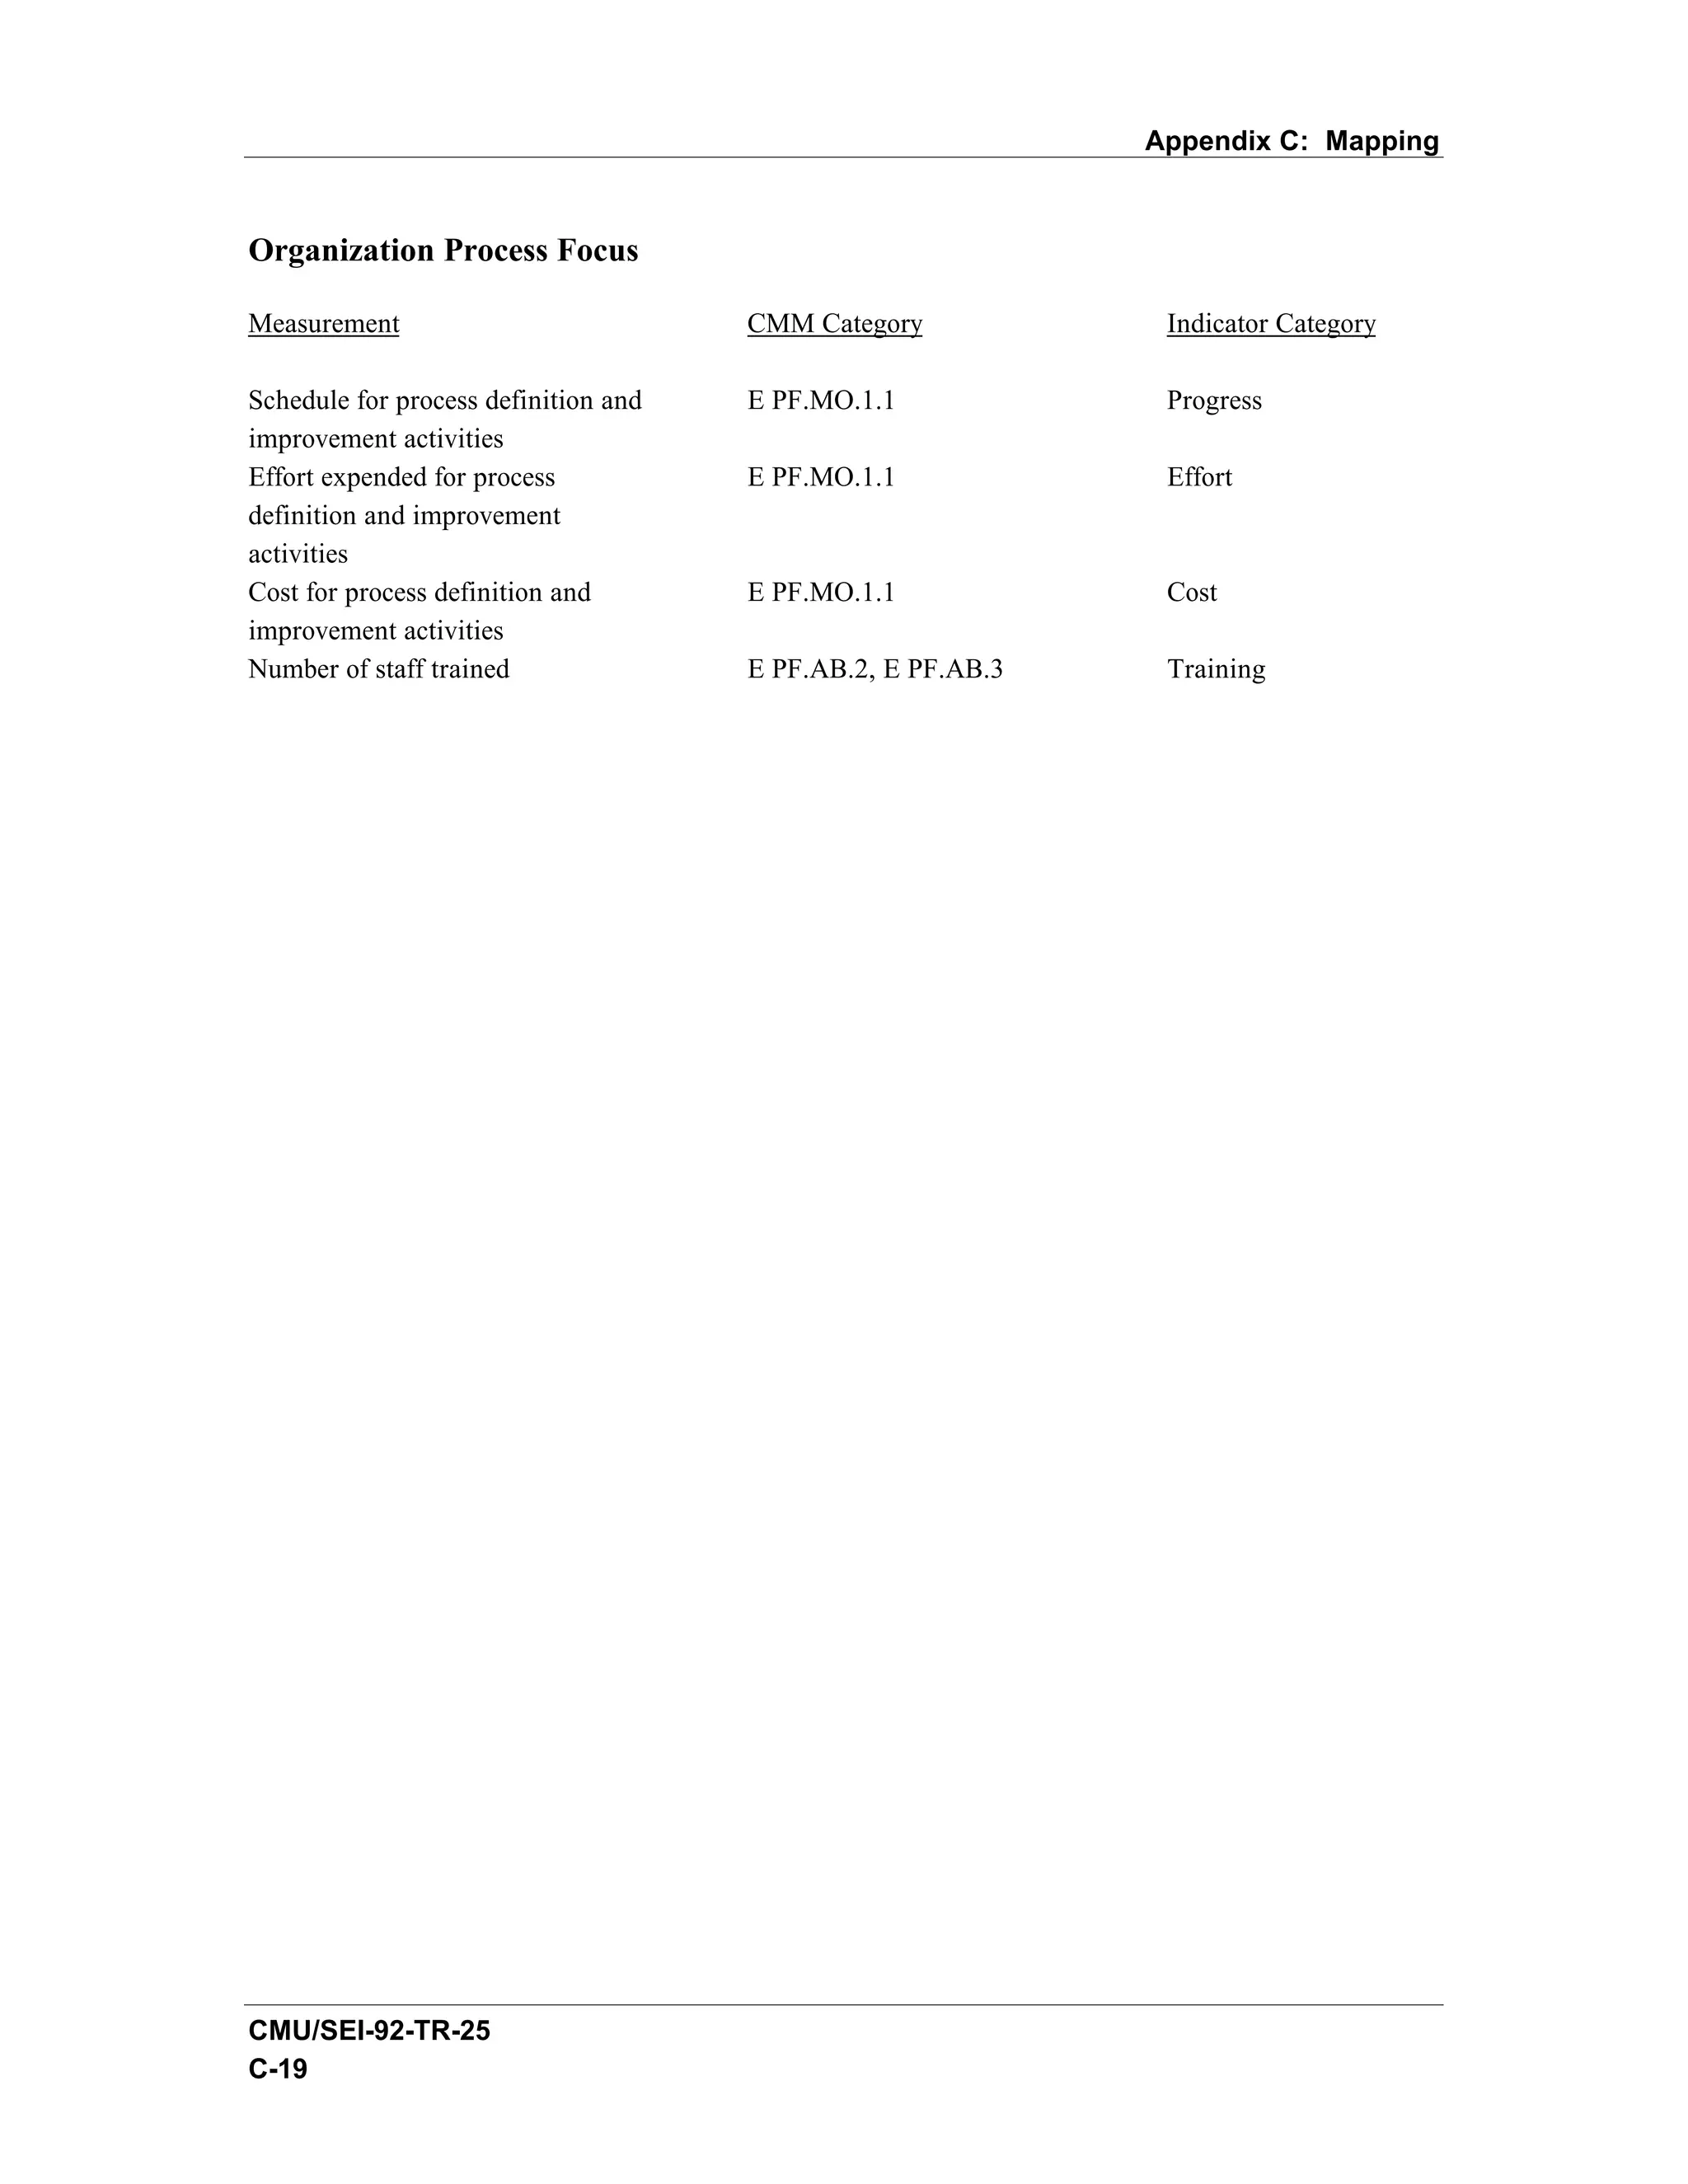
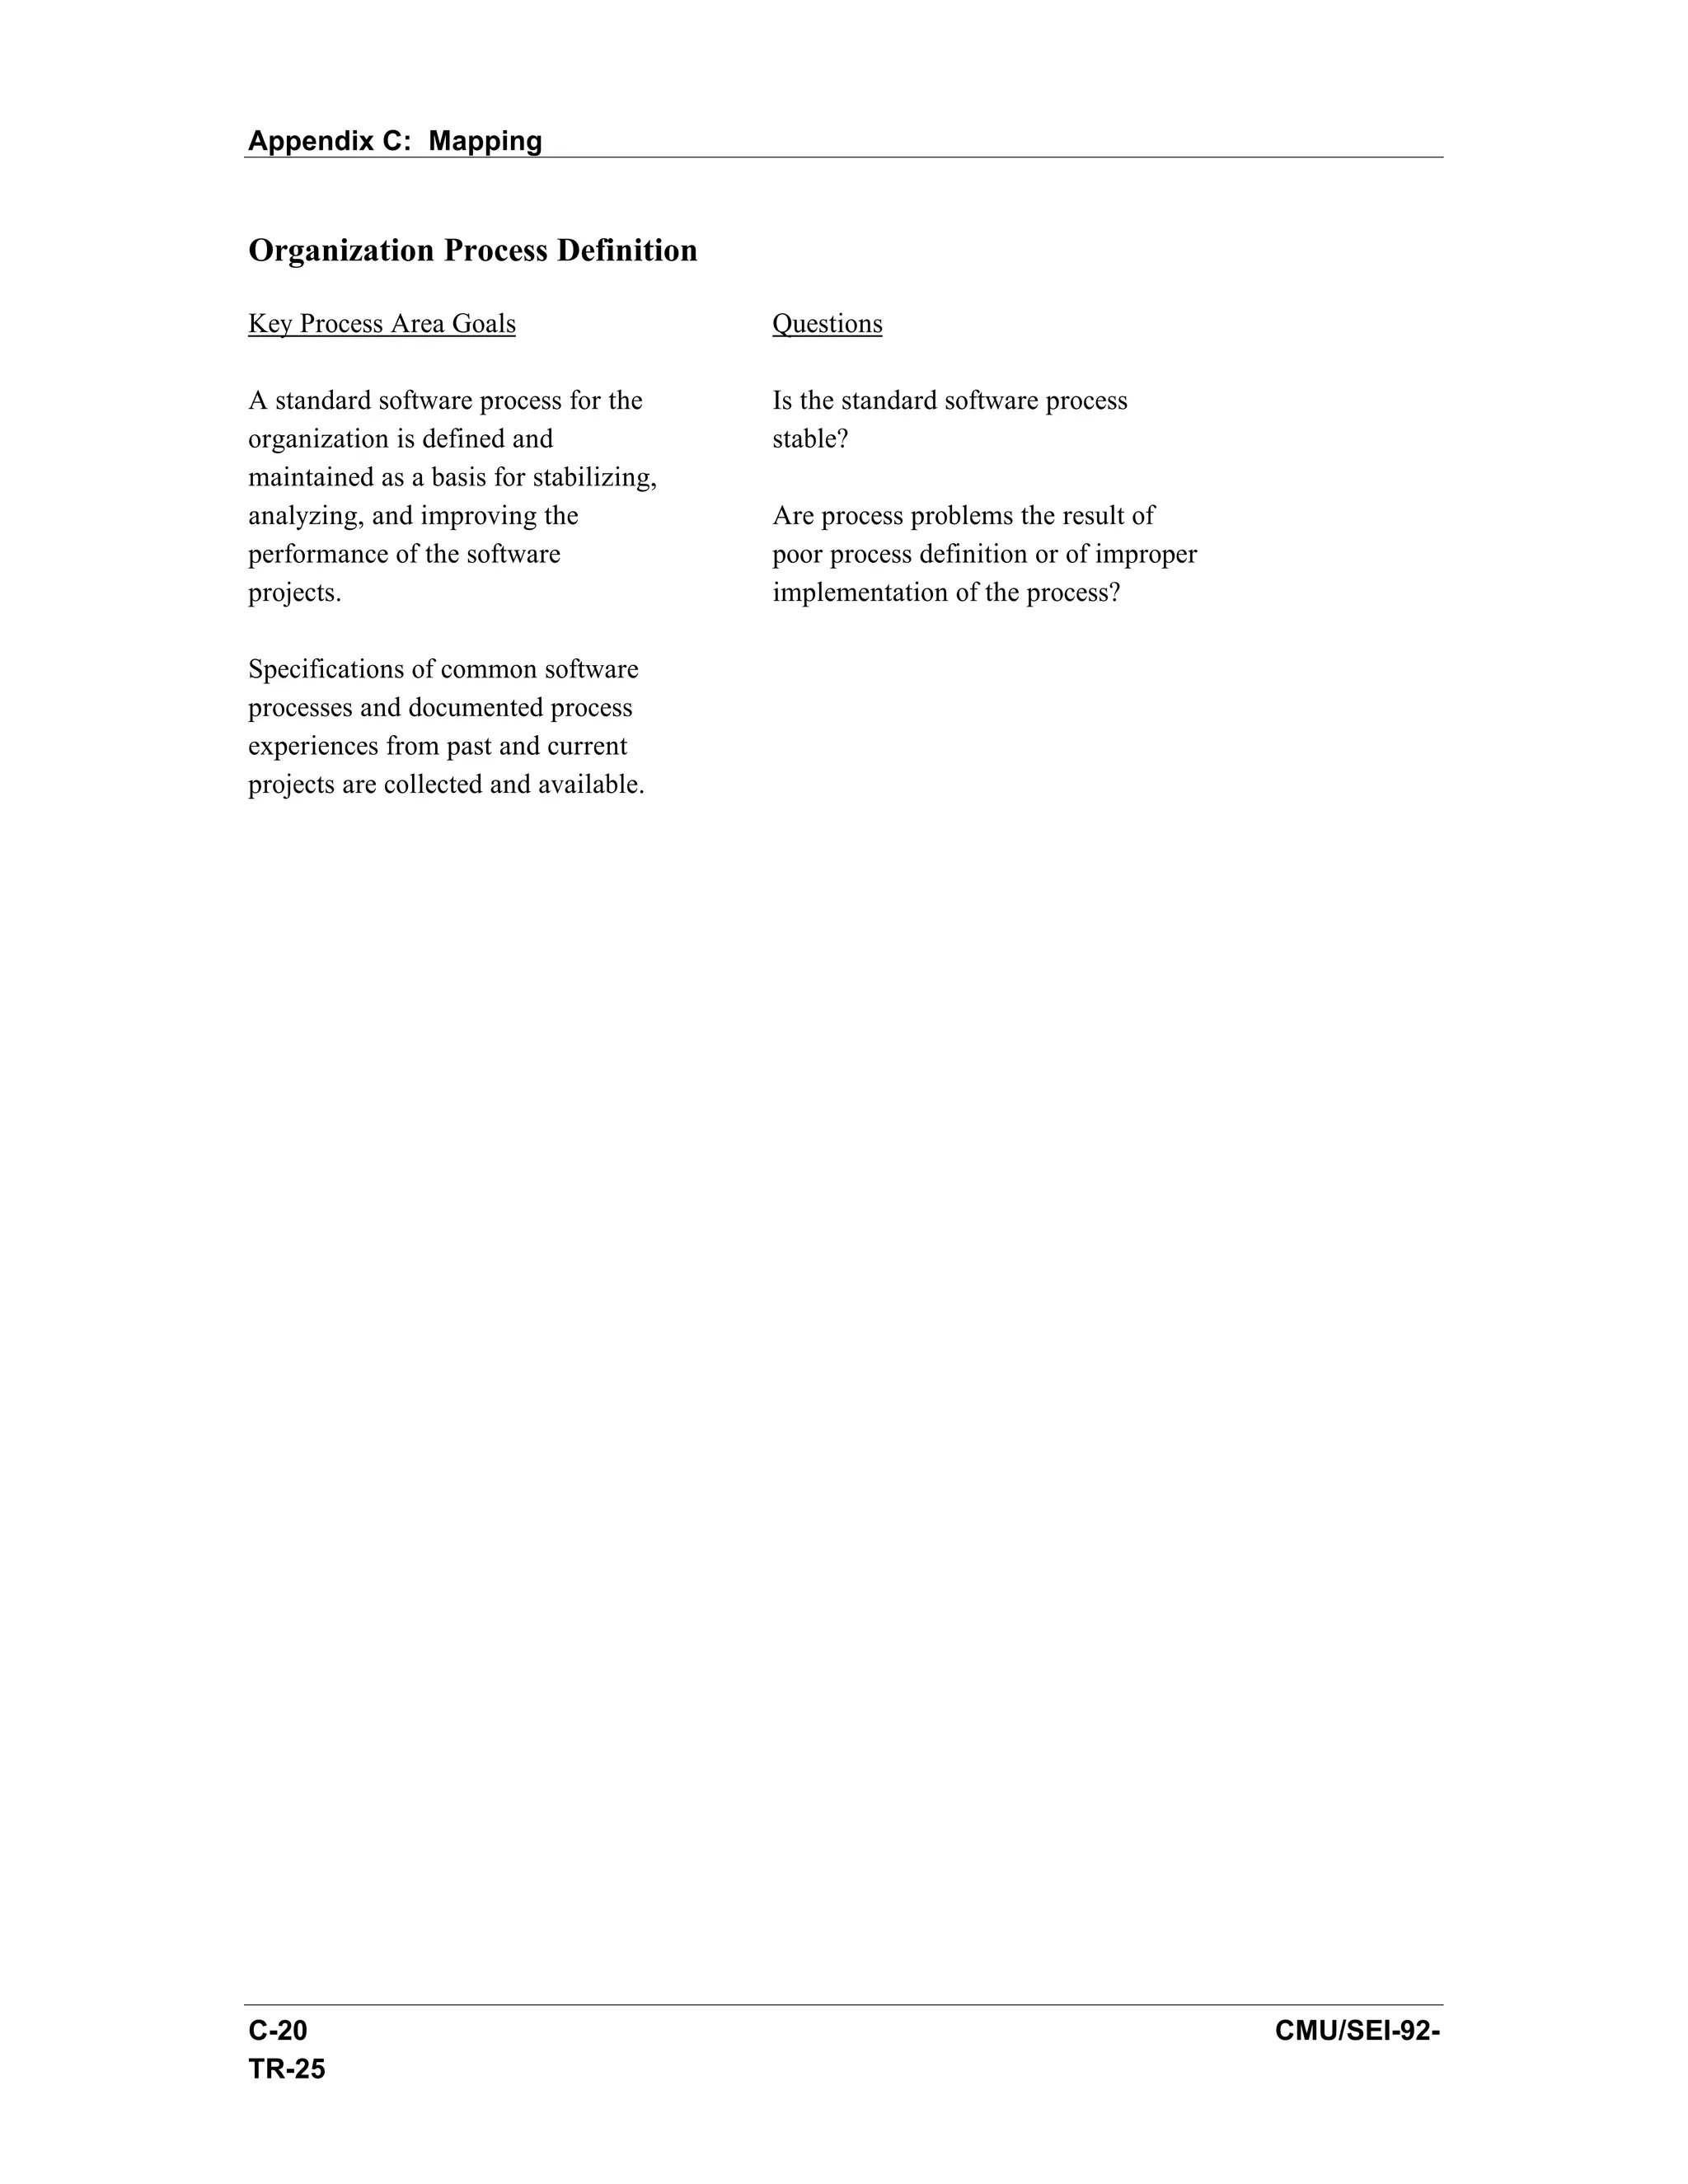
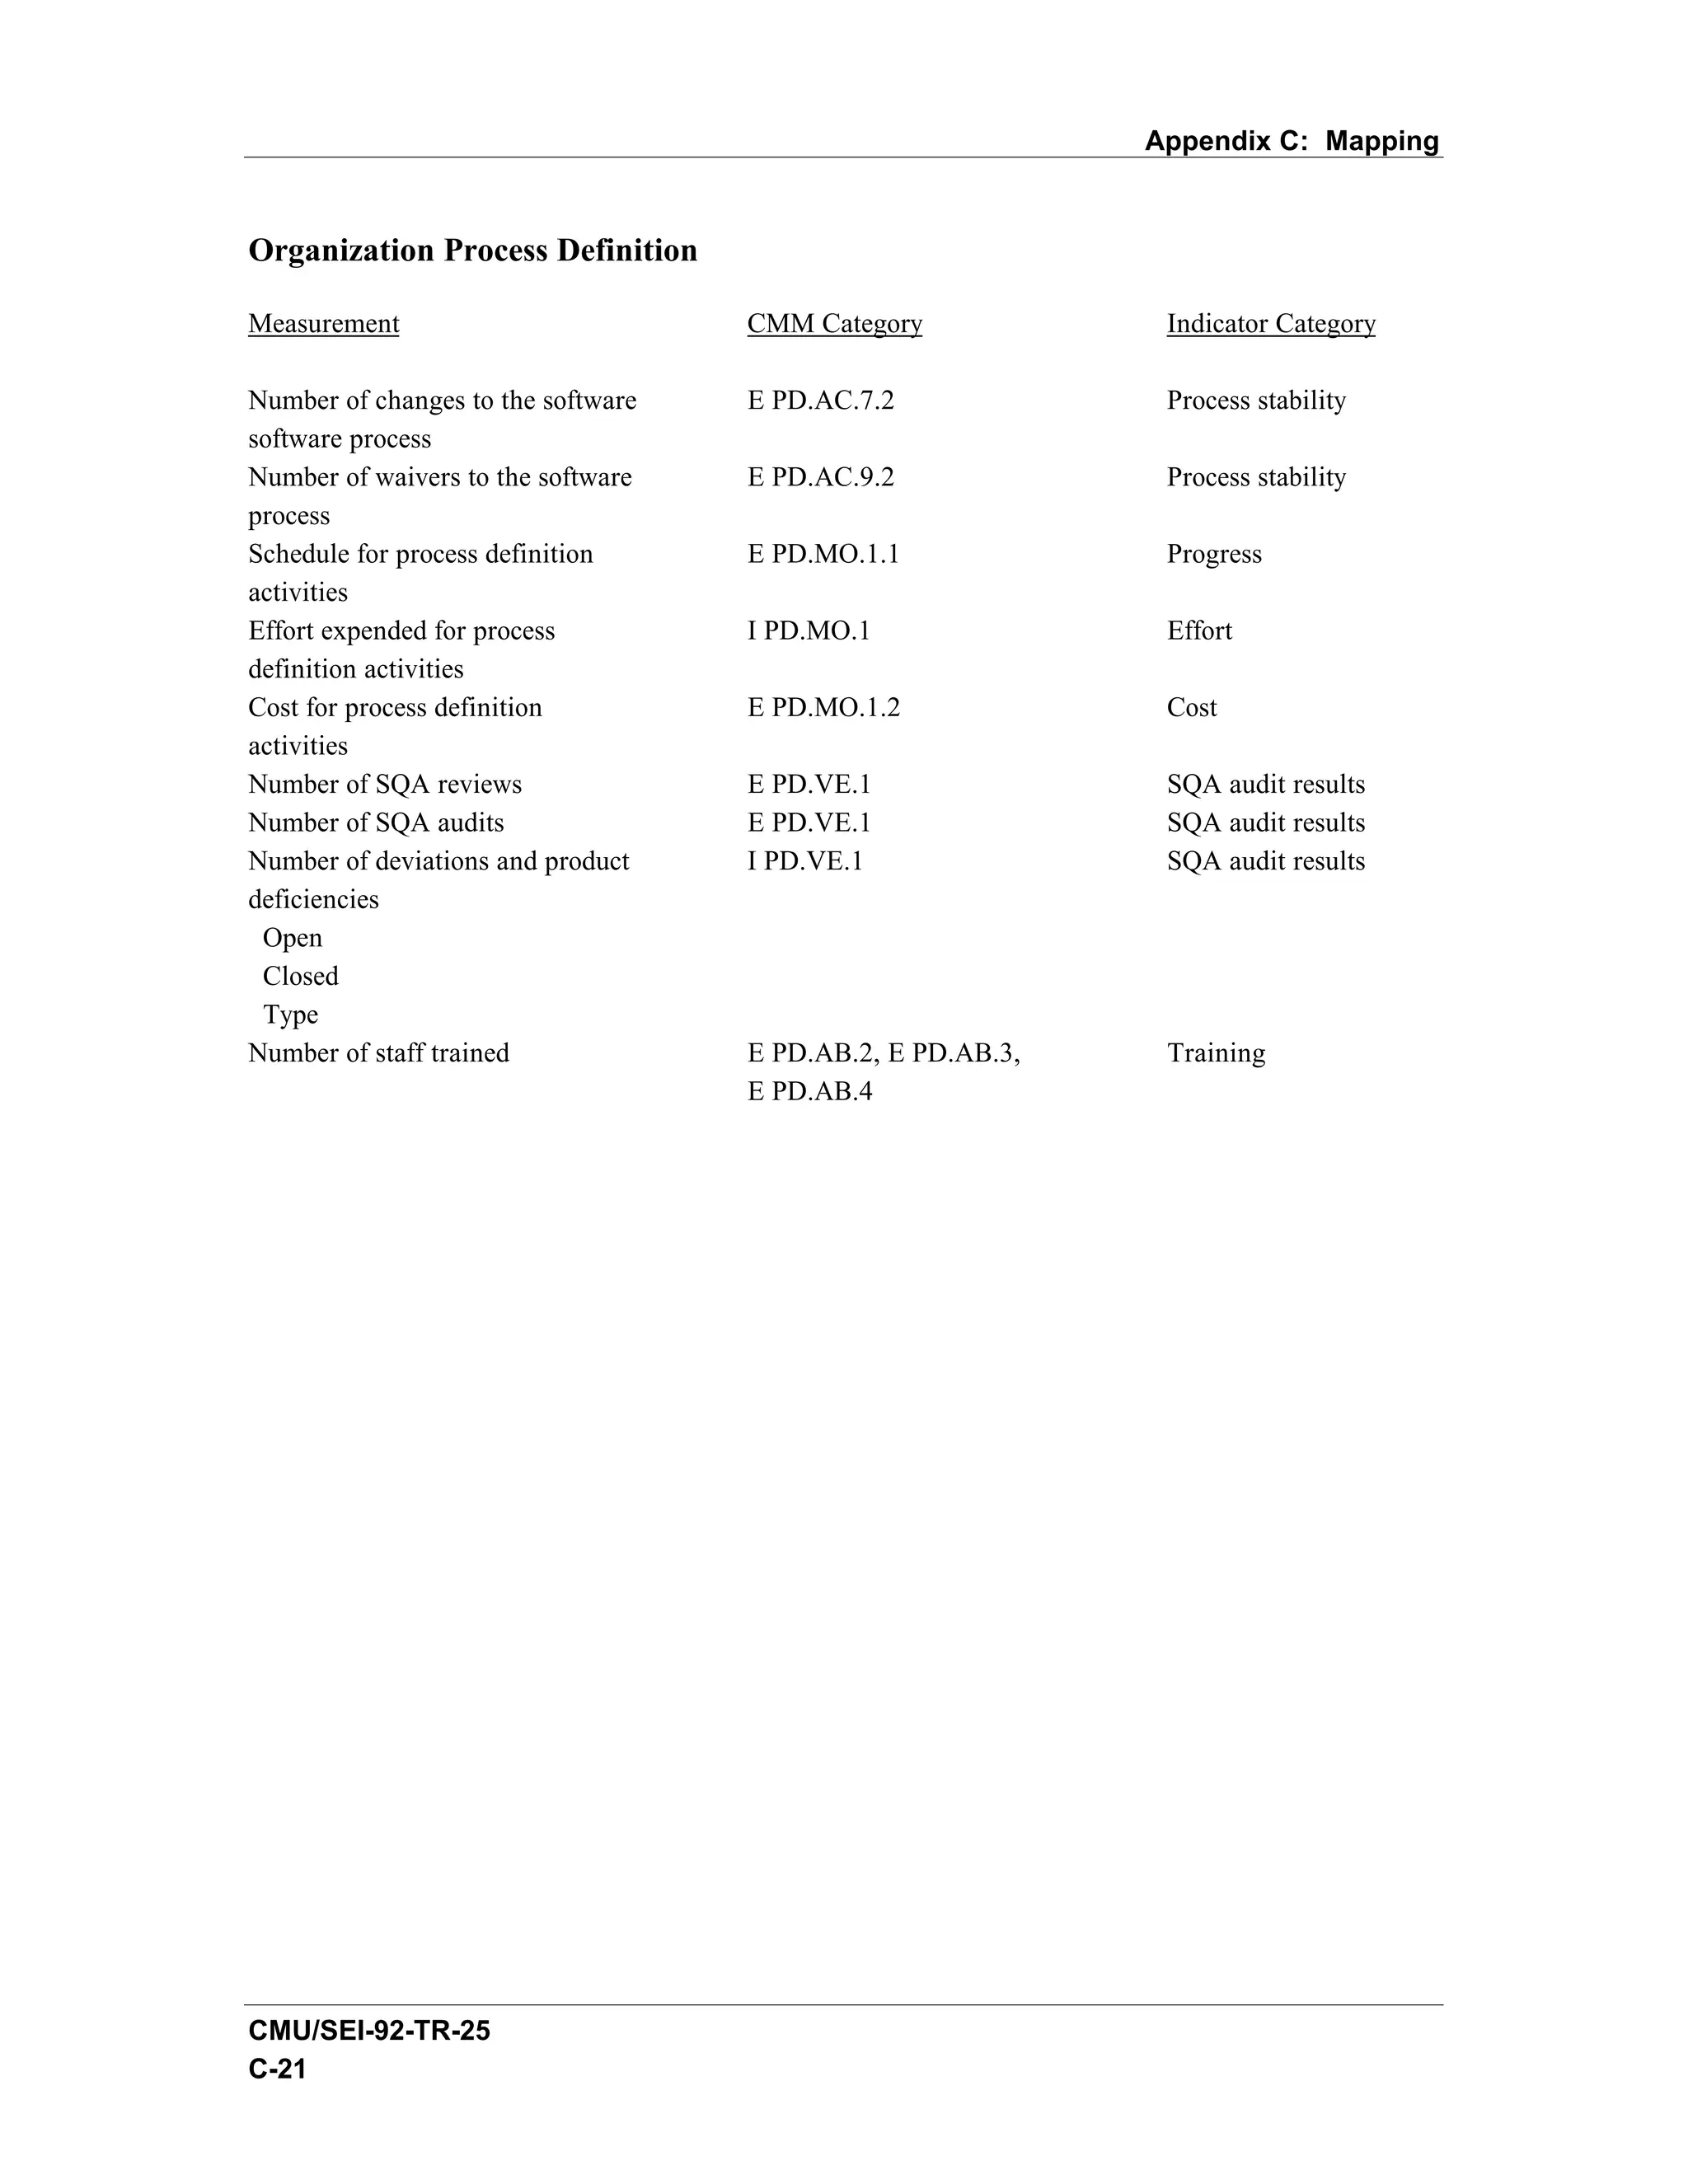
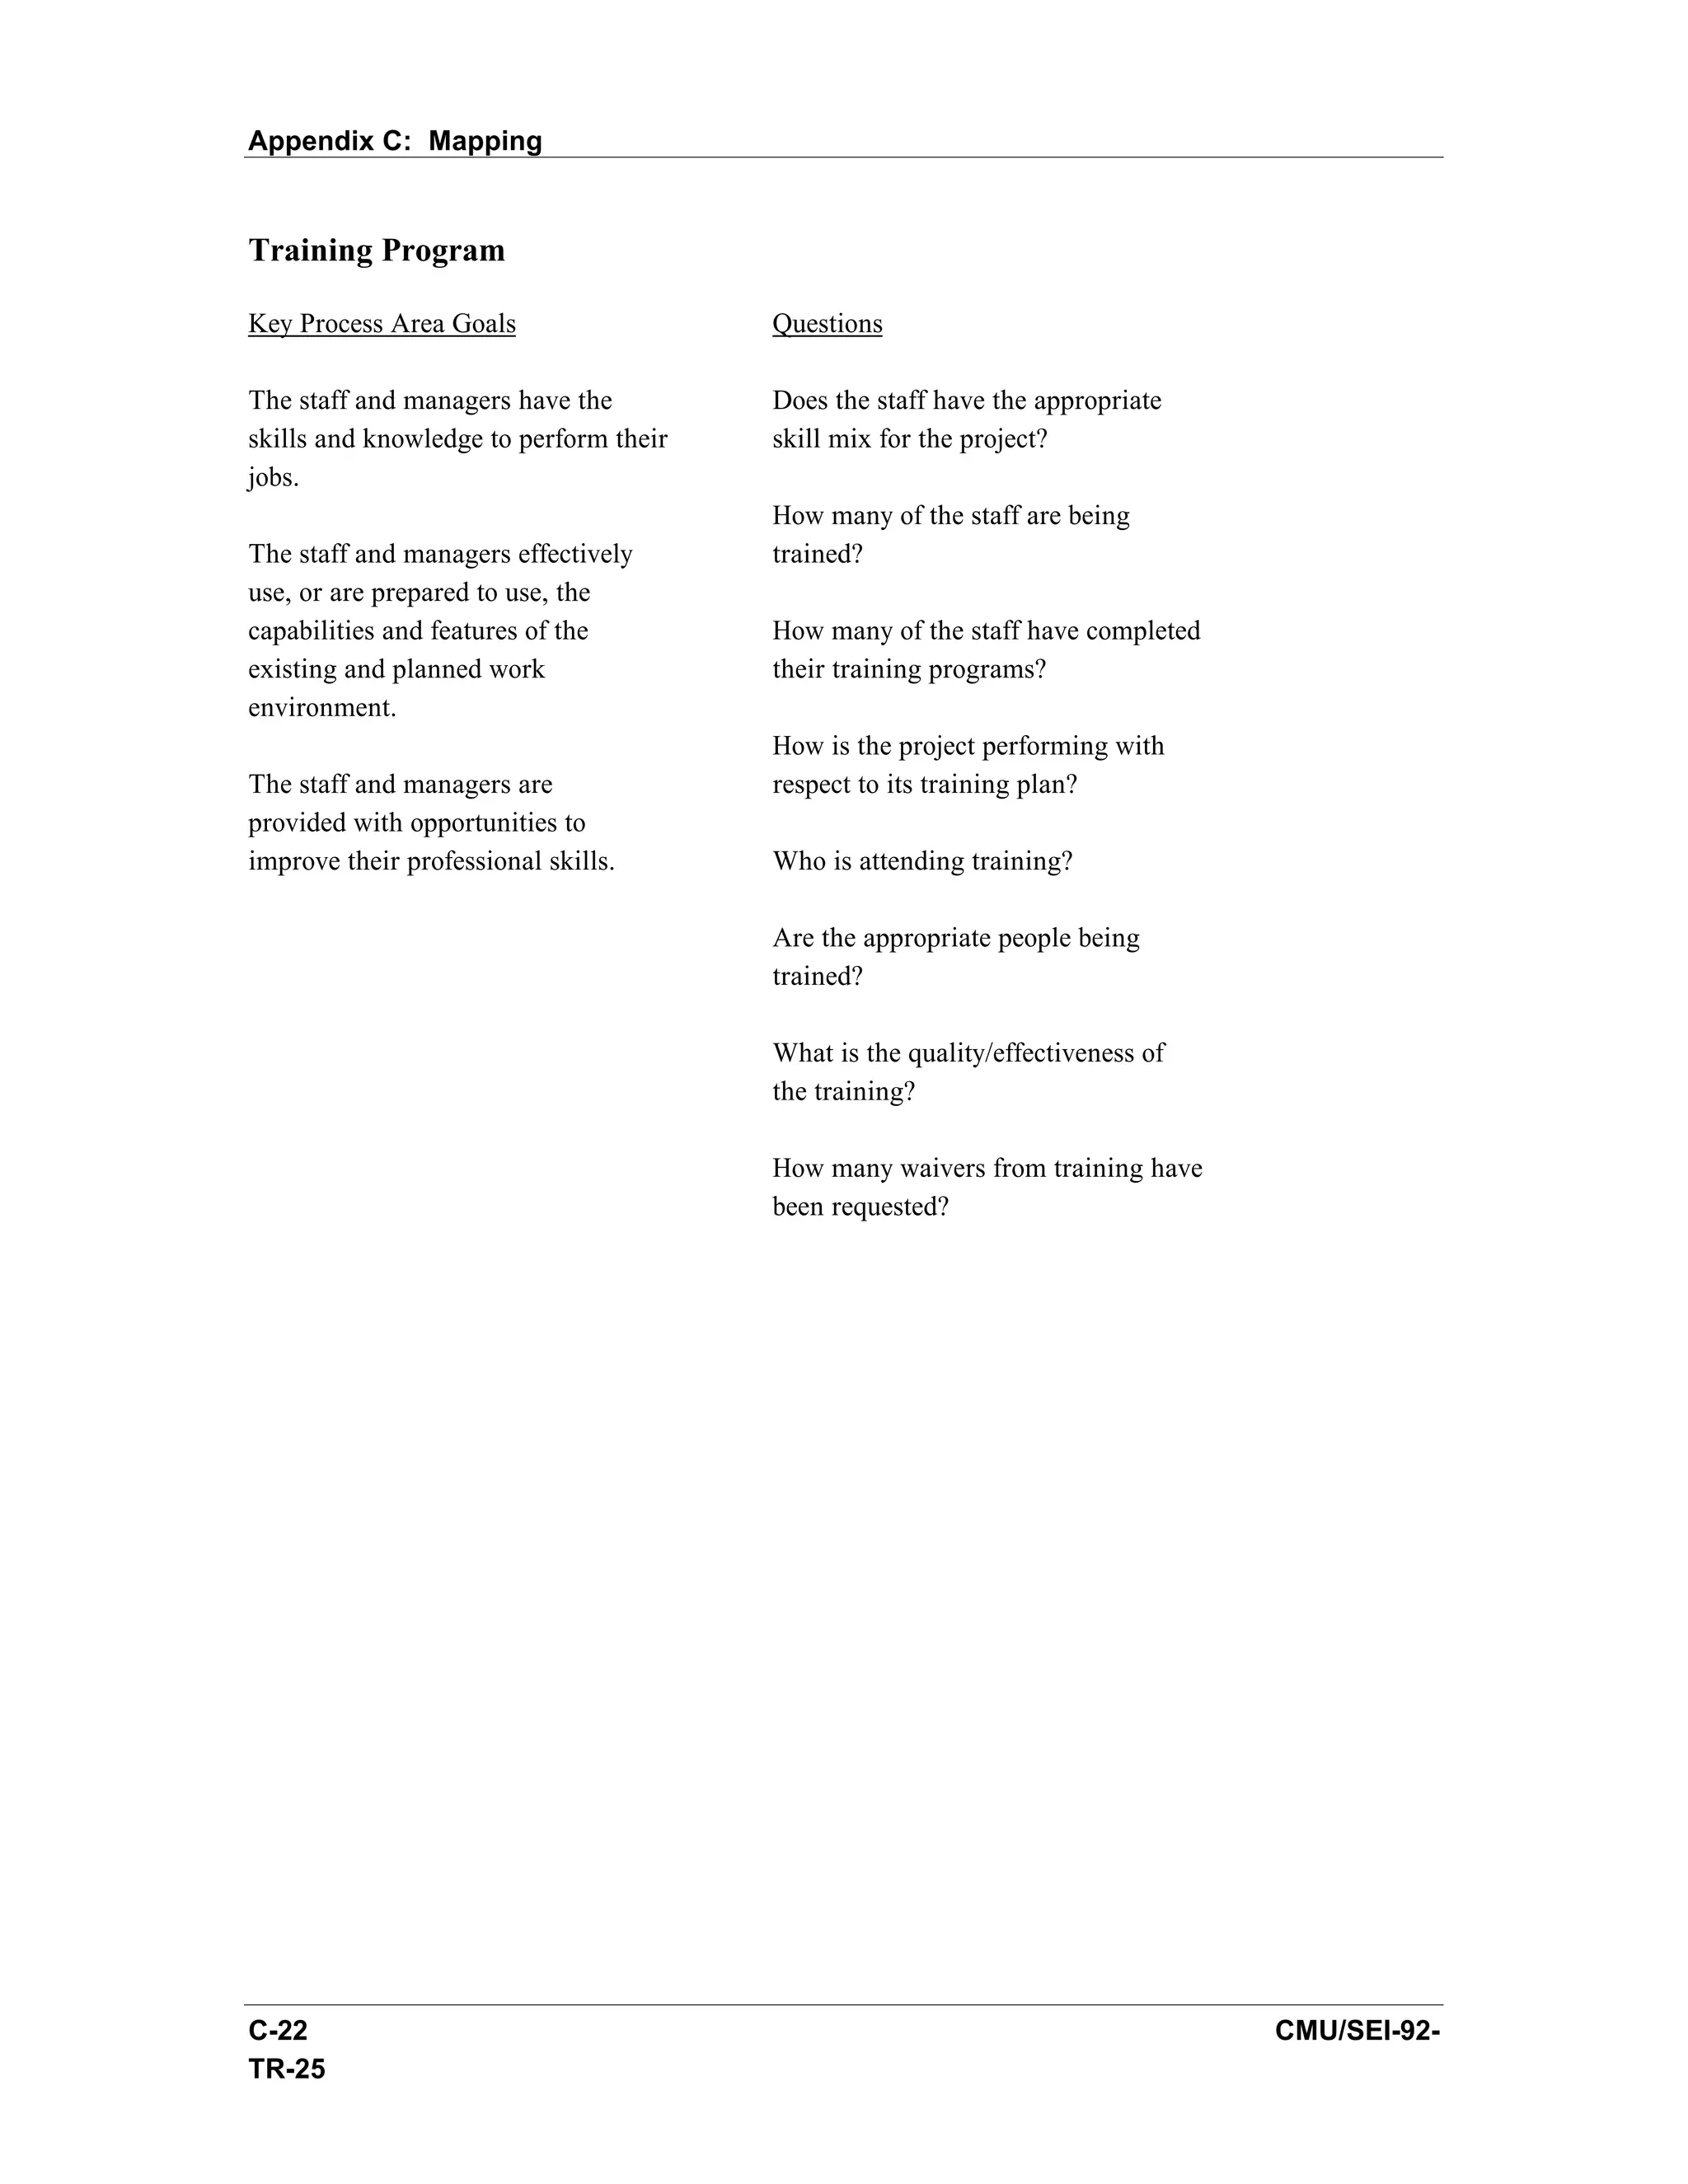
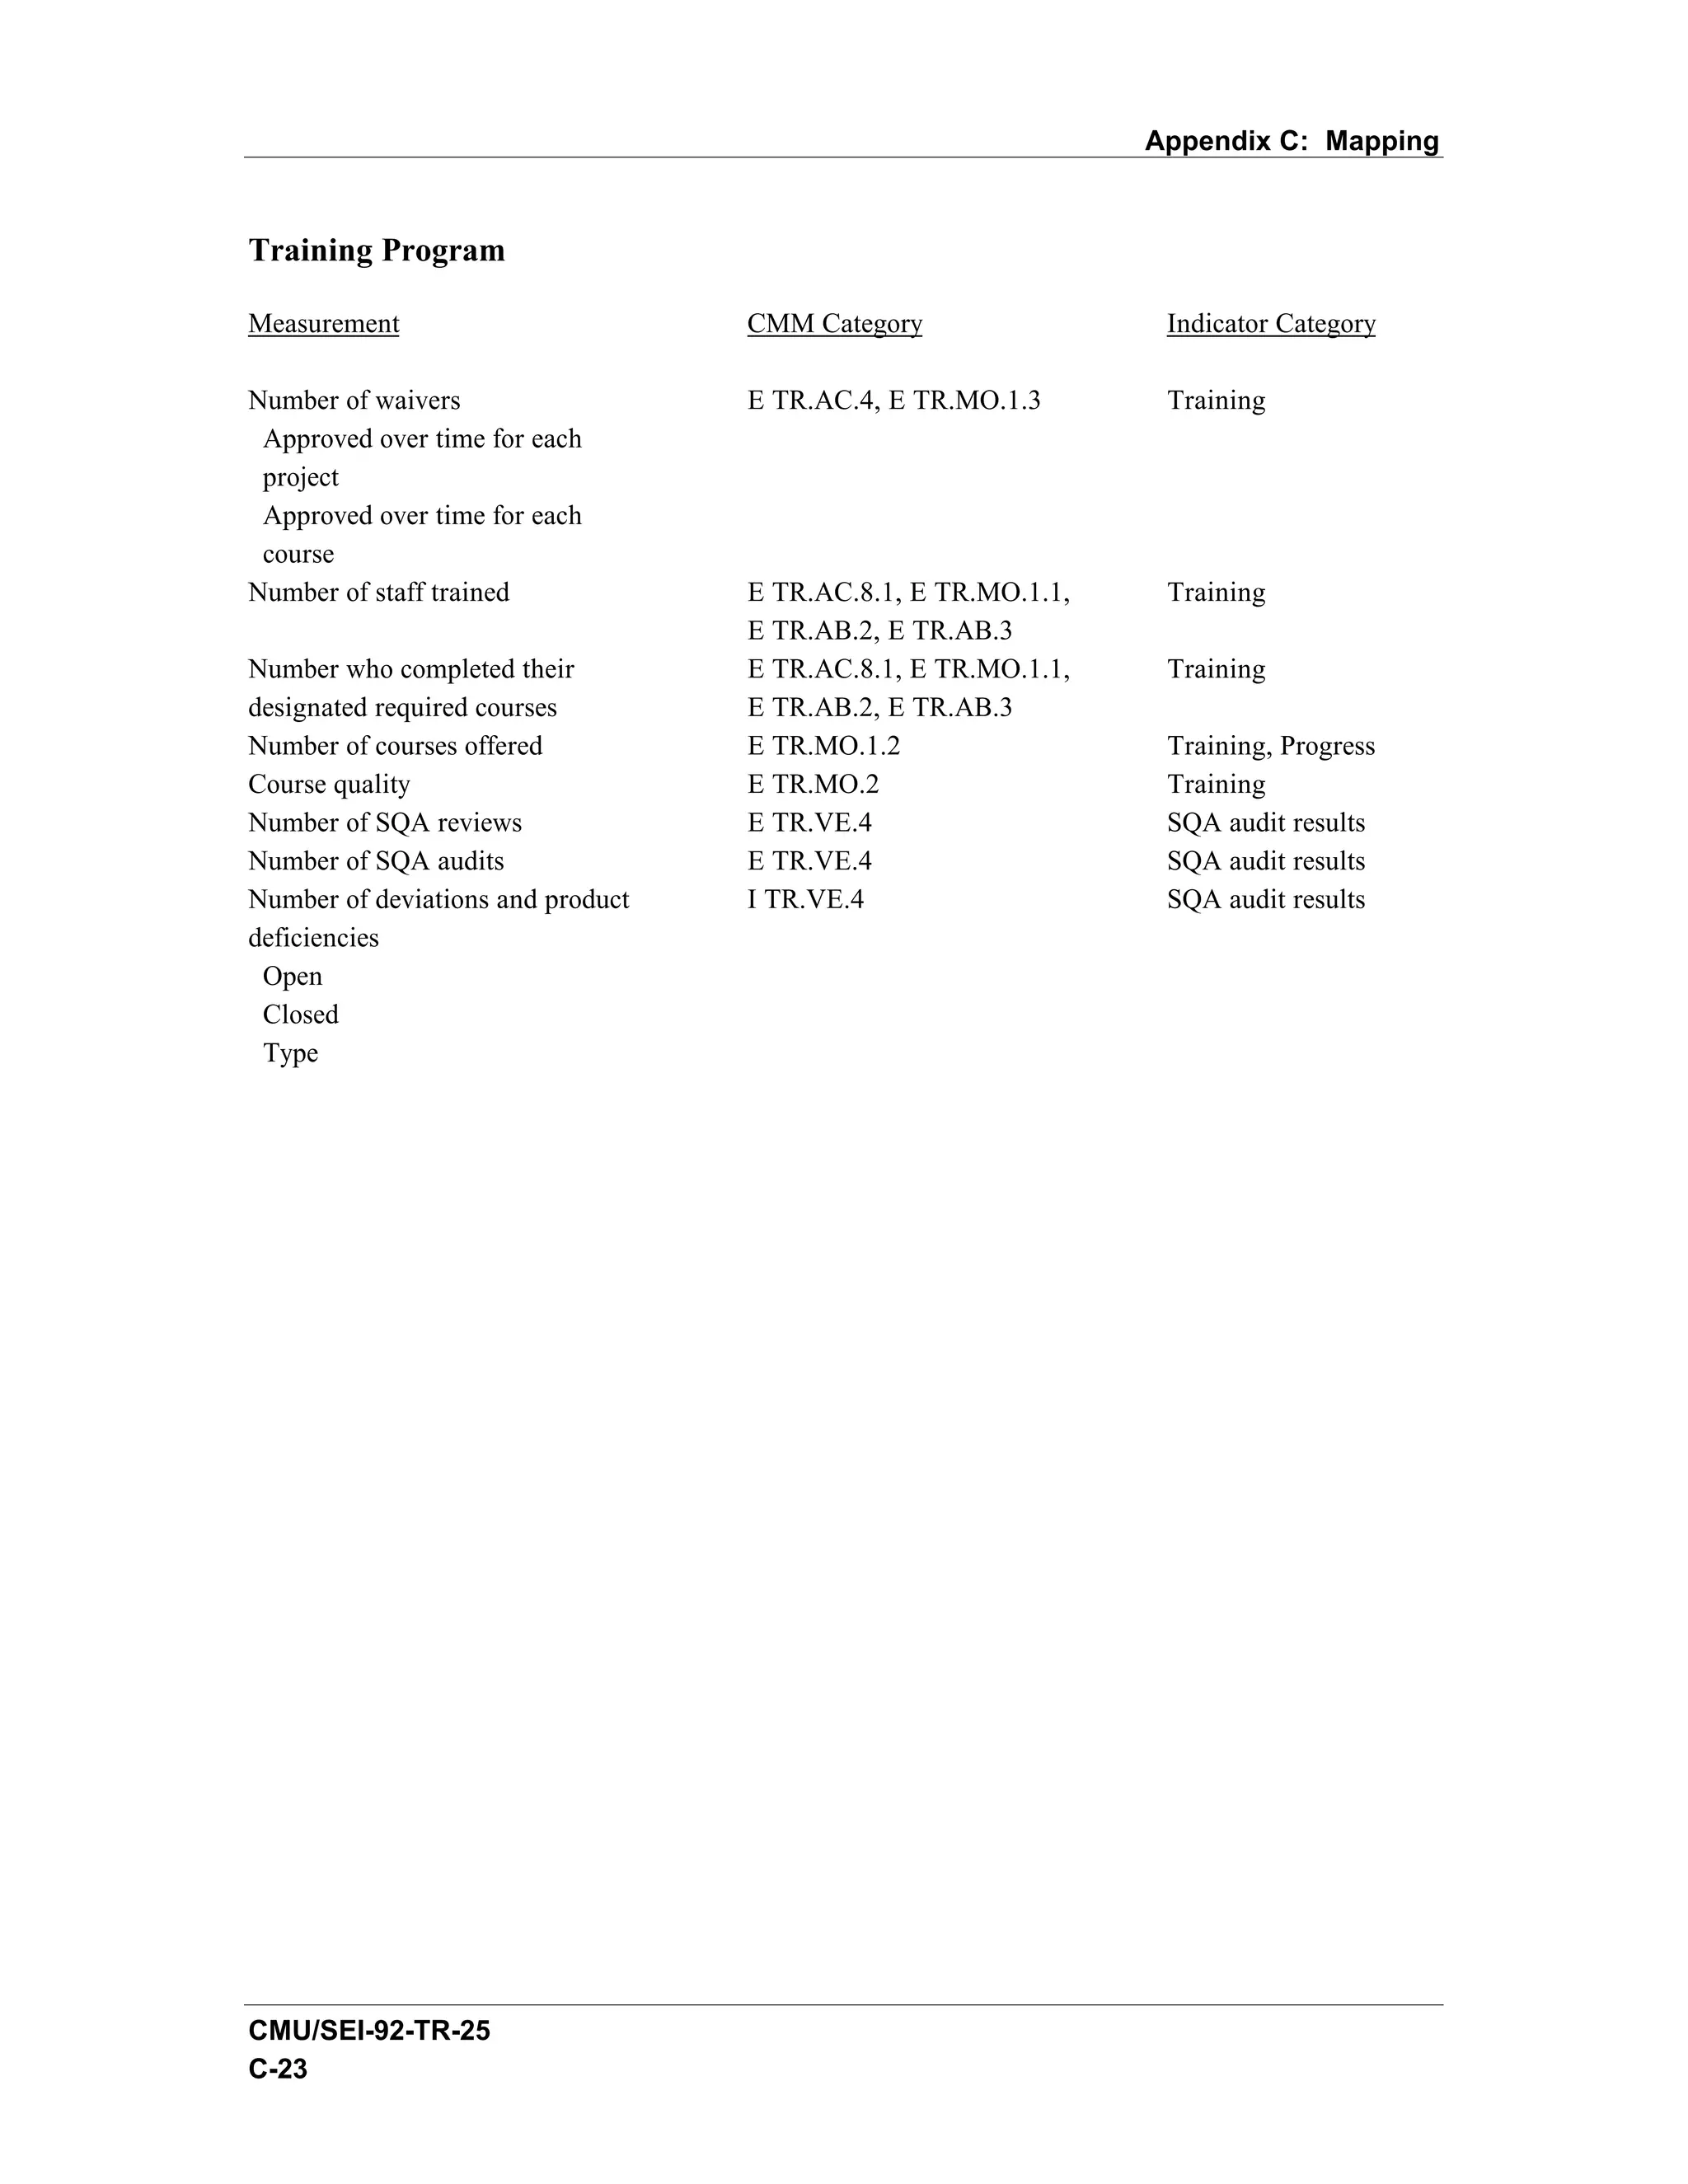
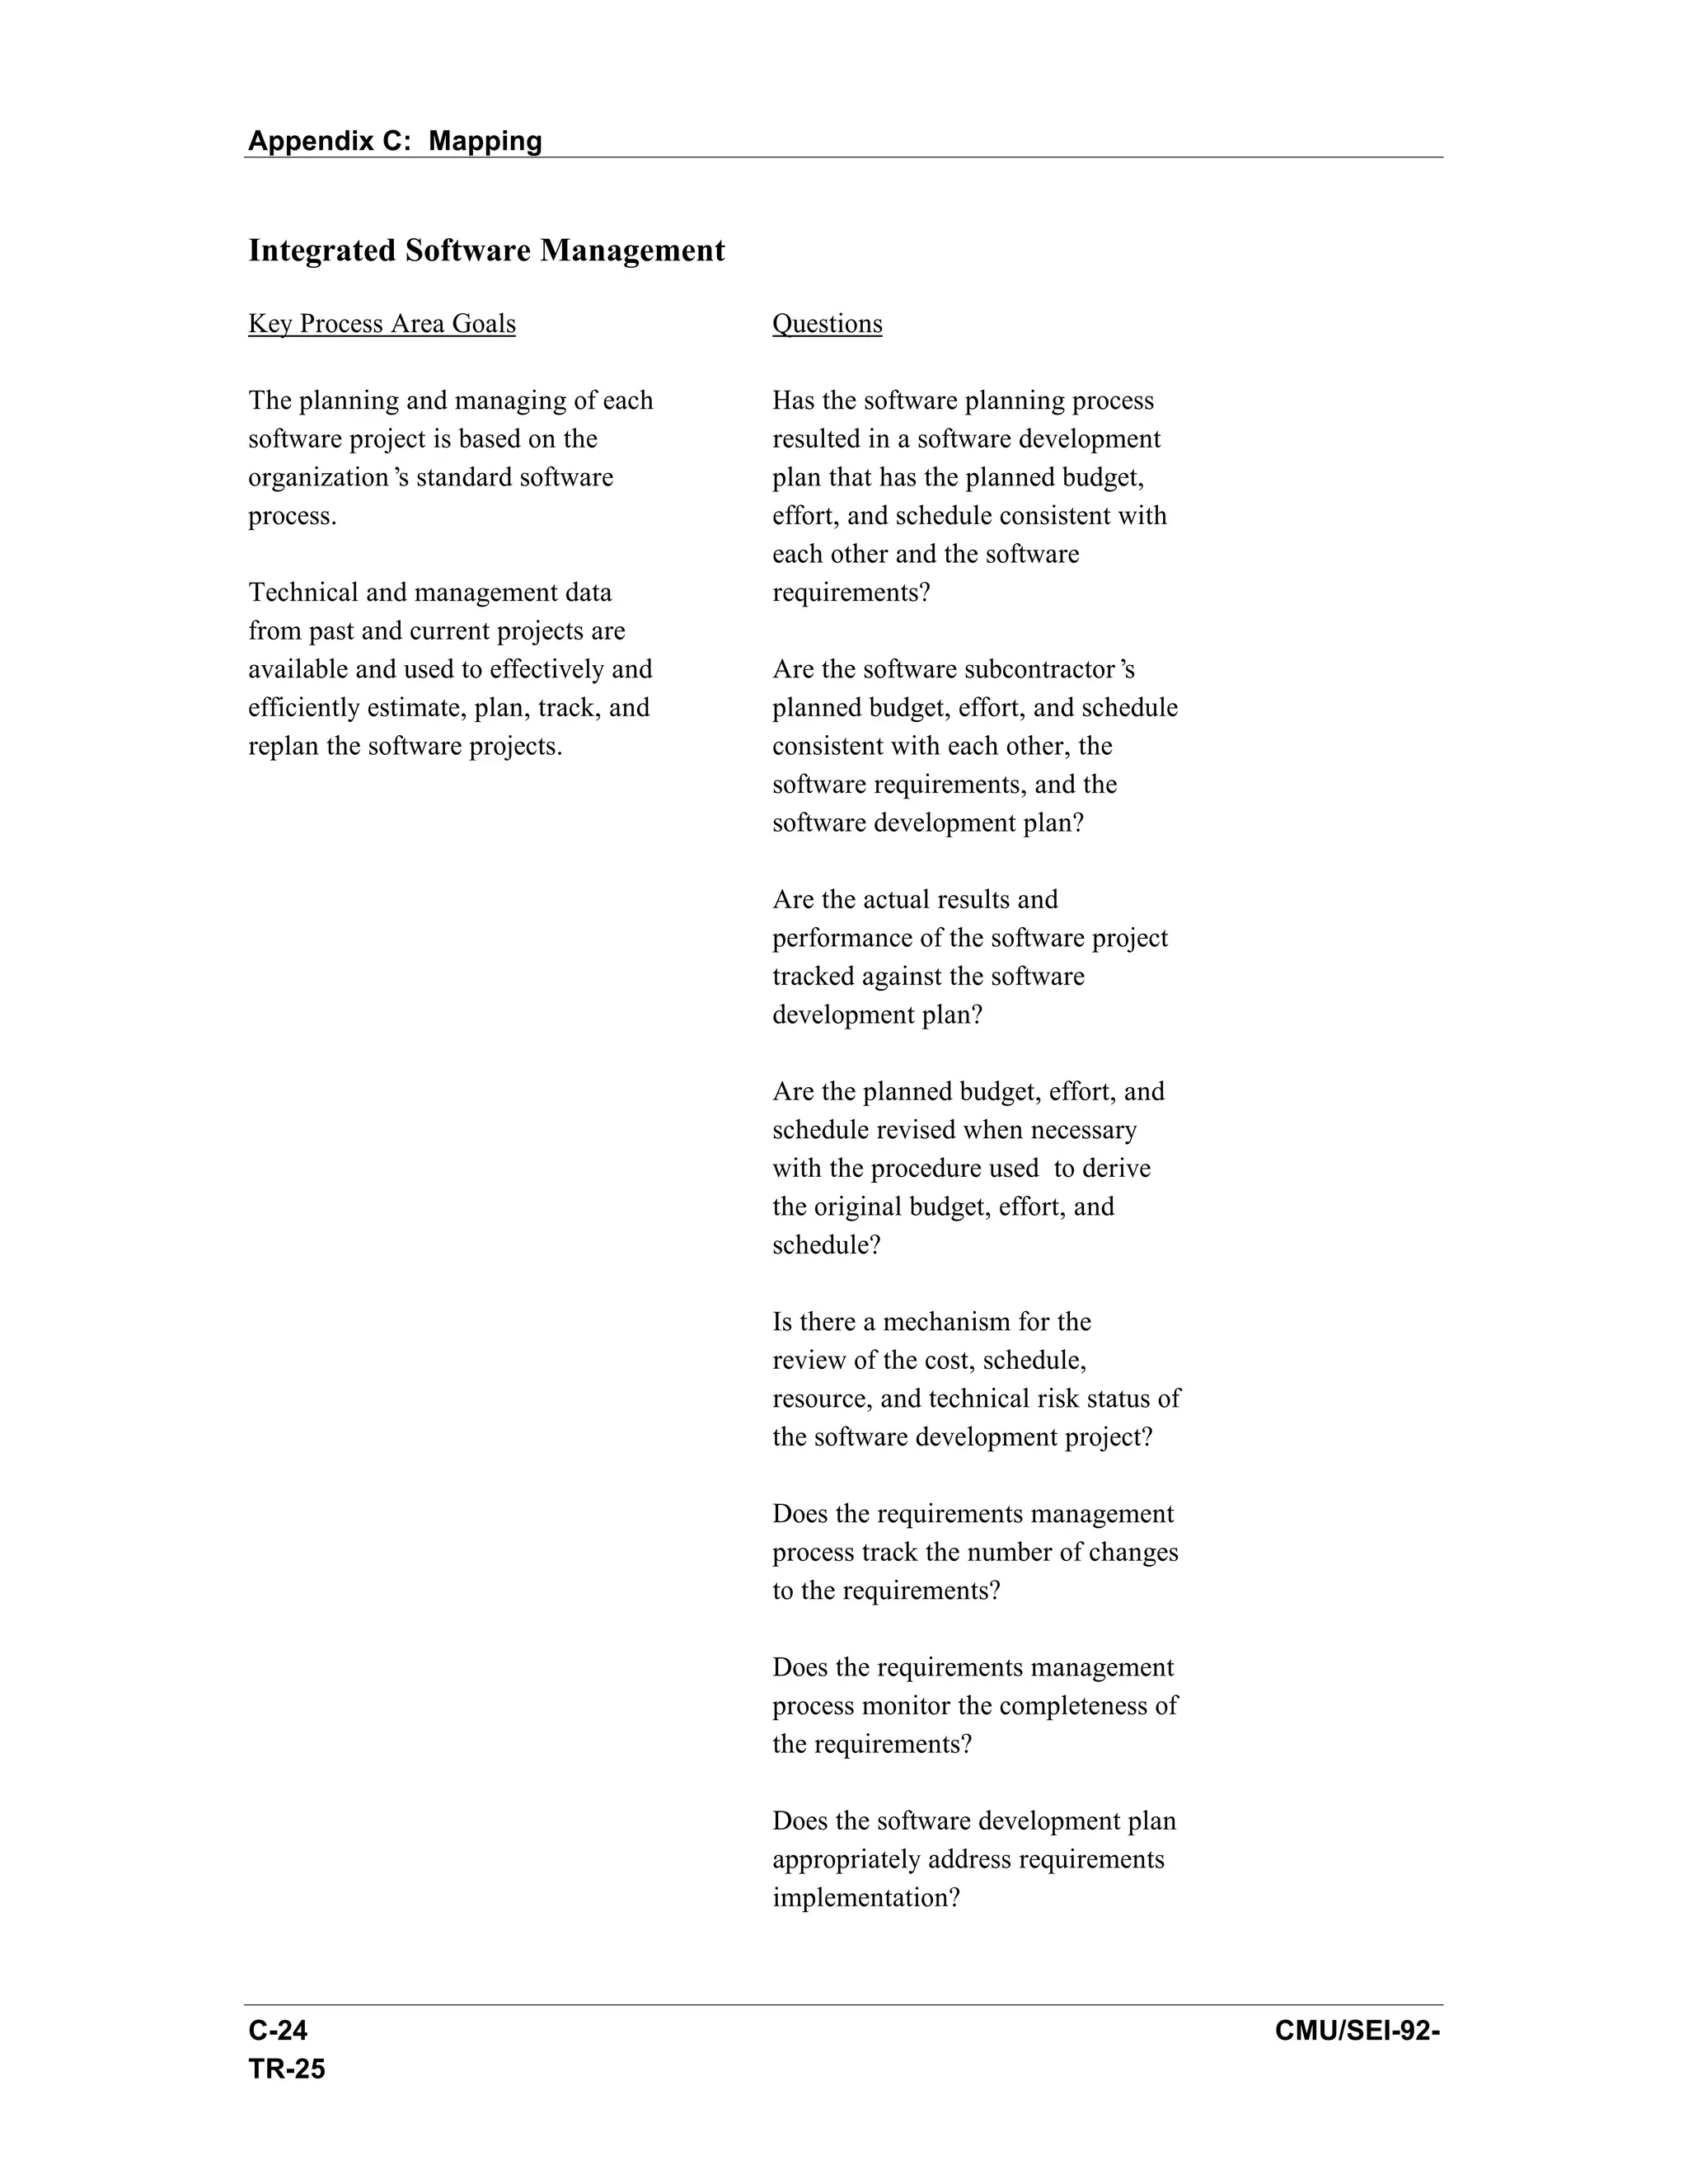
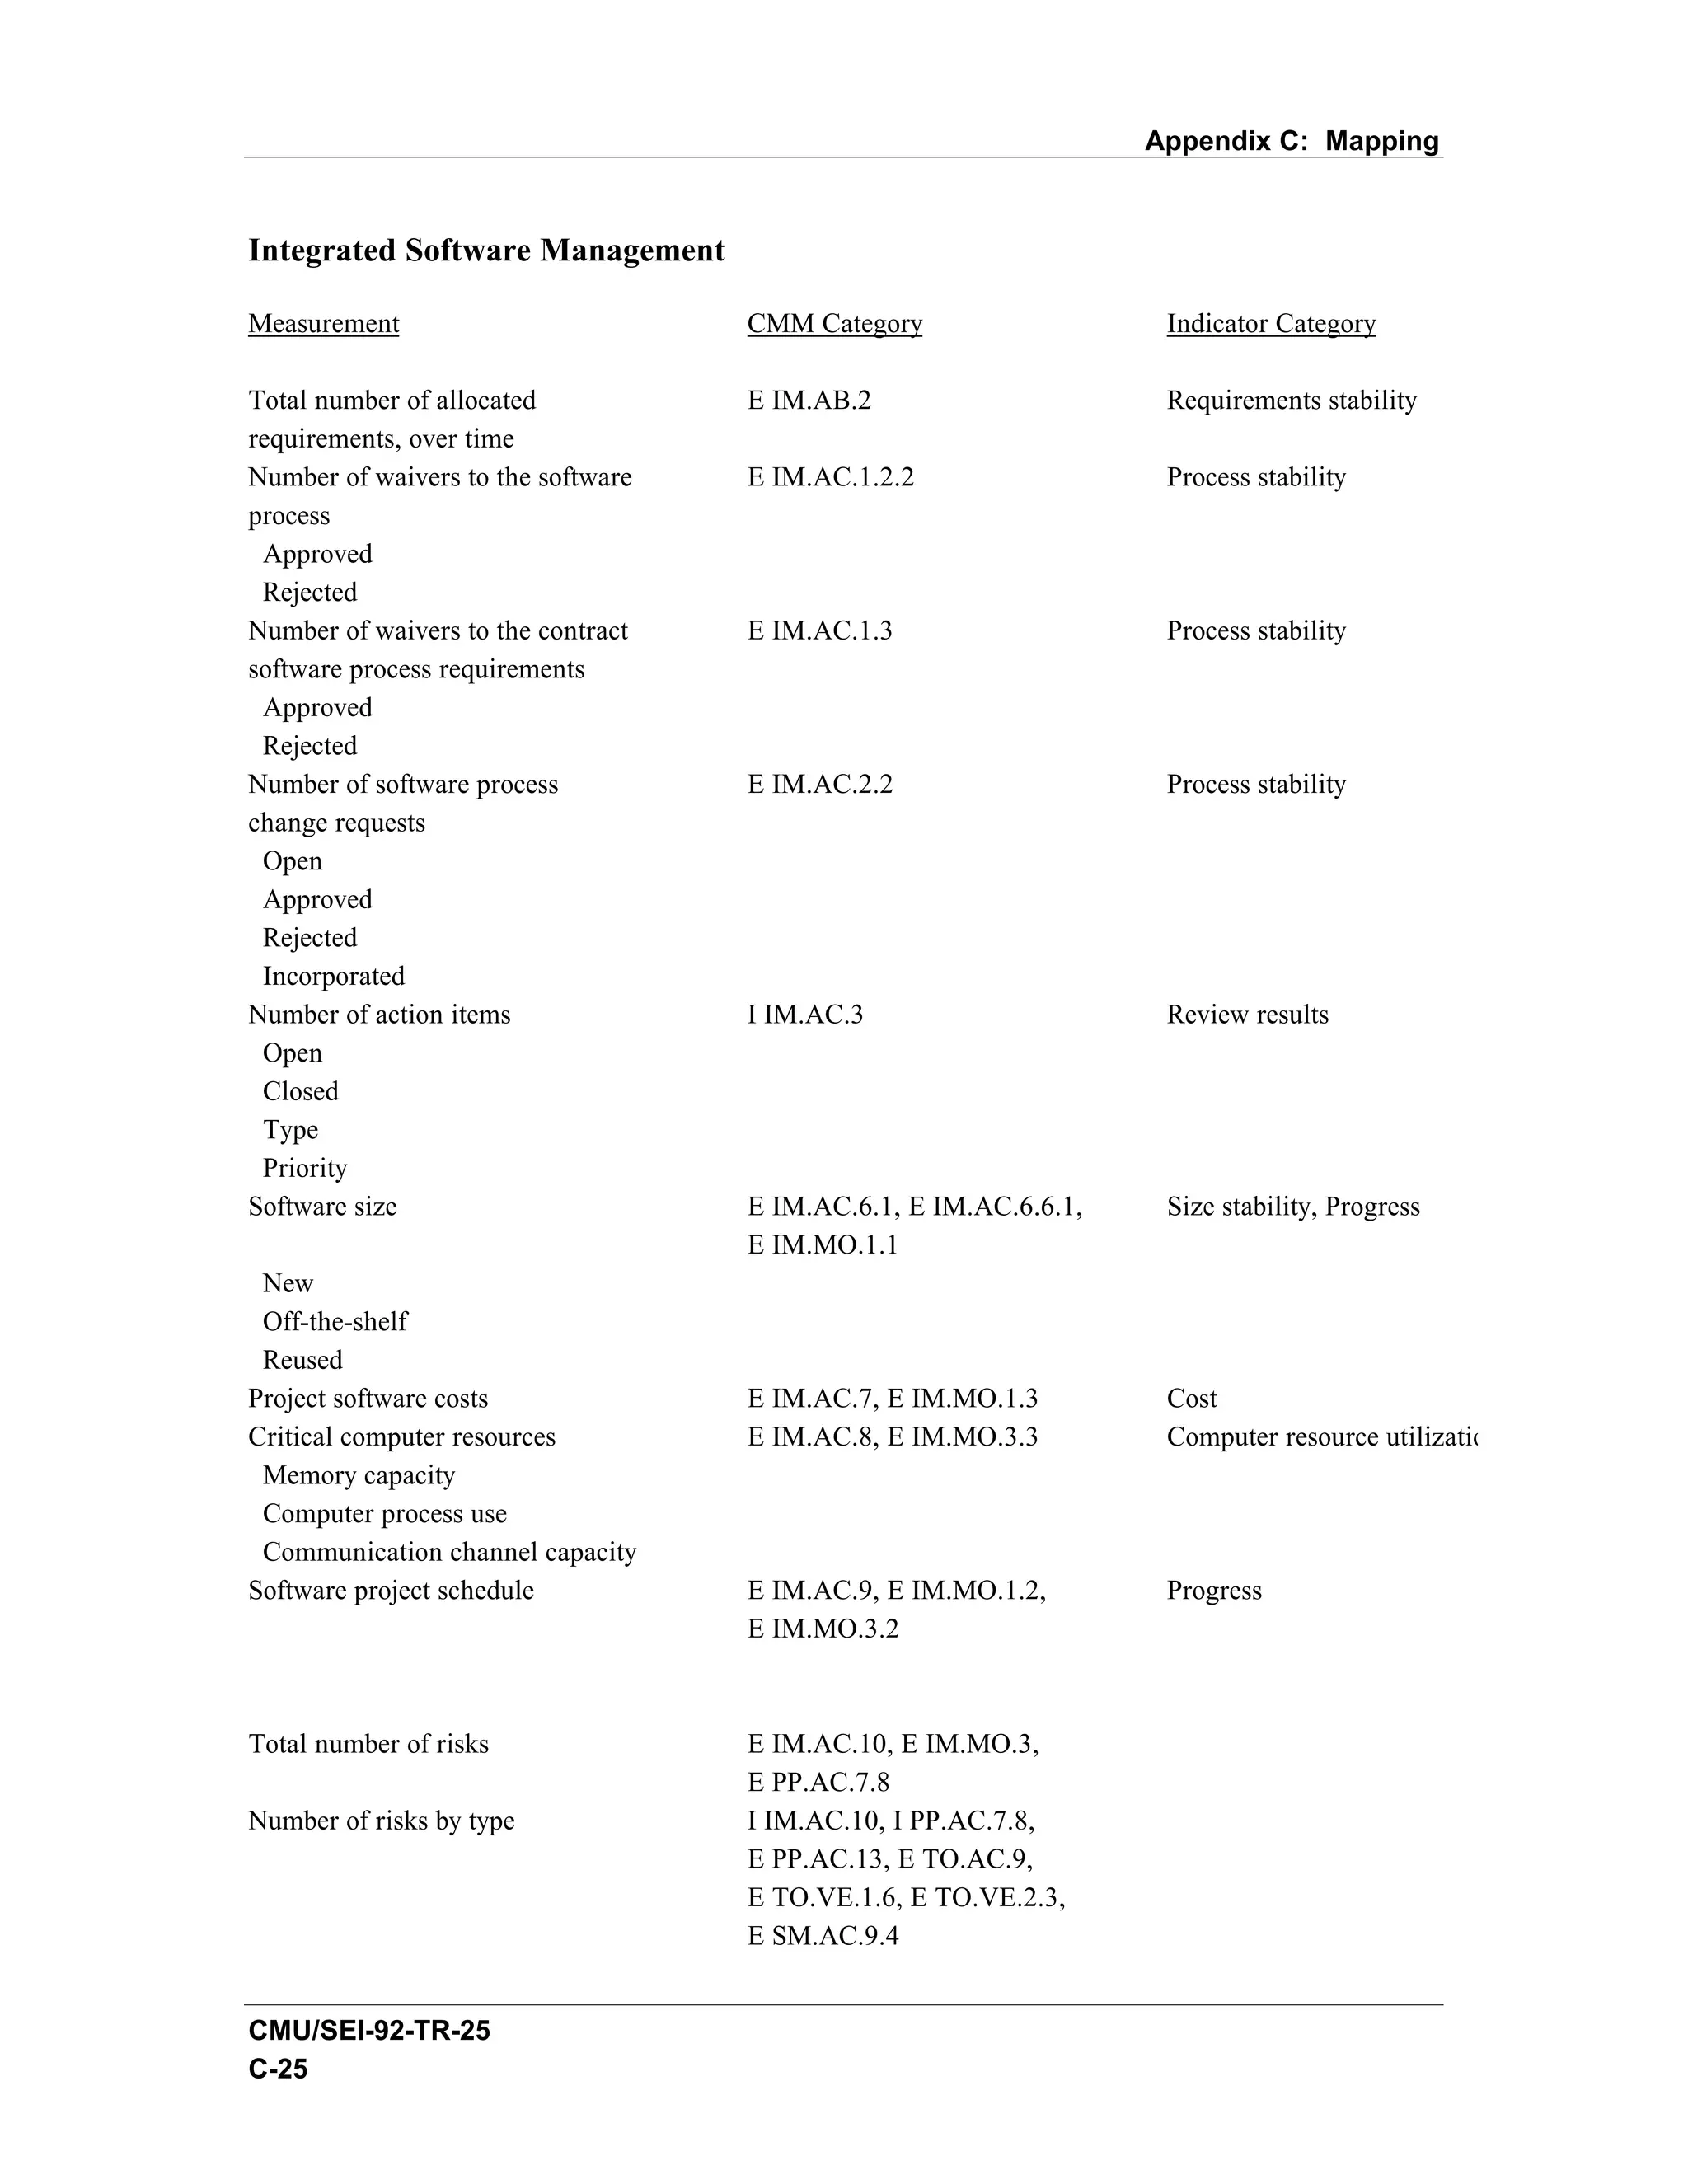
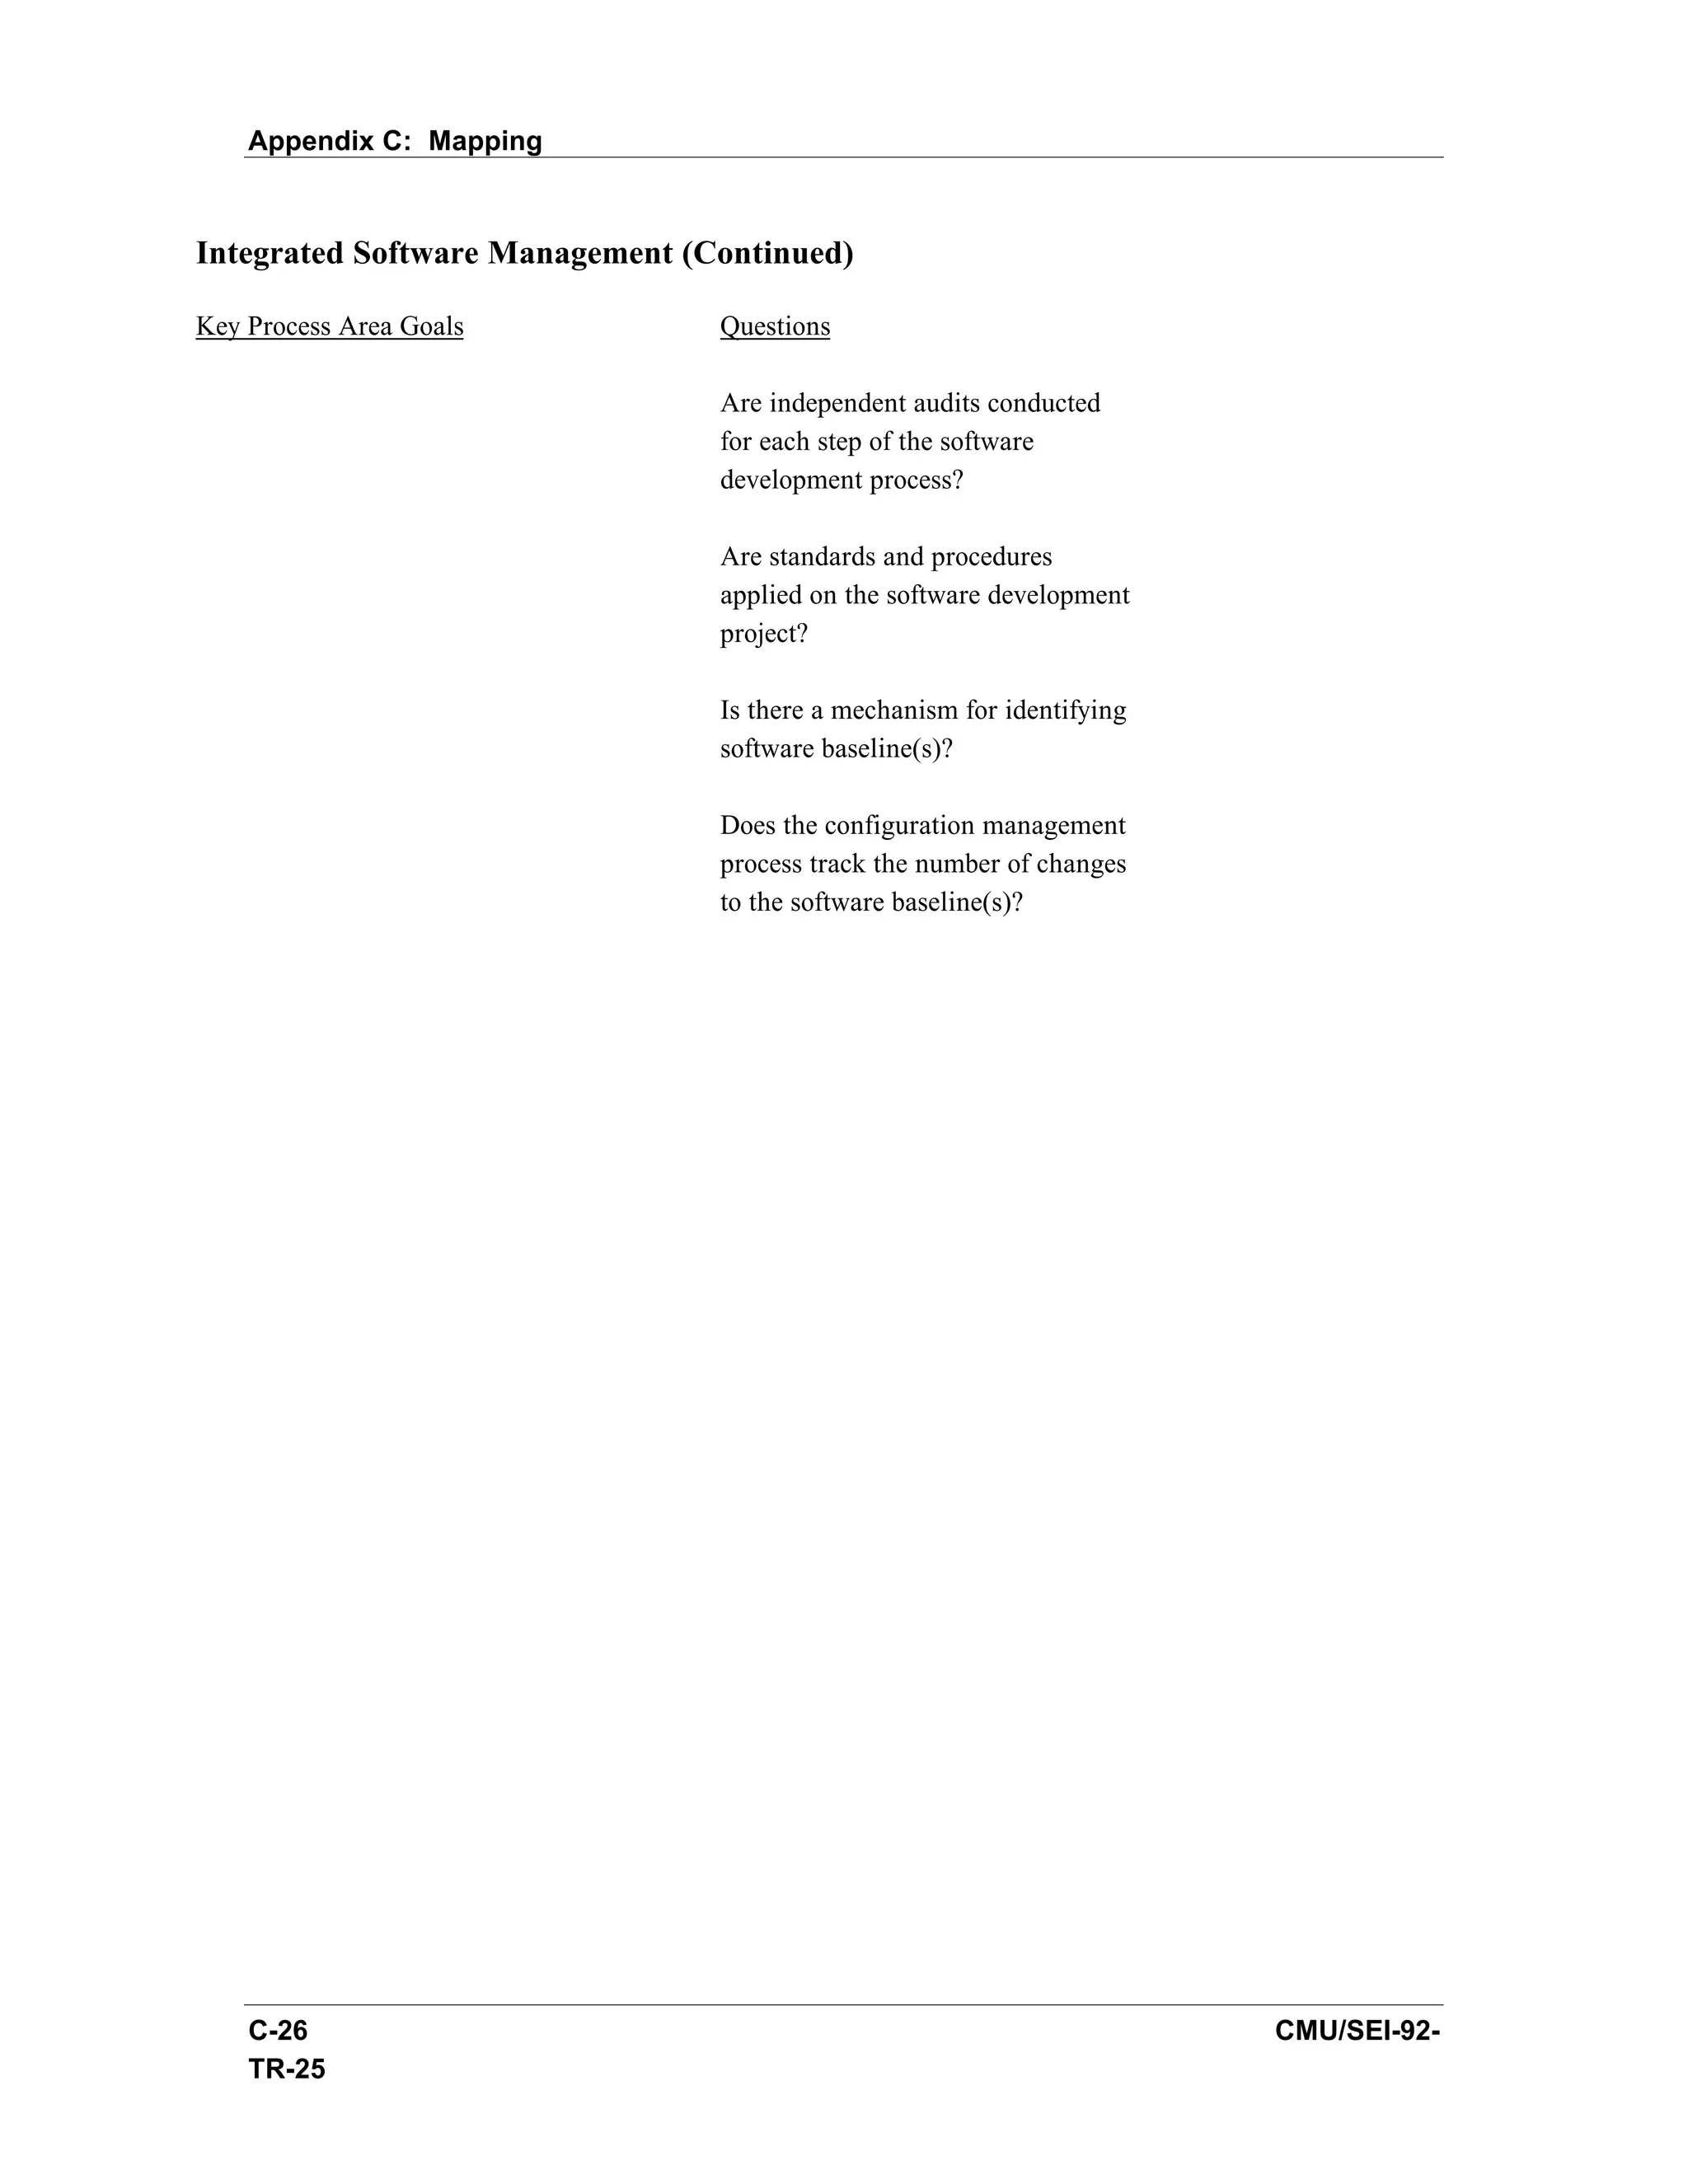
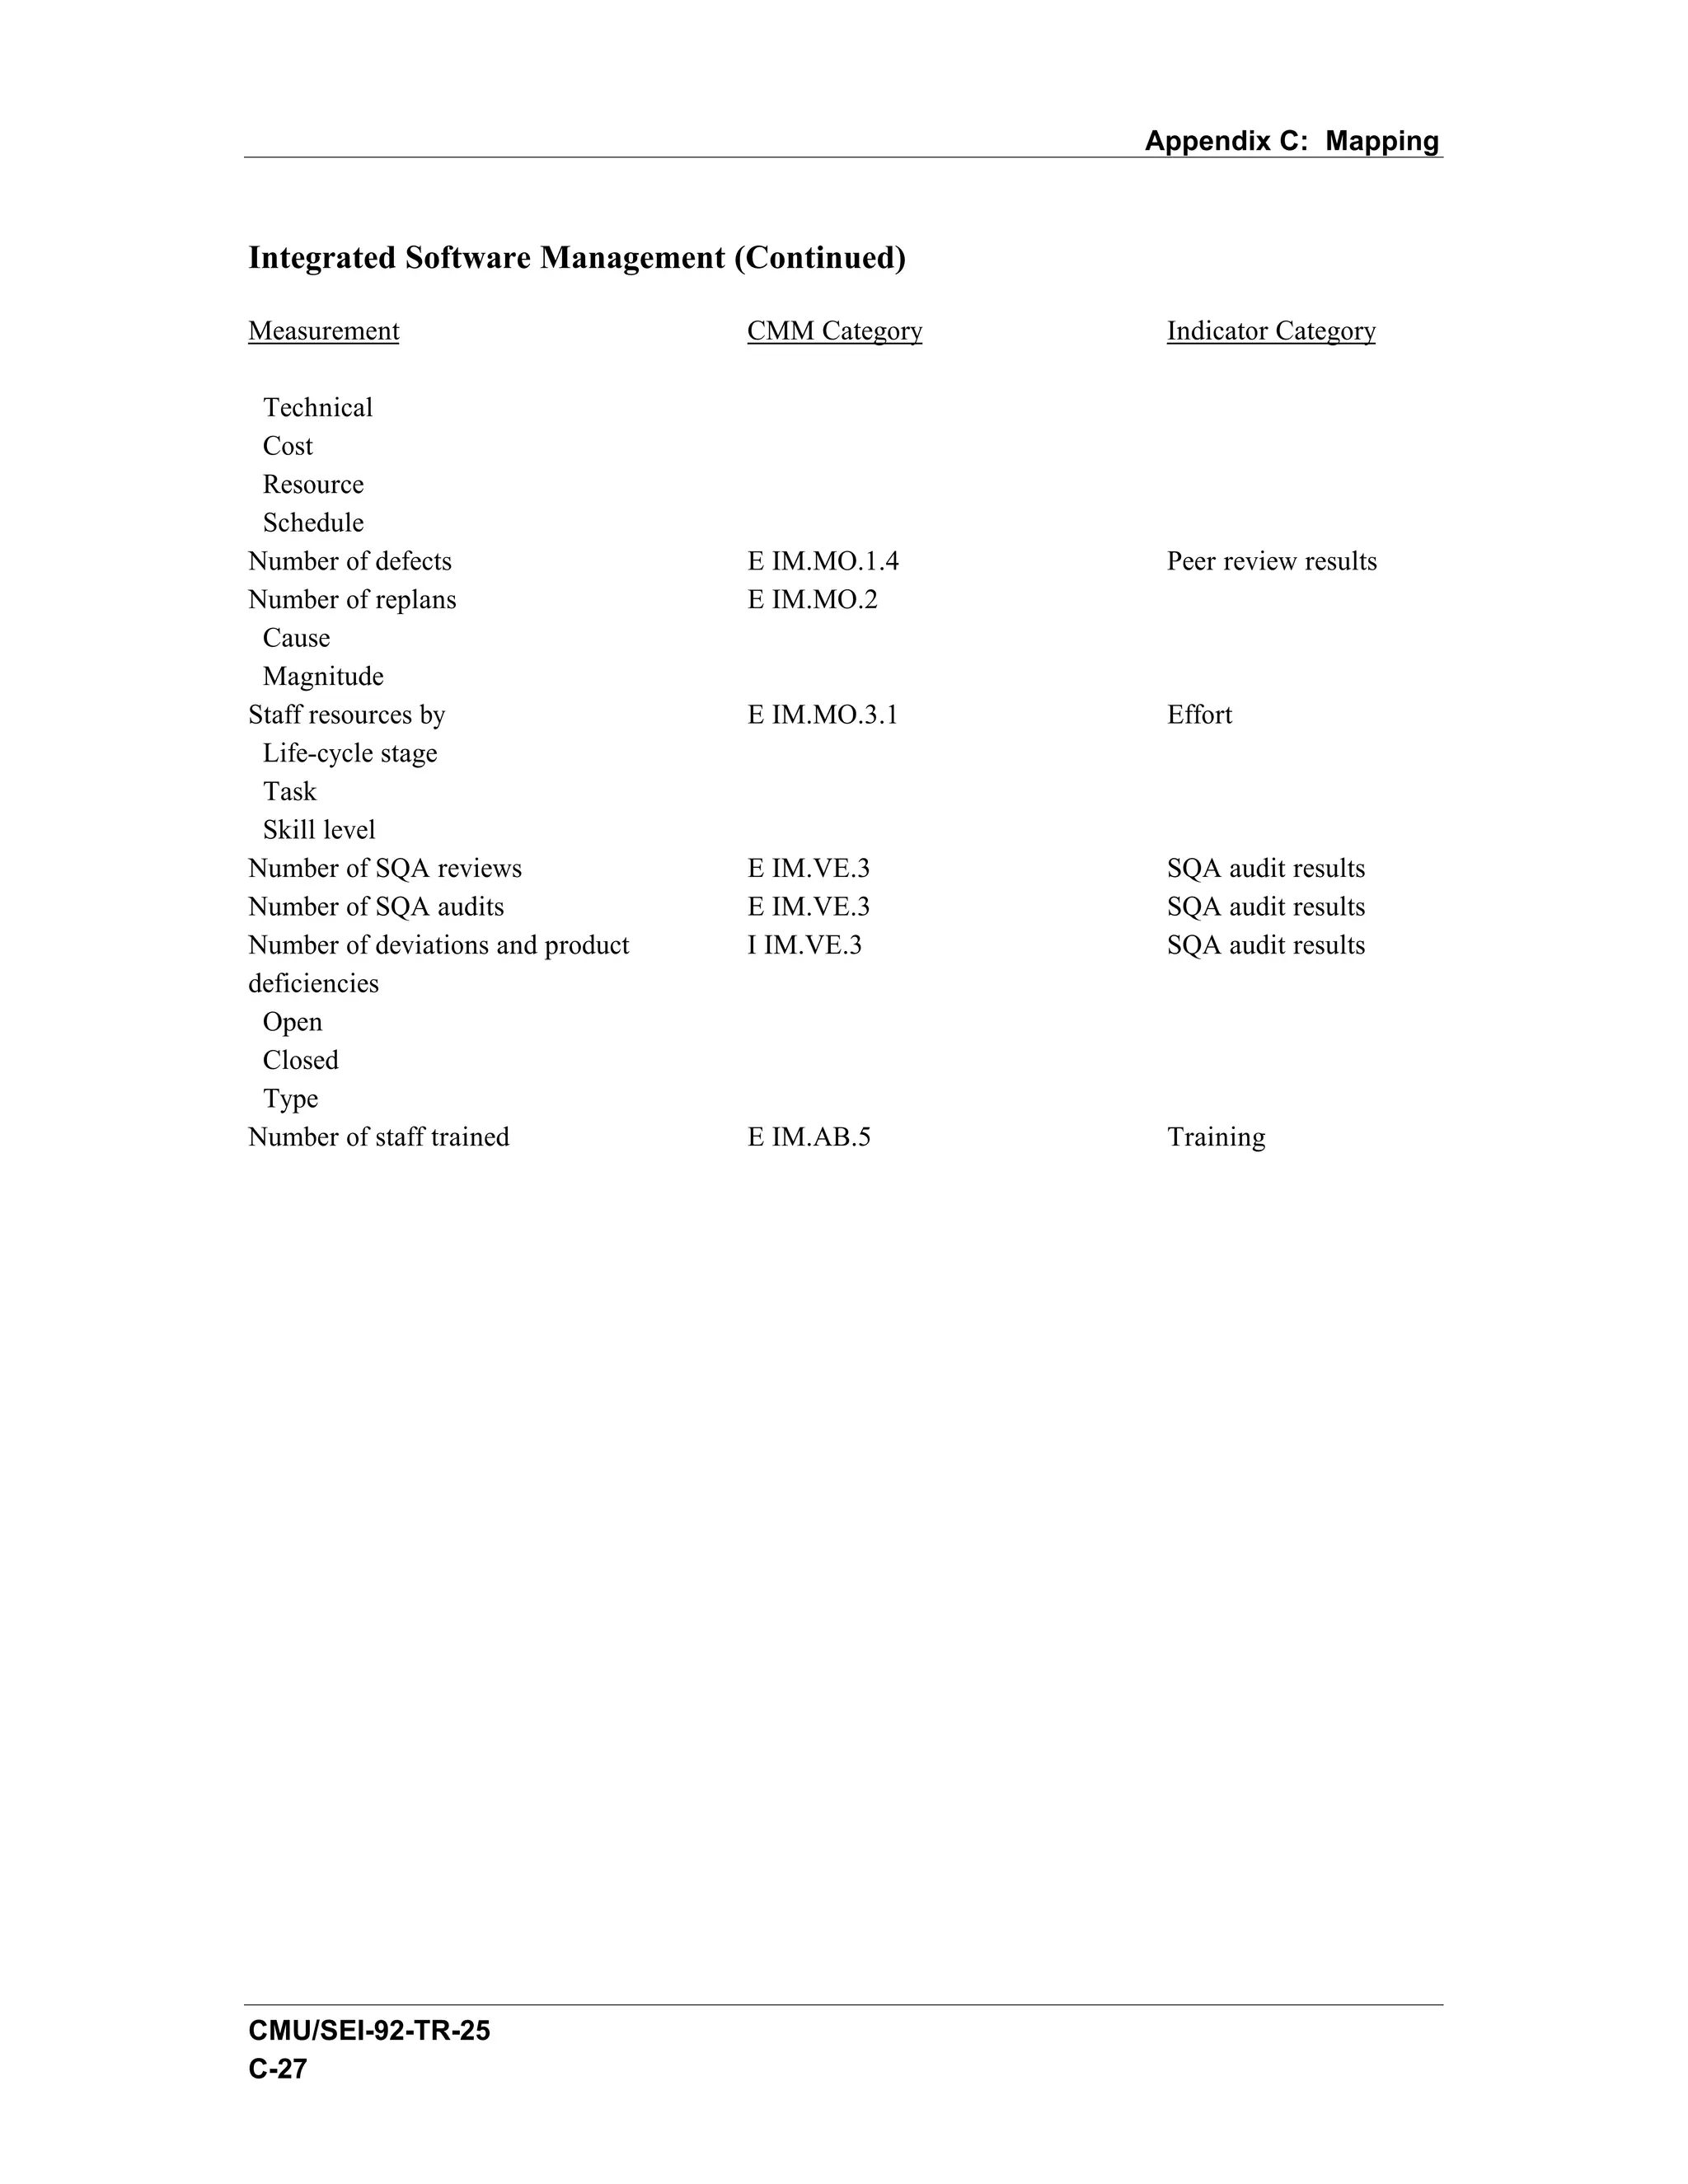
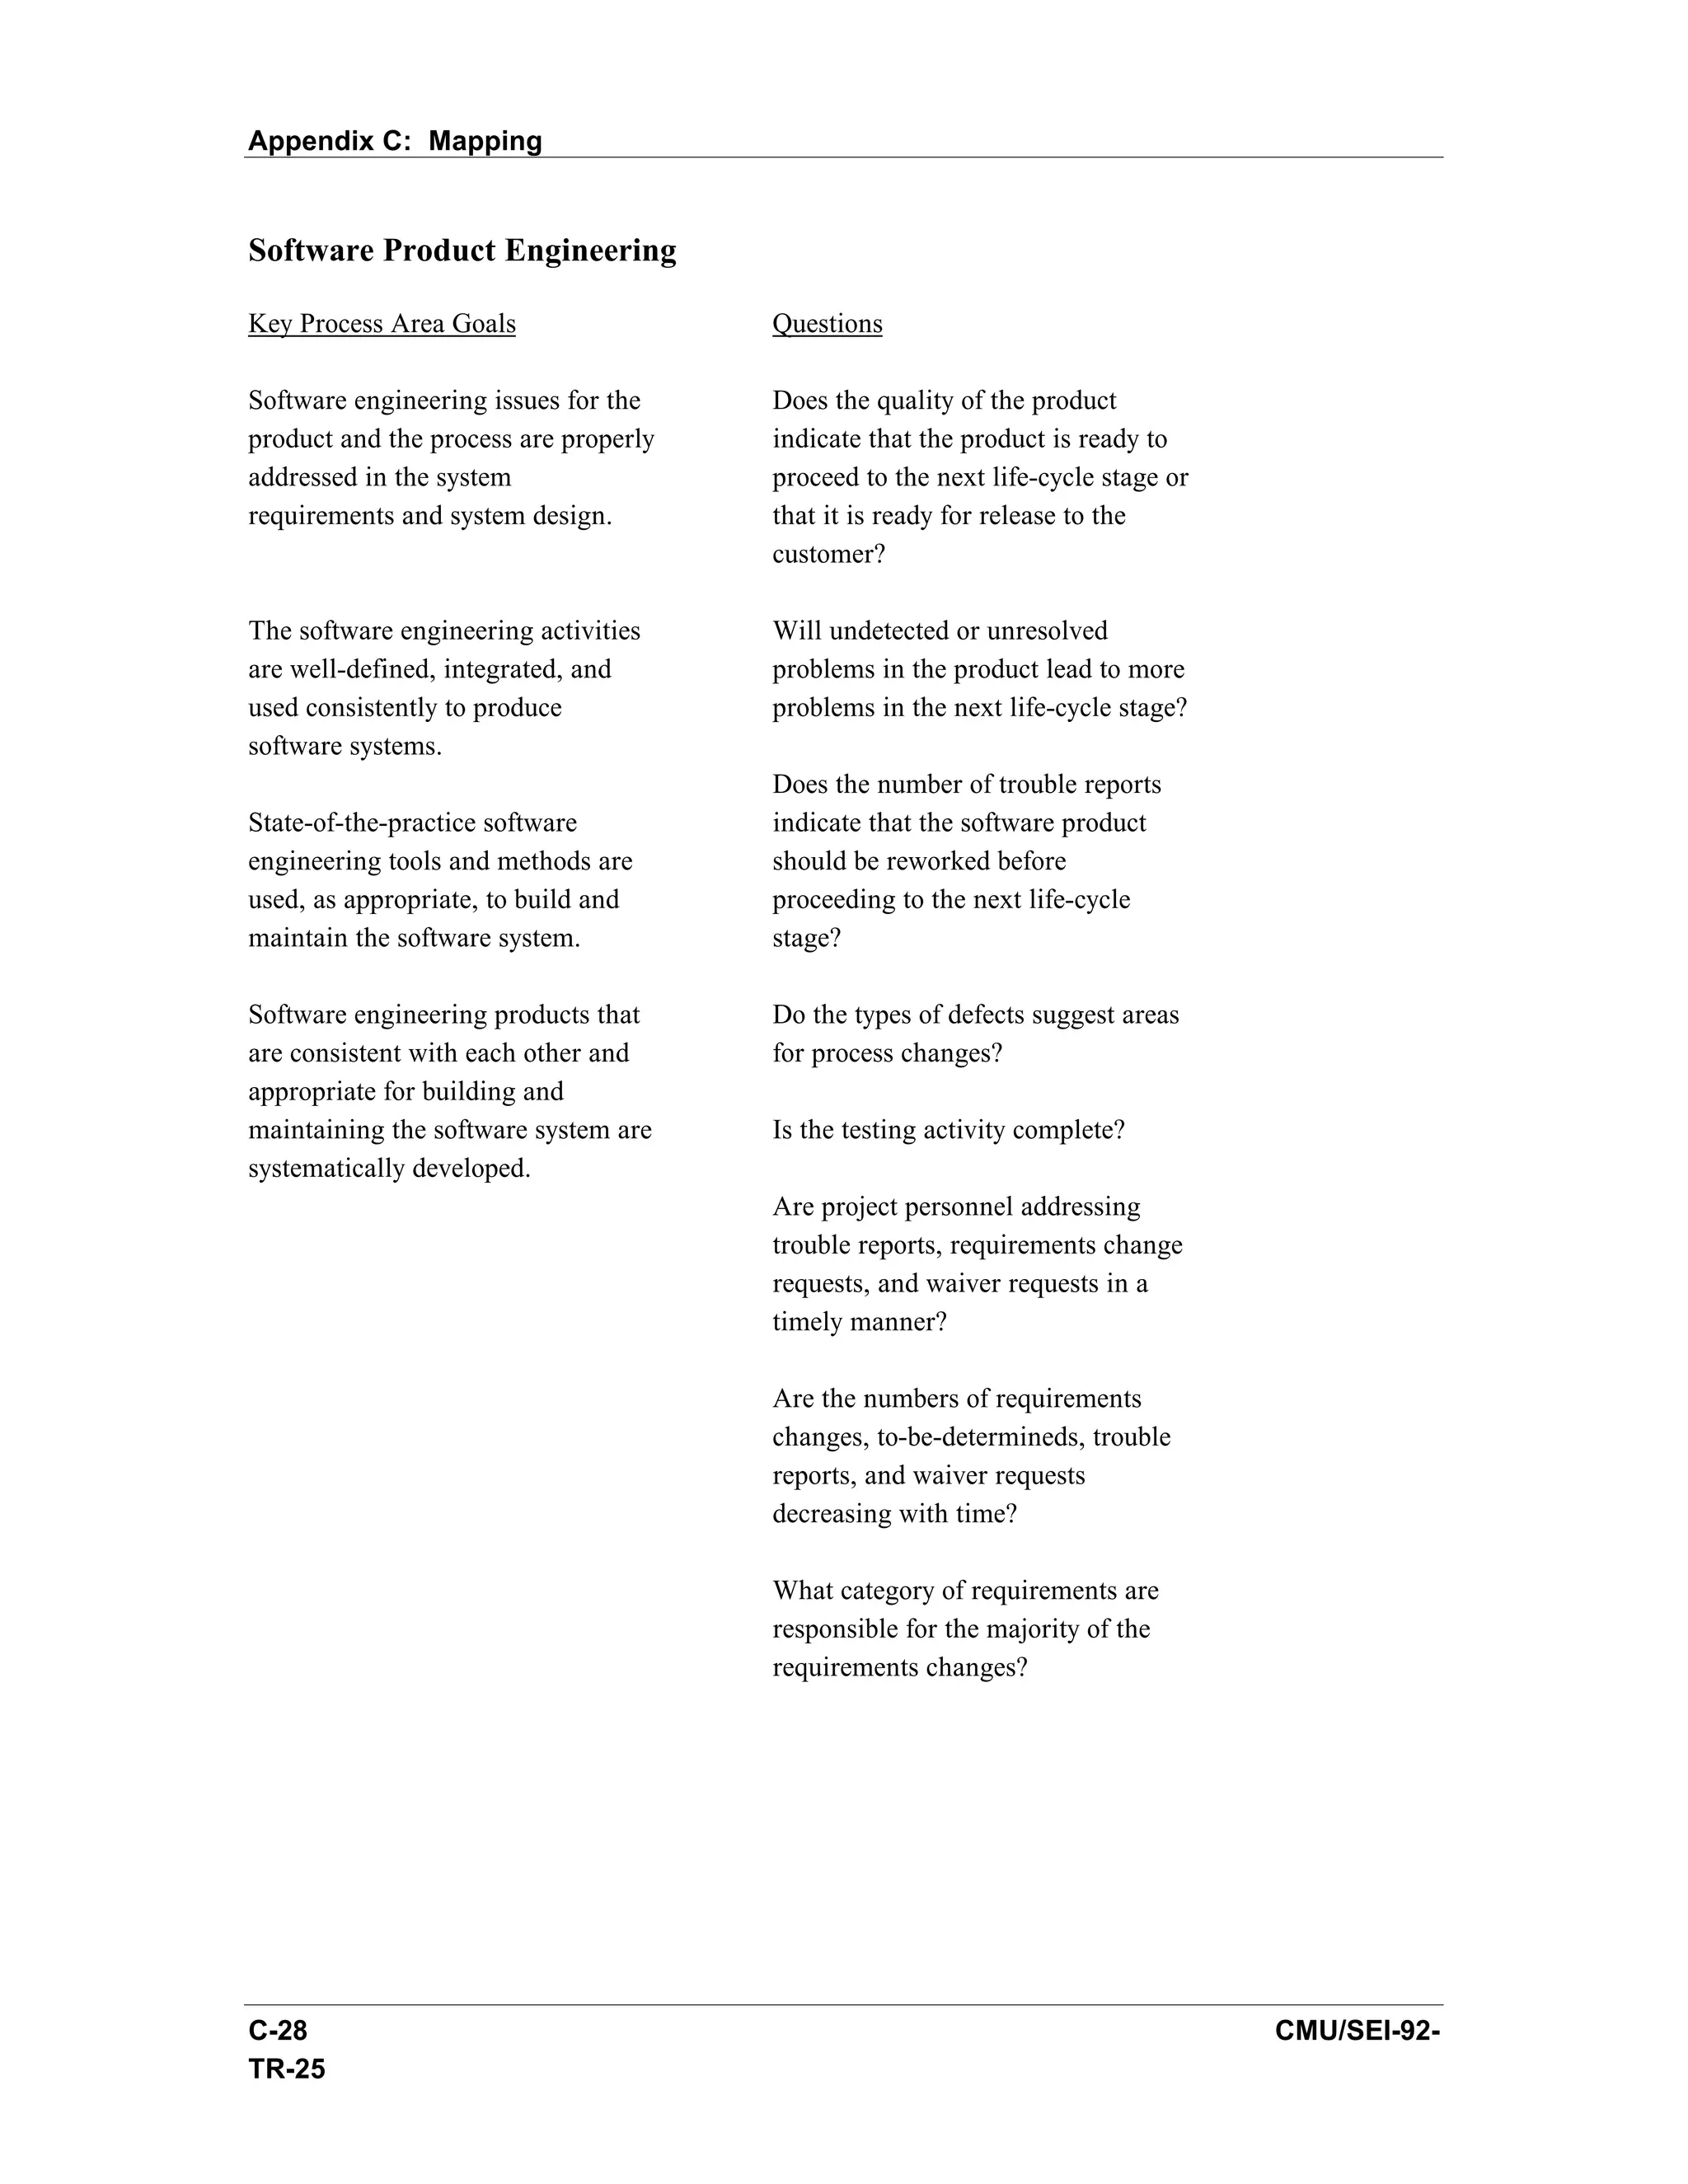
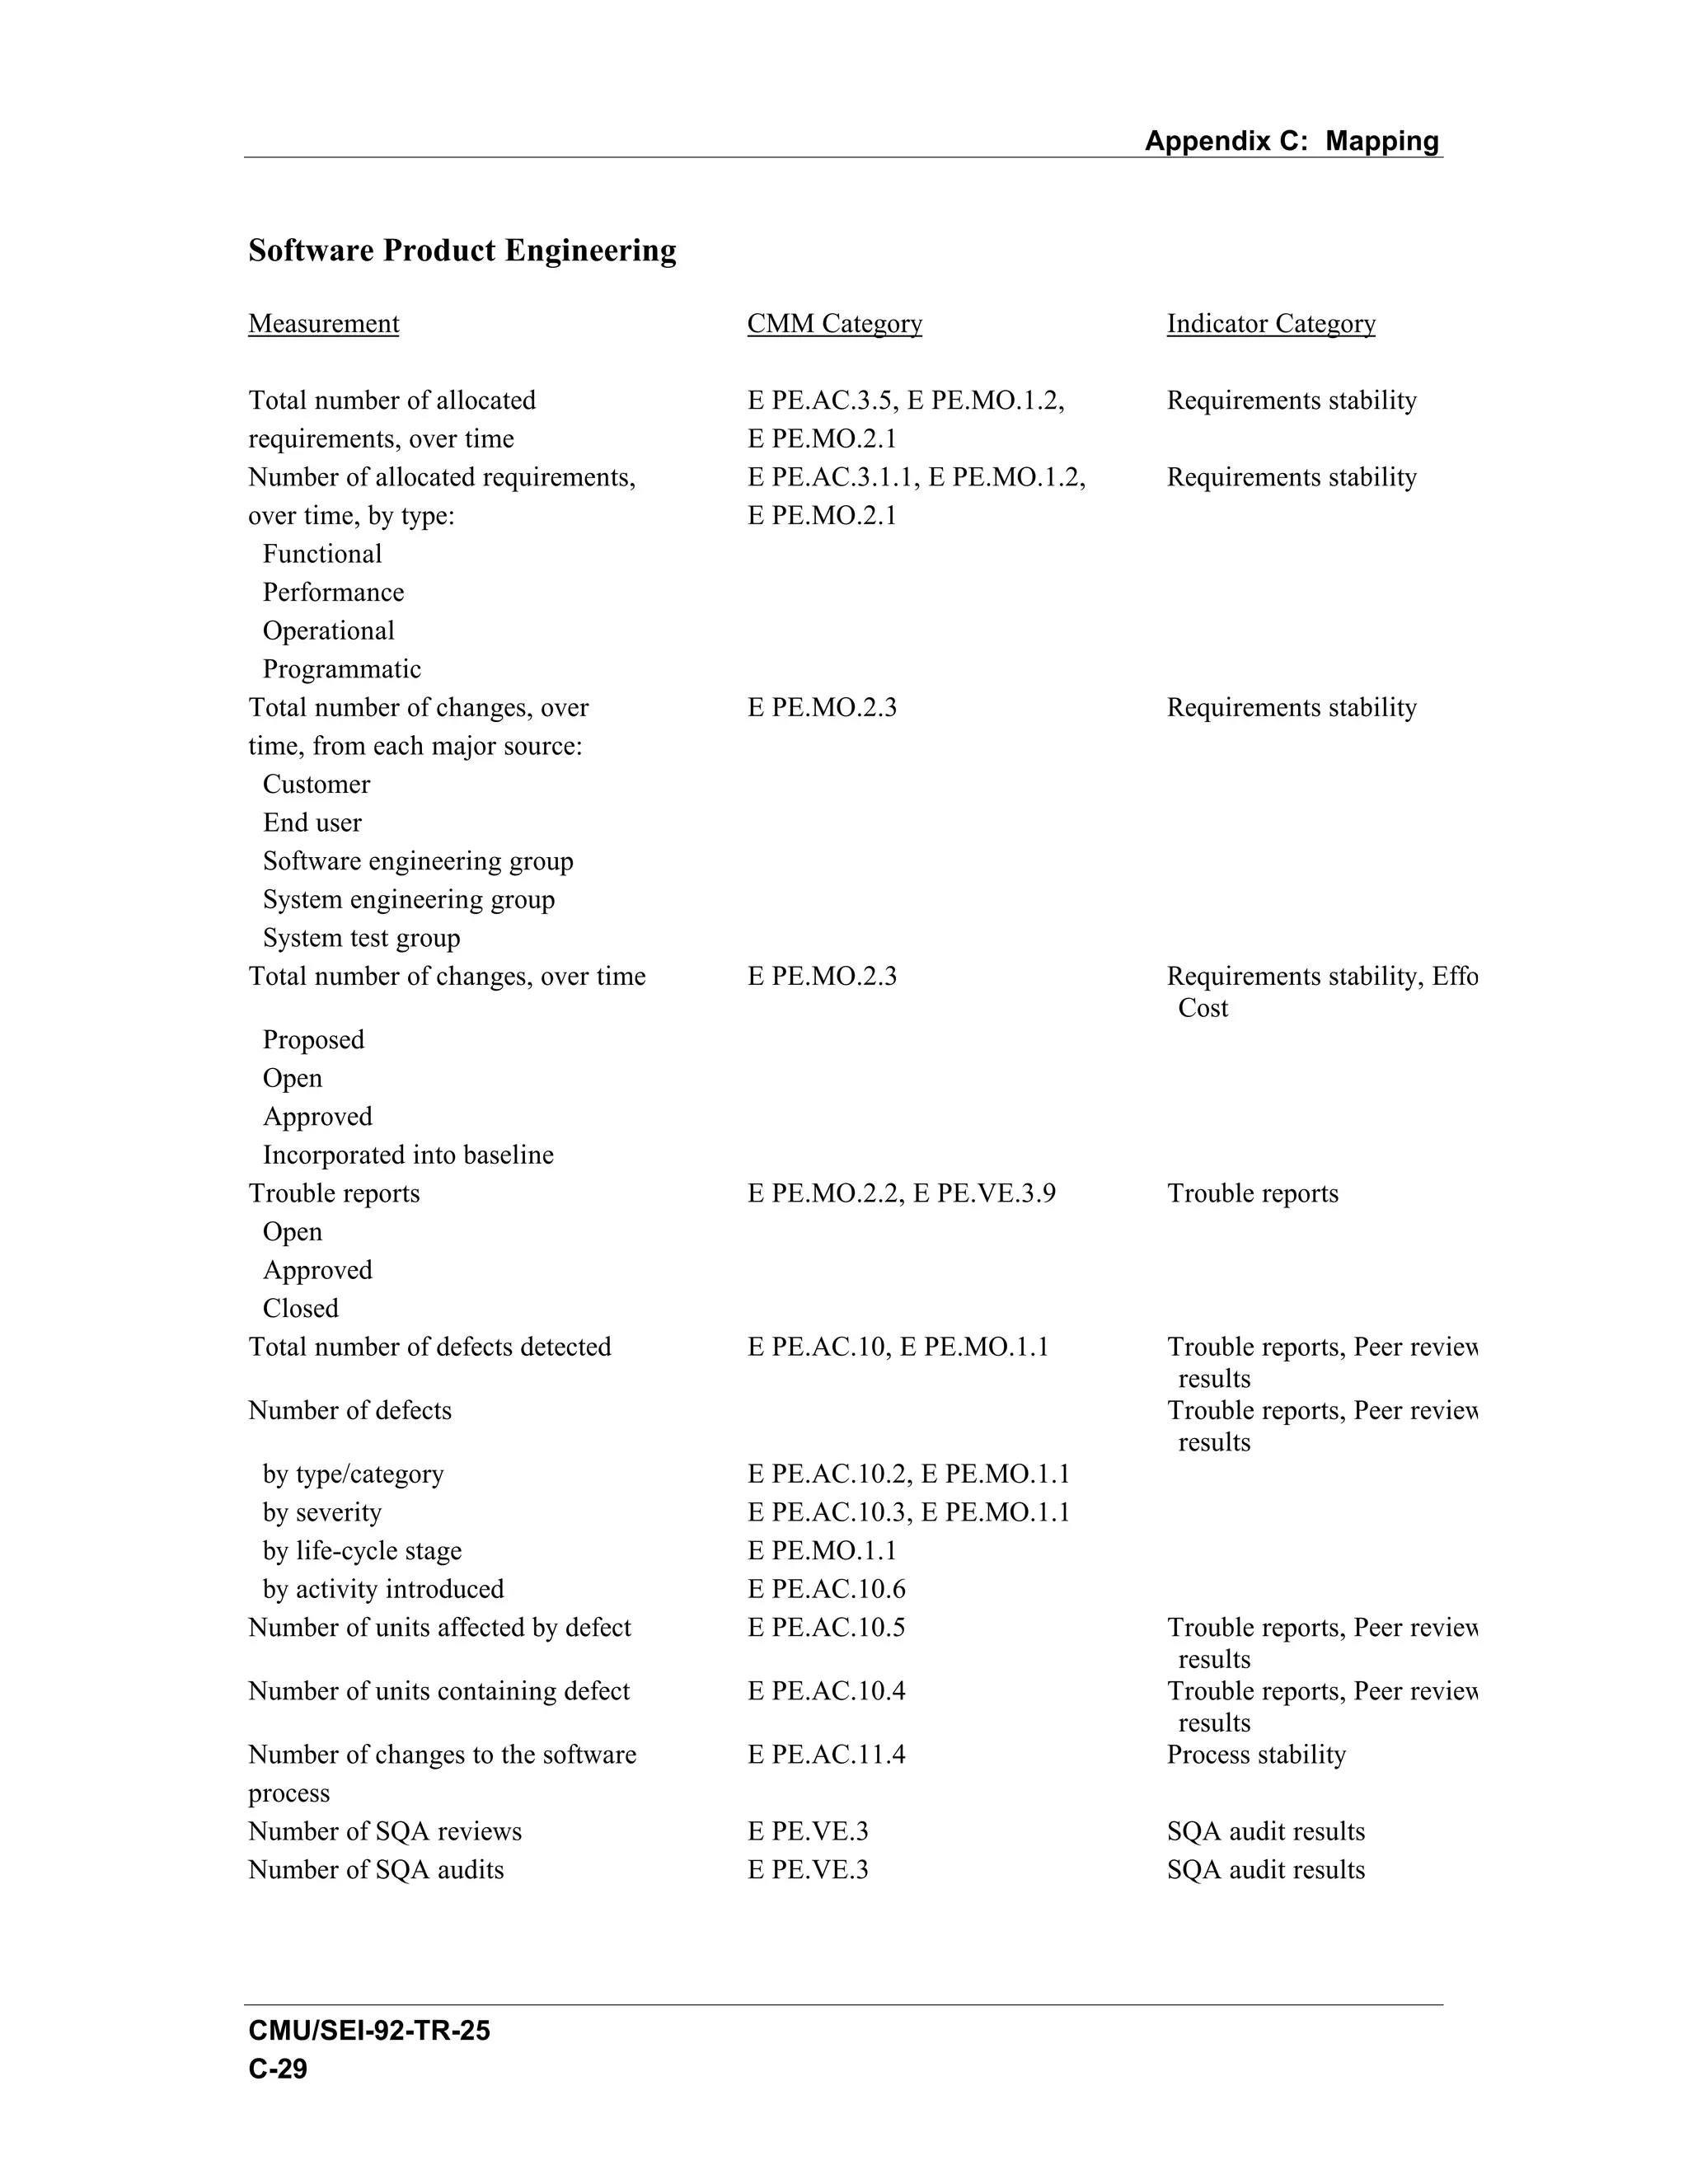
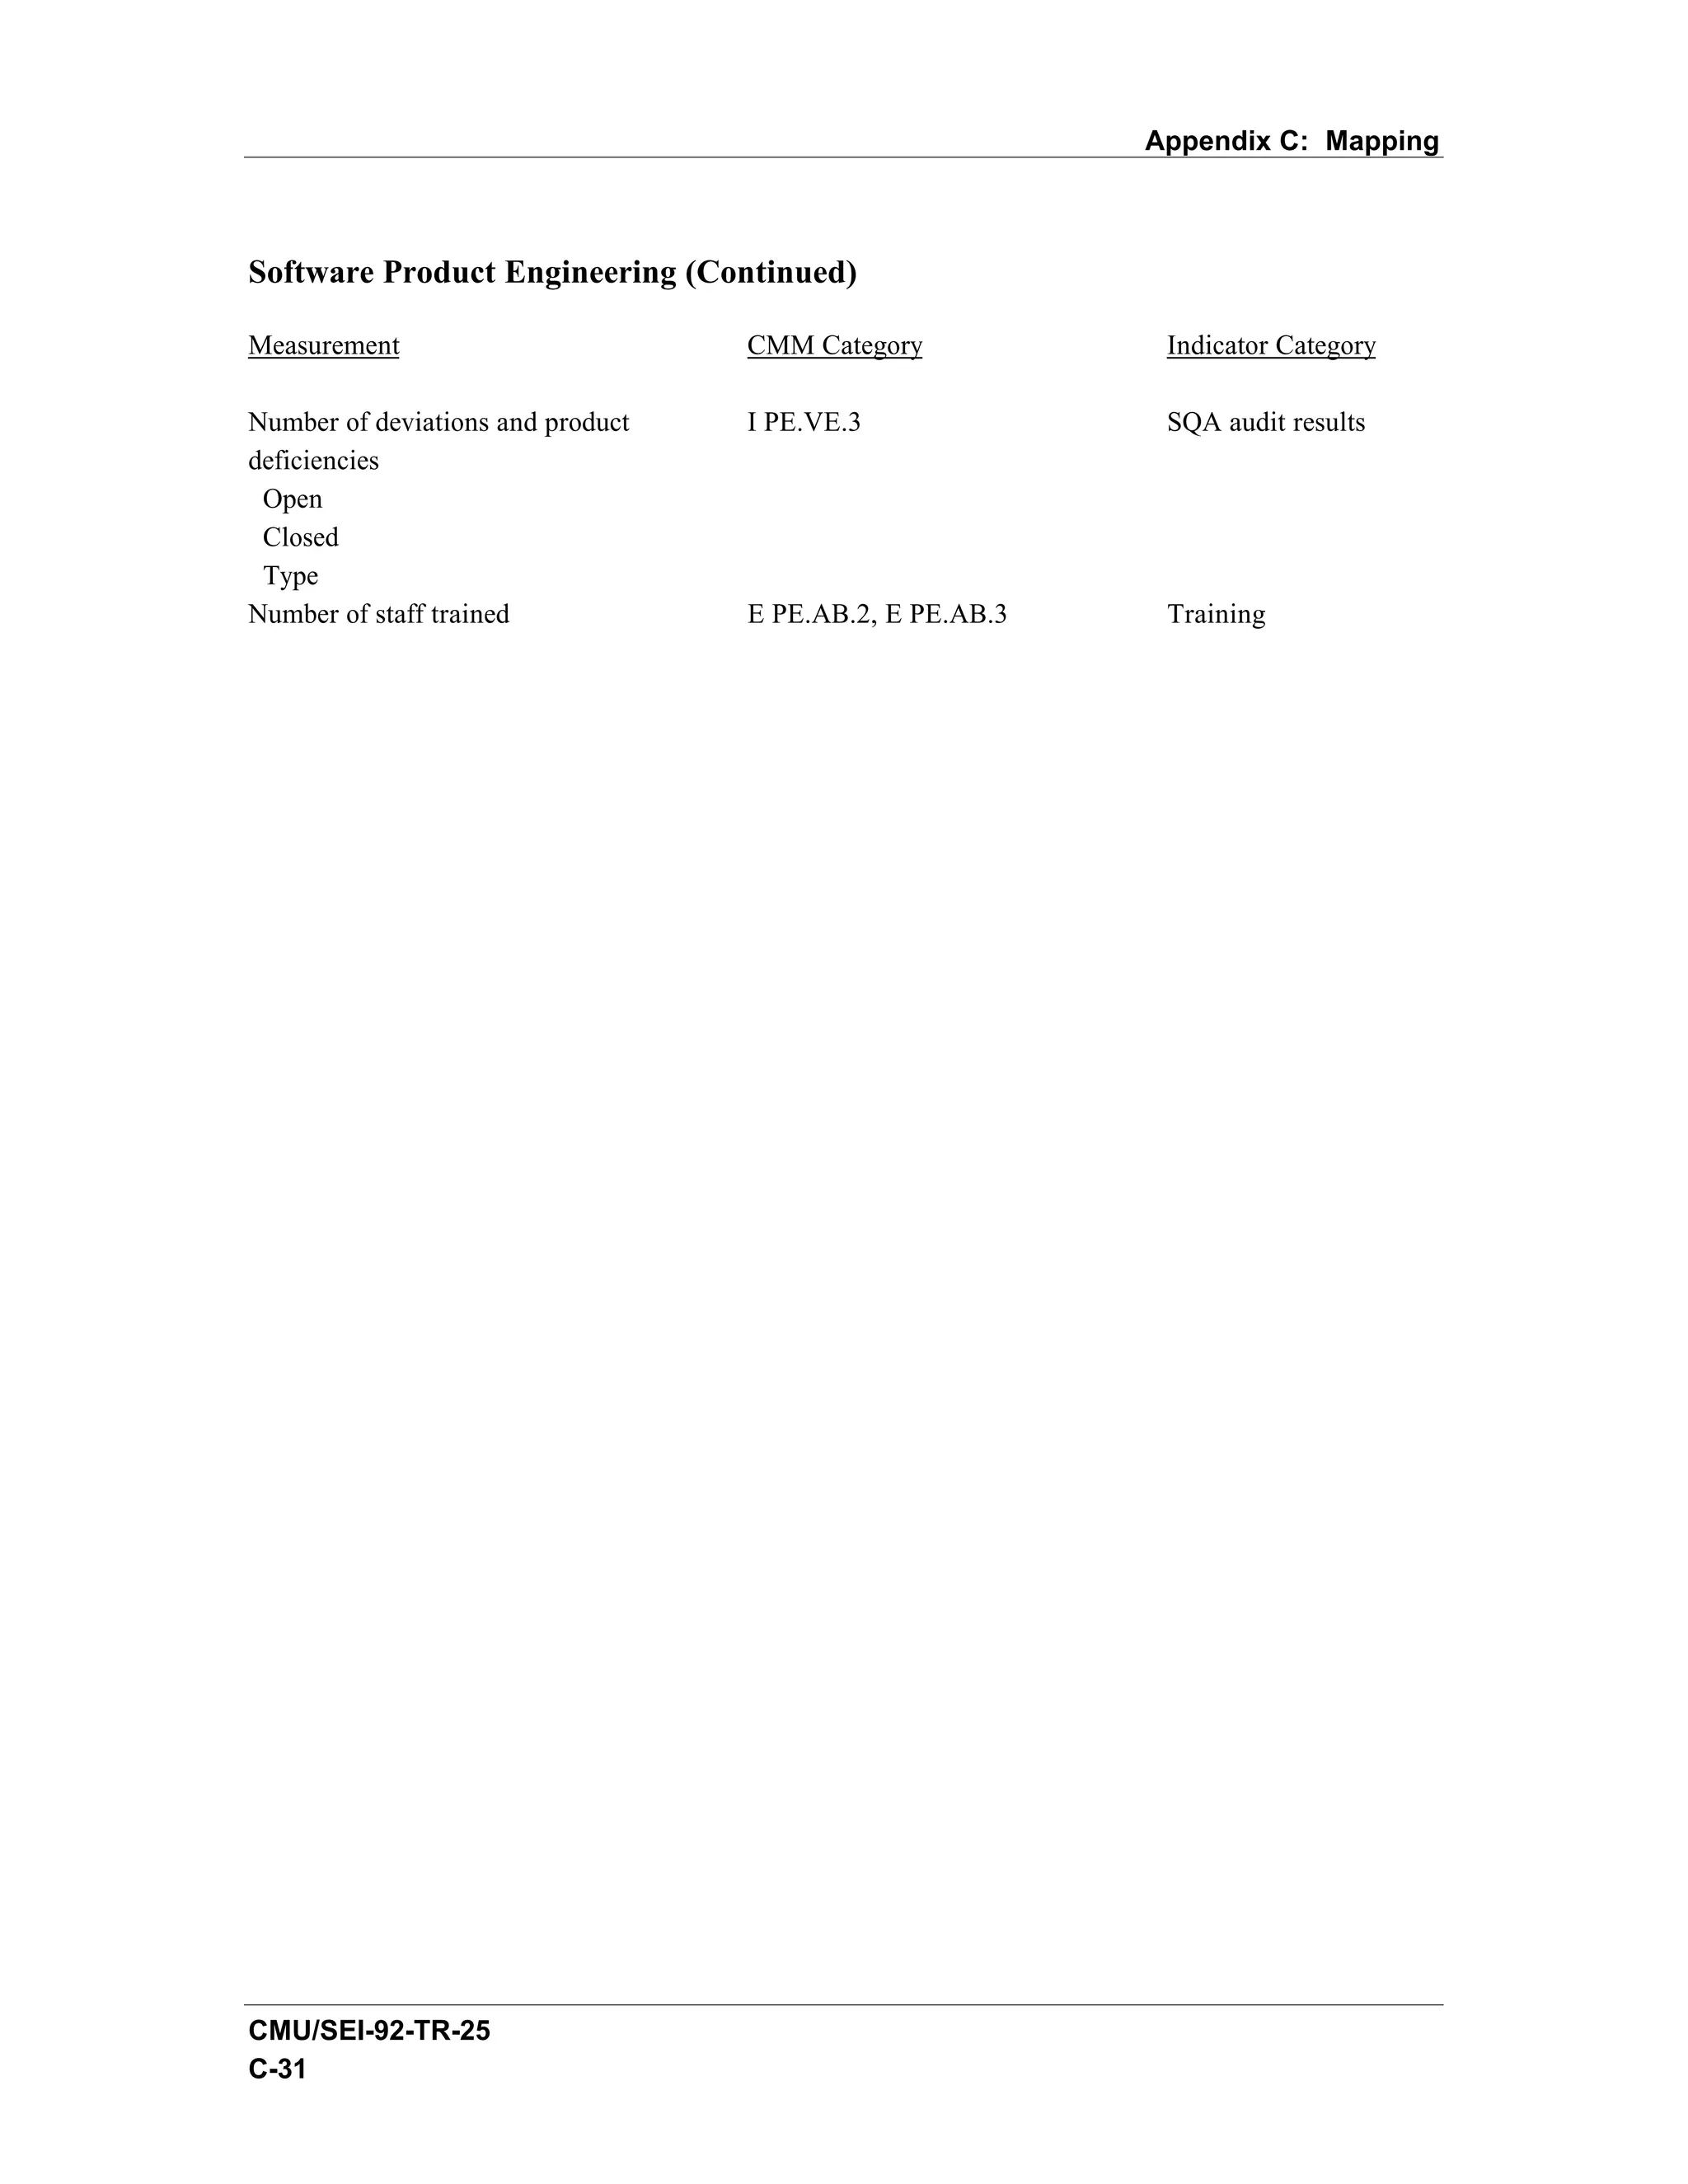
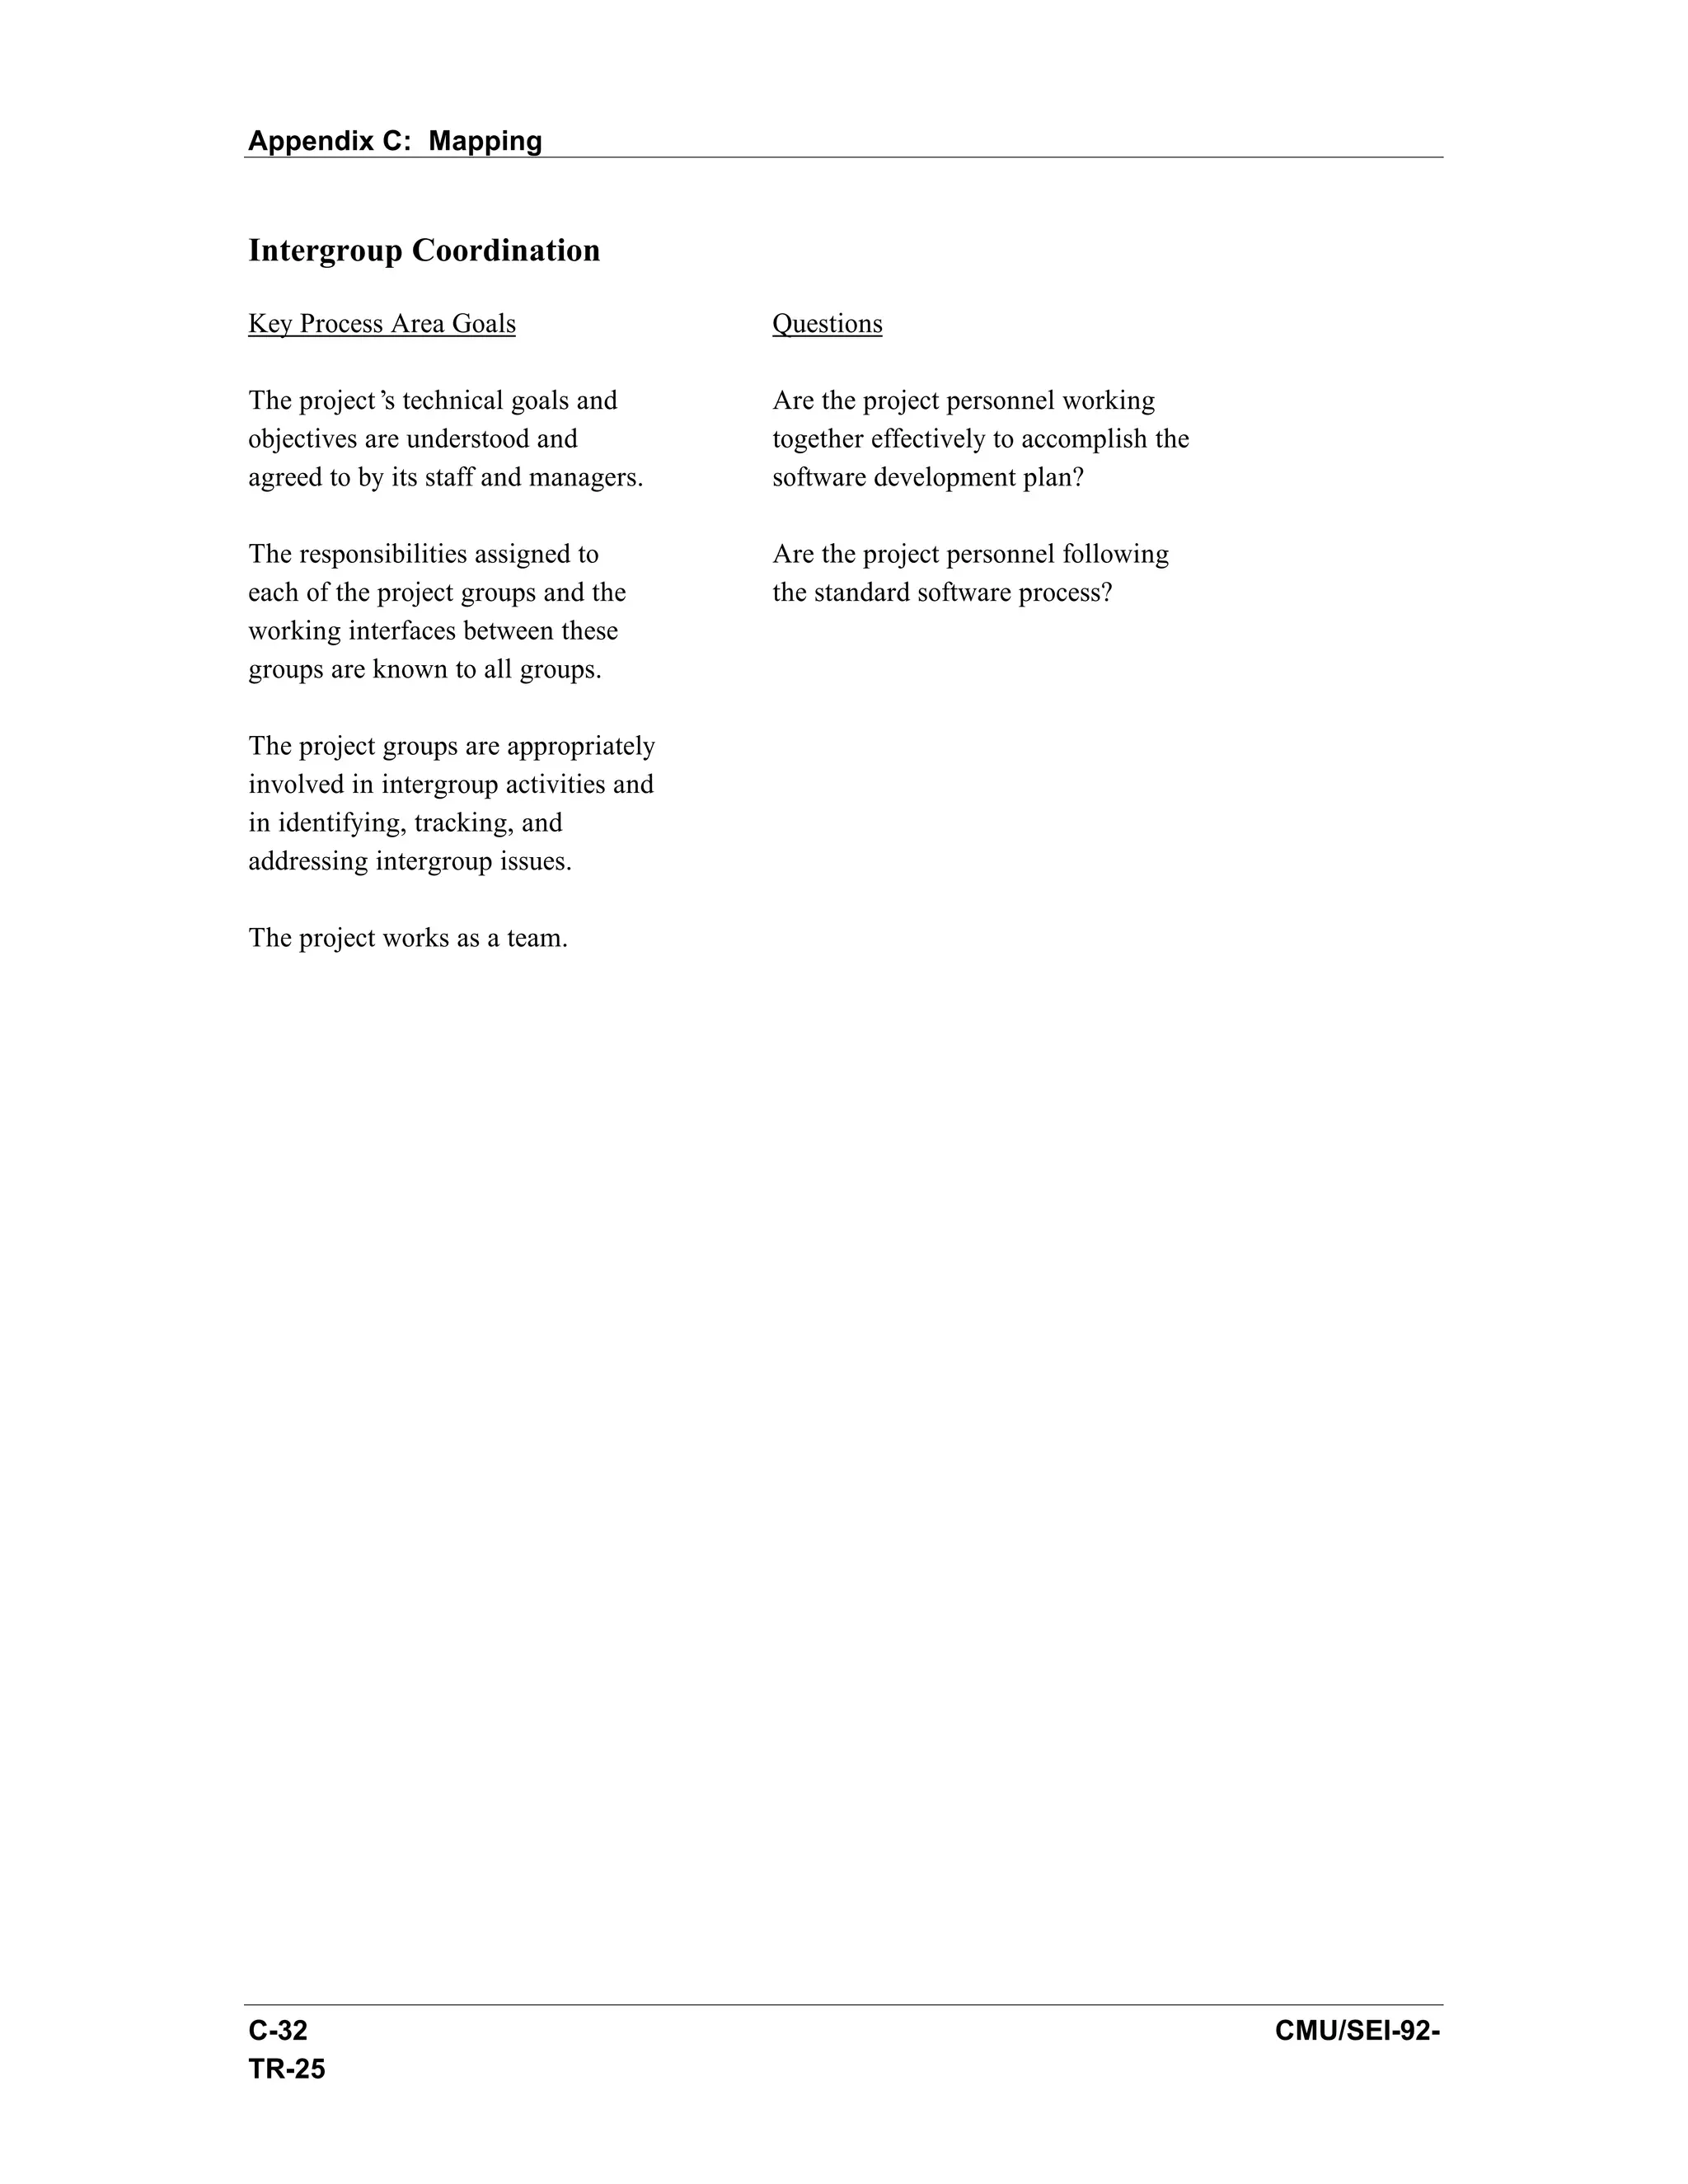
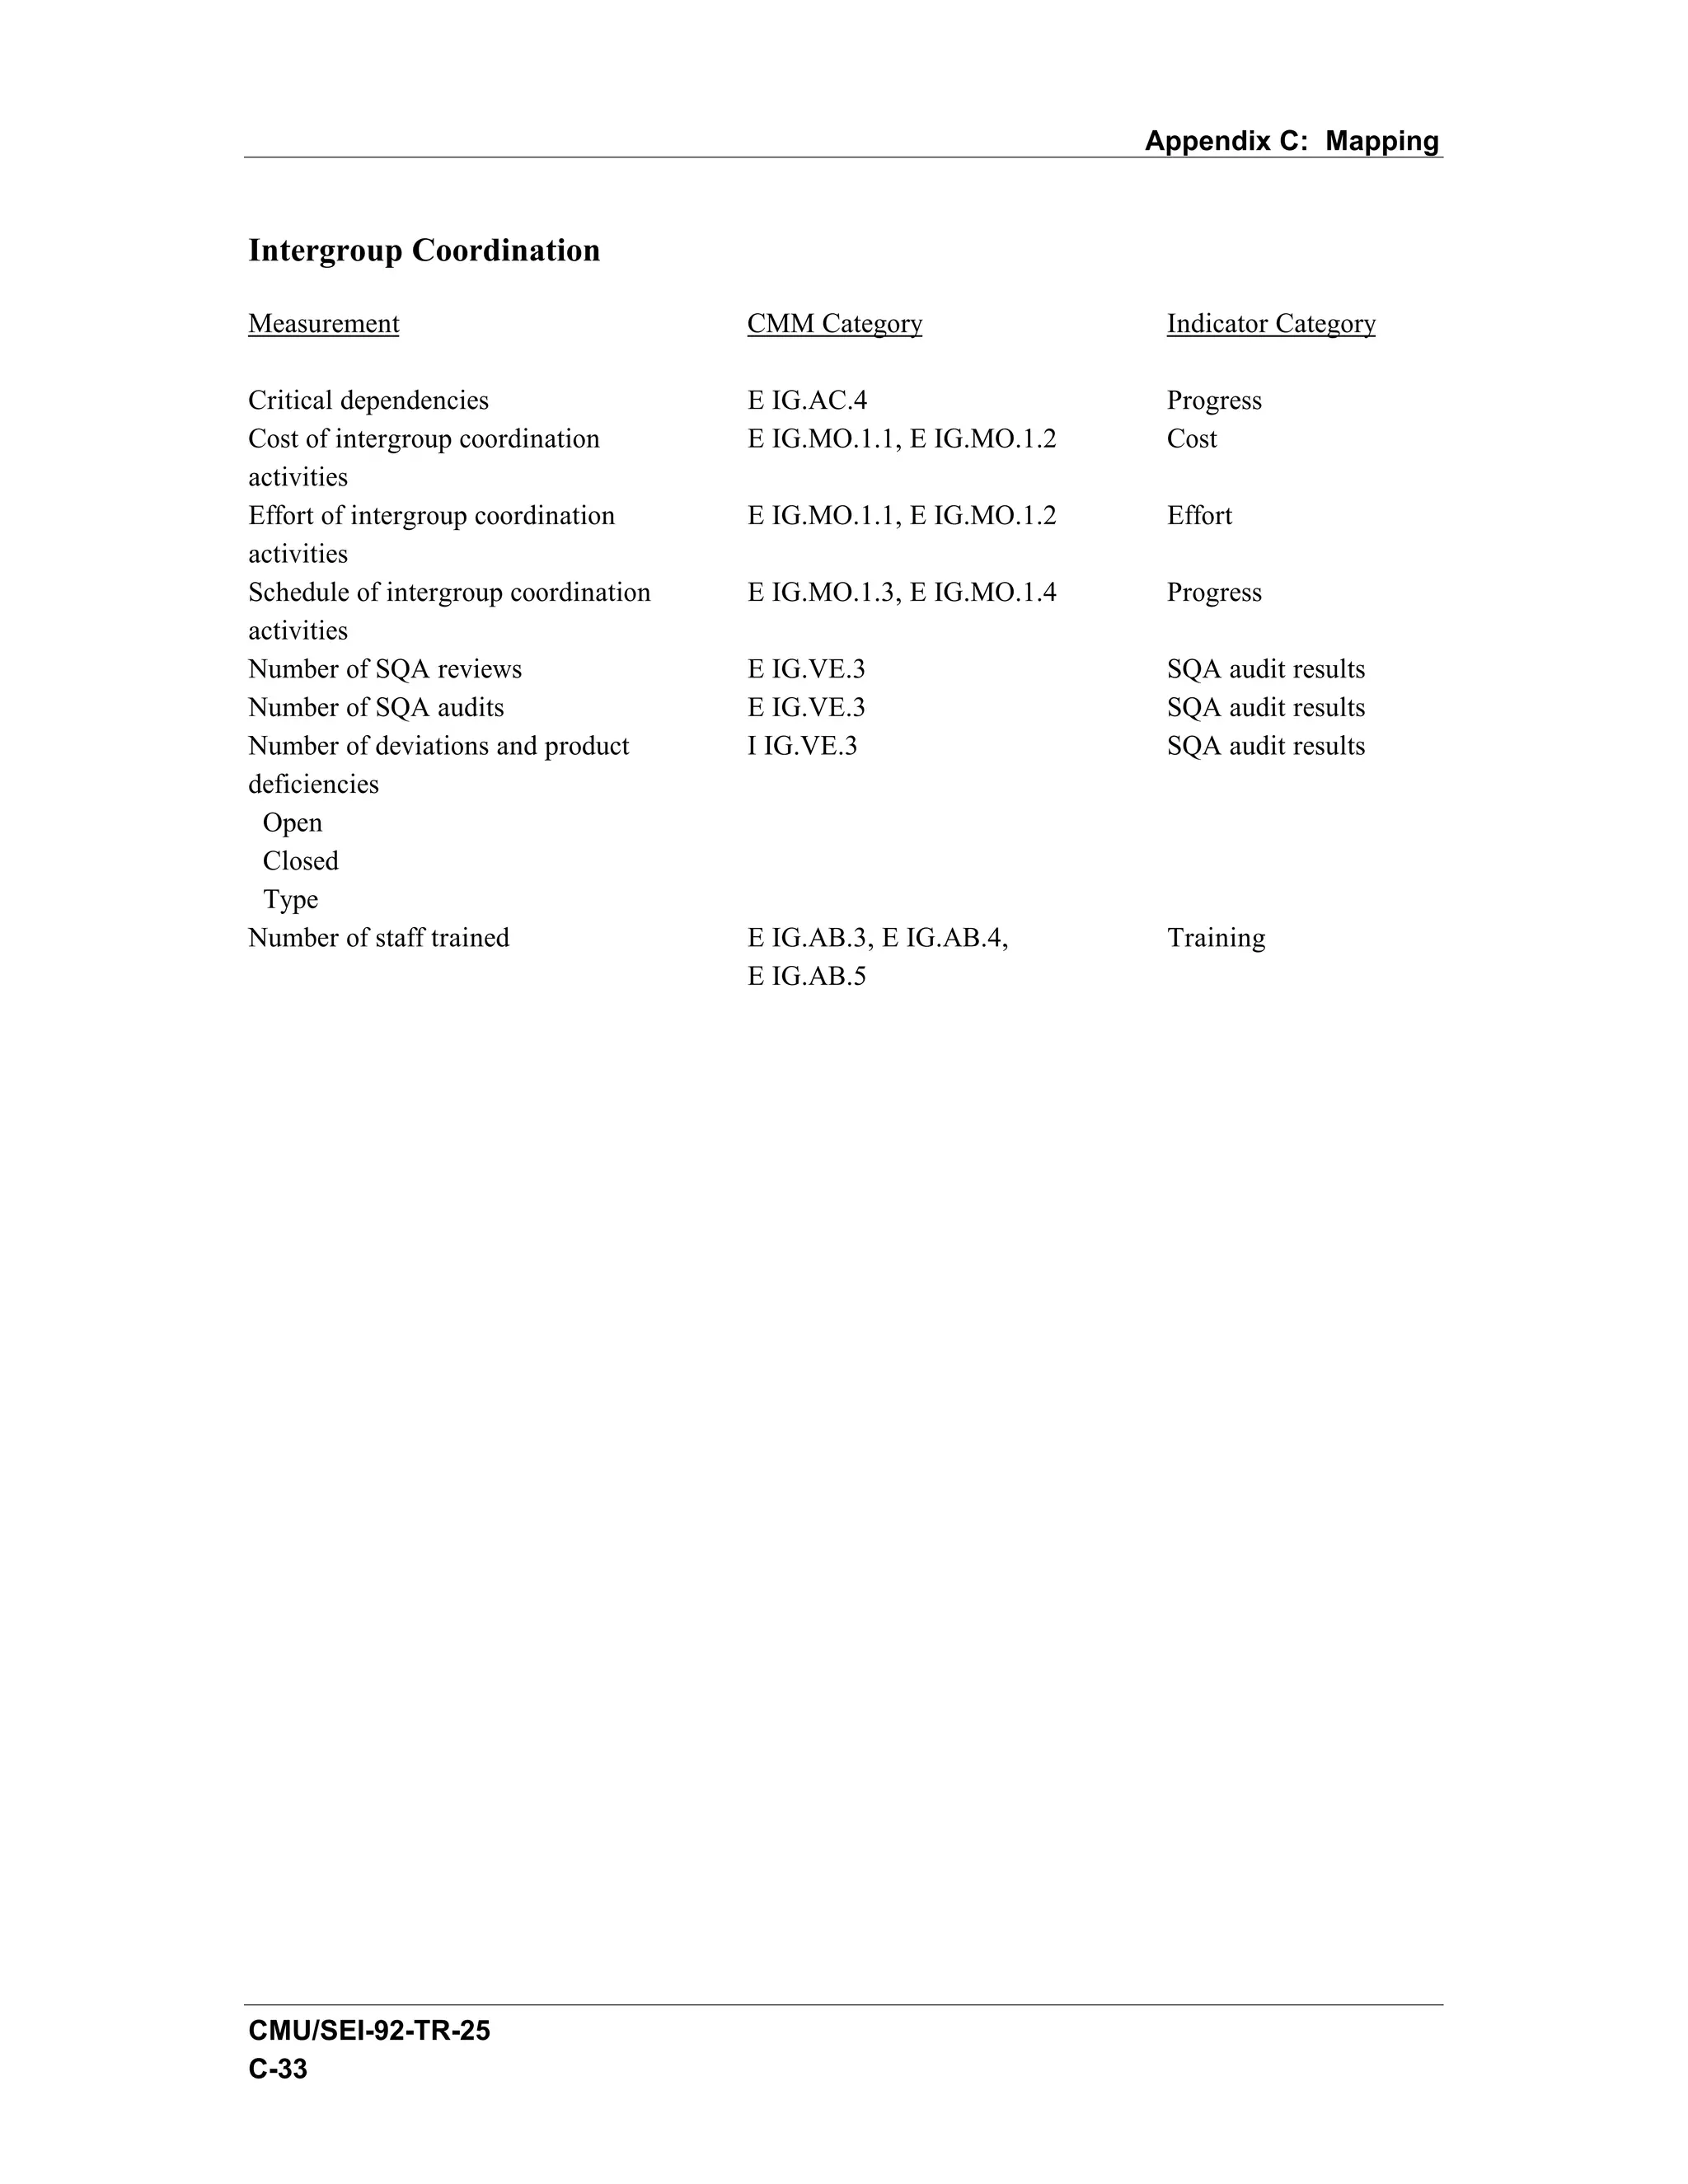
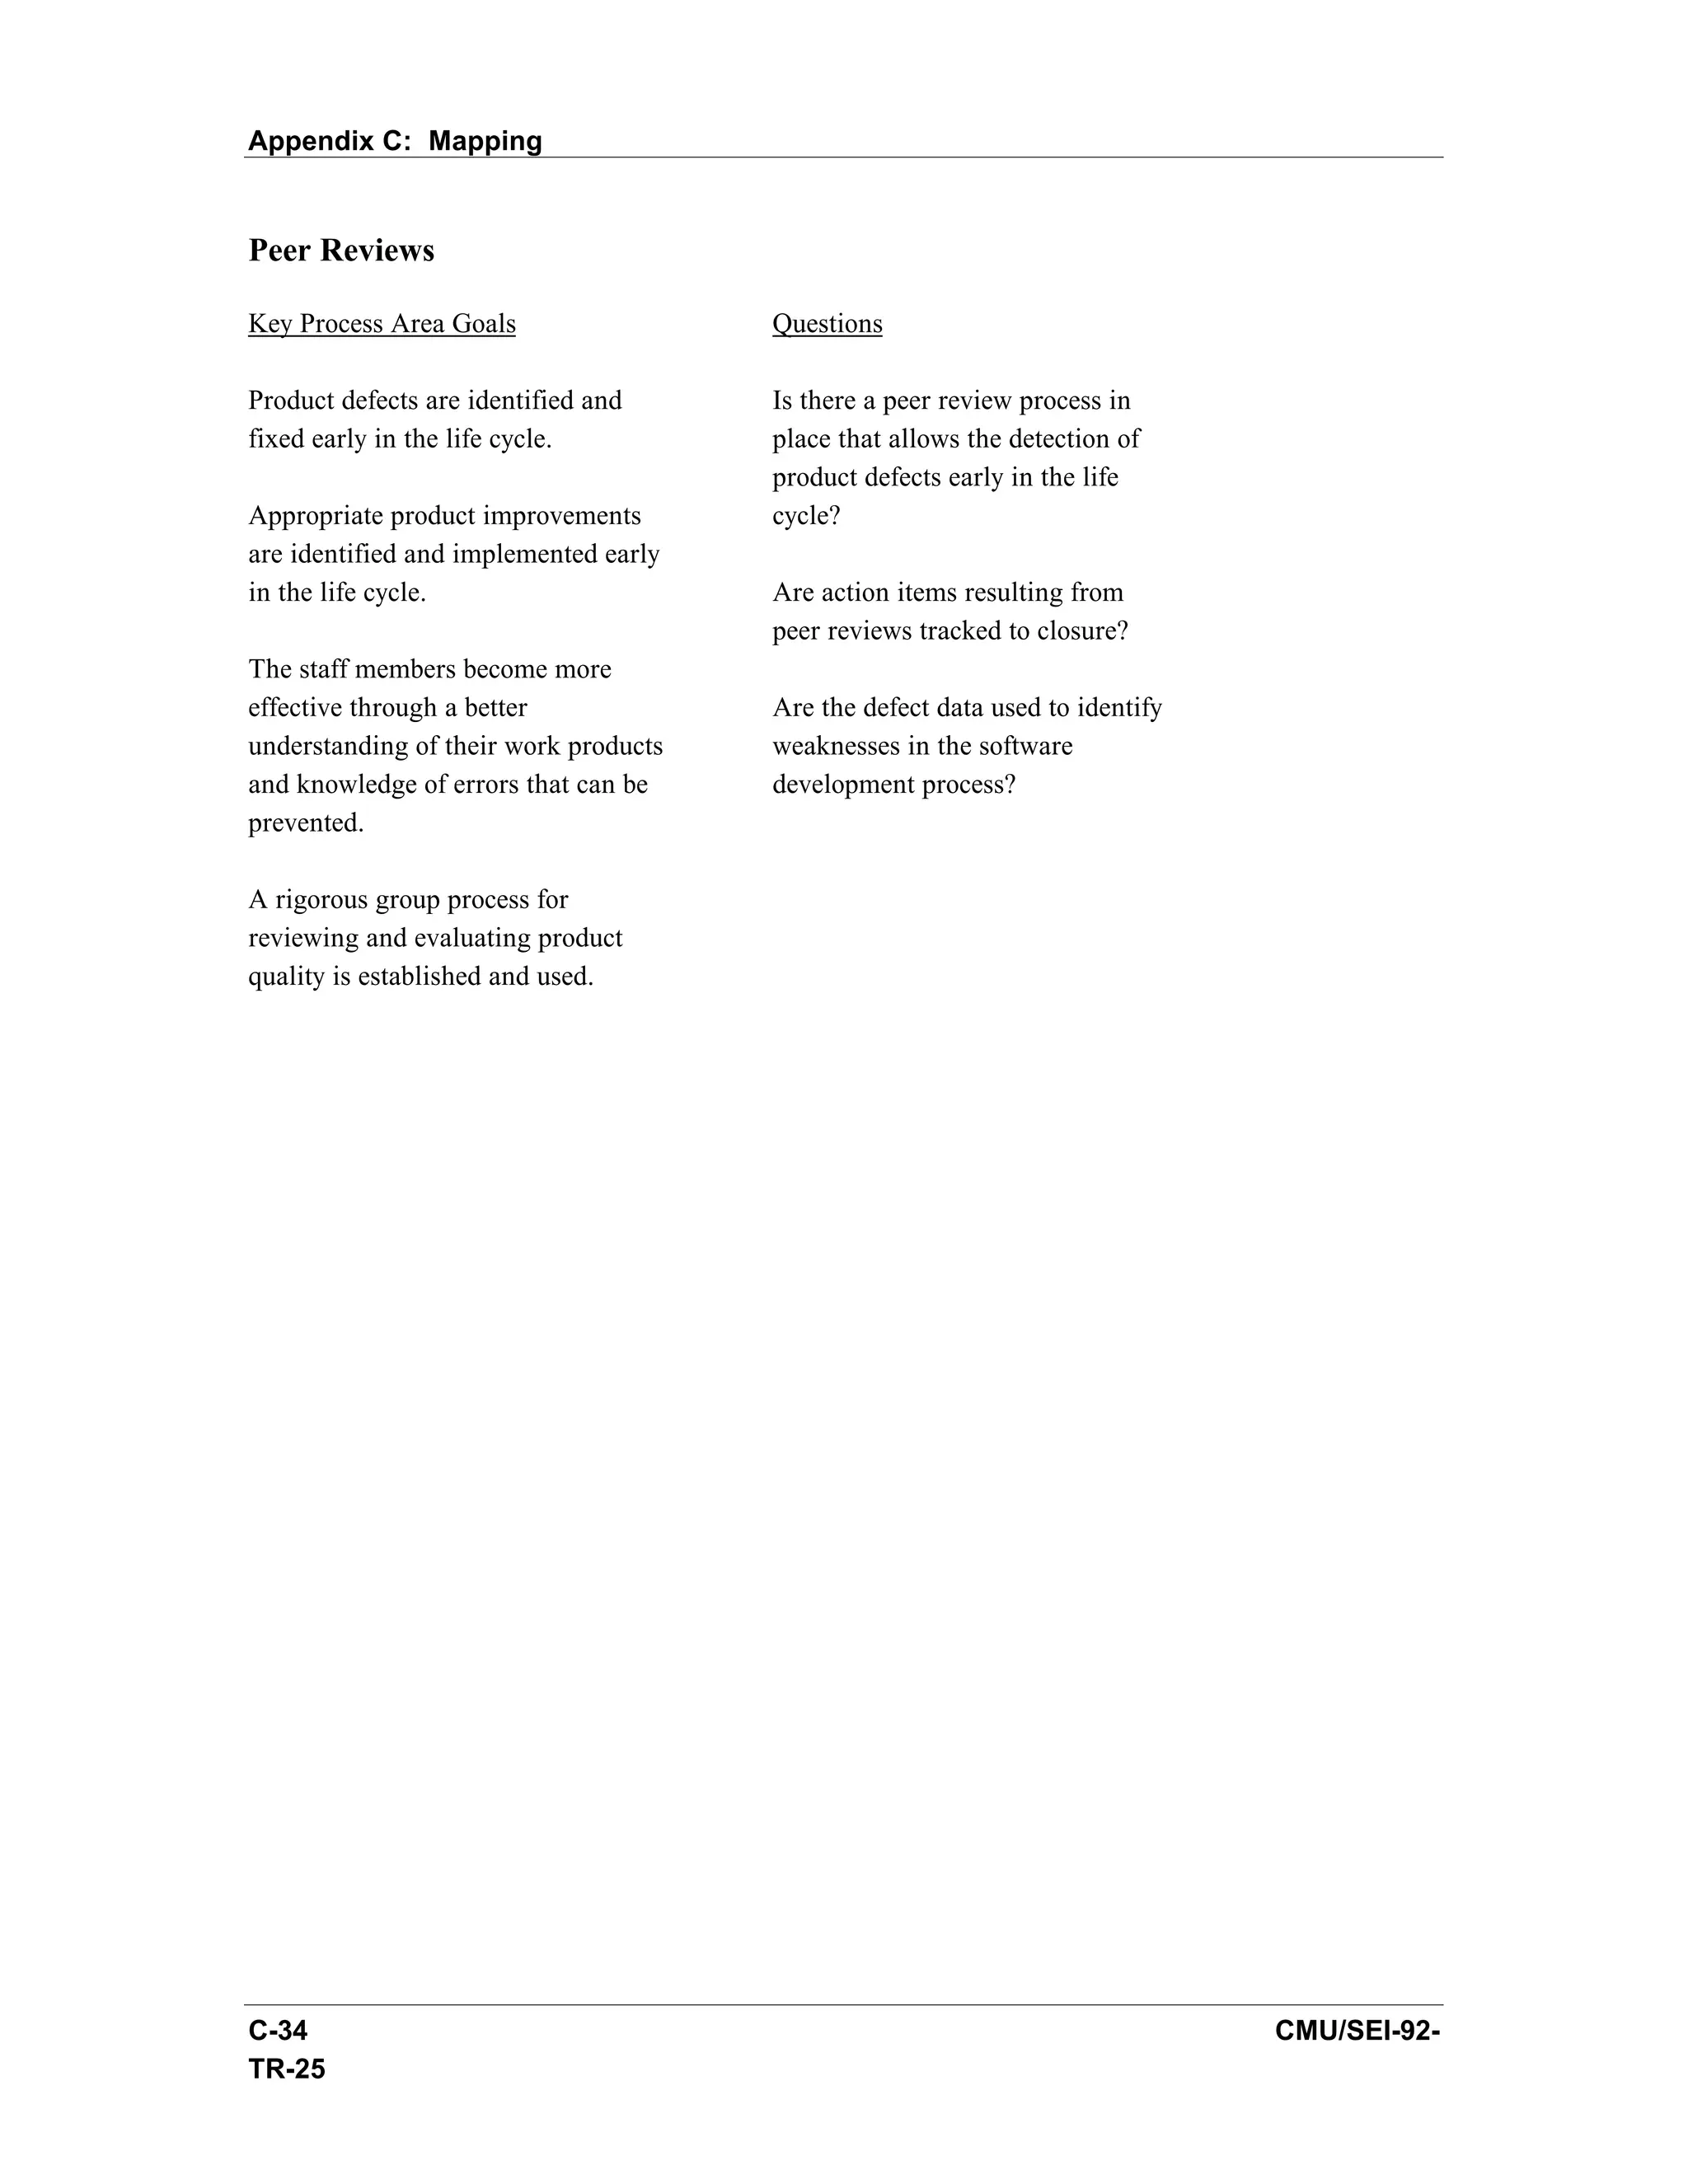
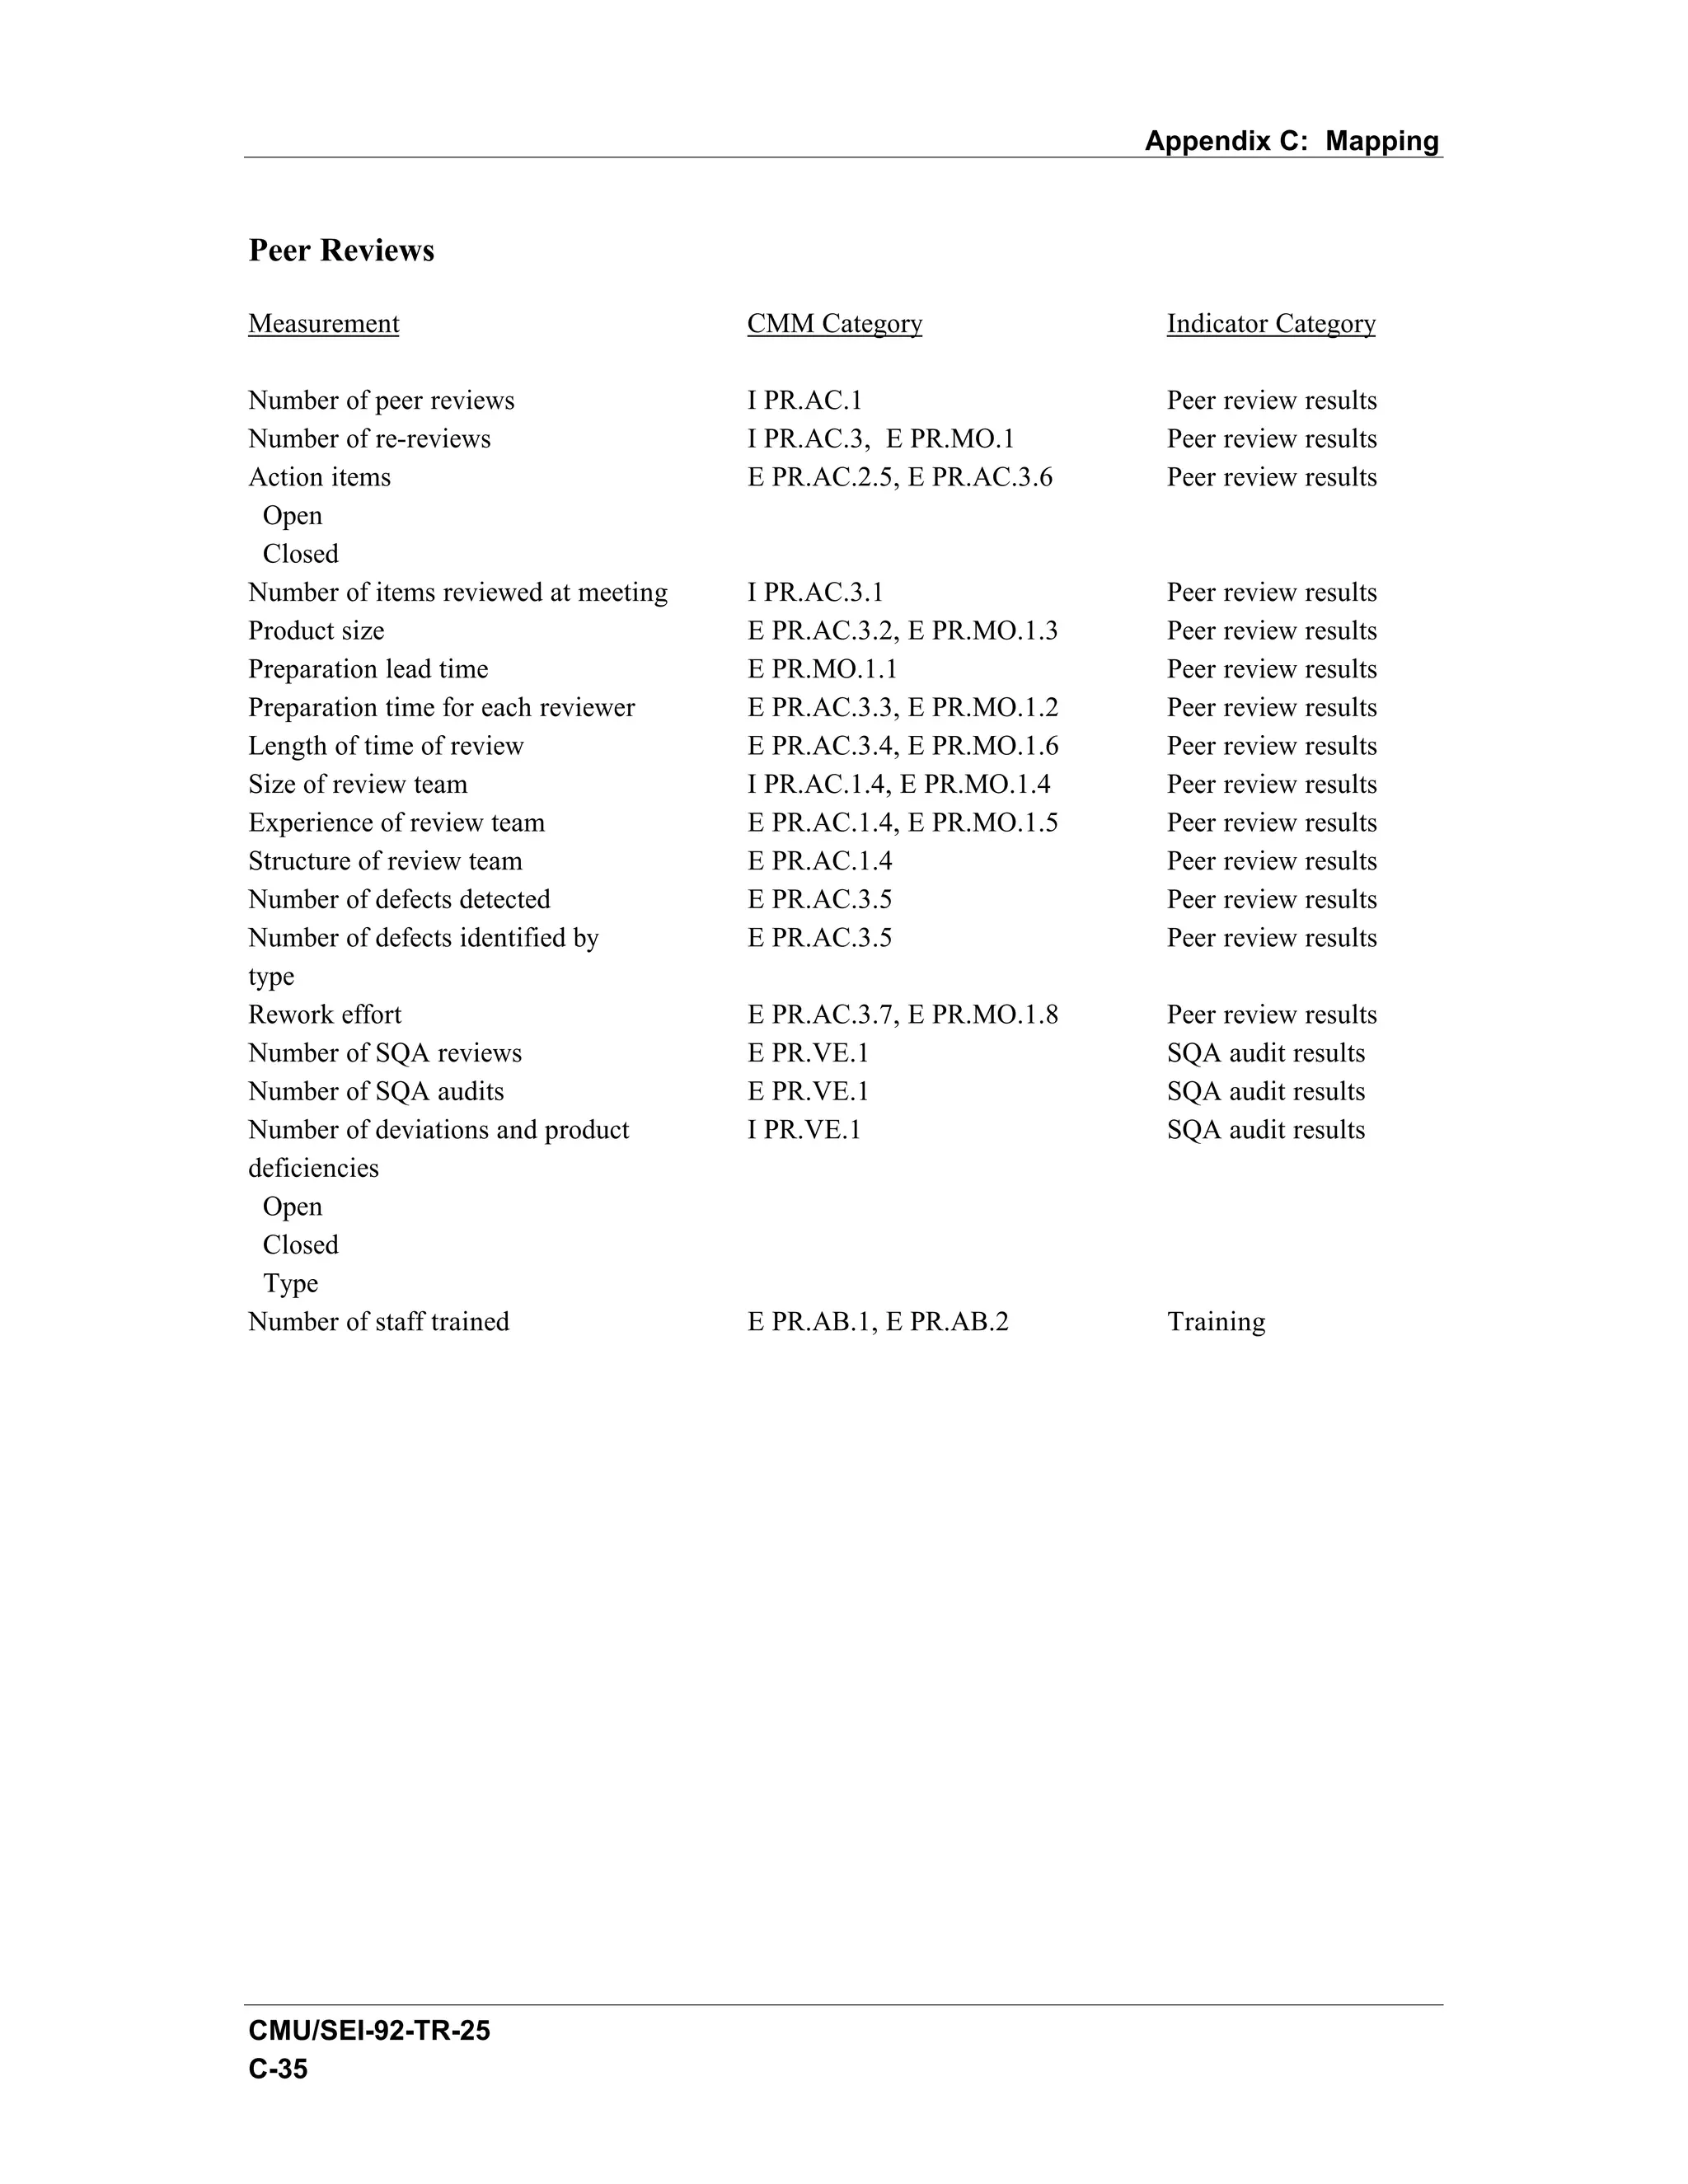
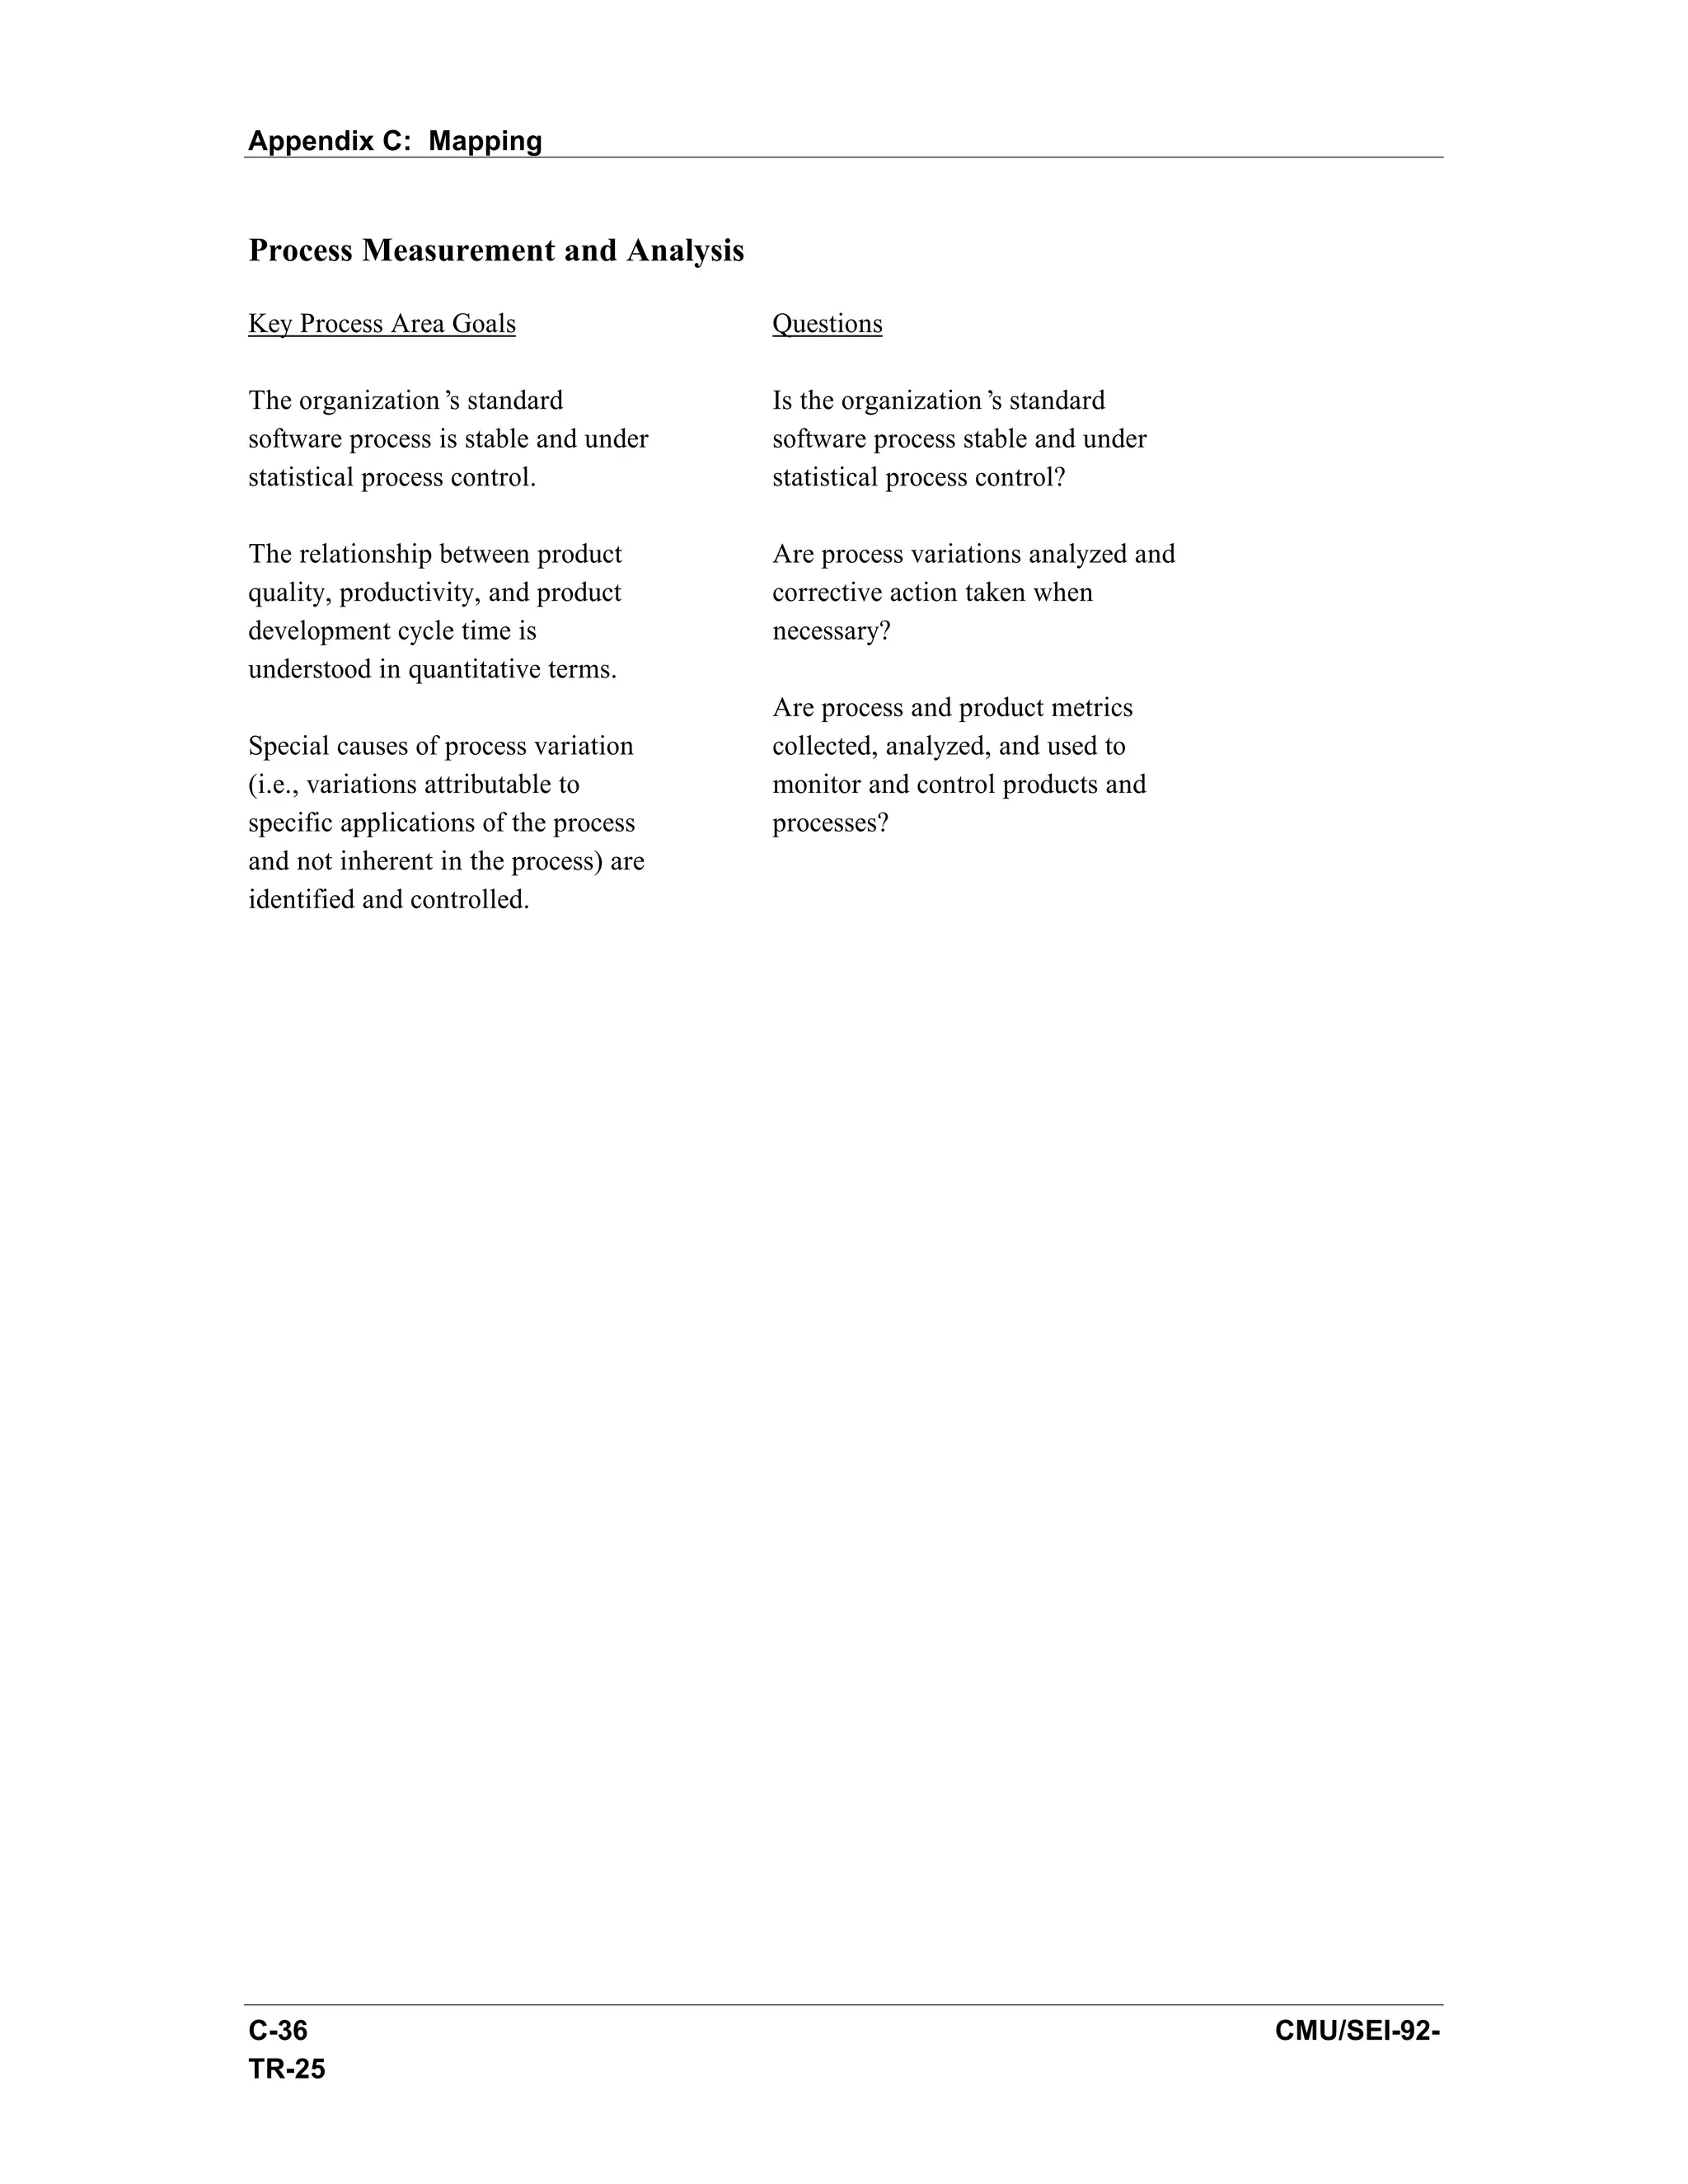
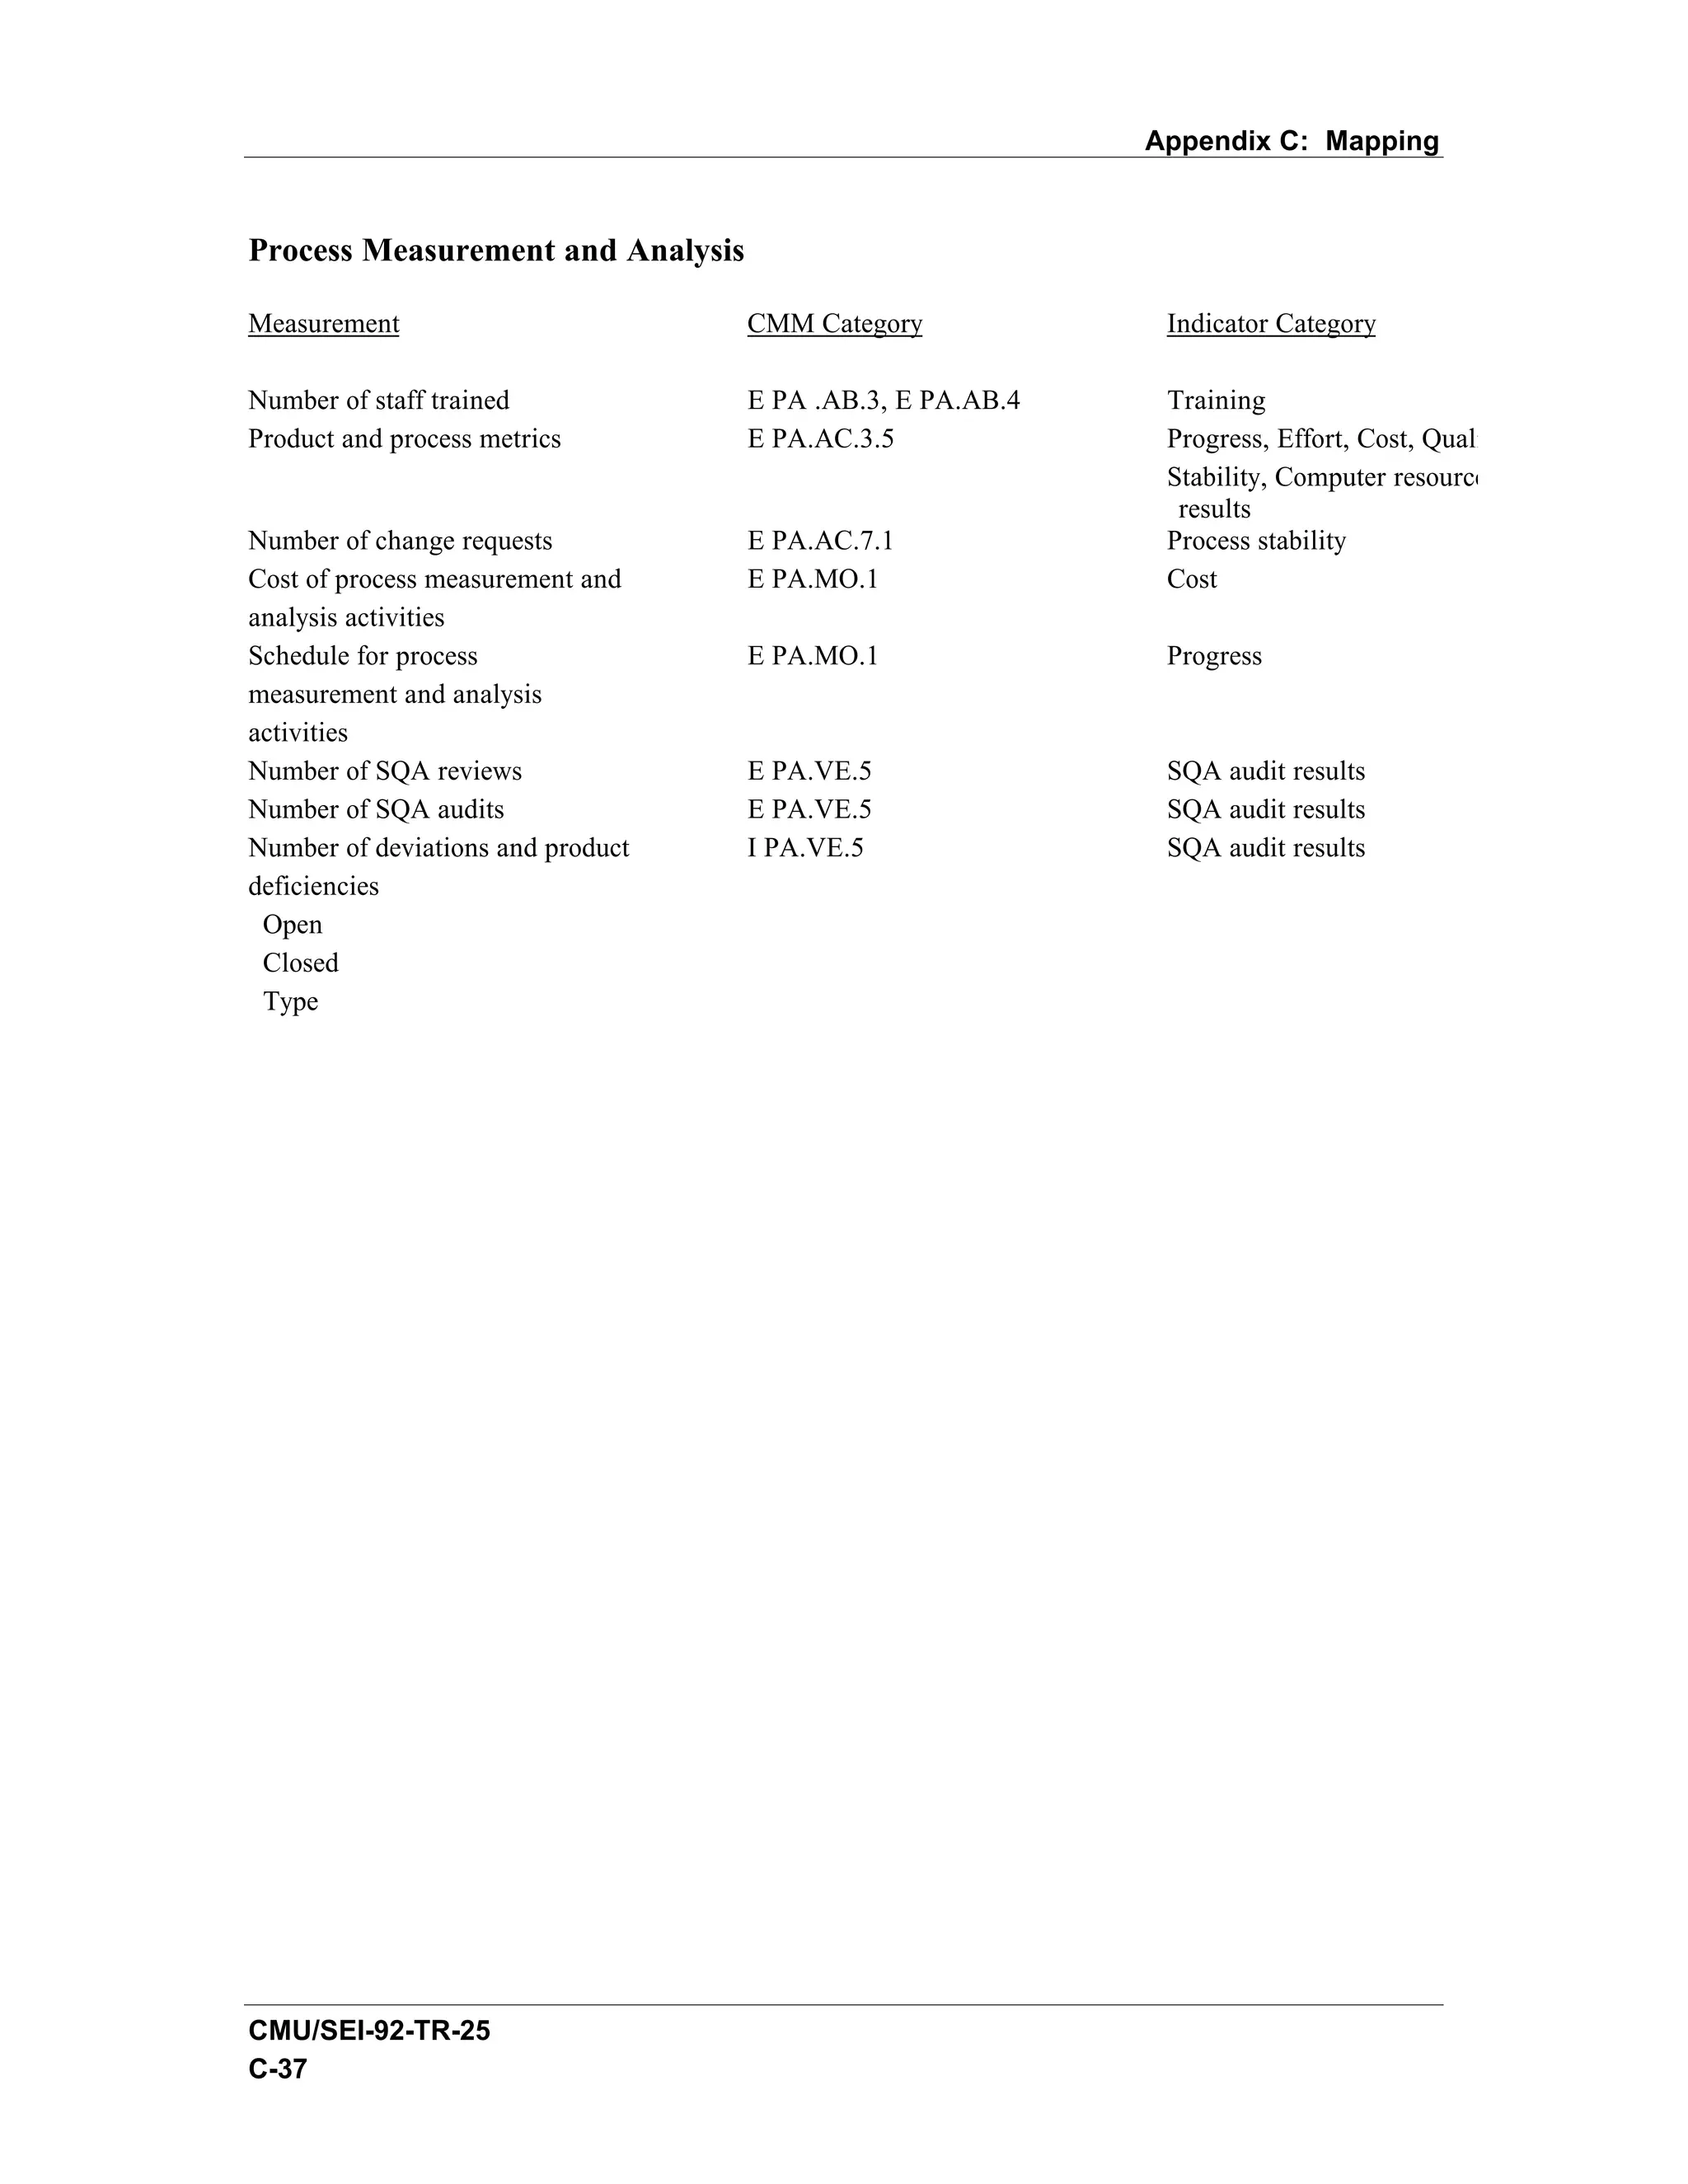
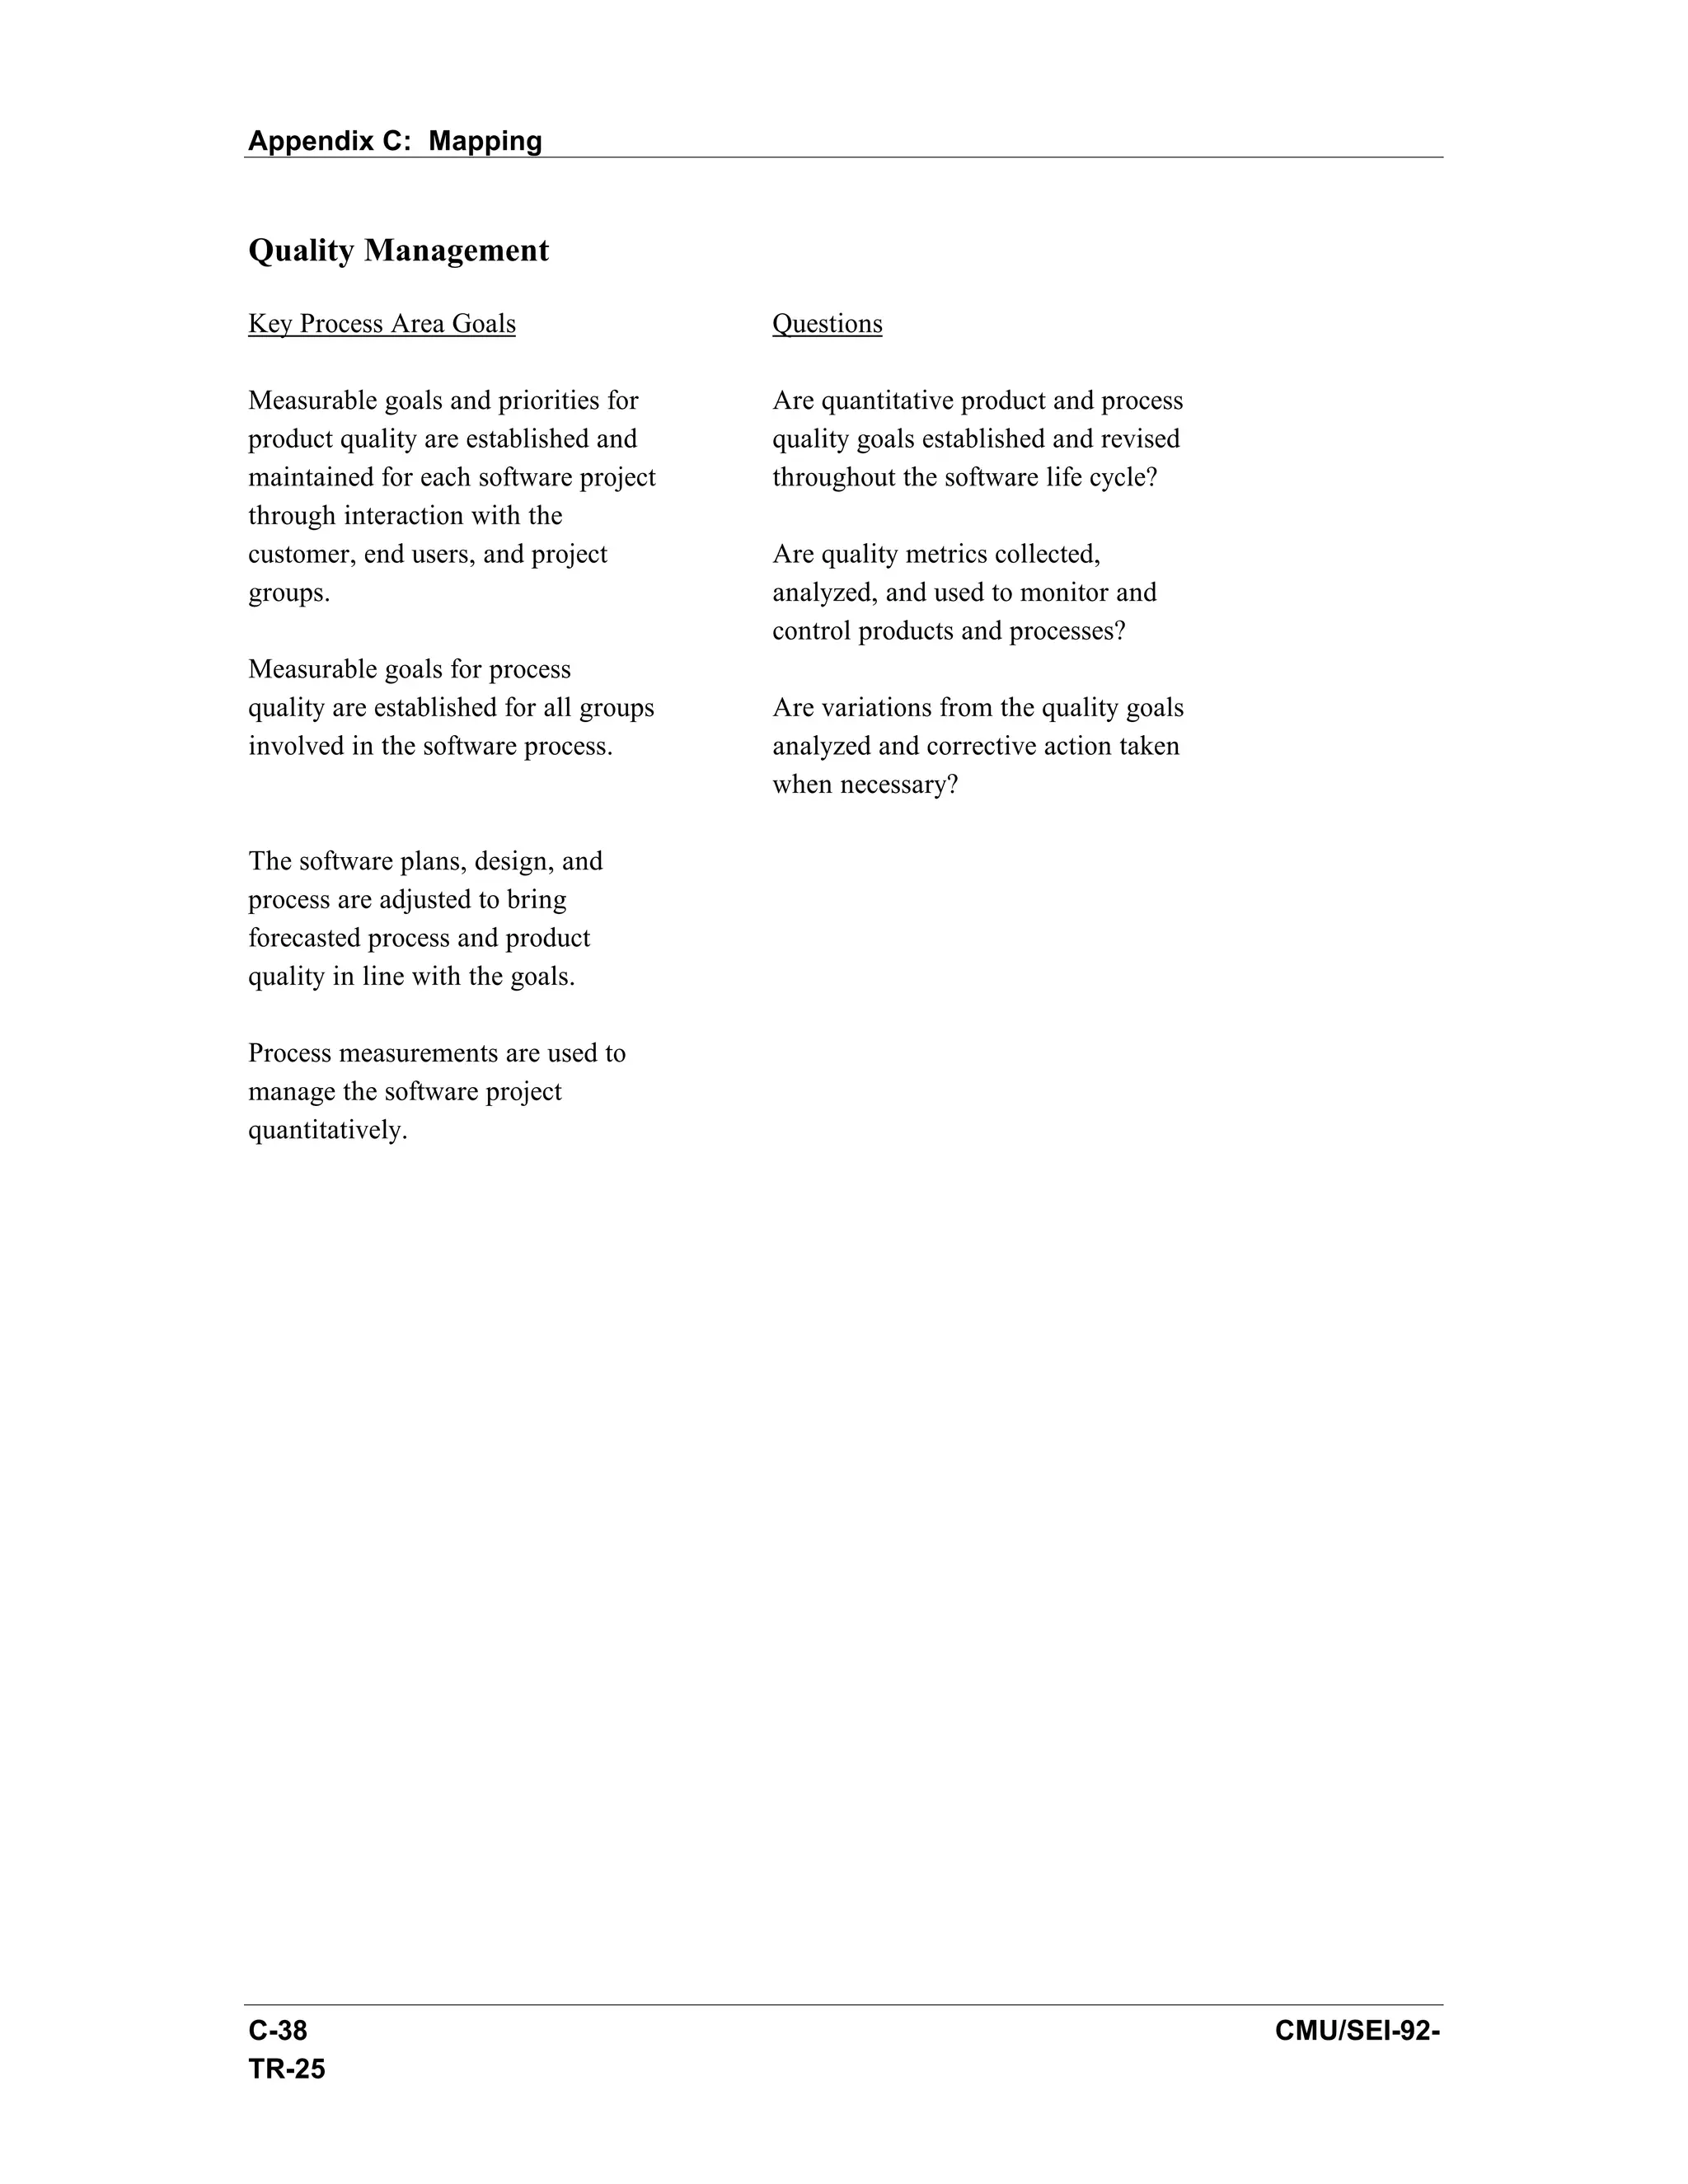
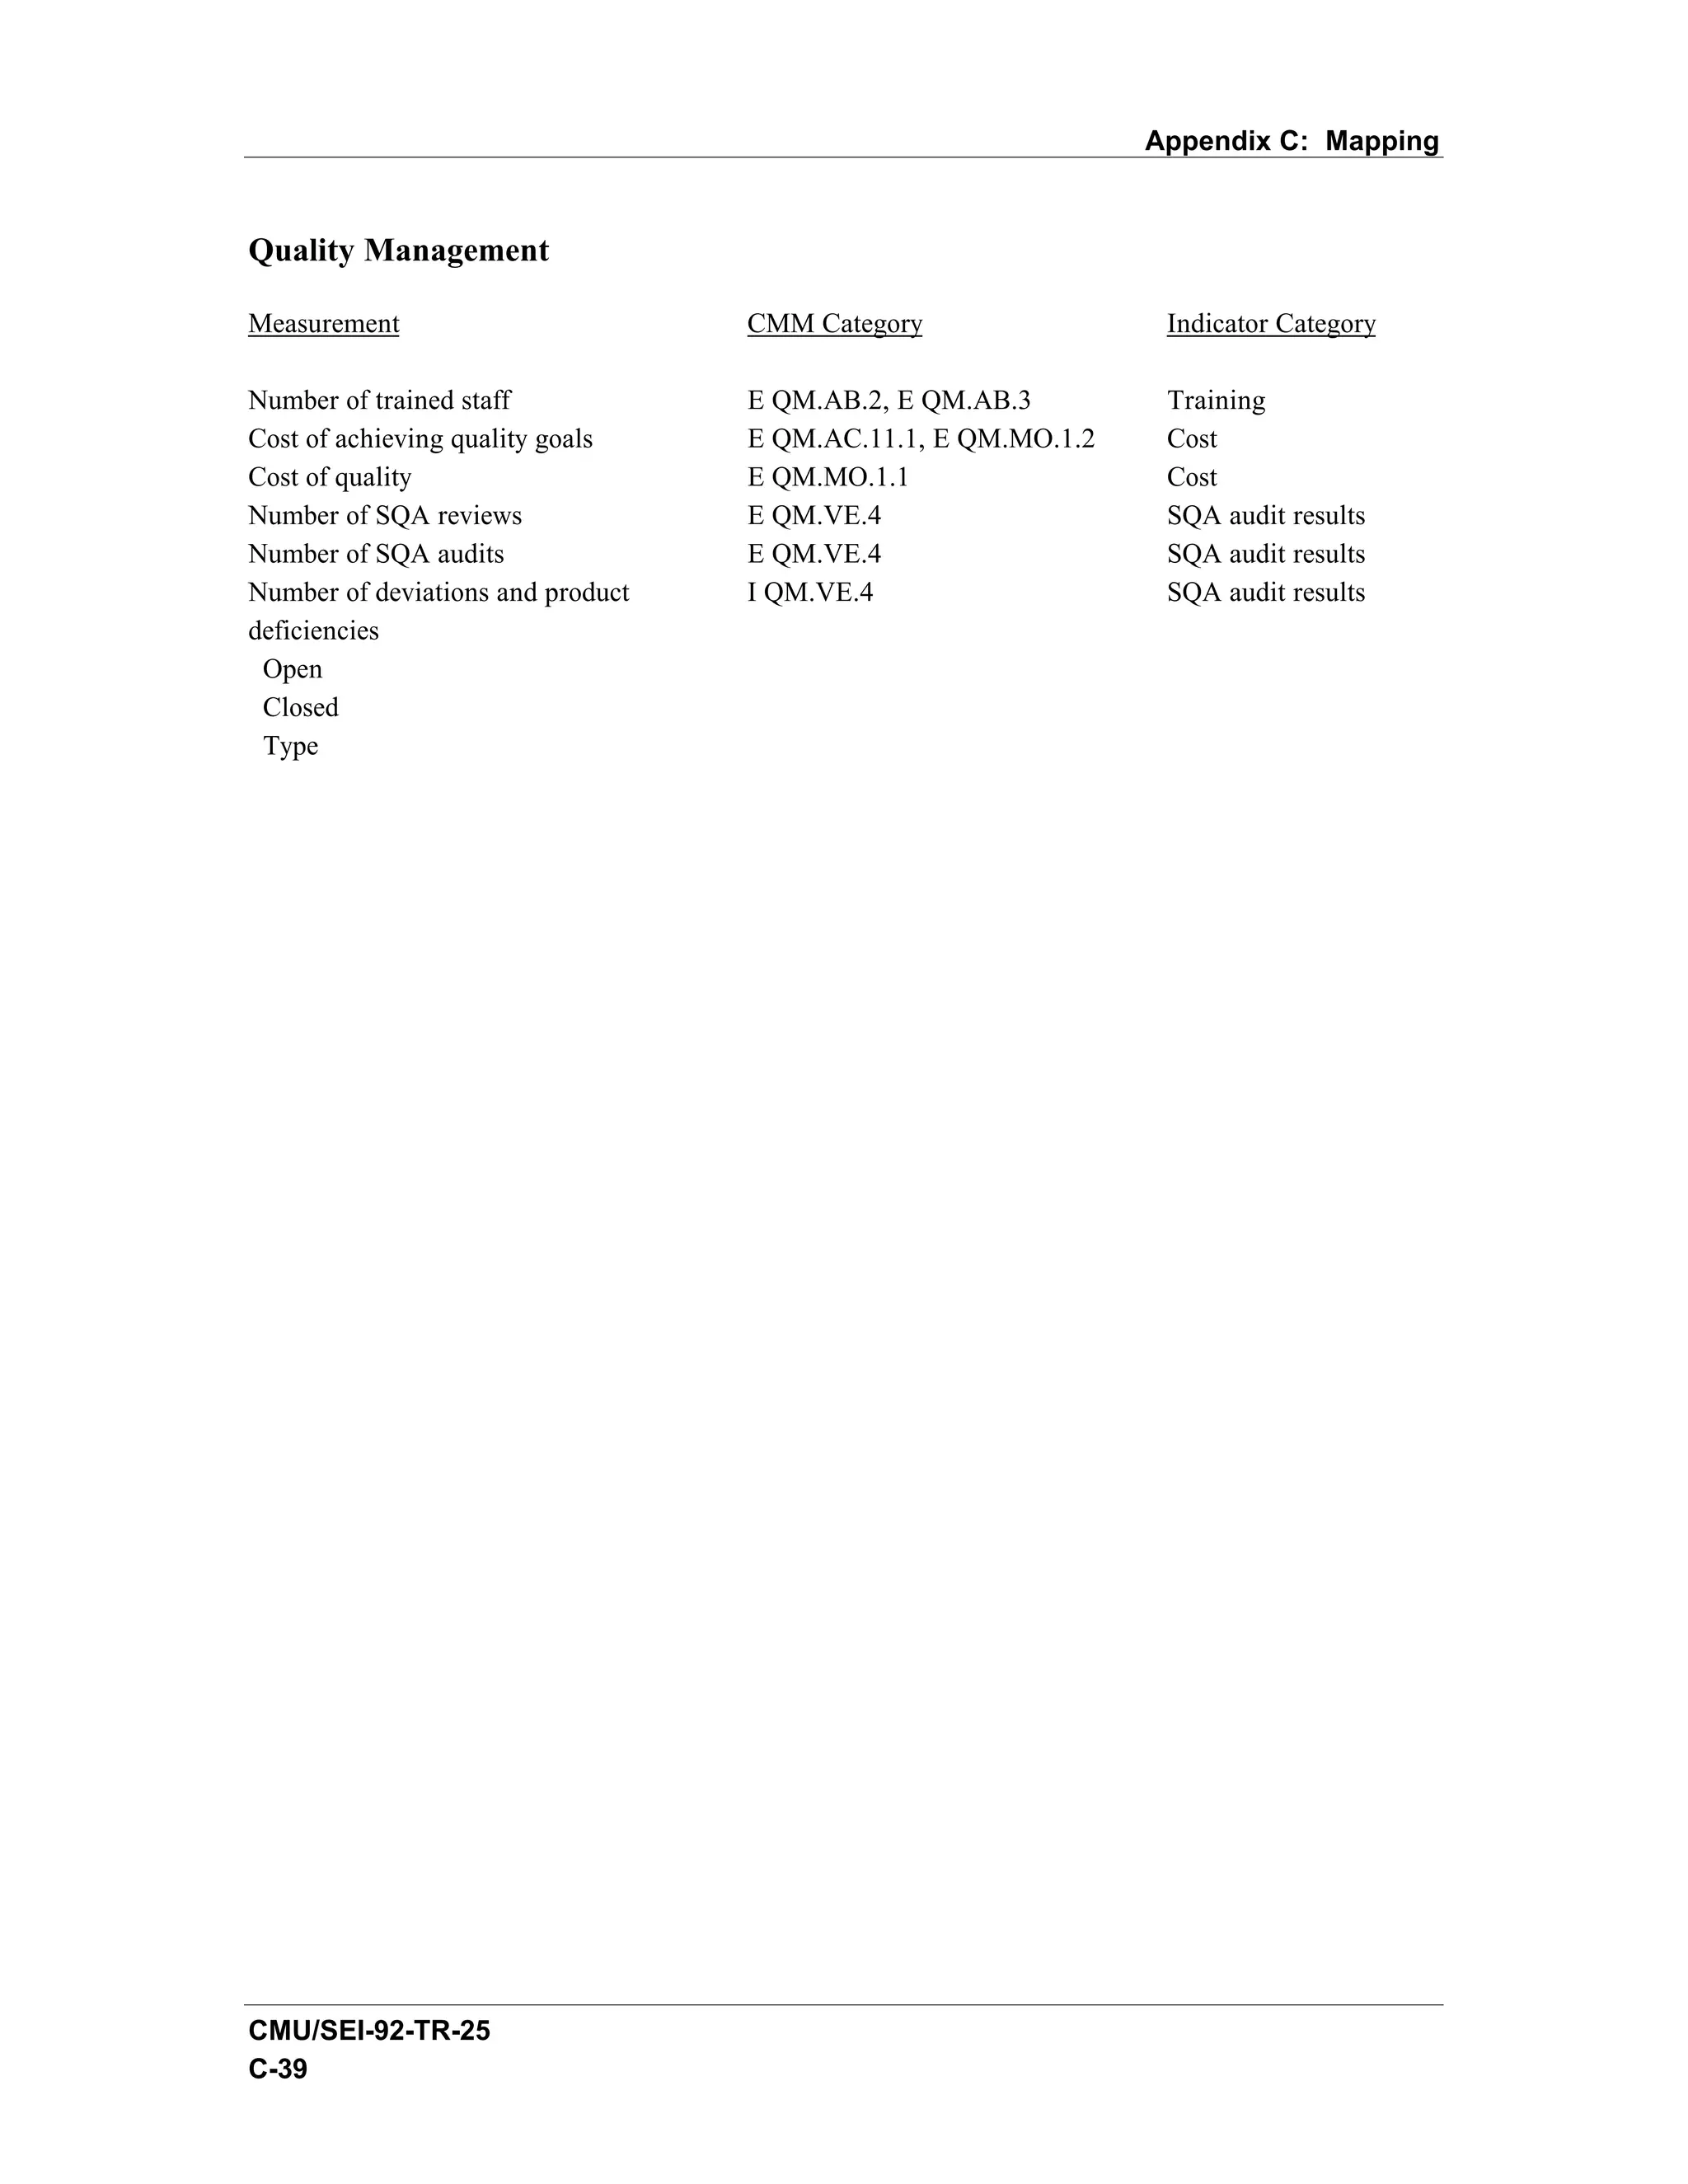
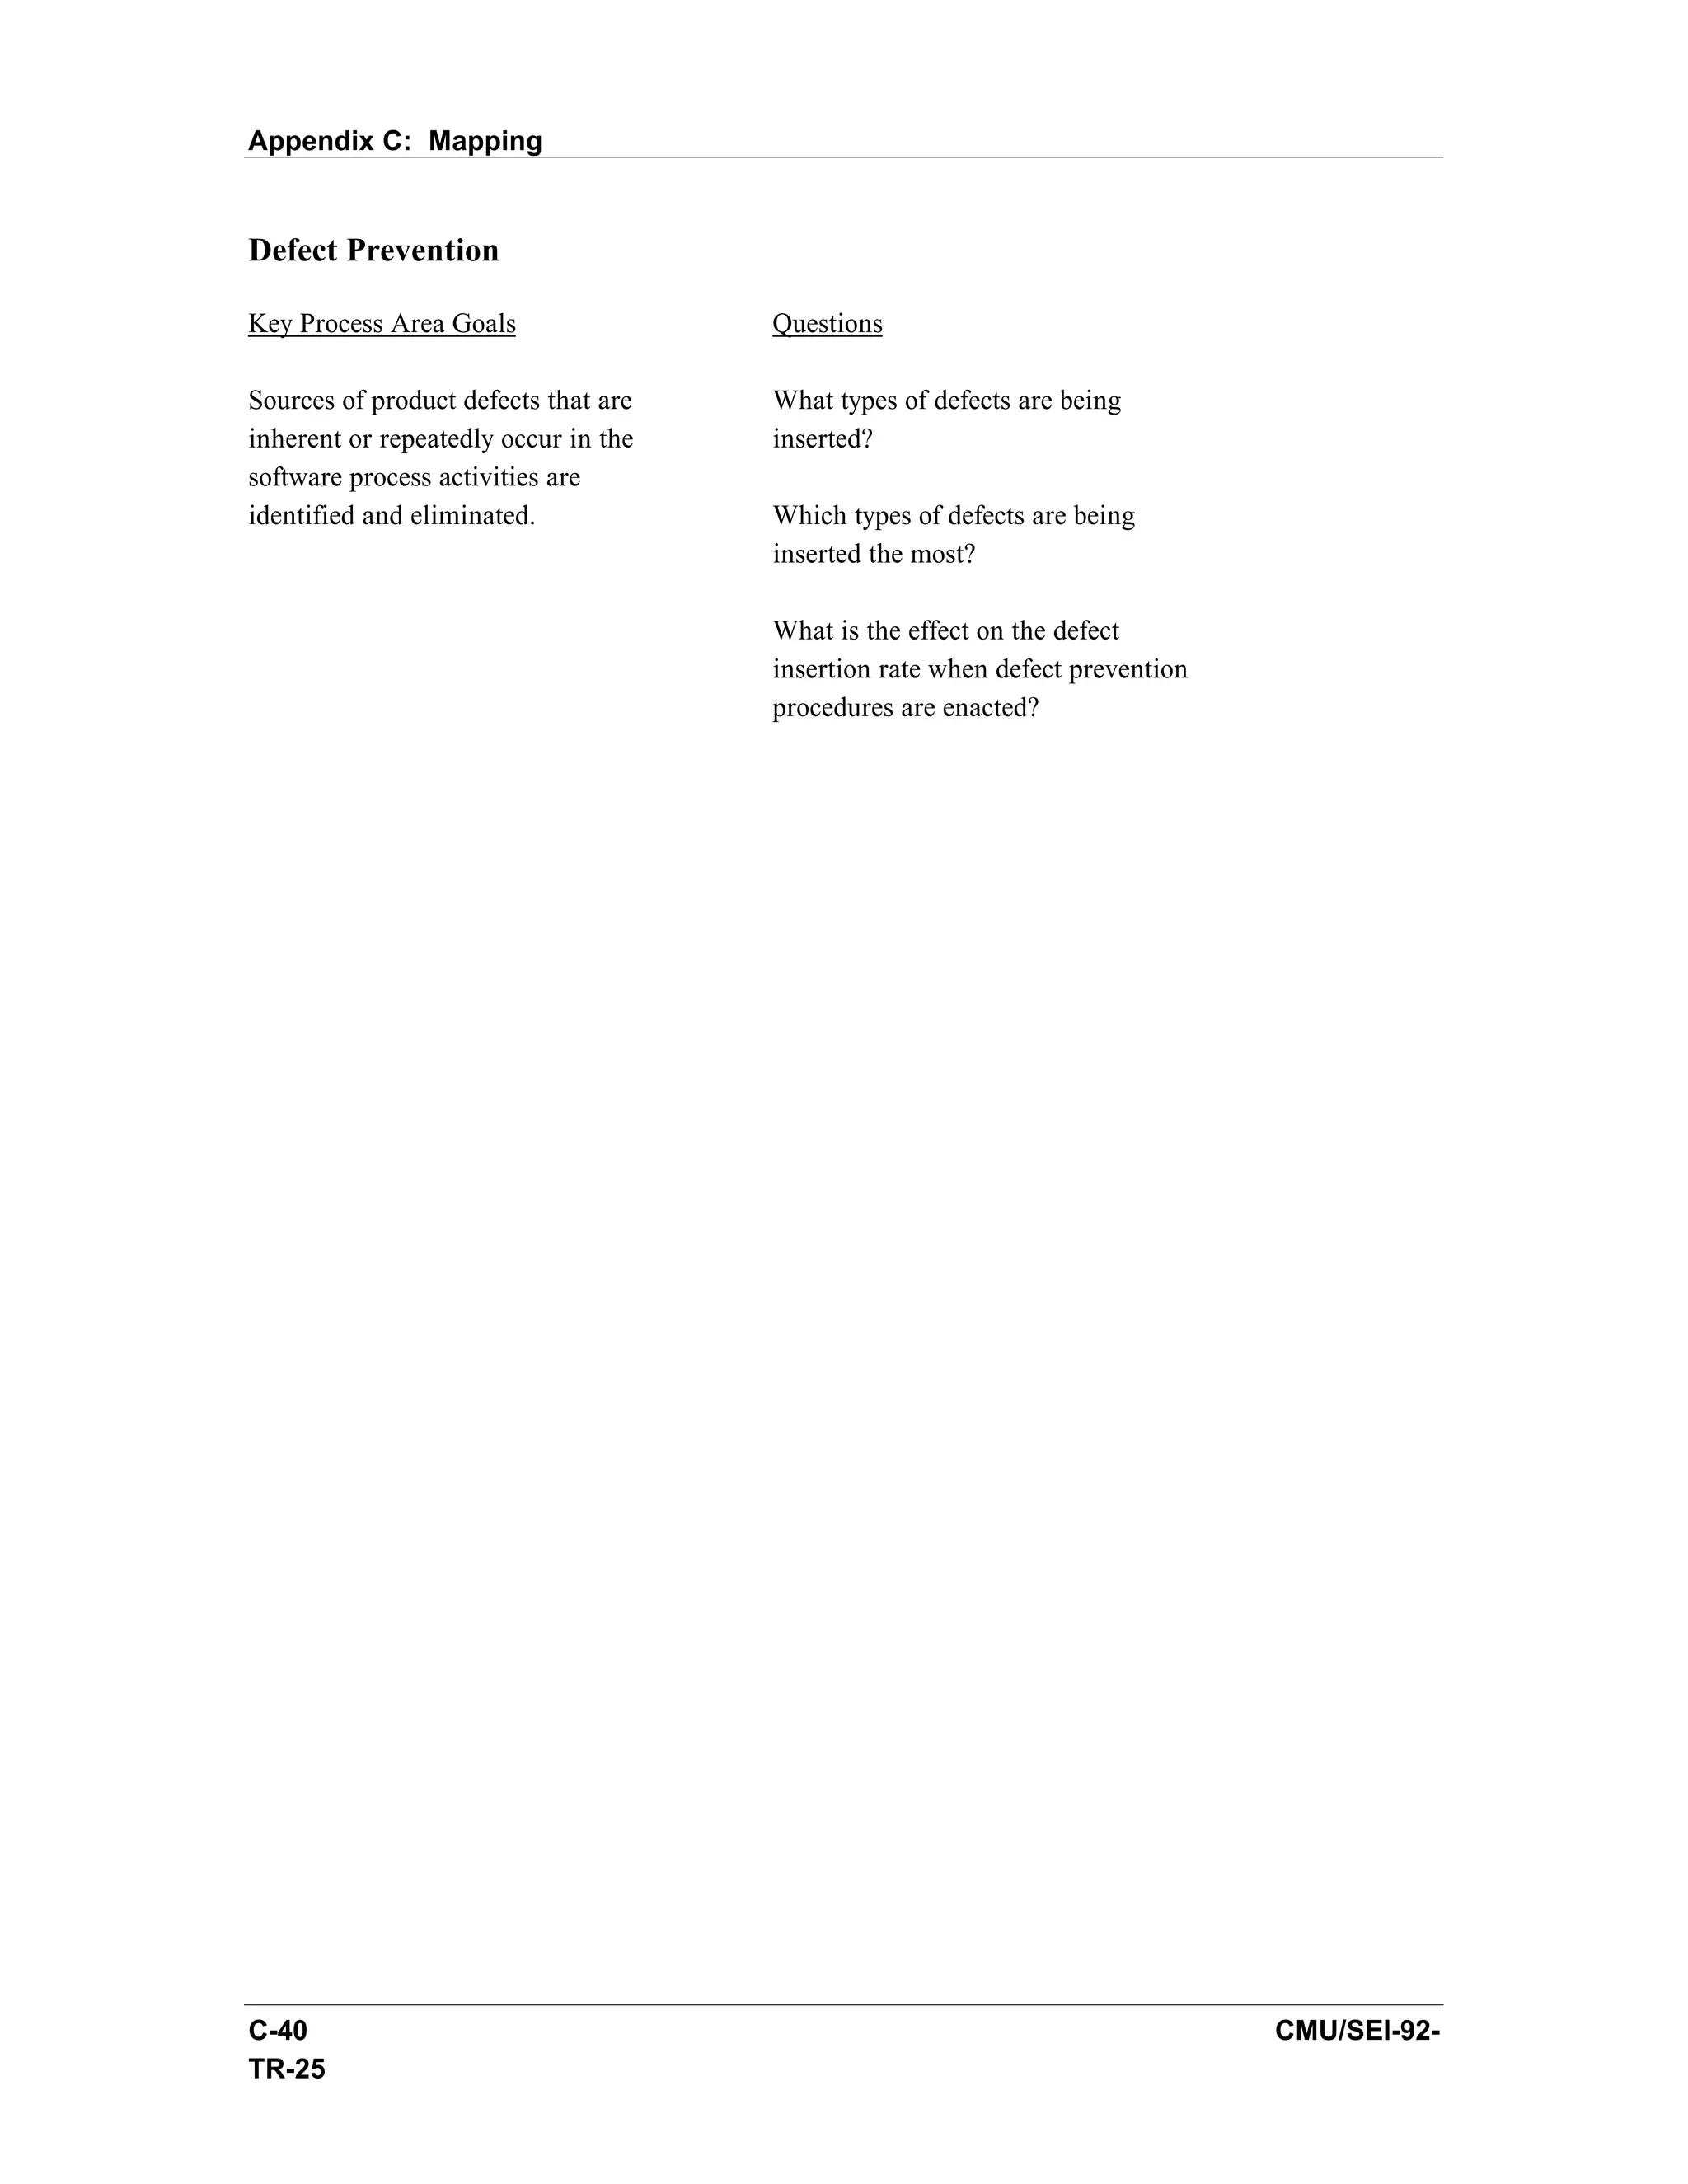
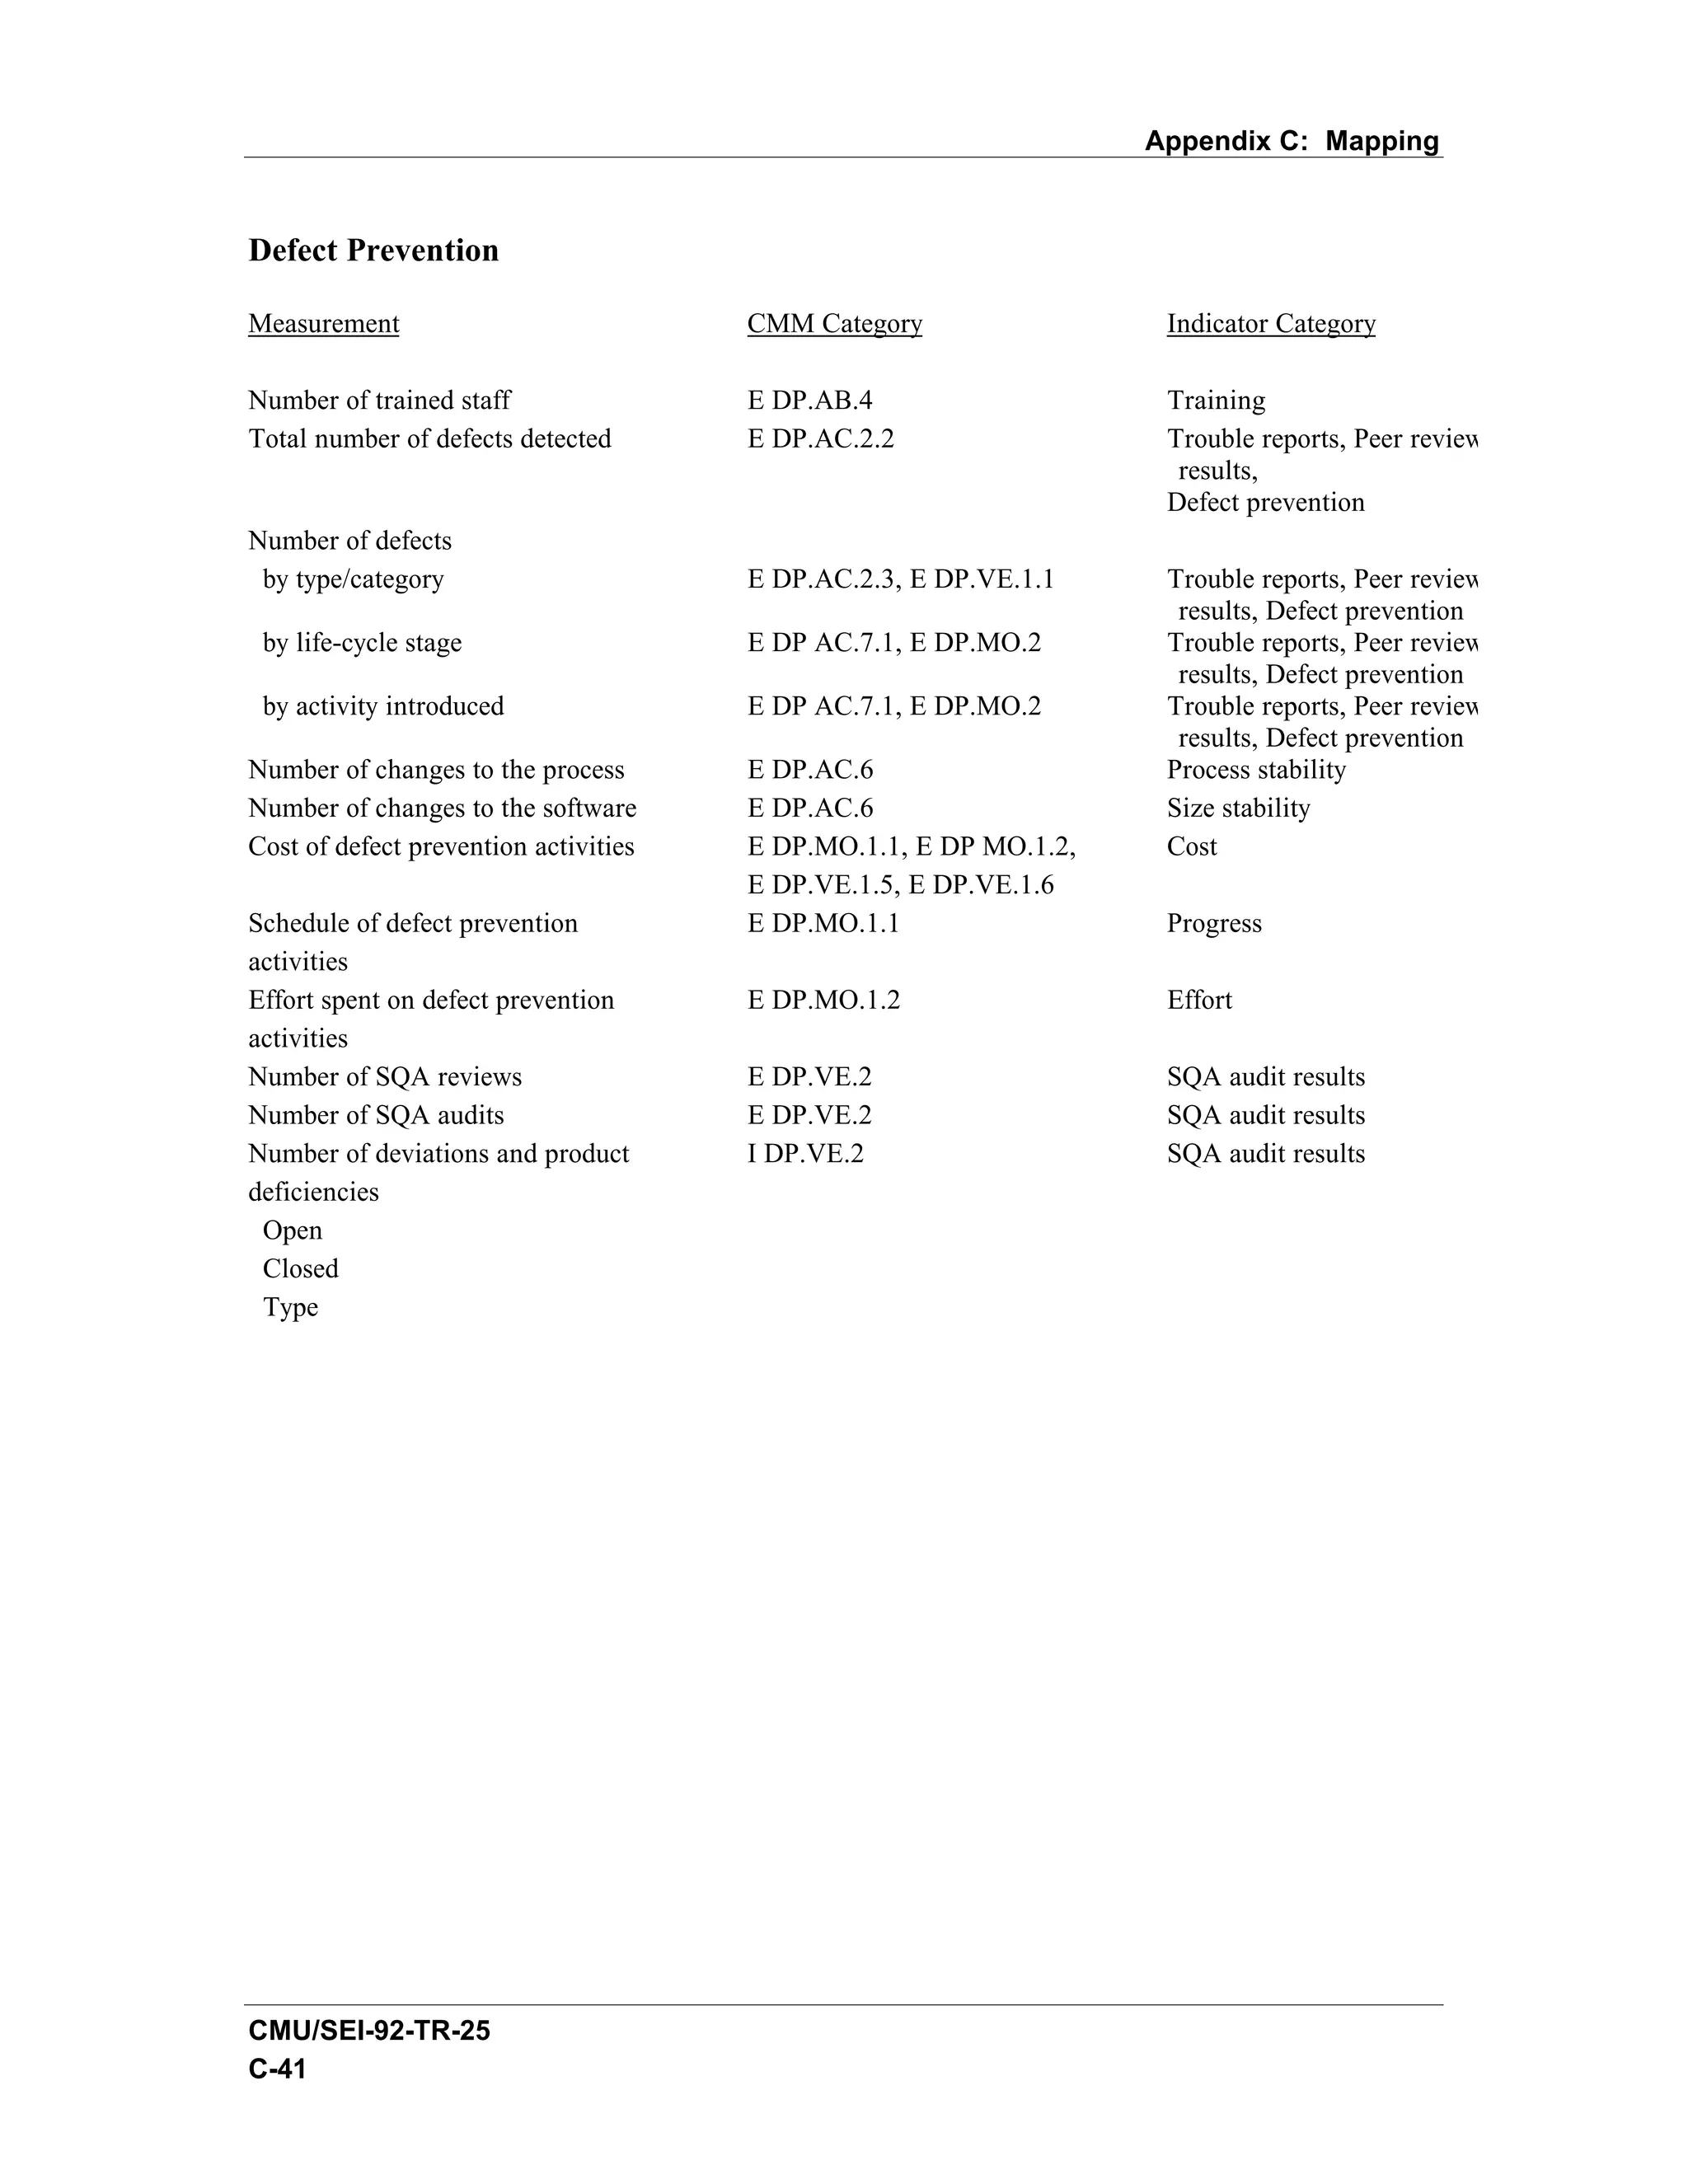
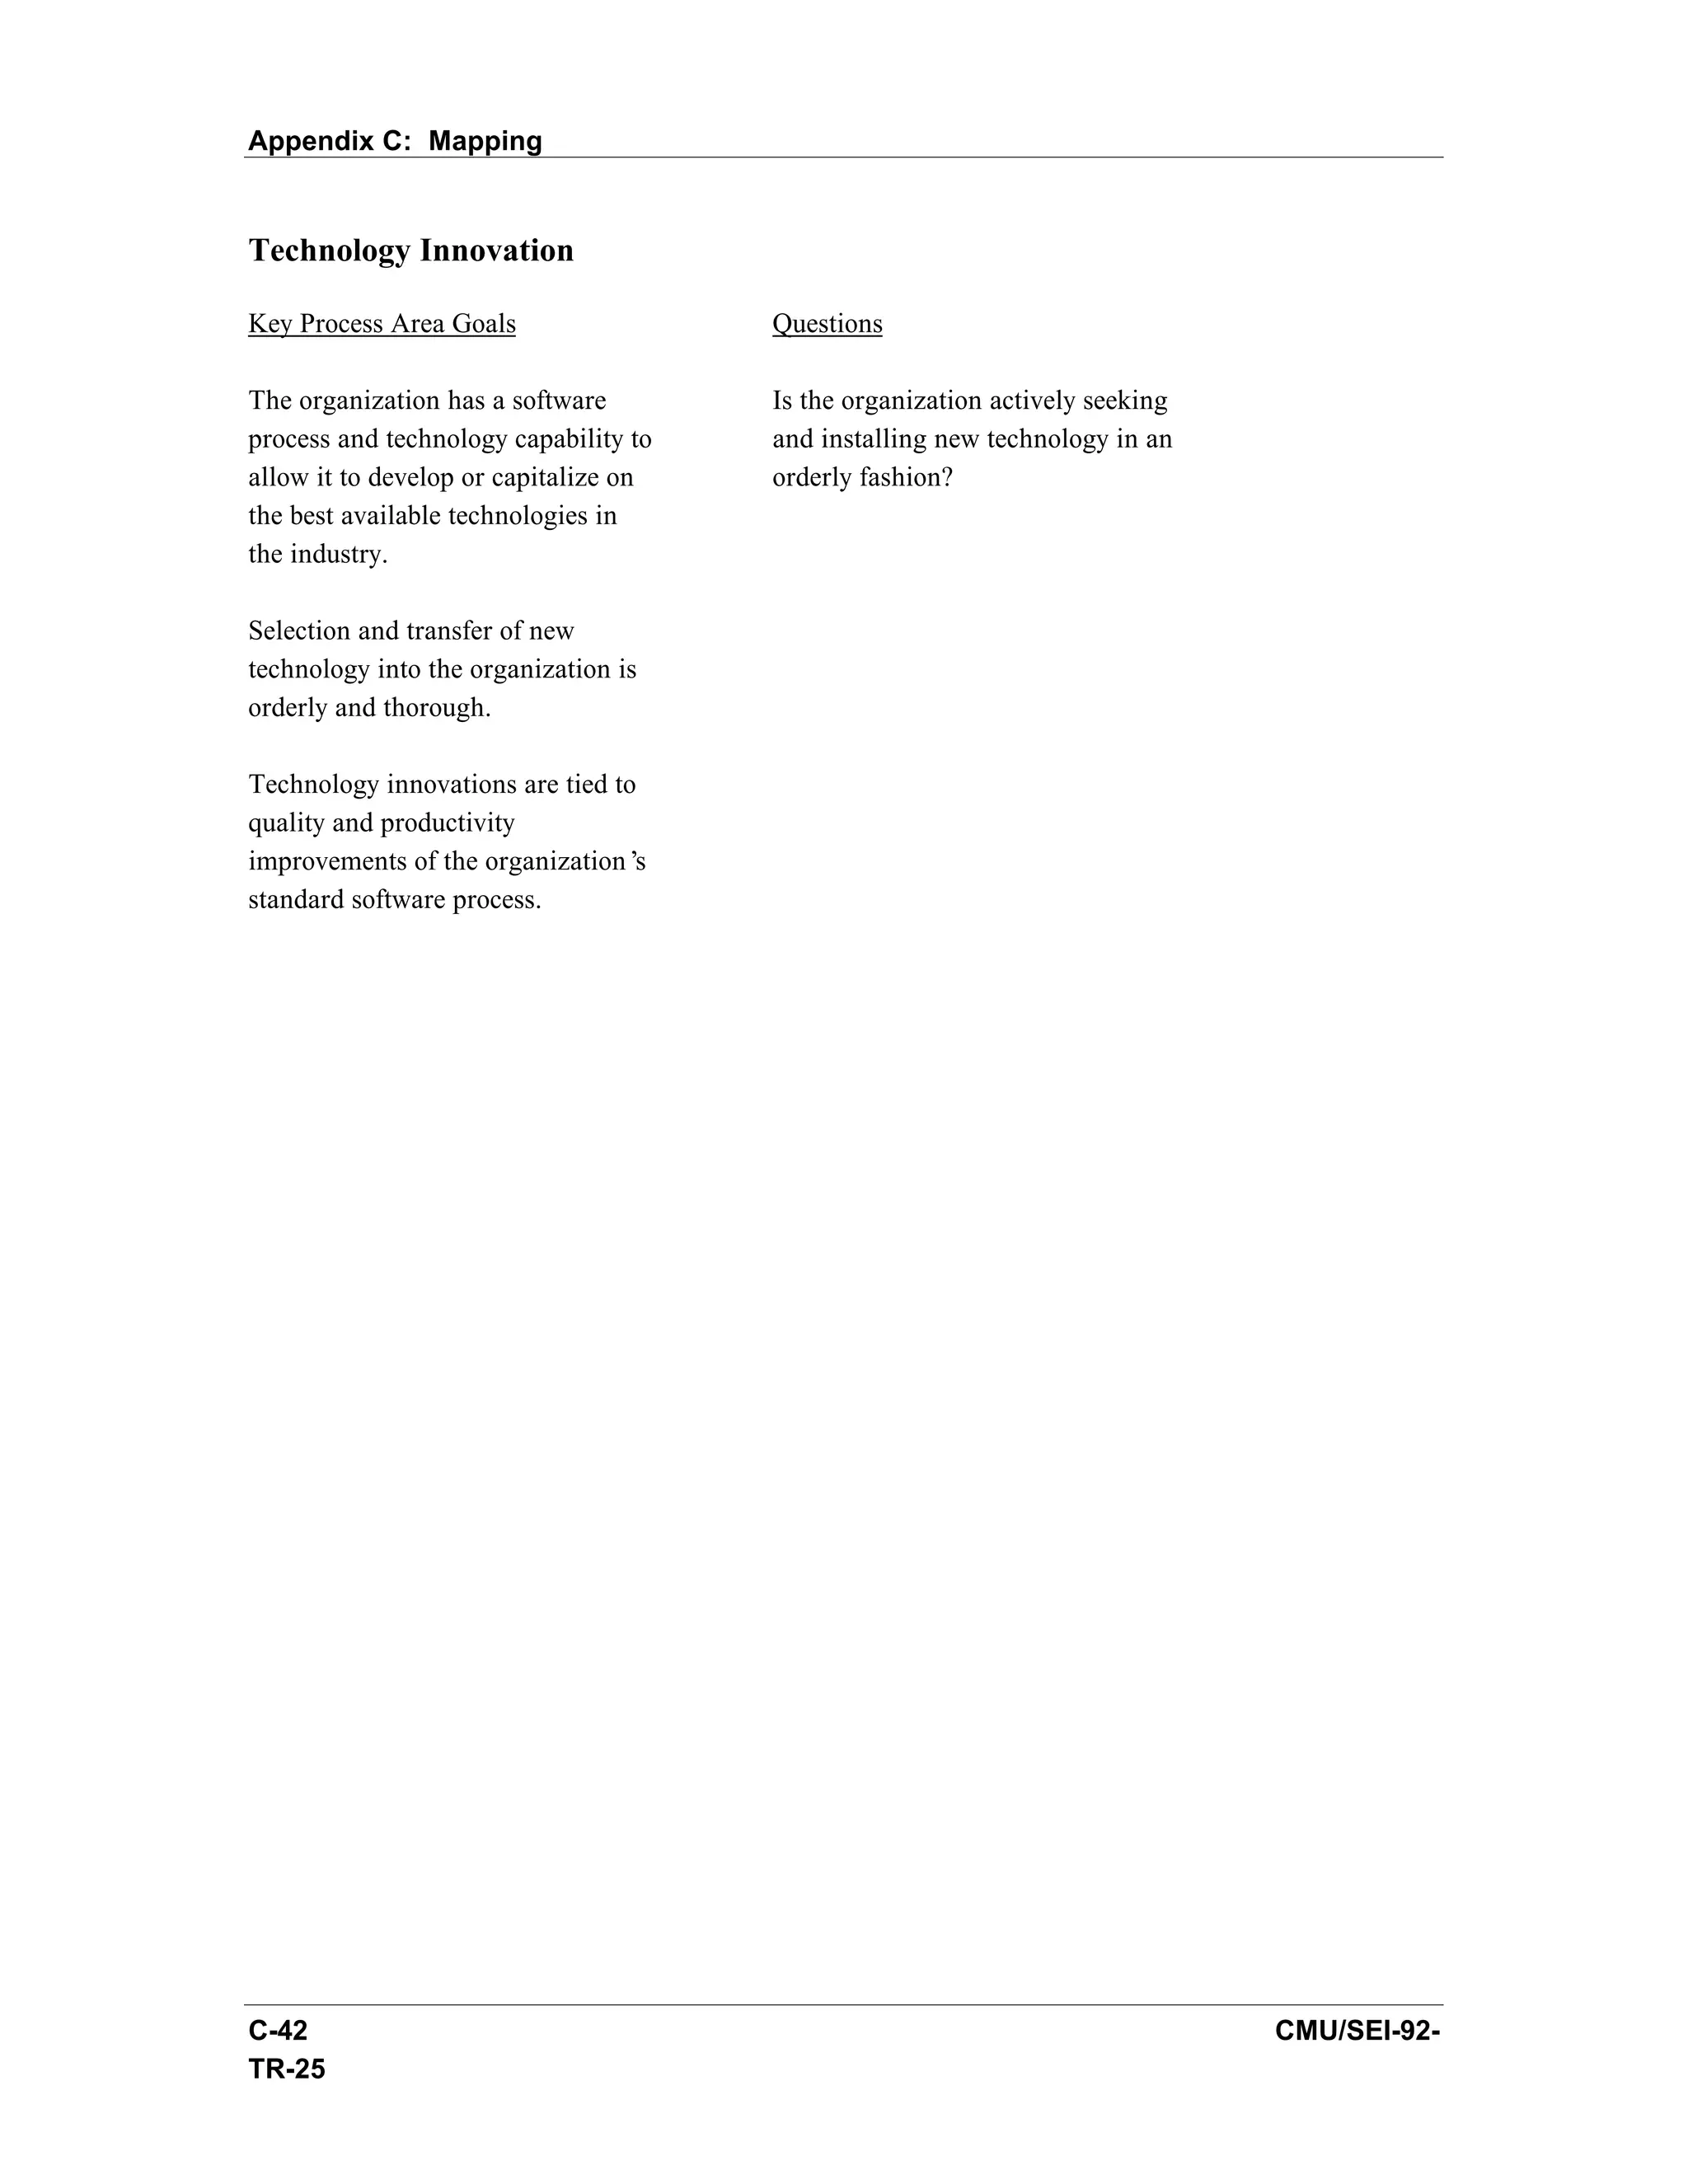
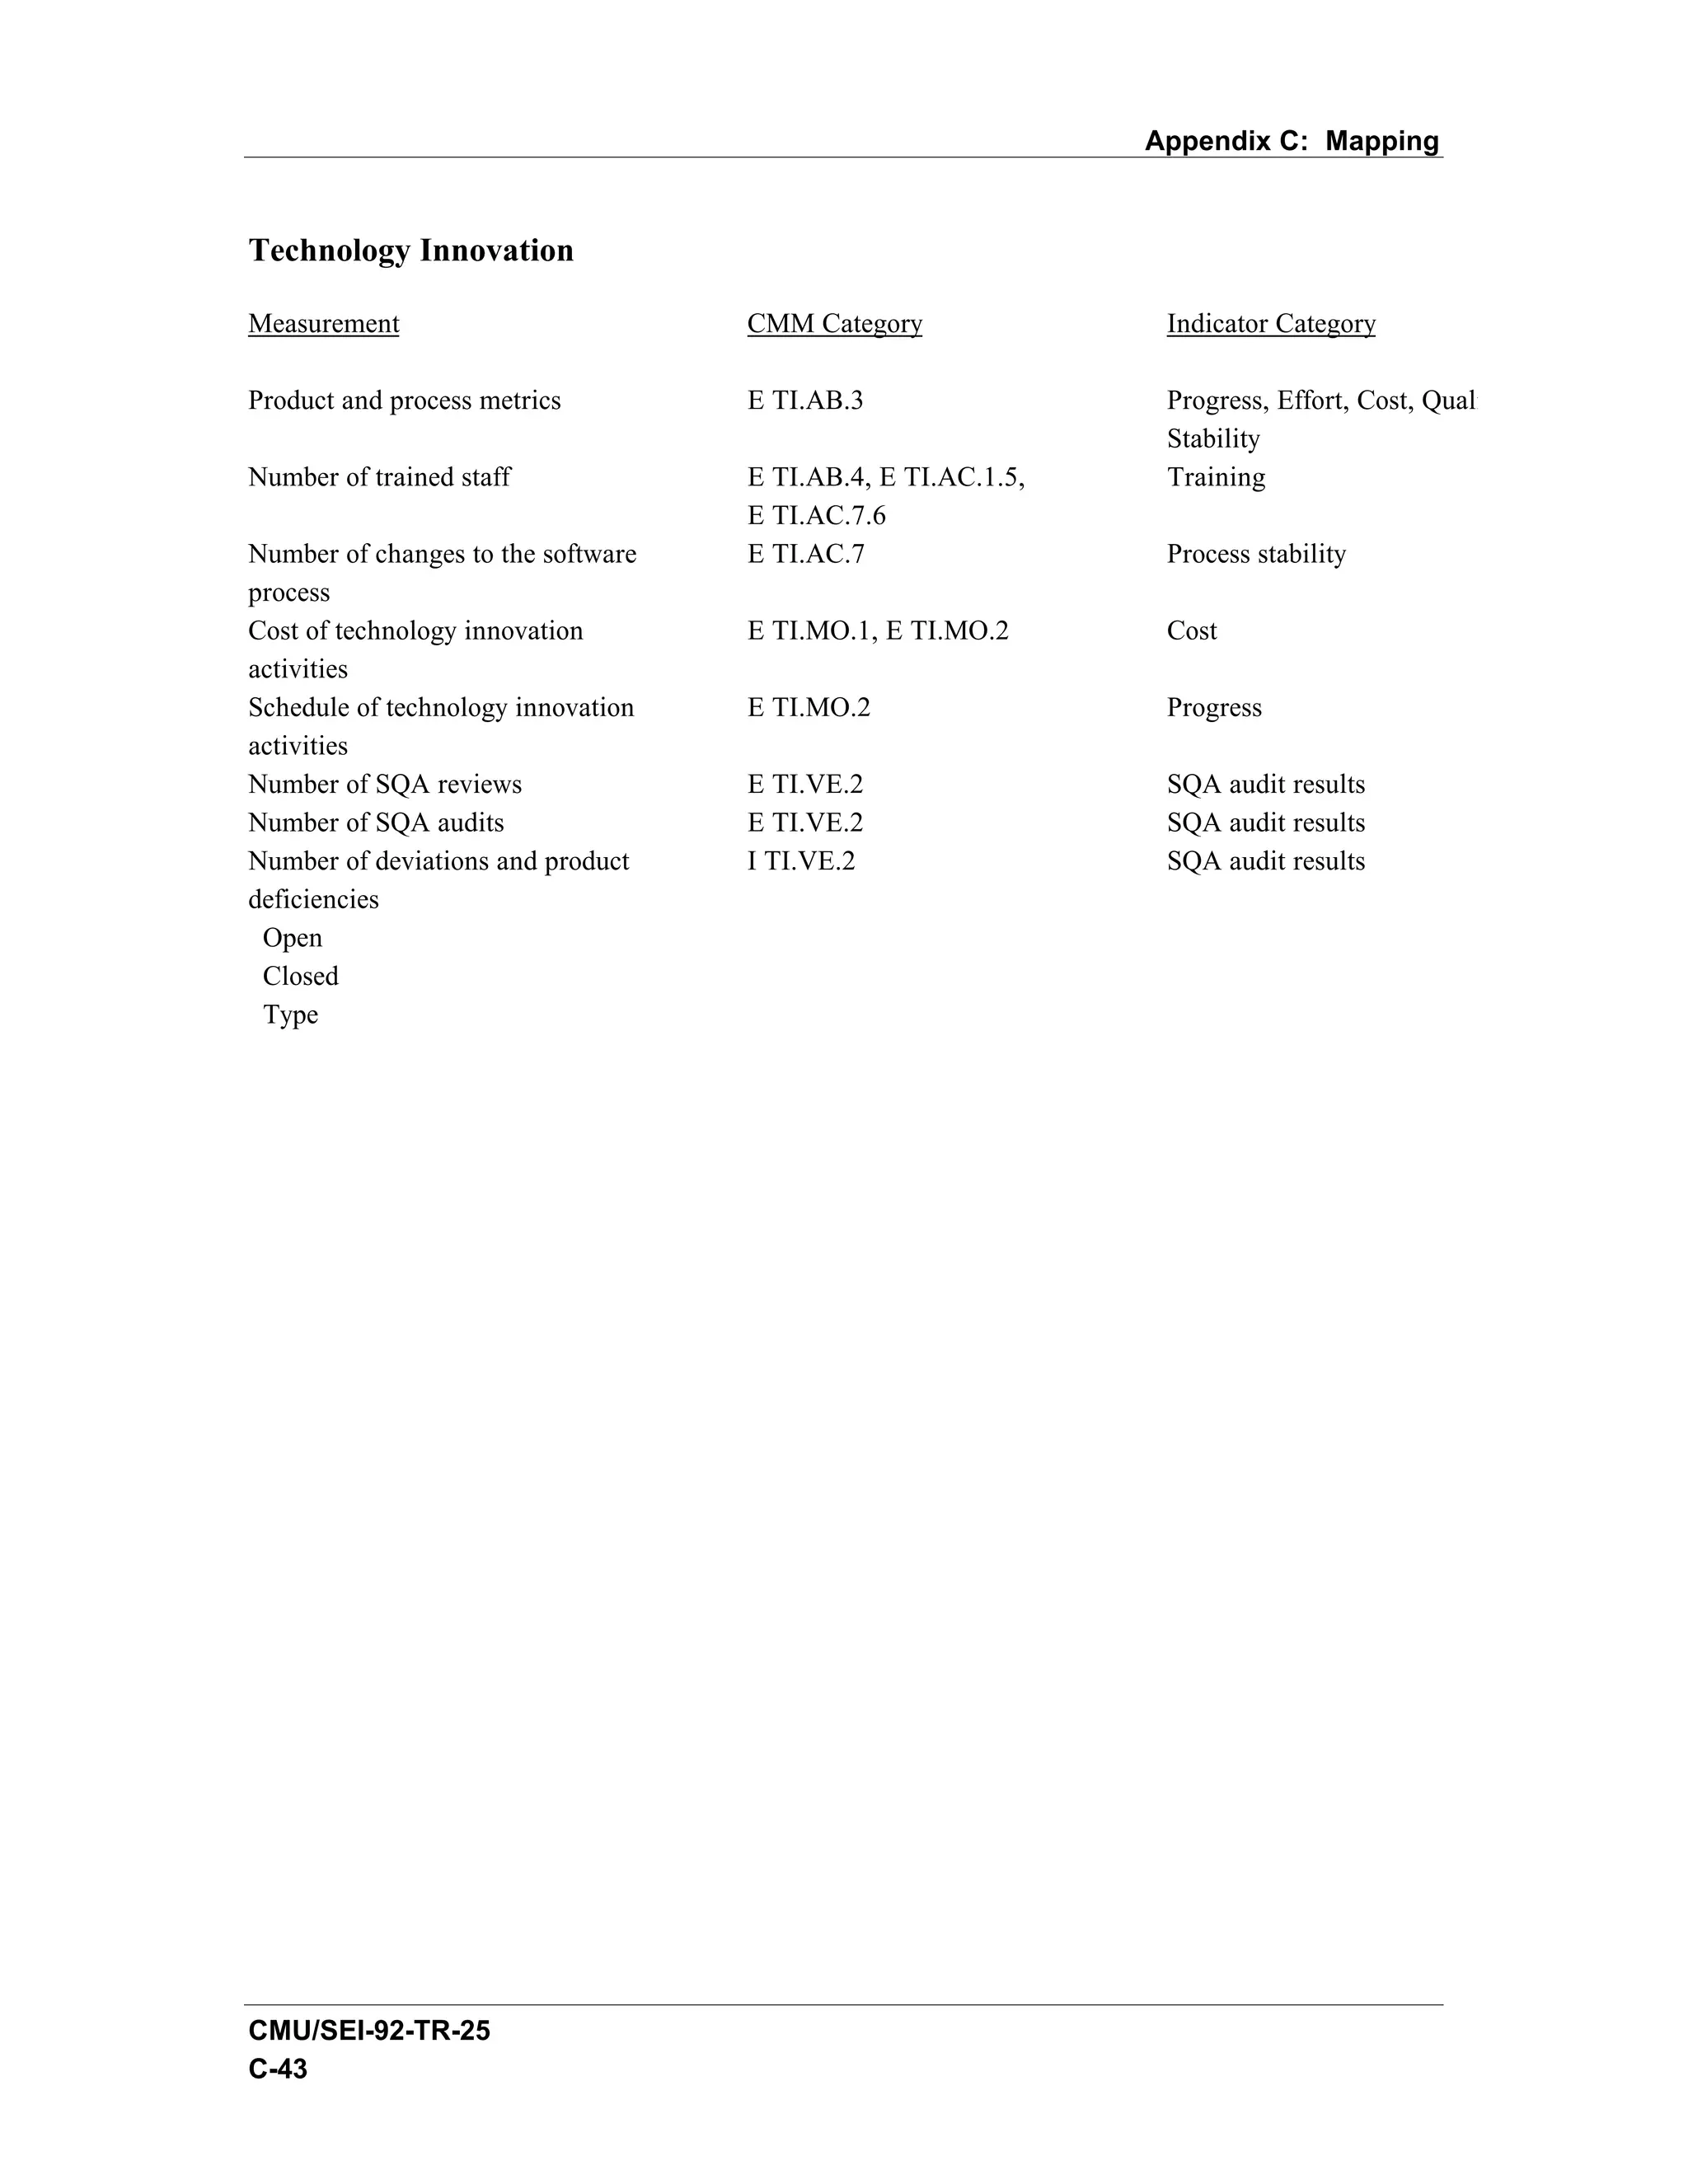
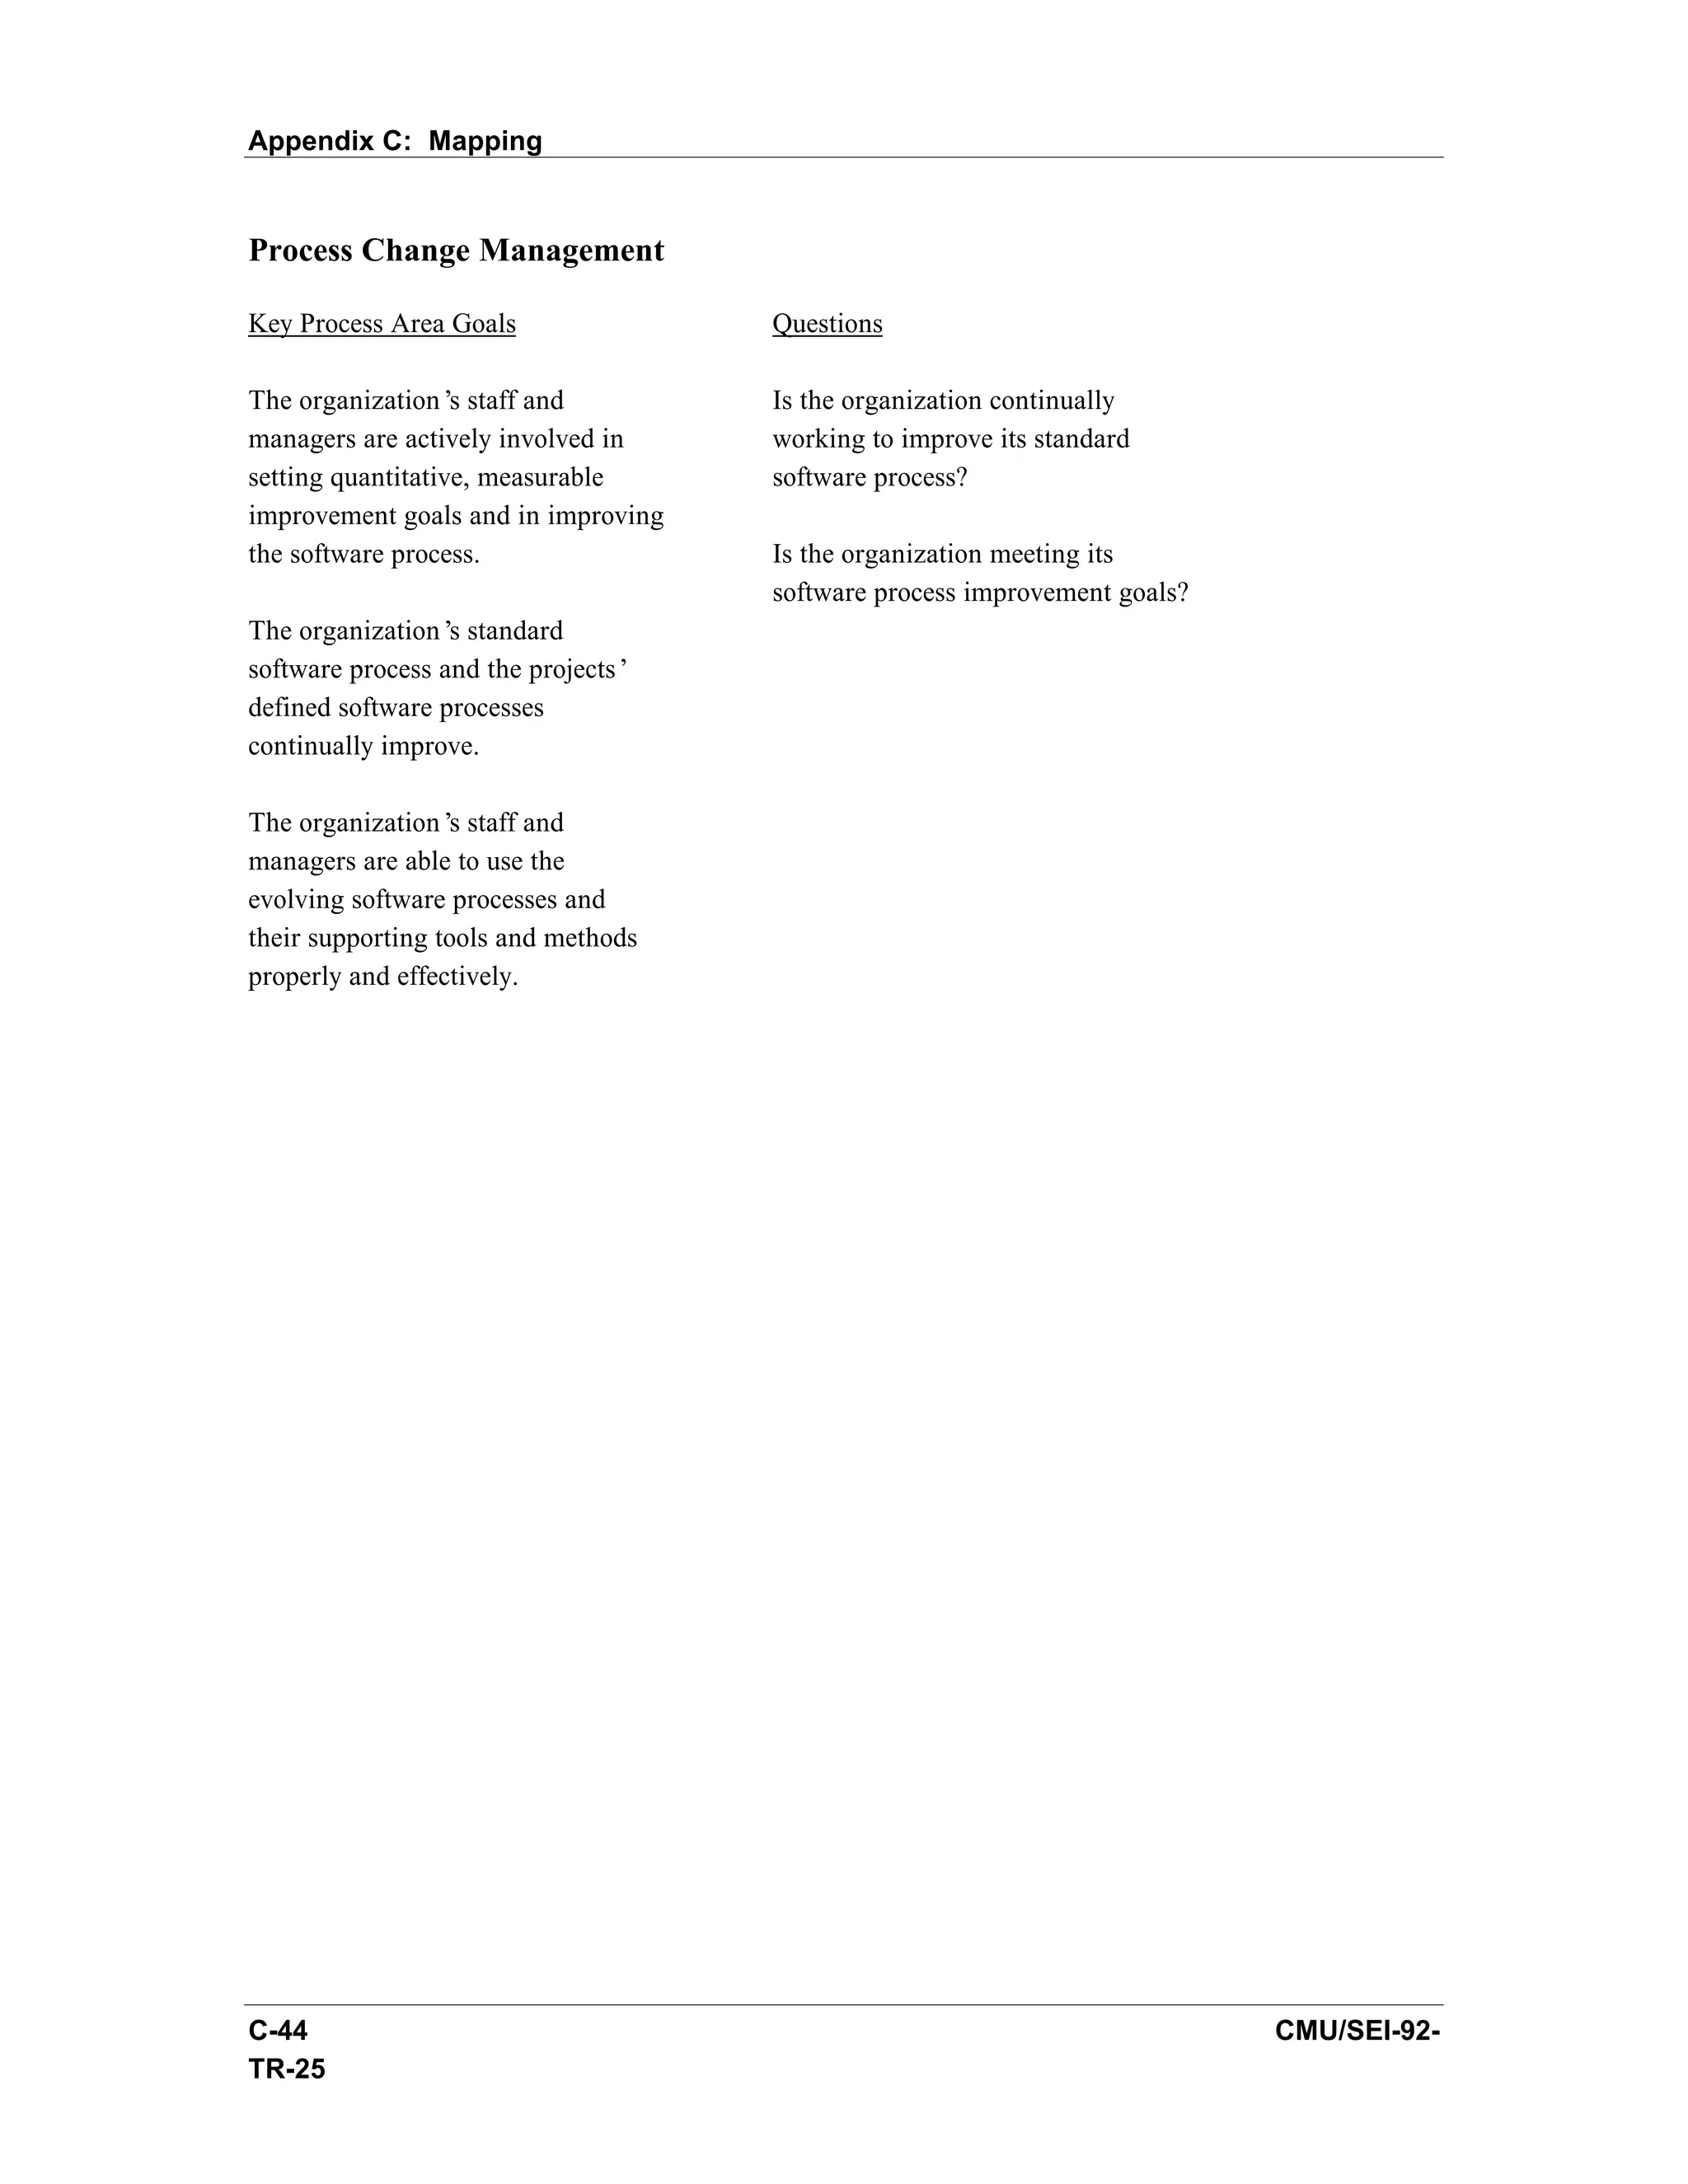
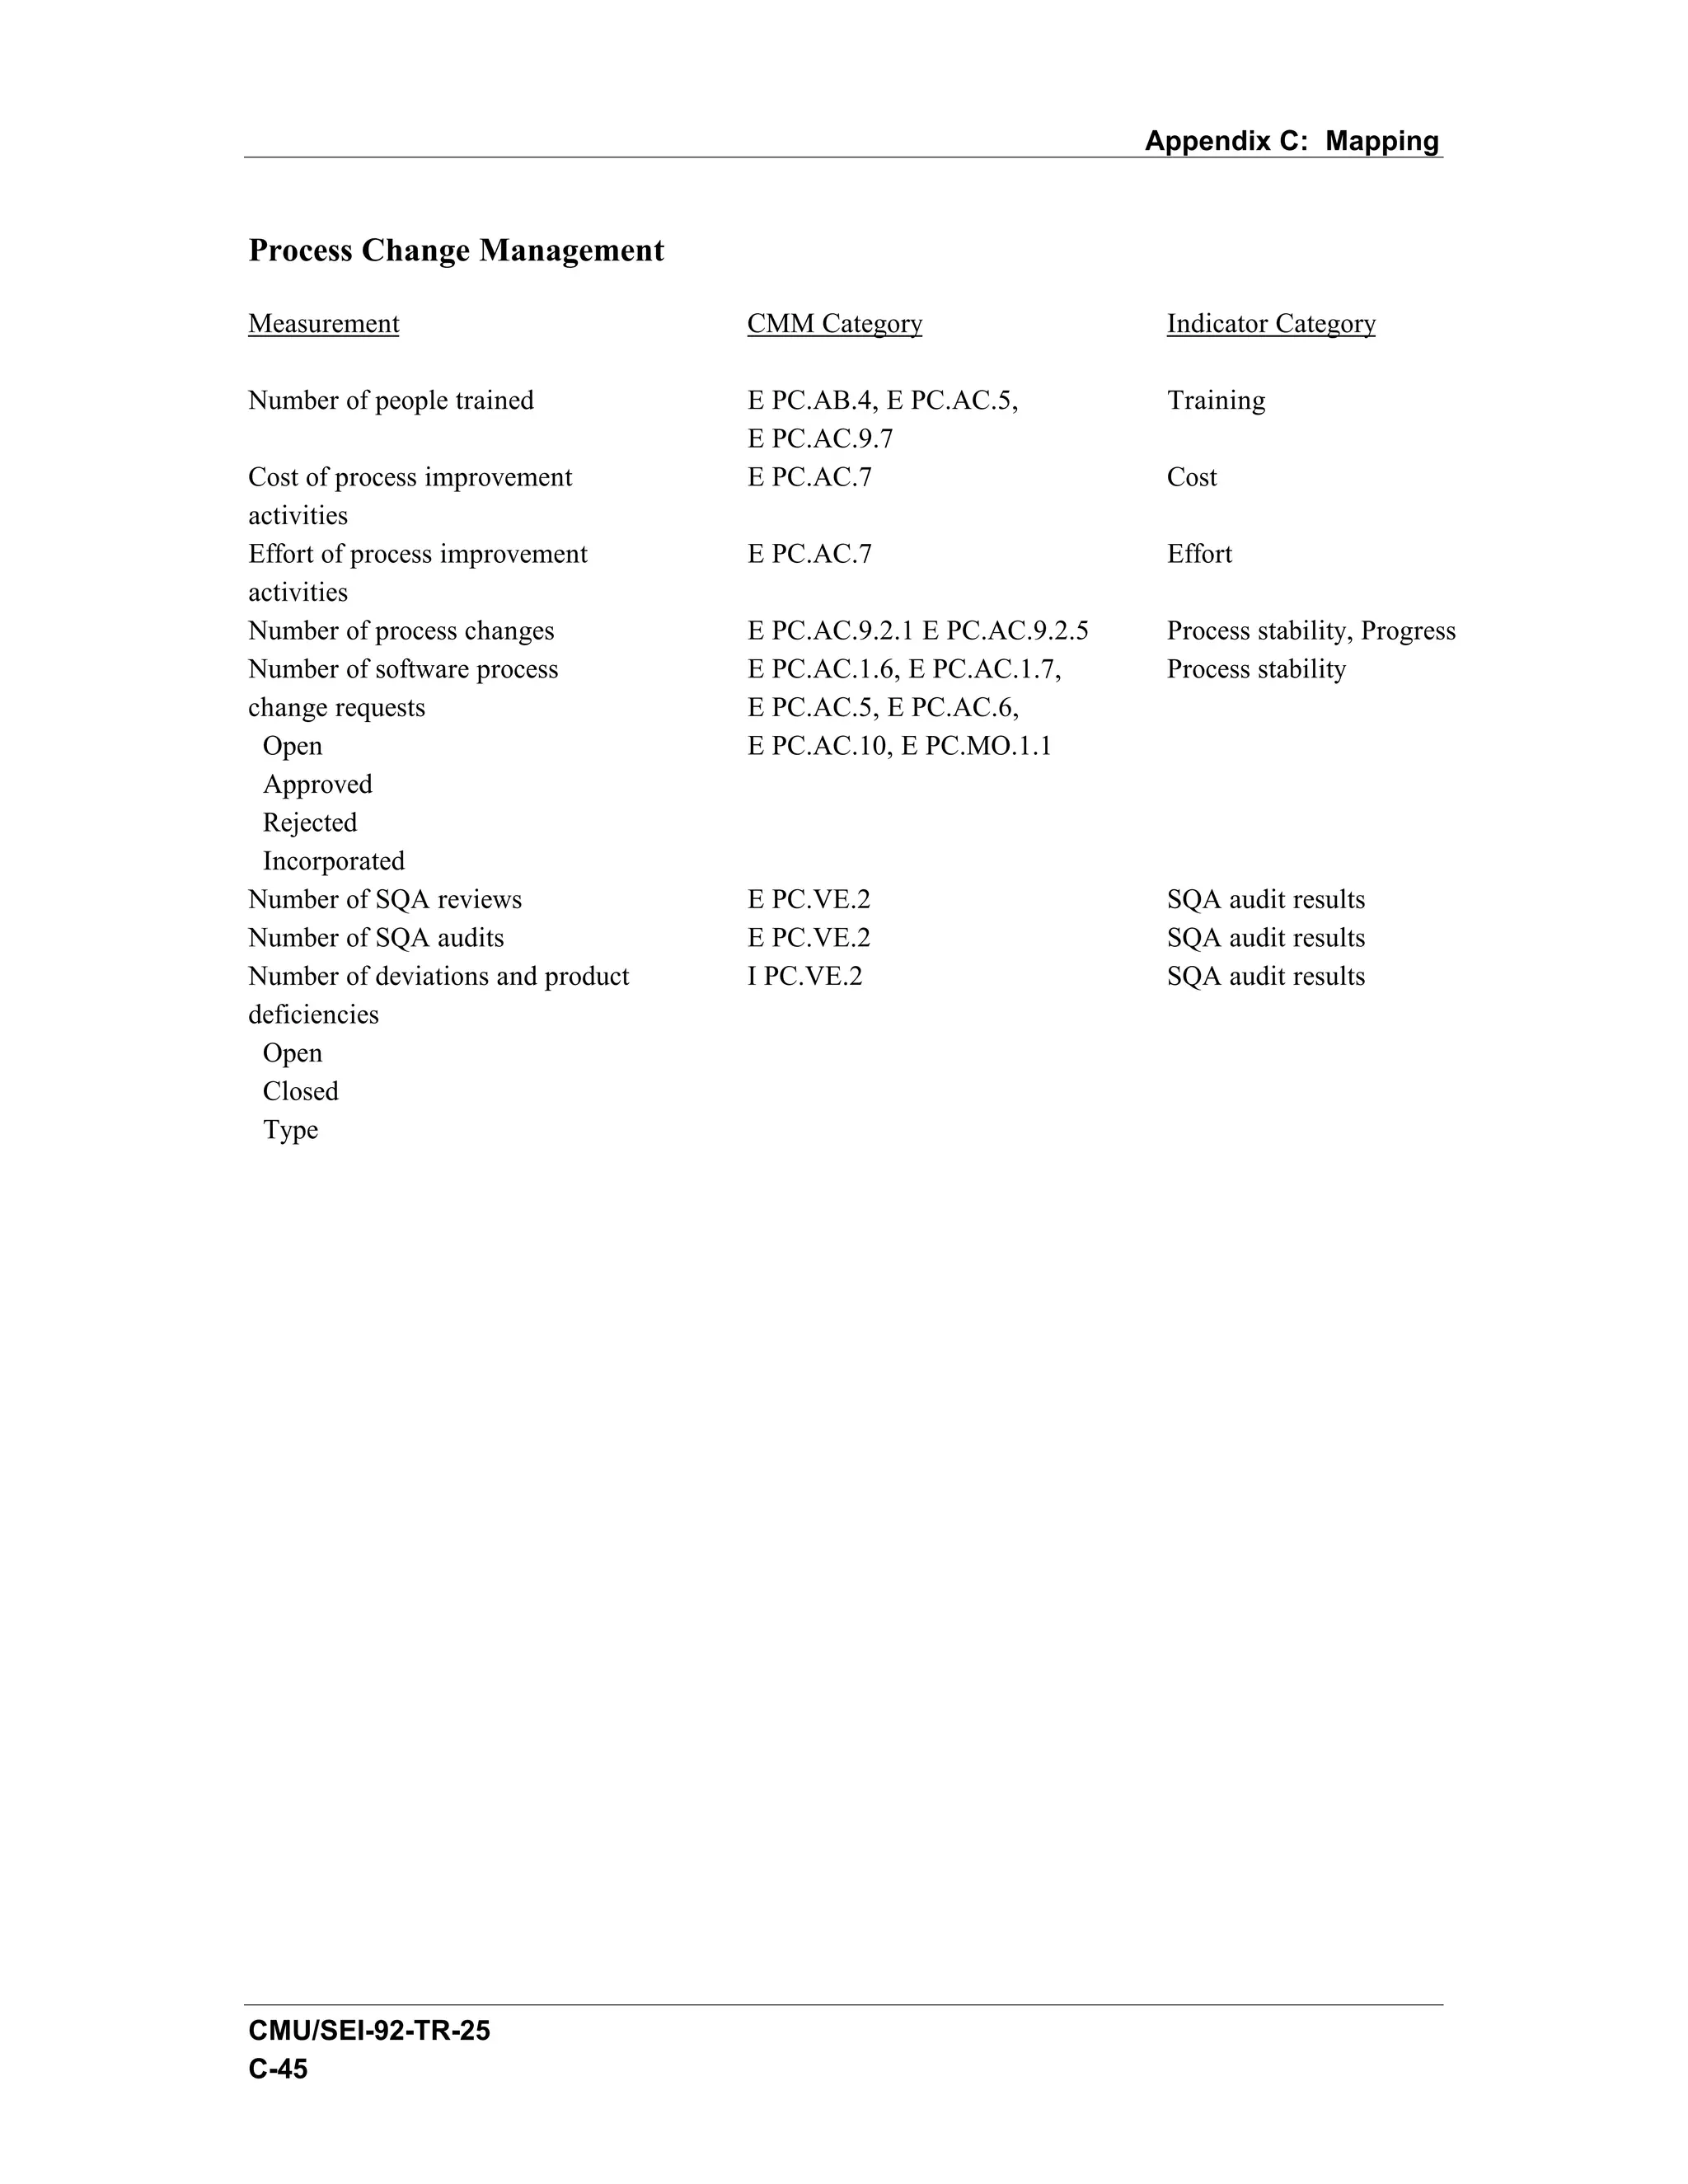

![Appendix D: Indicator Categories Traced to Capability
Maturity Model Key Practices
This appendix traces the software indicators to the software measurement references
contained within the key process areas of the Capability Maturity Model (CMM) [Weber
91]. The information is in two columns. The first column gives the software indicator
while the second column lists the CMM reference. Each entry consists of a letter
indicating whether the measure is explicitly stated (E) or inferred (I) in the CMM text and
a citation code. This code has the format
key process area.common feature.top-level key practice number.subordinate key
practice number.item in subordinate key practice statement
Thus, E RM.MO.1.2.1 means that the measure number of requirements changes over
time is explicitly stated (E) in the Requirements Management (RM) key process area,
the Monitoring implementation (MO) common feature, top-level key practice statement
1, subordinate key practice statement 2, and item 1 within the subordinate key practice
statement. The code key for the CMM reference is given on the next page.
The five common features of the key practices for each key process area are the
following:
• Commitment to perform specifies the actions the organization must take to
ensure that the process is established and will endure.
• Ability to perform specifies the preconditions that must exist in the project or
organization to implement the process competently.
• Activities performed specifies the steps that must be performed to effectively
establish the key process area.
• Monitoring implementation specifies the steps that must be performed to
measure the process, analyze the measurements, and take action based on the
results.
• Verifying implementation specifies the steps that must be performed to guide
and ensure that the activities are performed in compliance with the process that
has been specified.
The table ends with a risk indicator category, but as noted in the text, no indicator is
given in this document for risk. The reference to risk is included for completeness.
CMU/SEI-92-TR-25 D-1](https://image.slidesharecdn.com/softwaremeasuresandthecapabilitymaturitymodel-1992johnh-baumertsei-110103031855-phpapp02/75/Software-measures-and-the-capability-maturity-model-1992-john-h-baumert-sei-287-2048.jpg)
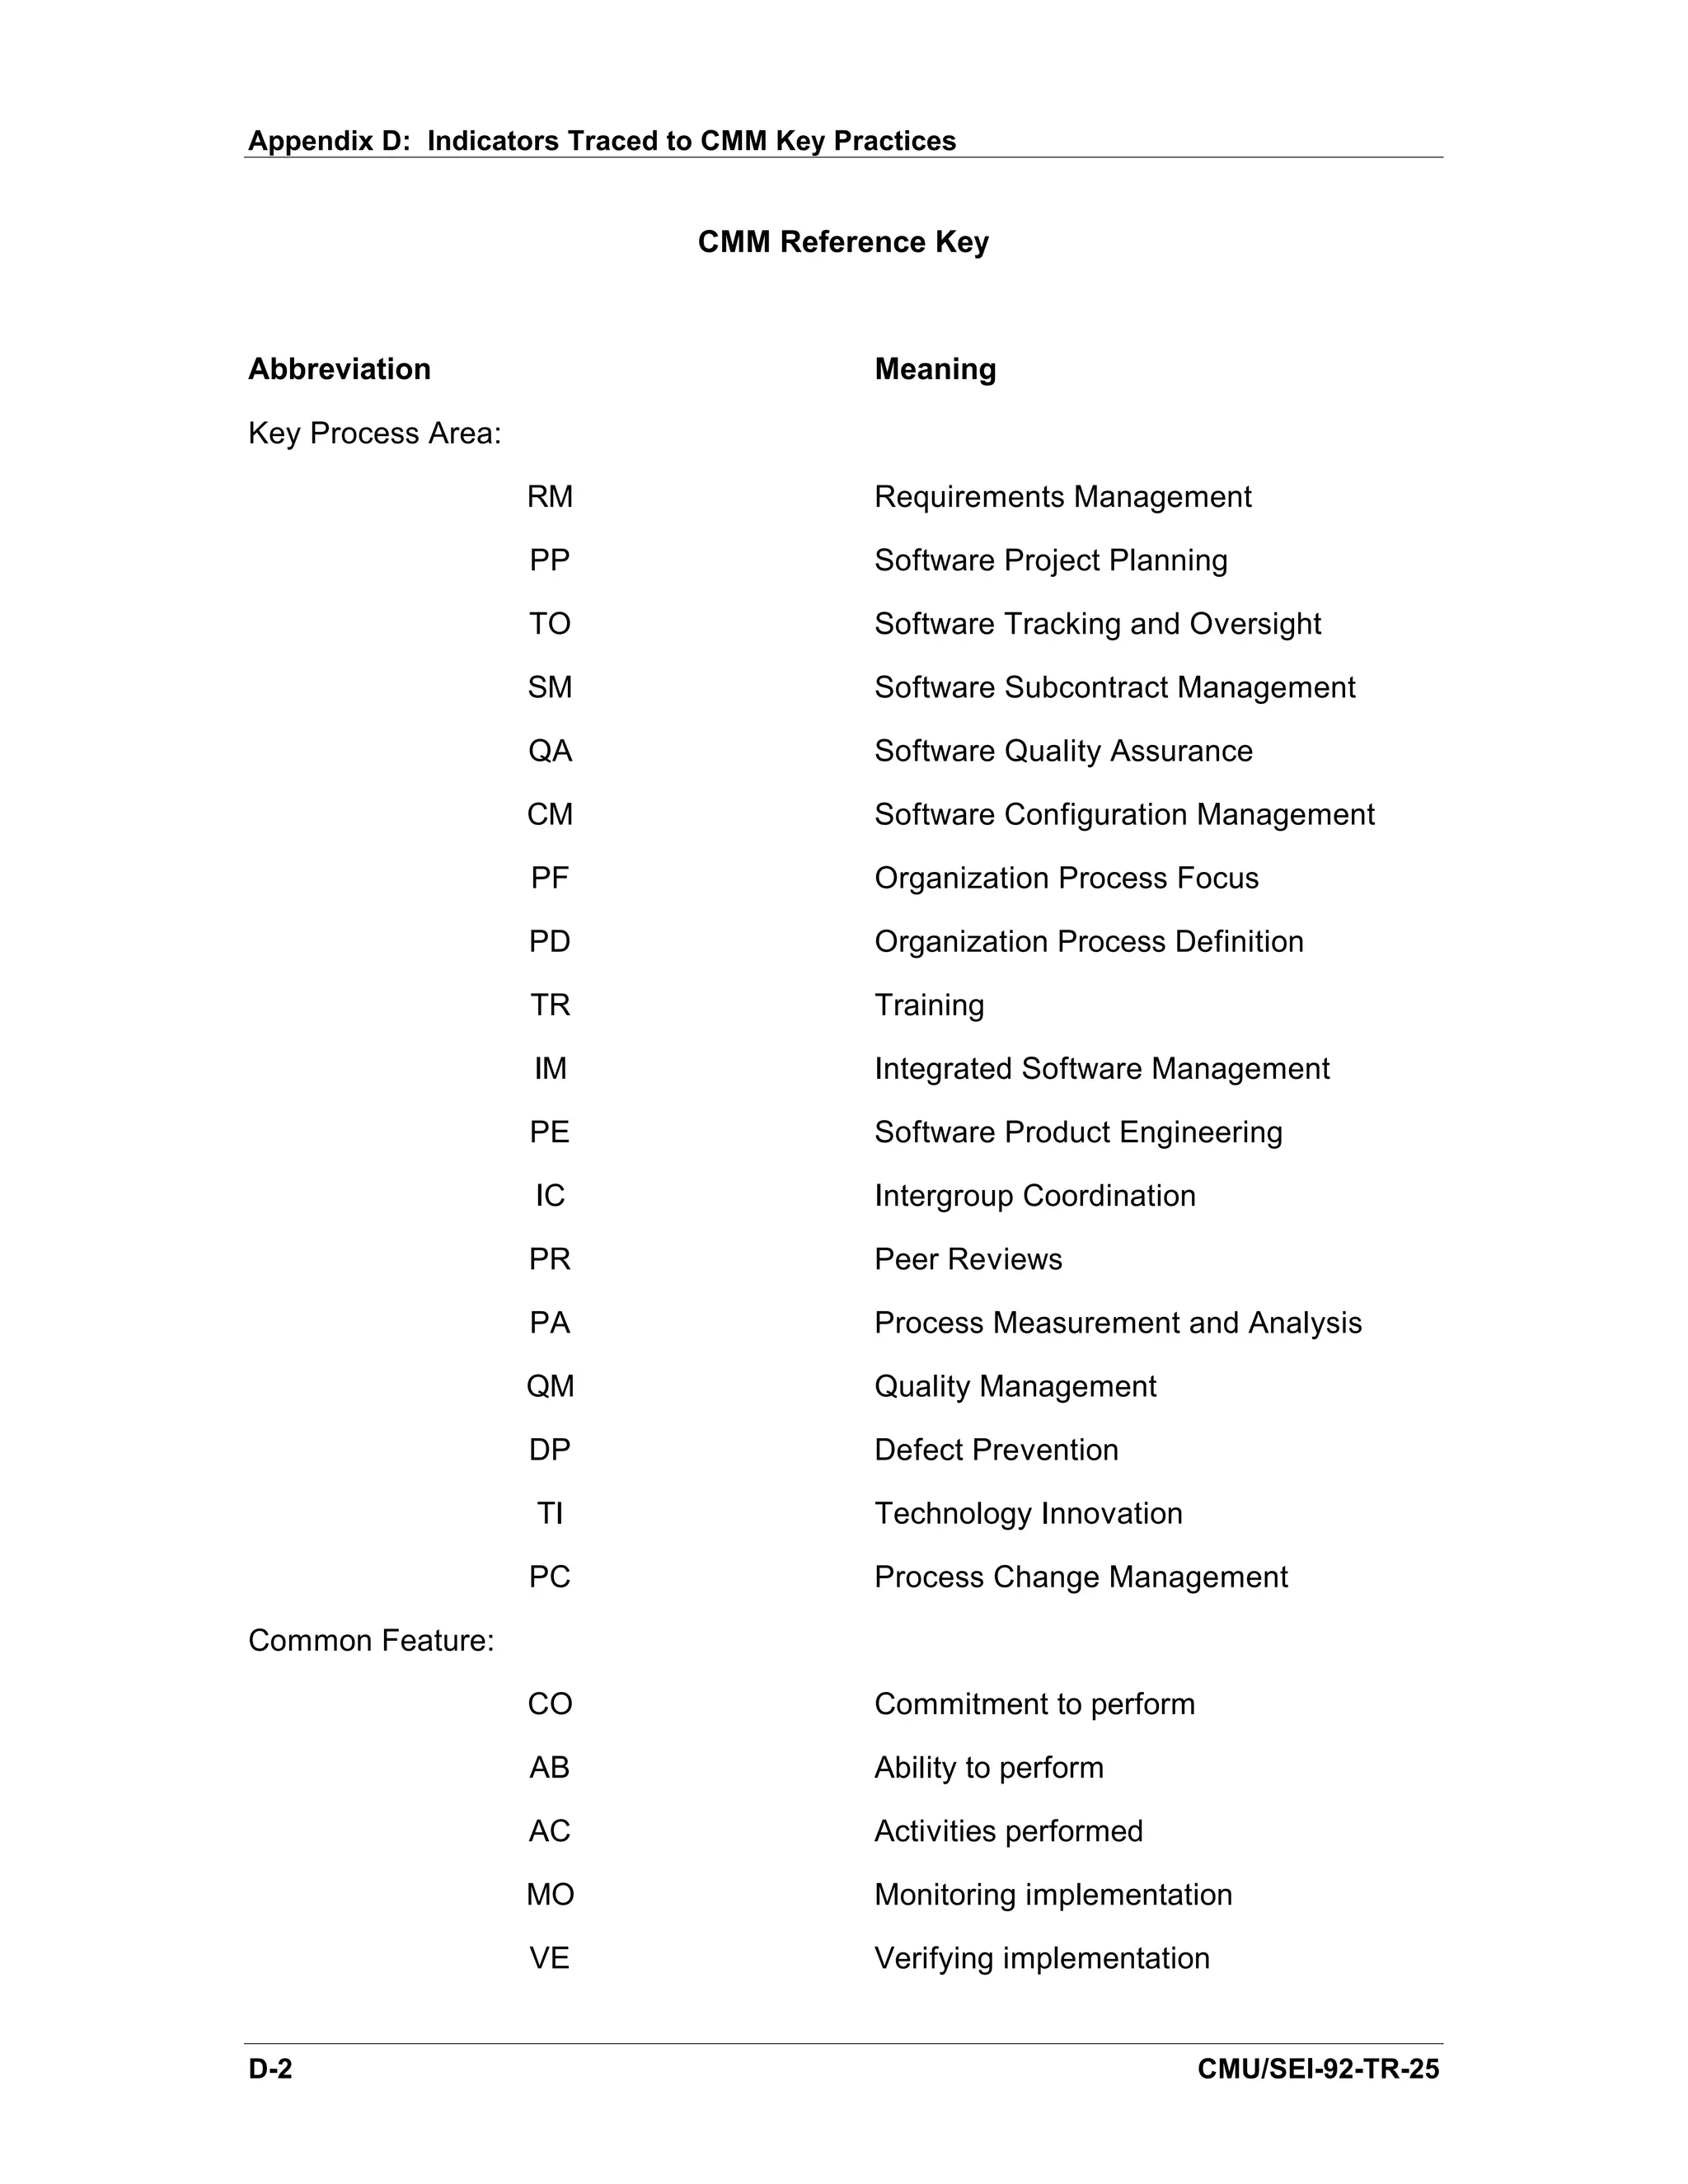
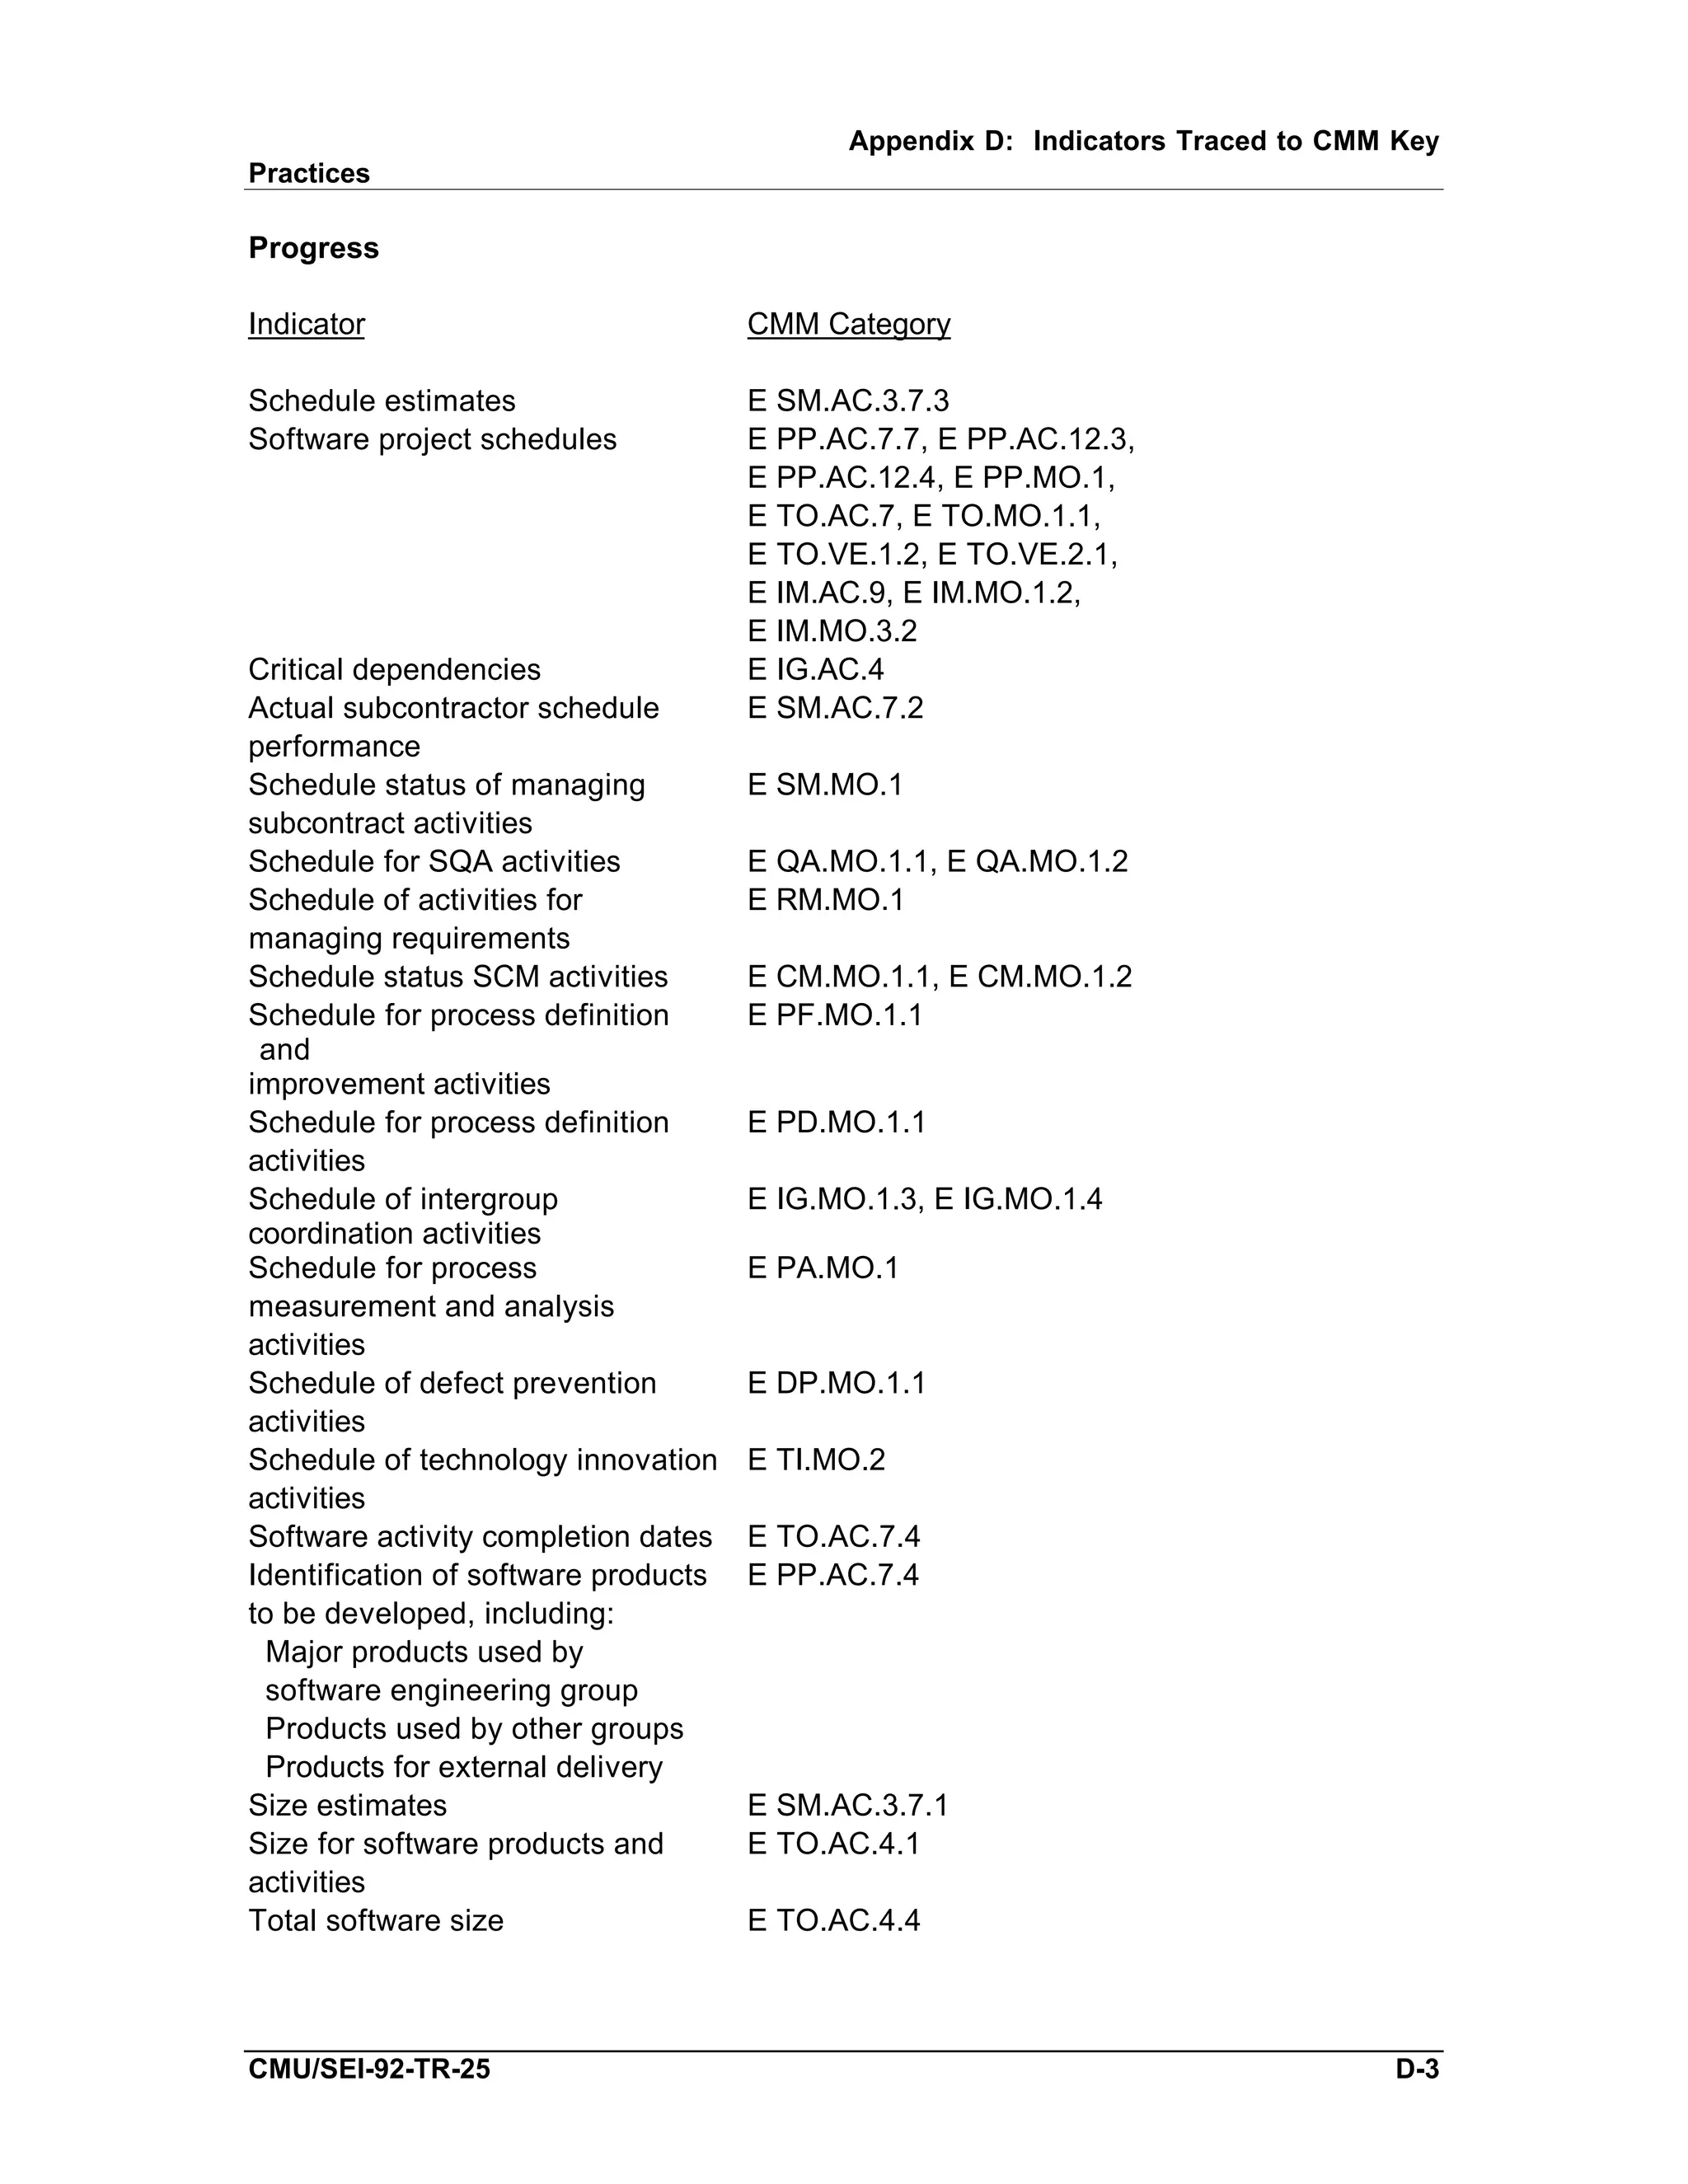
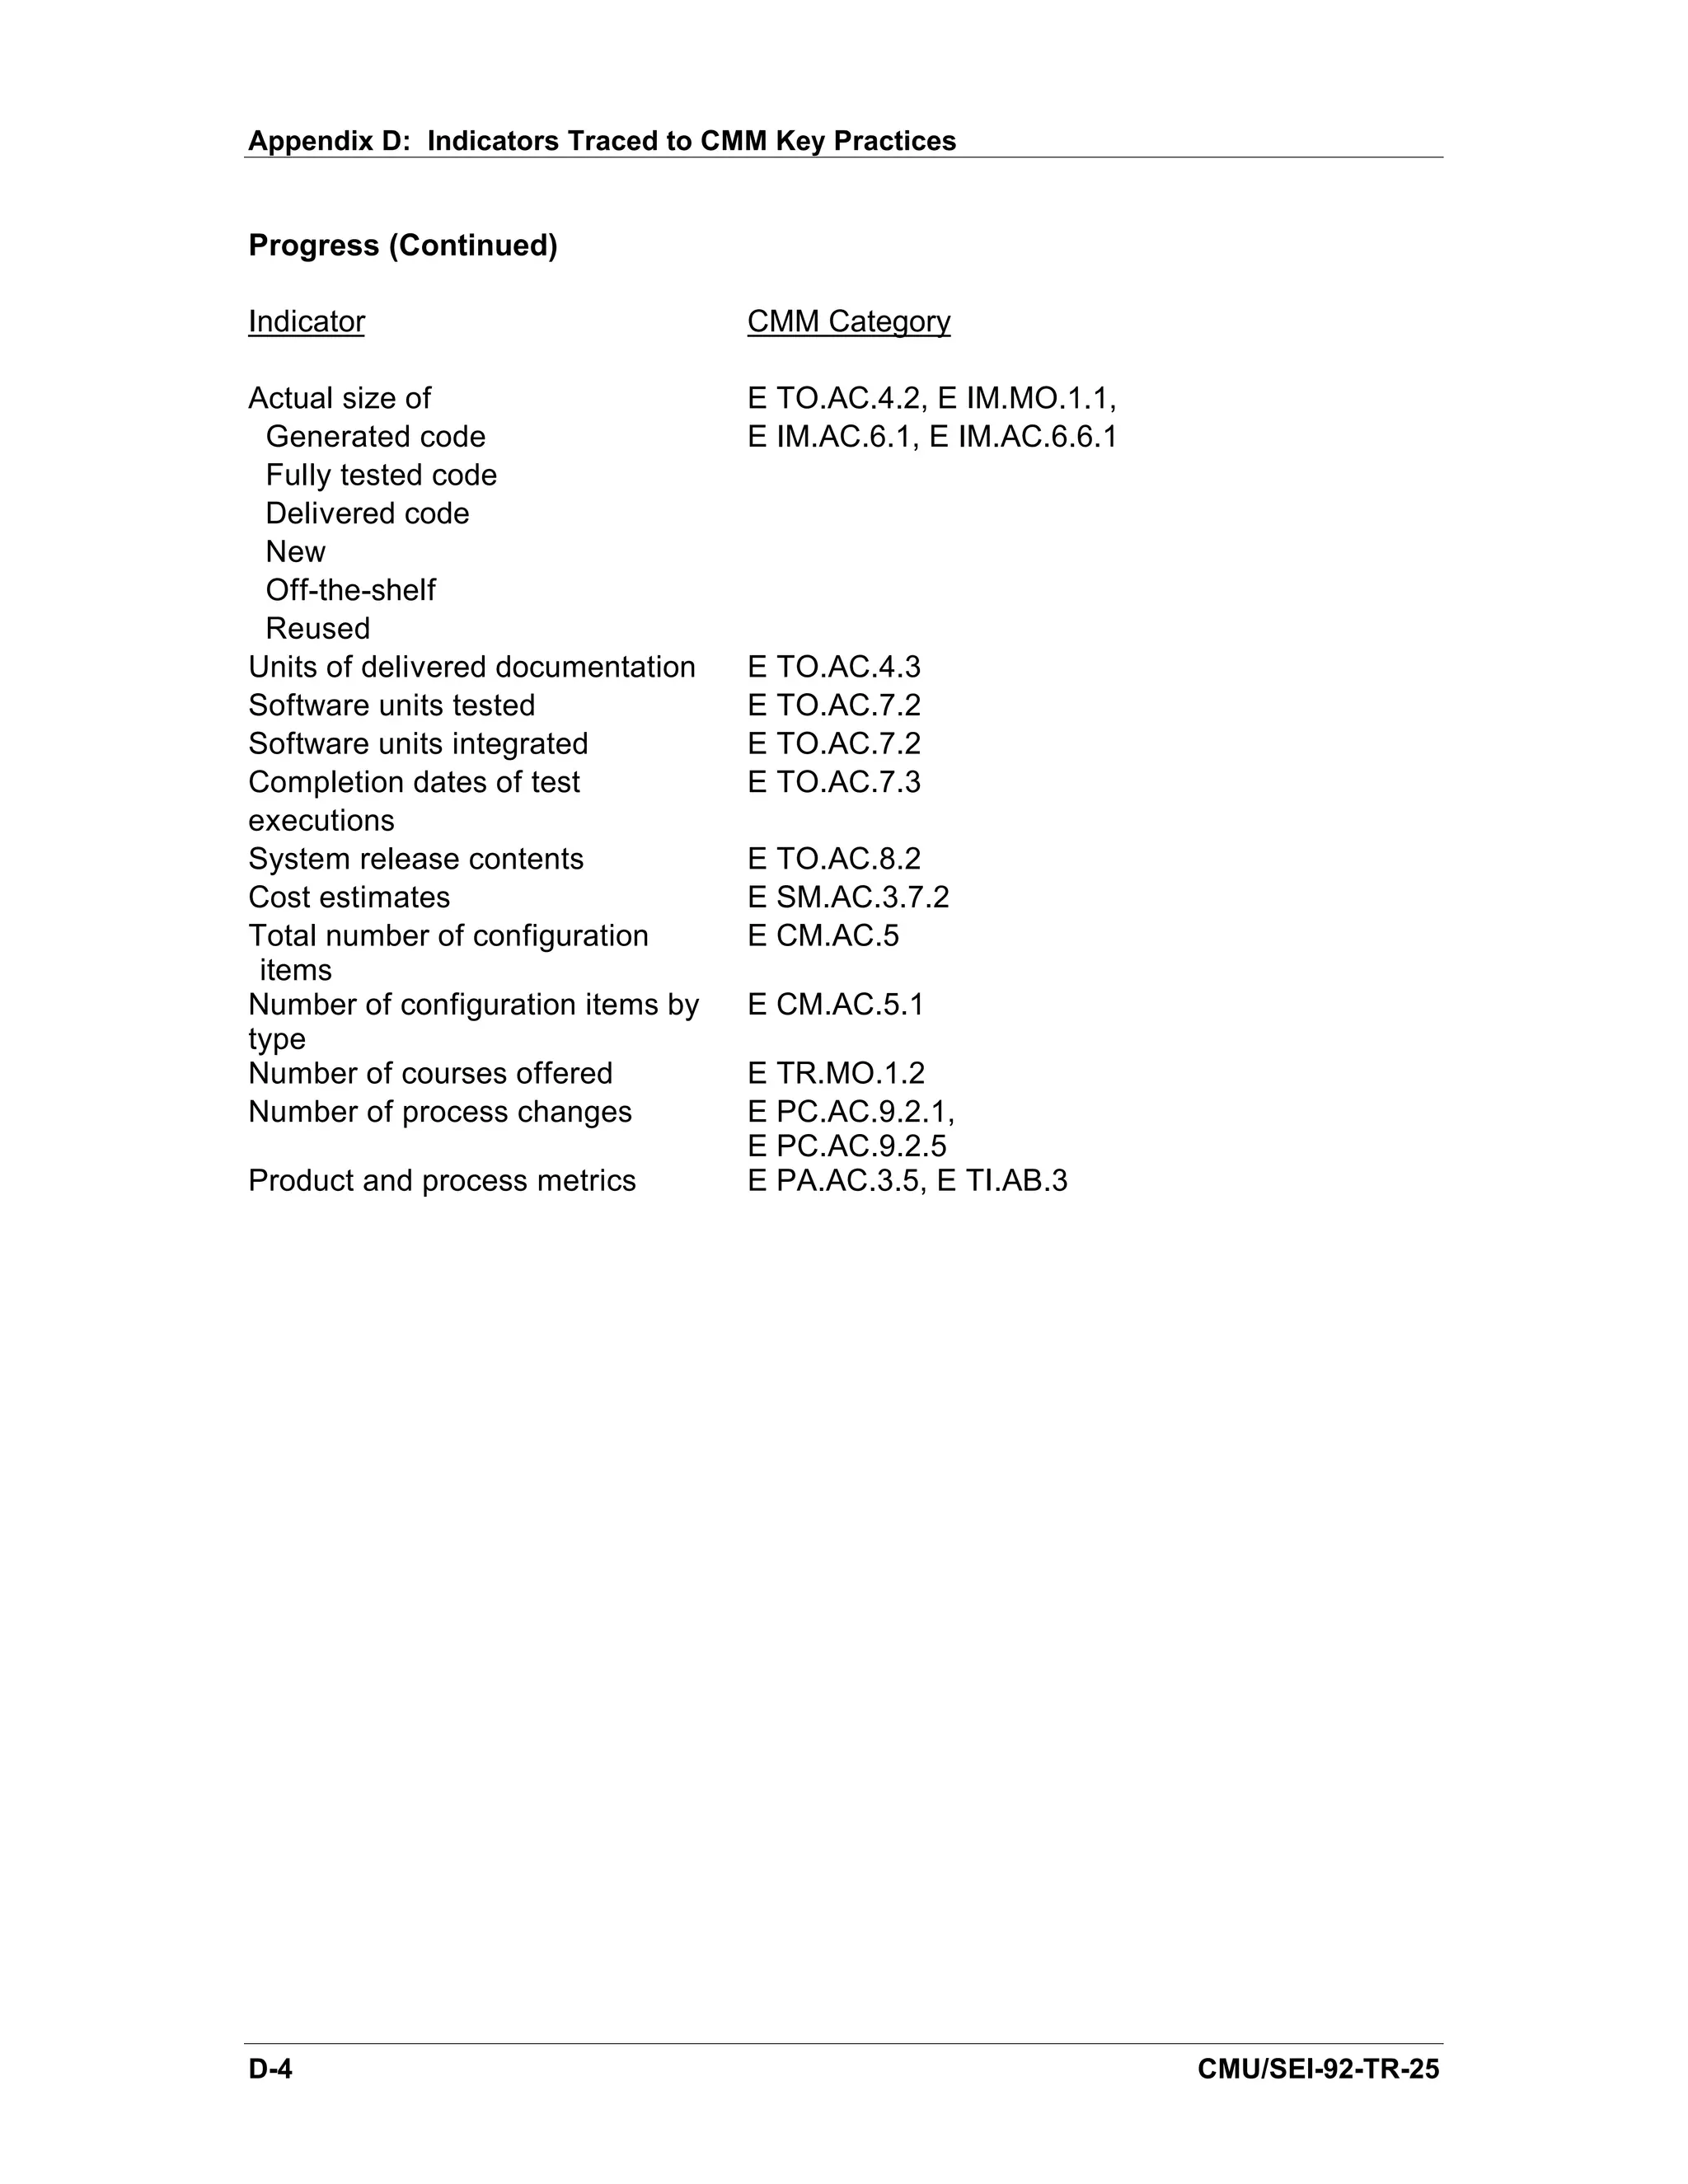
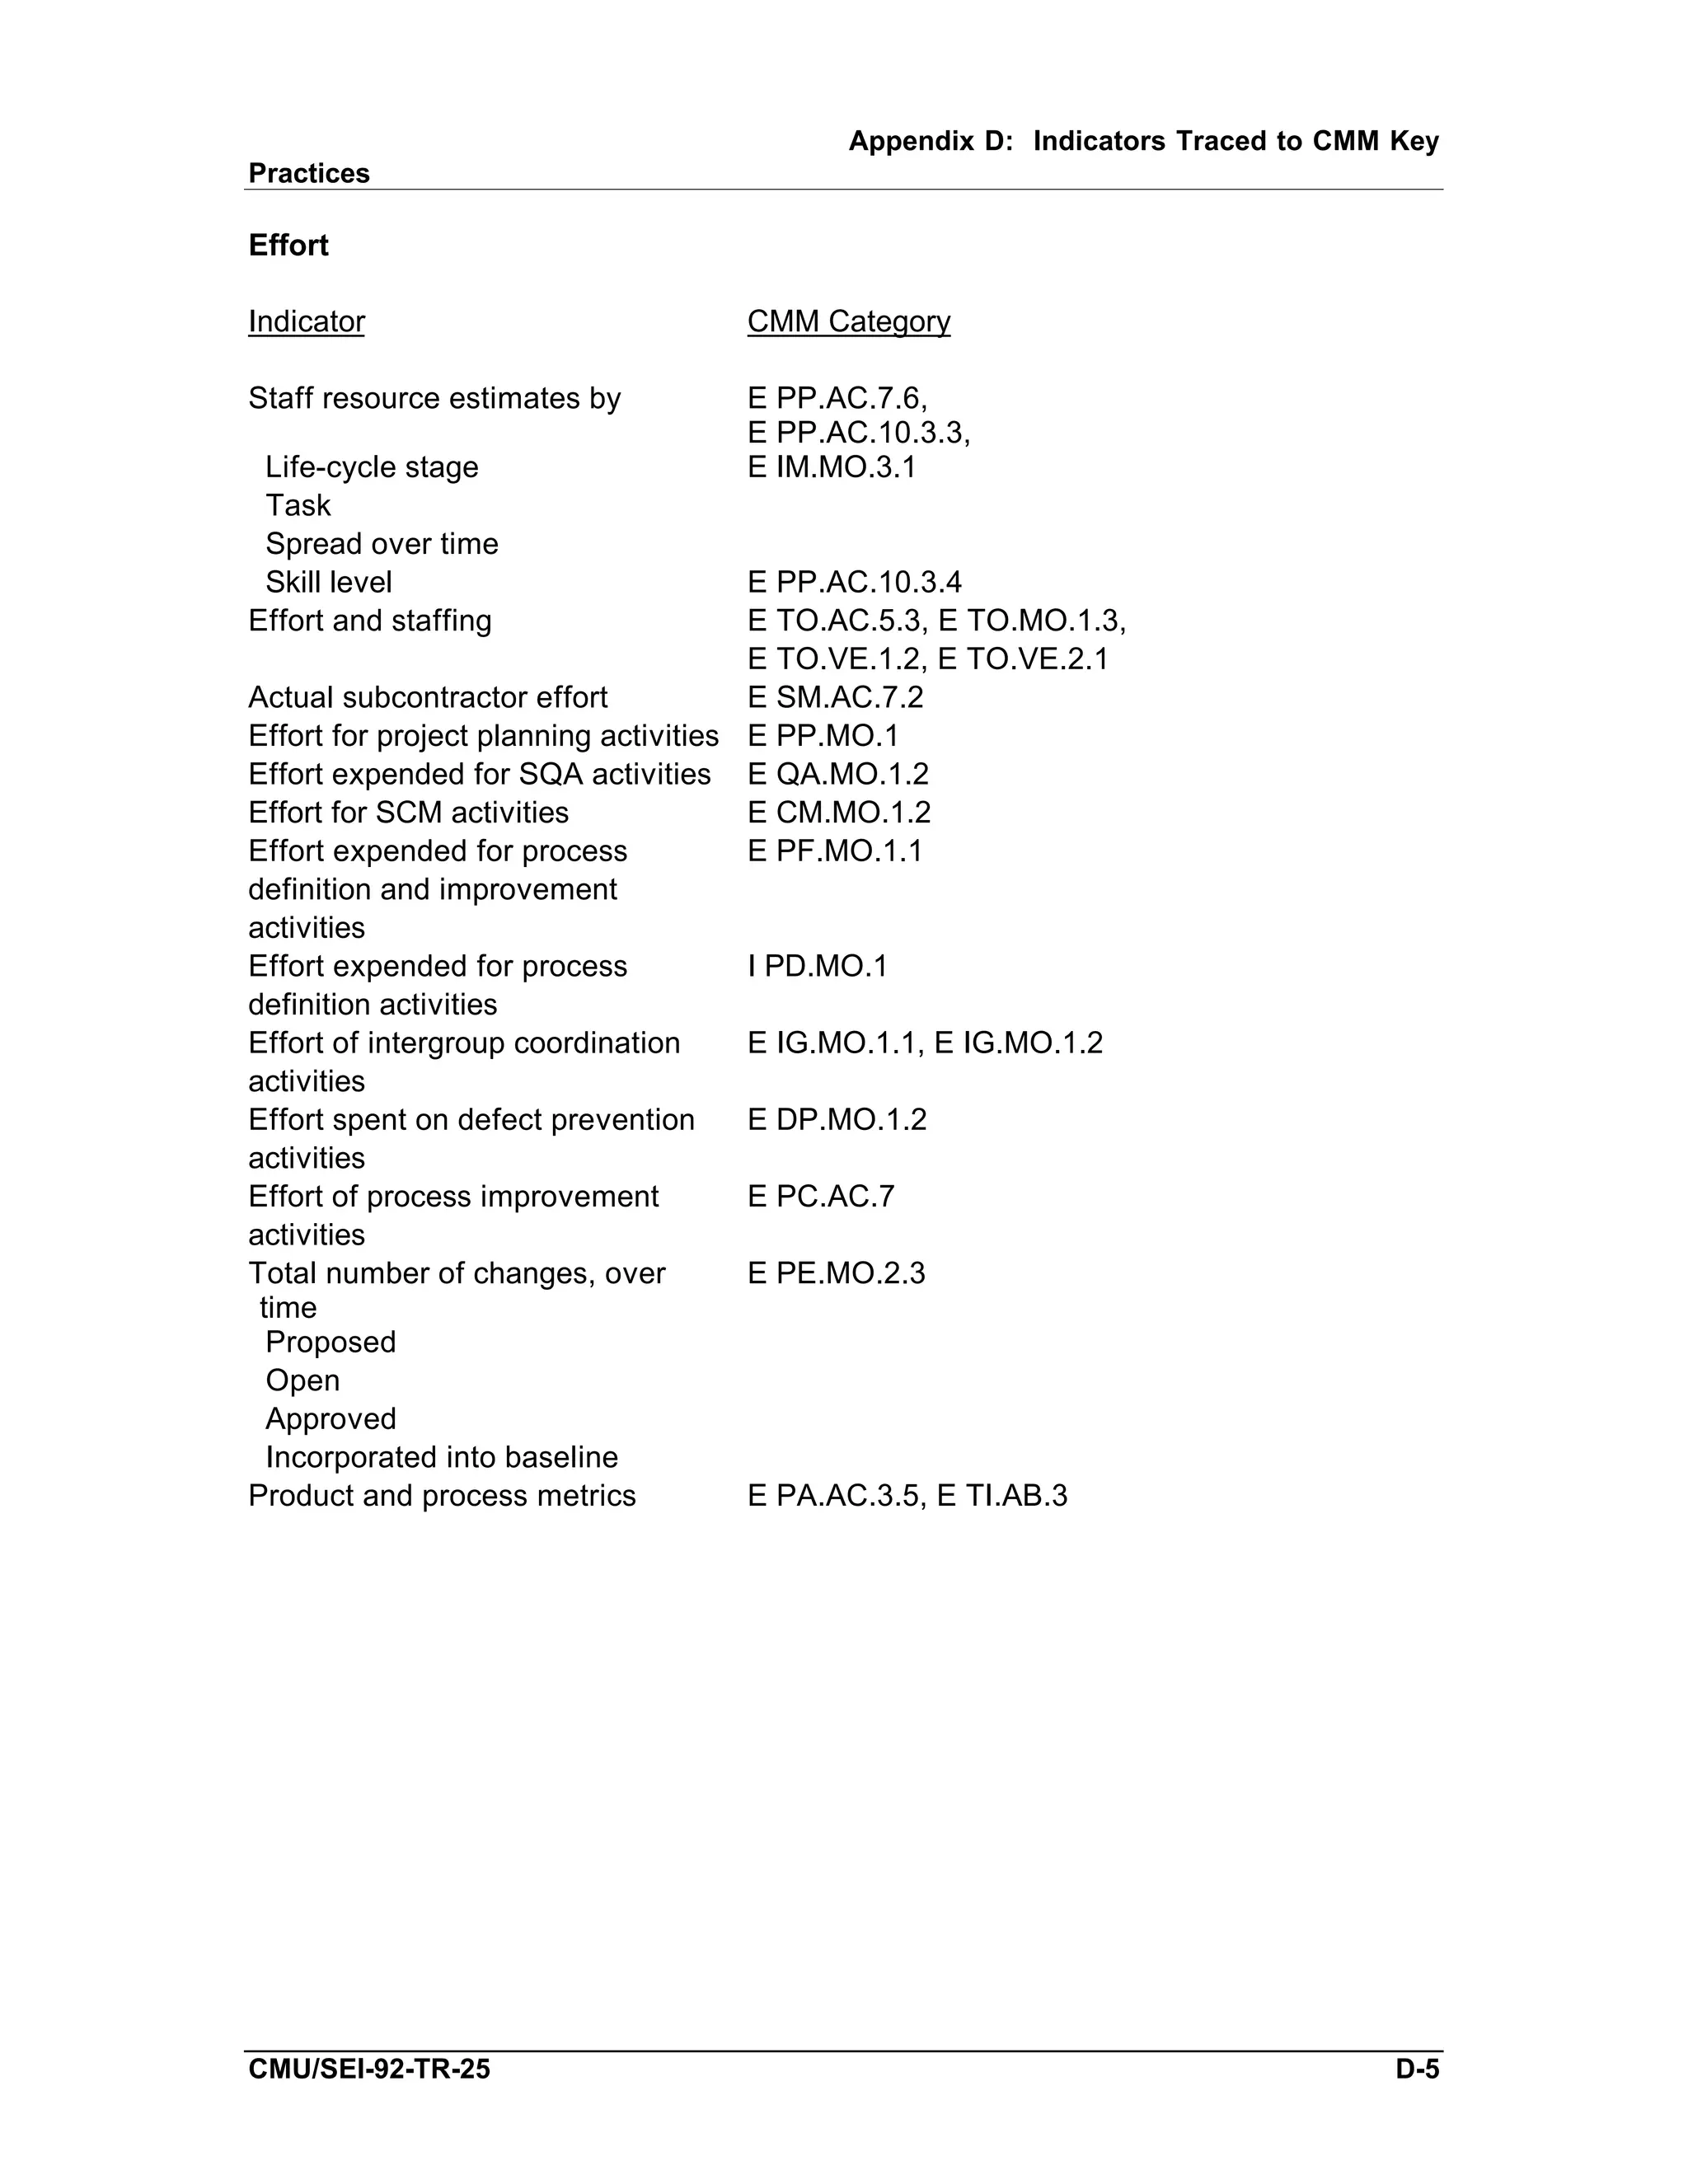
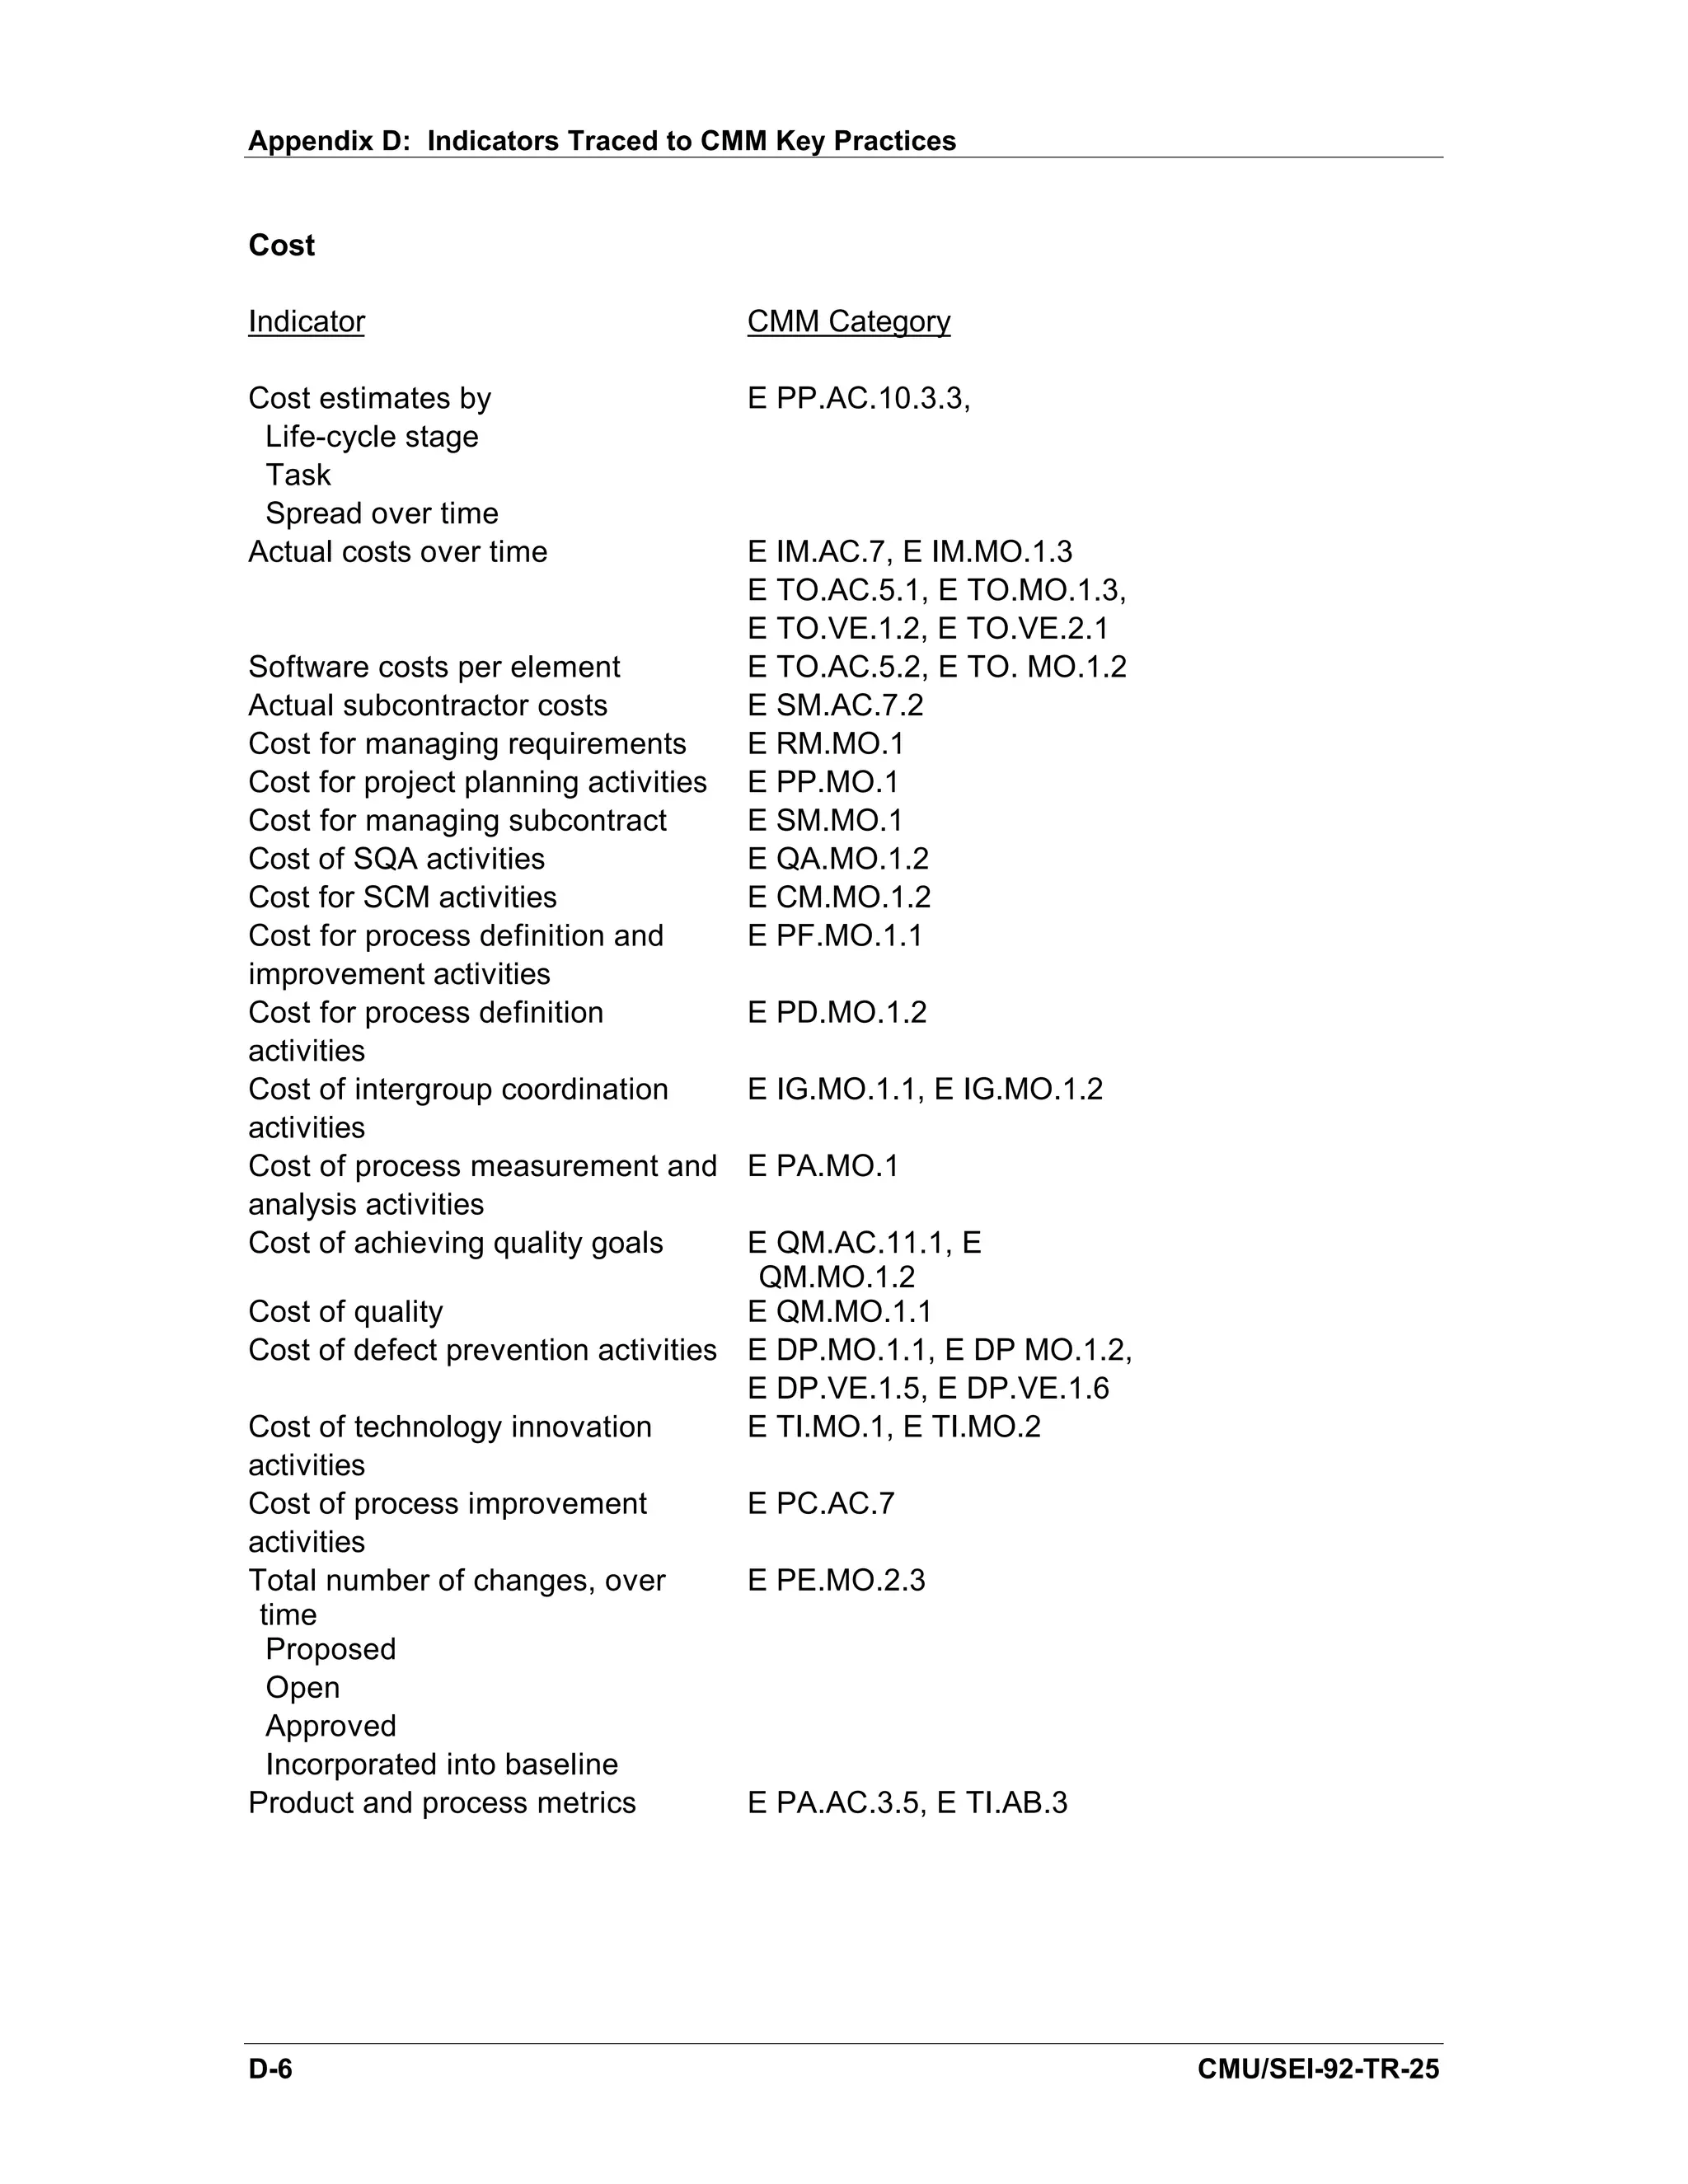
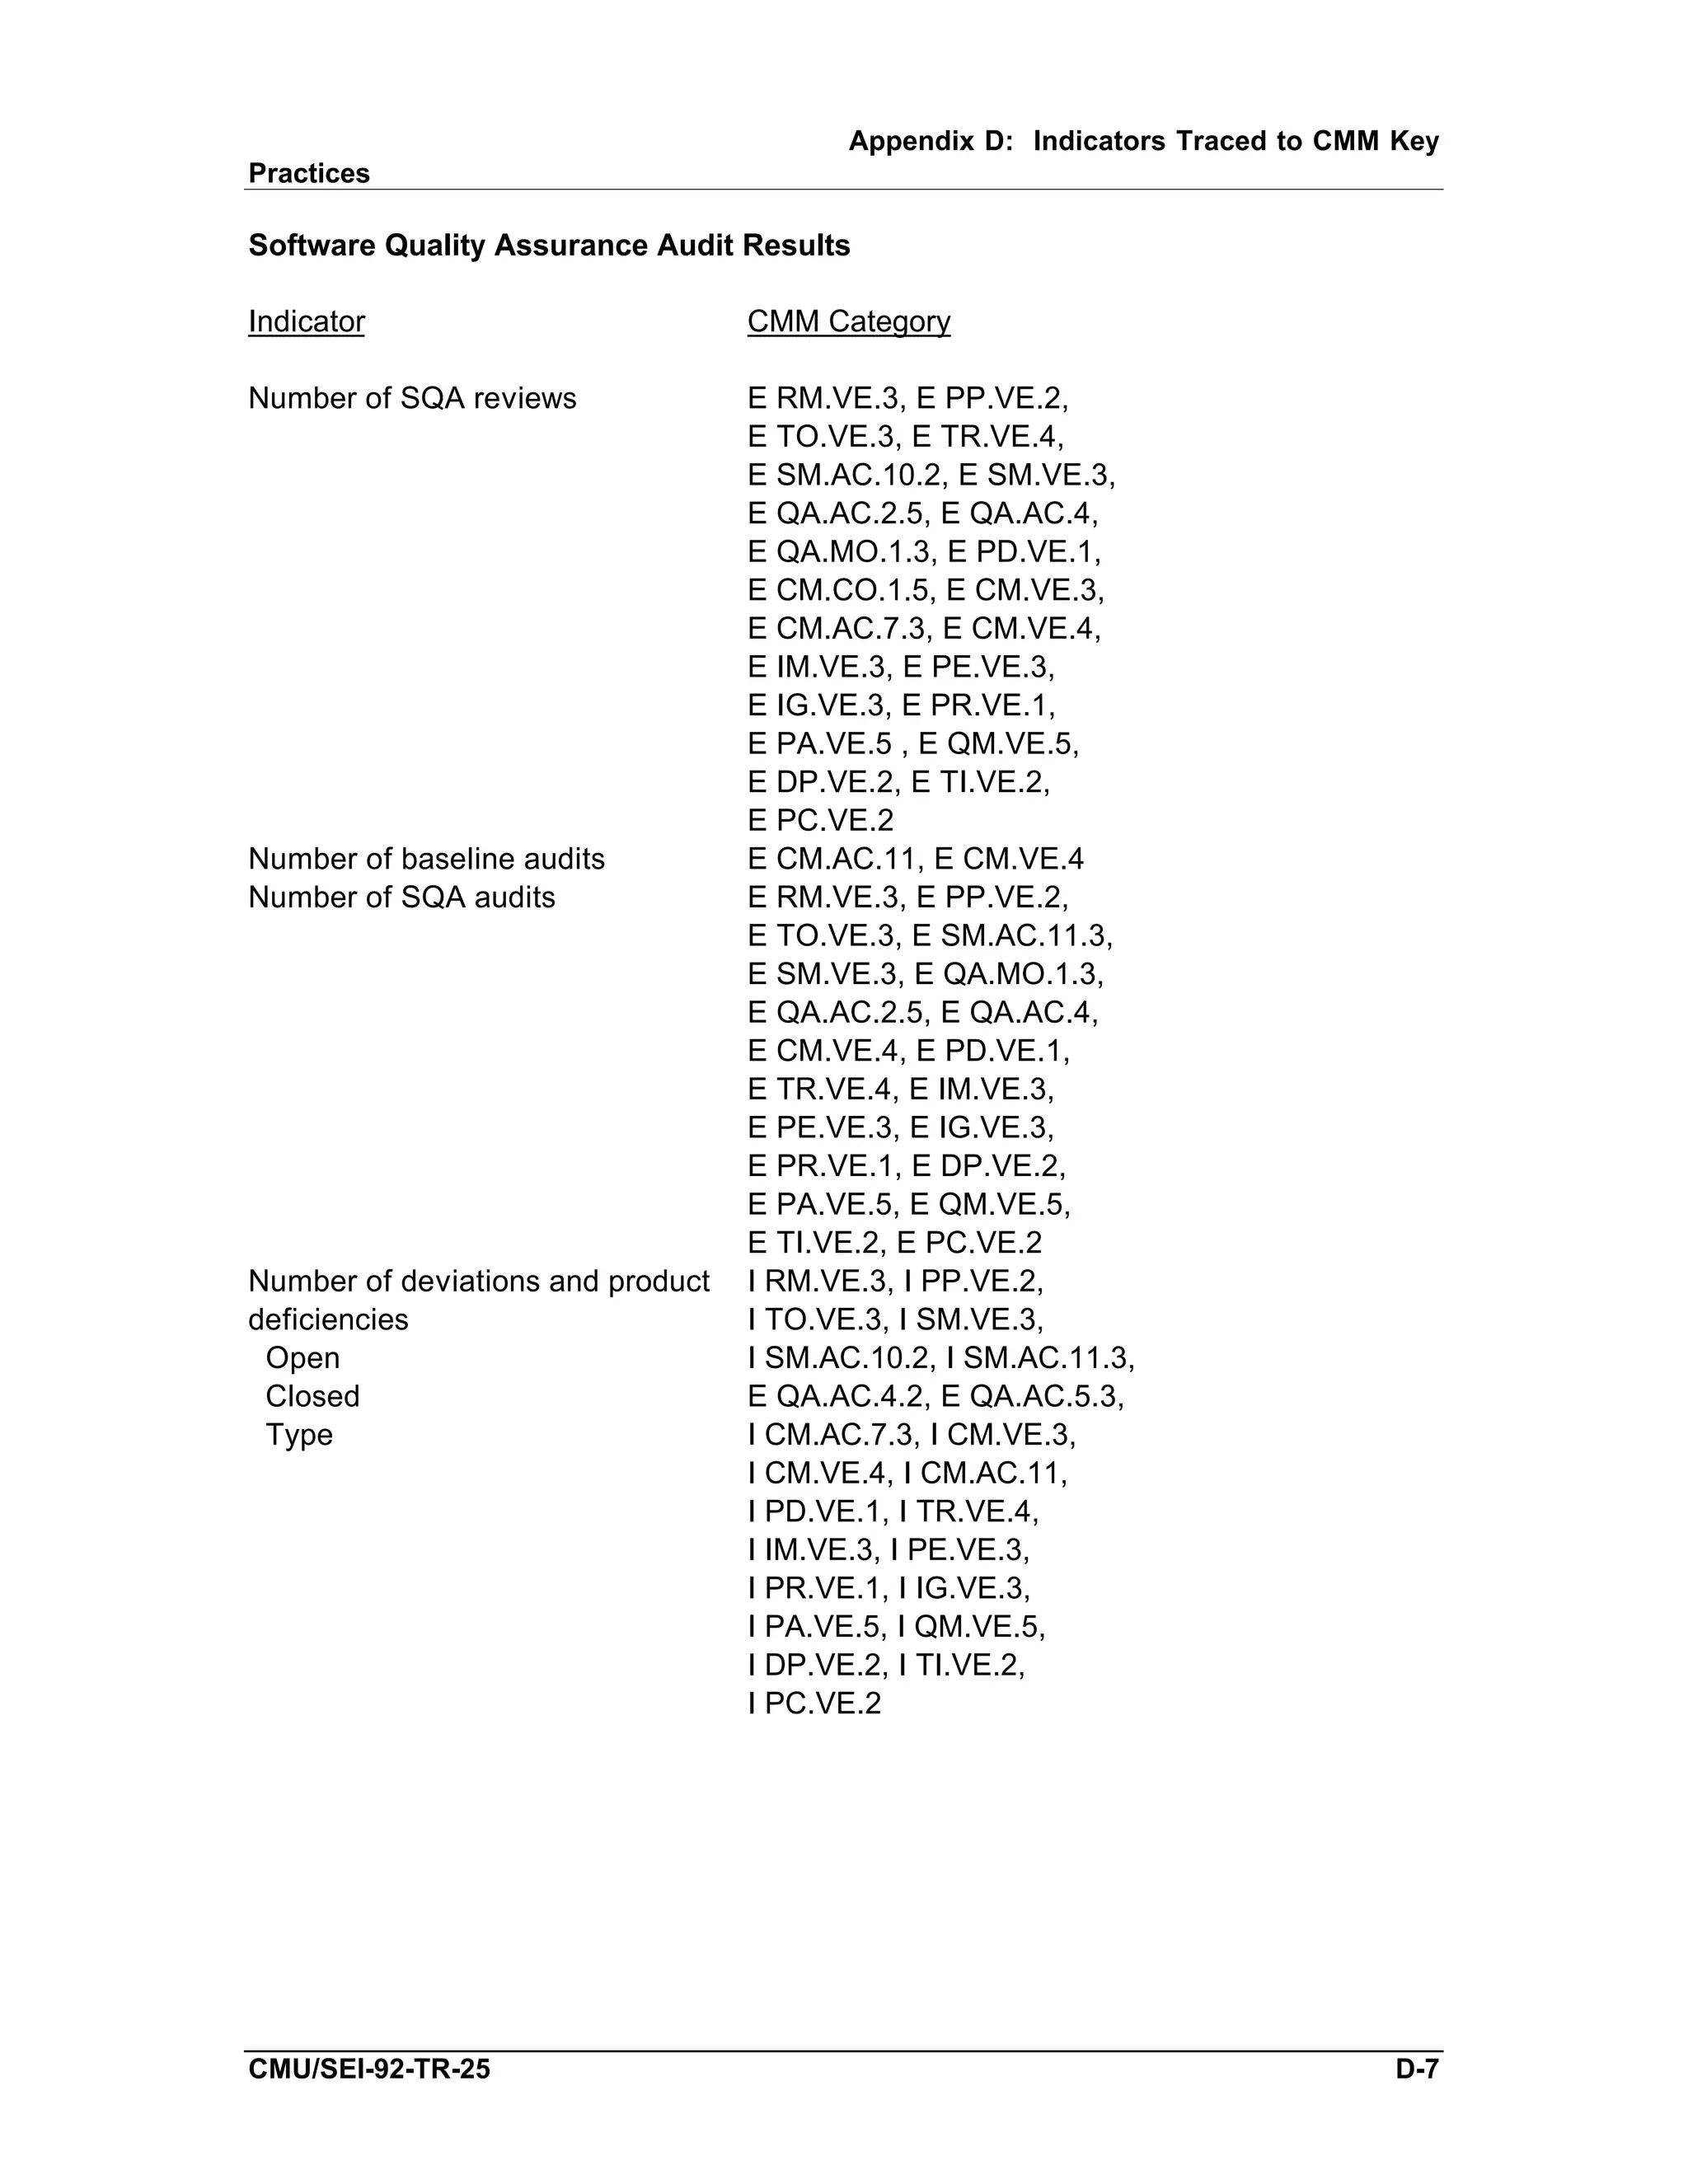
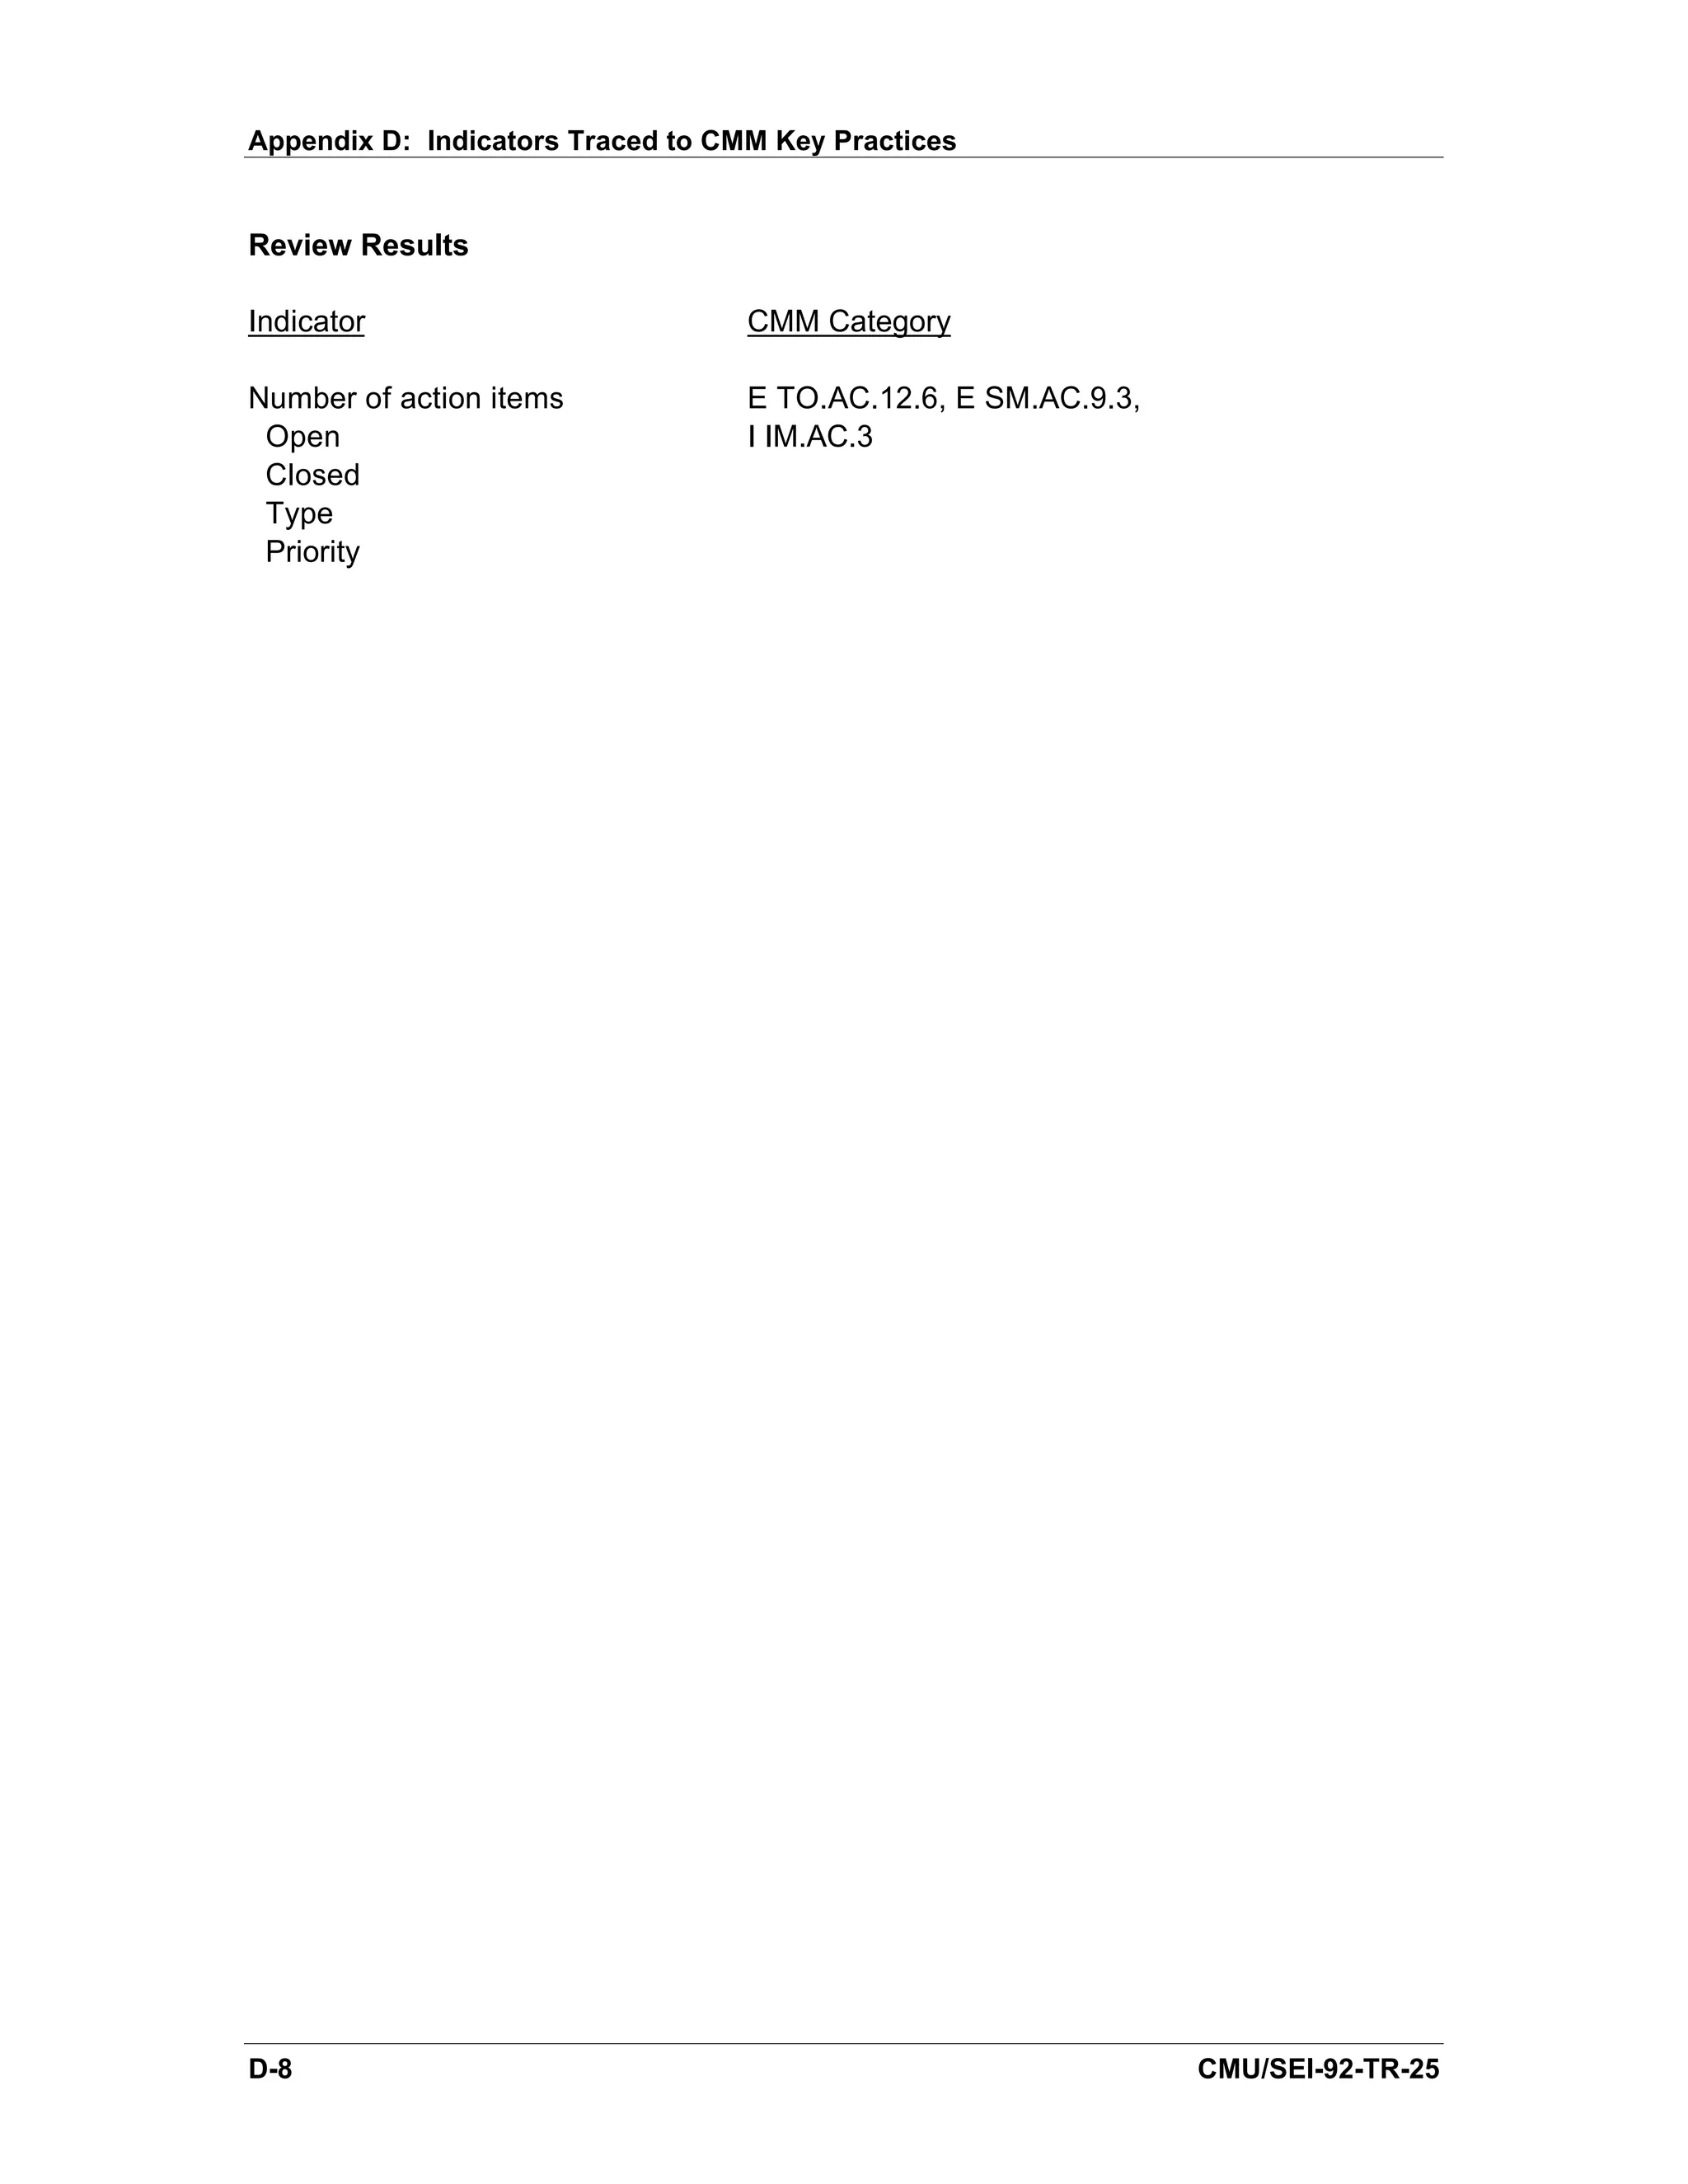
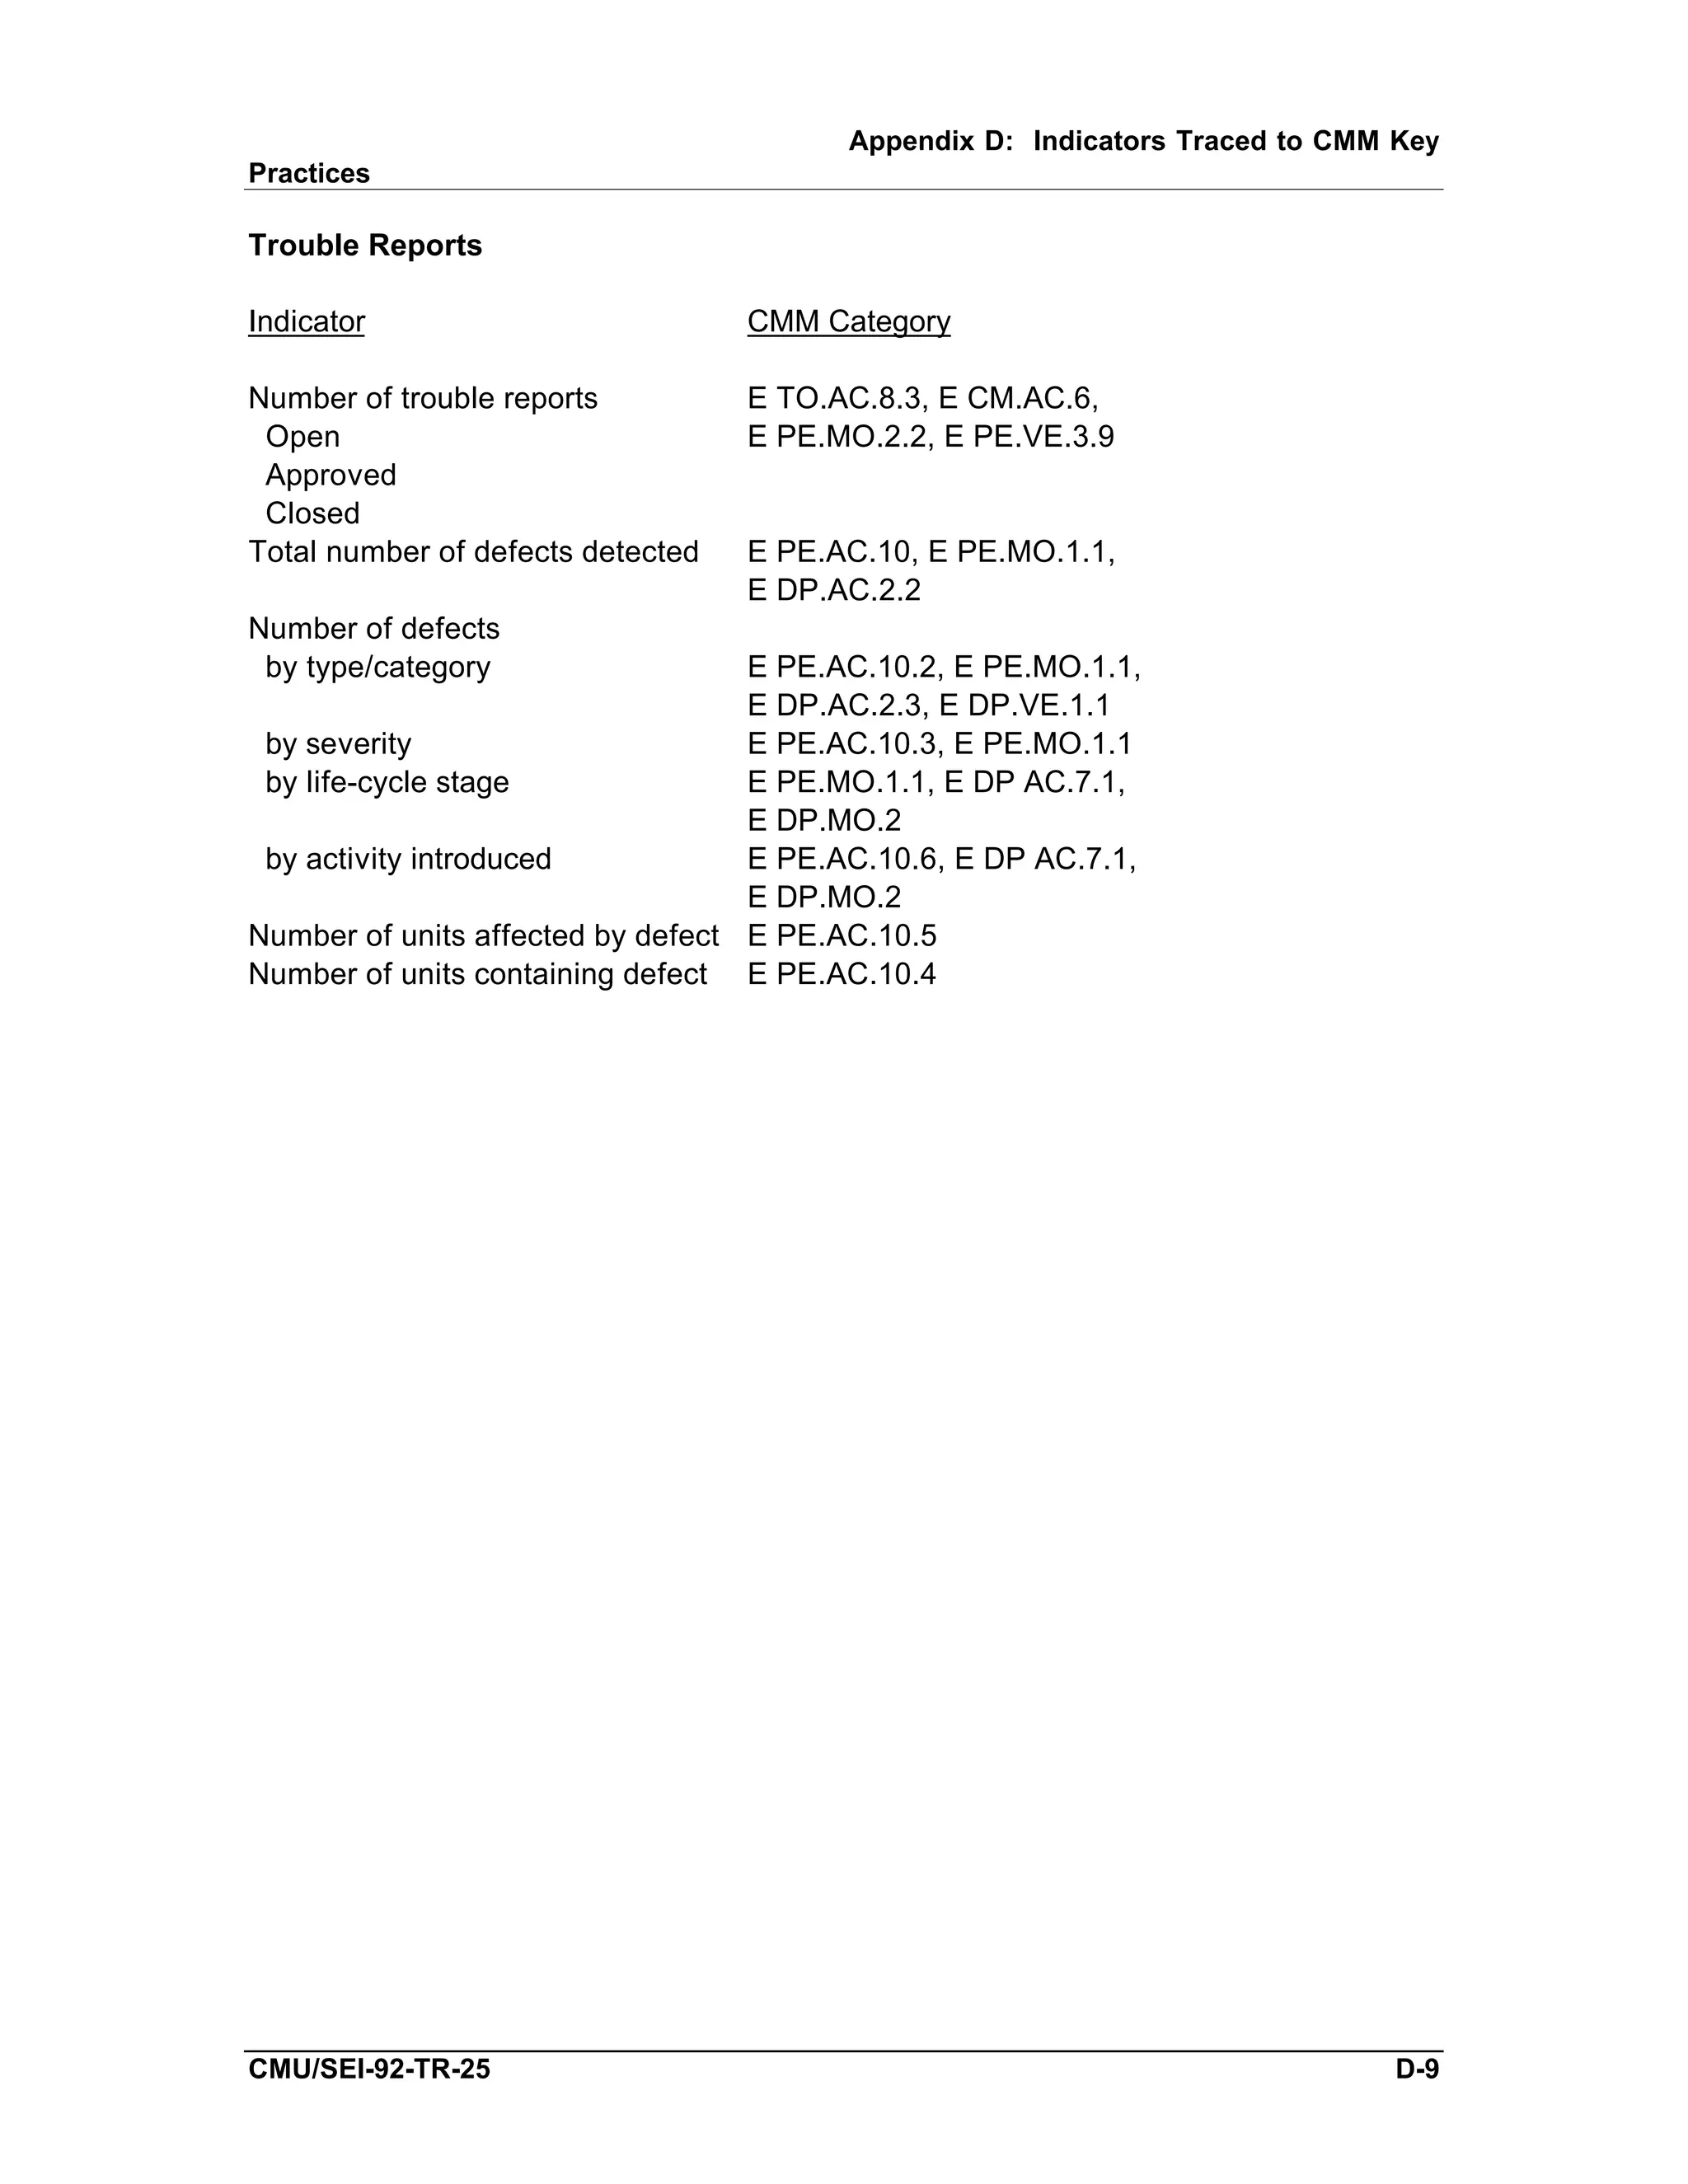
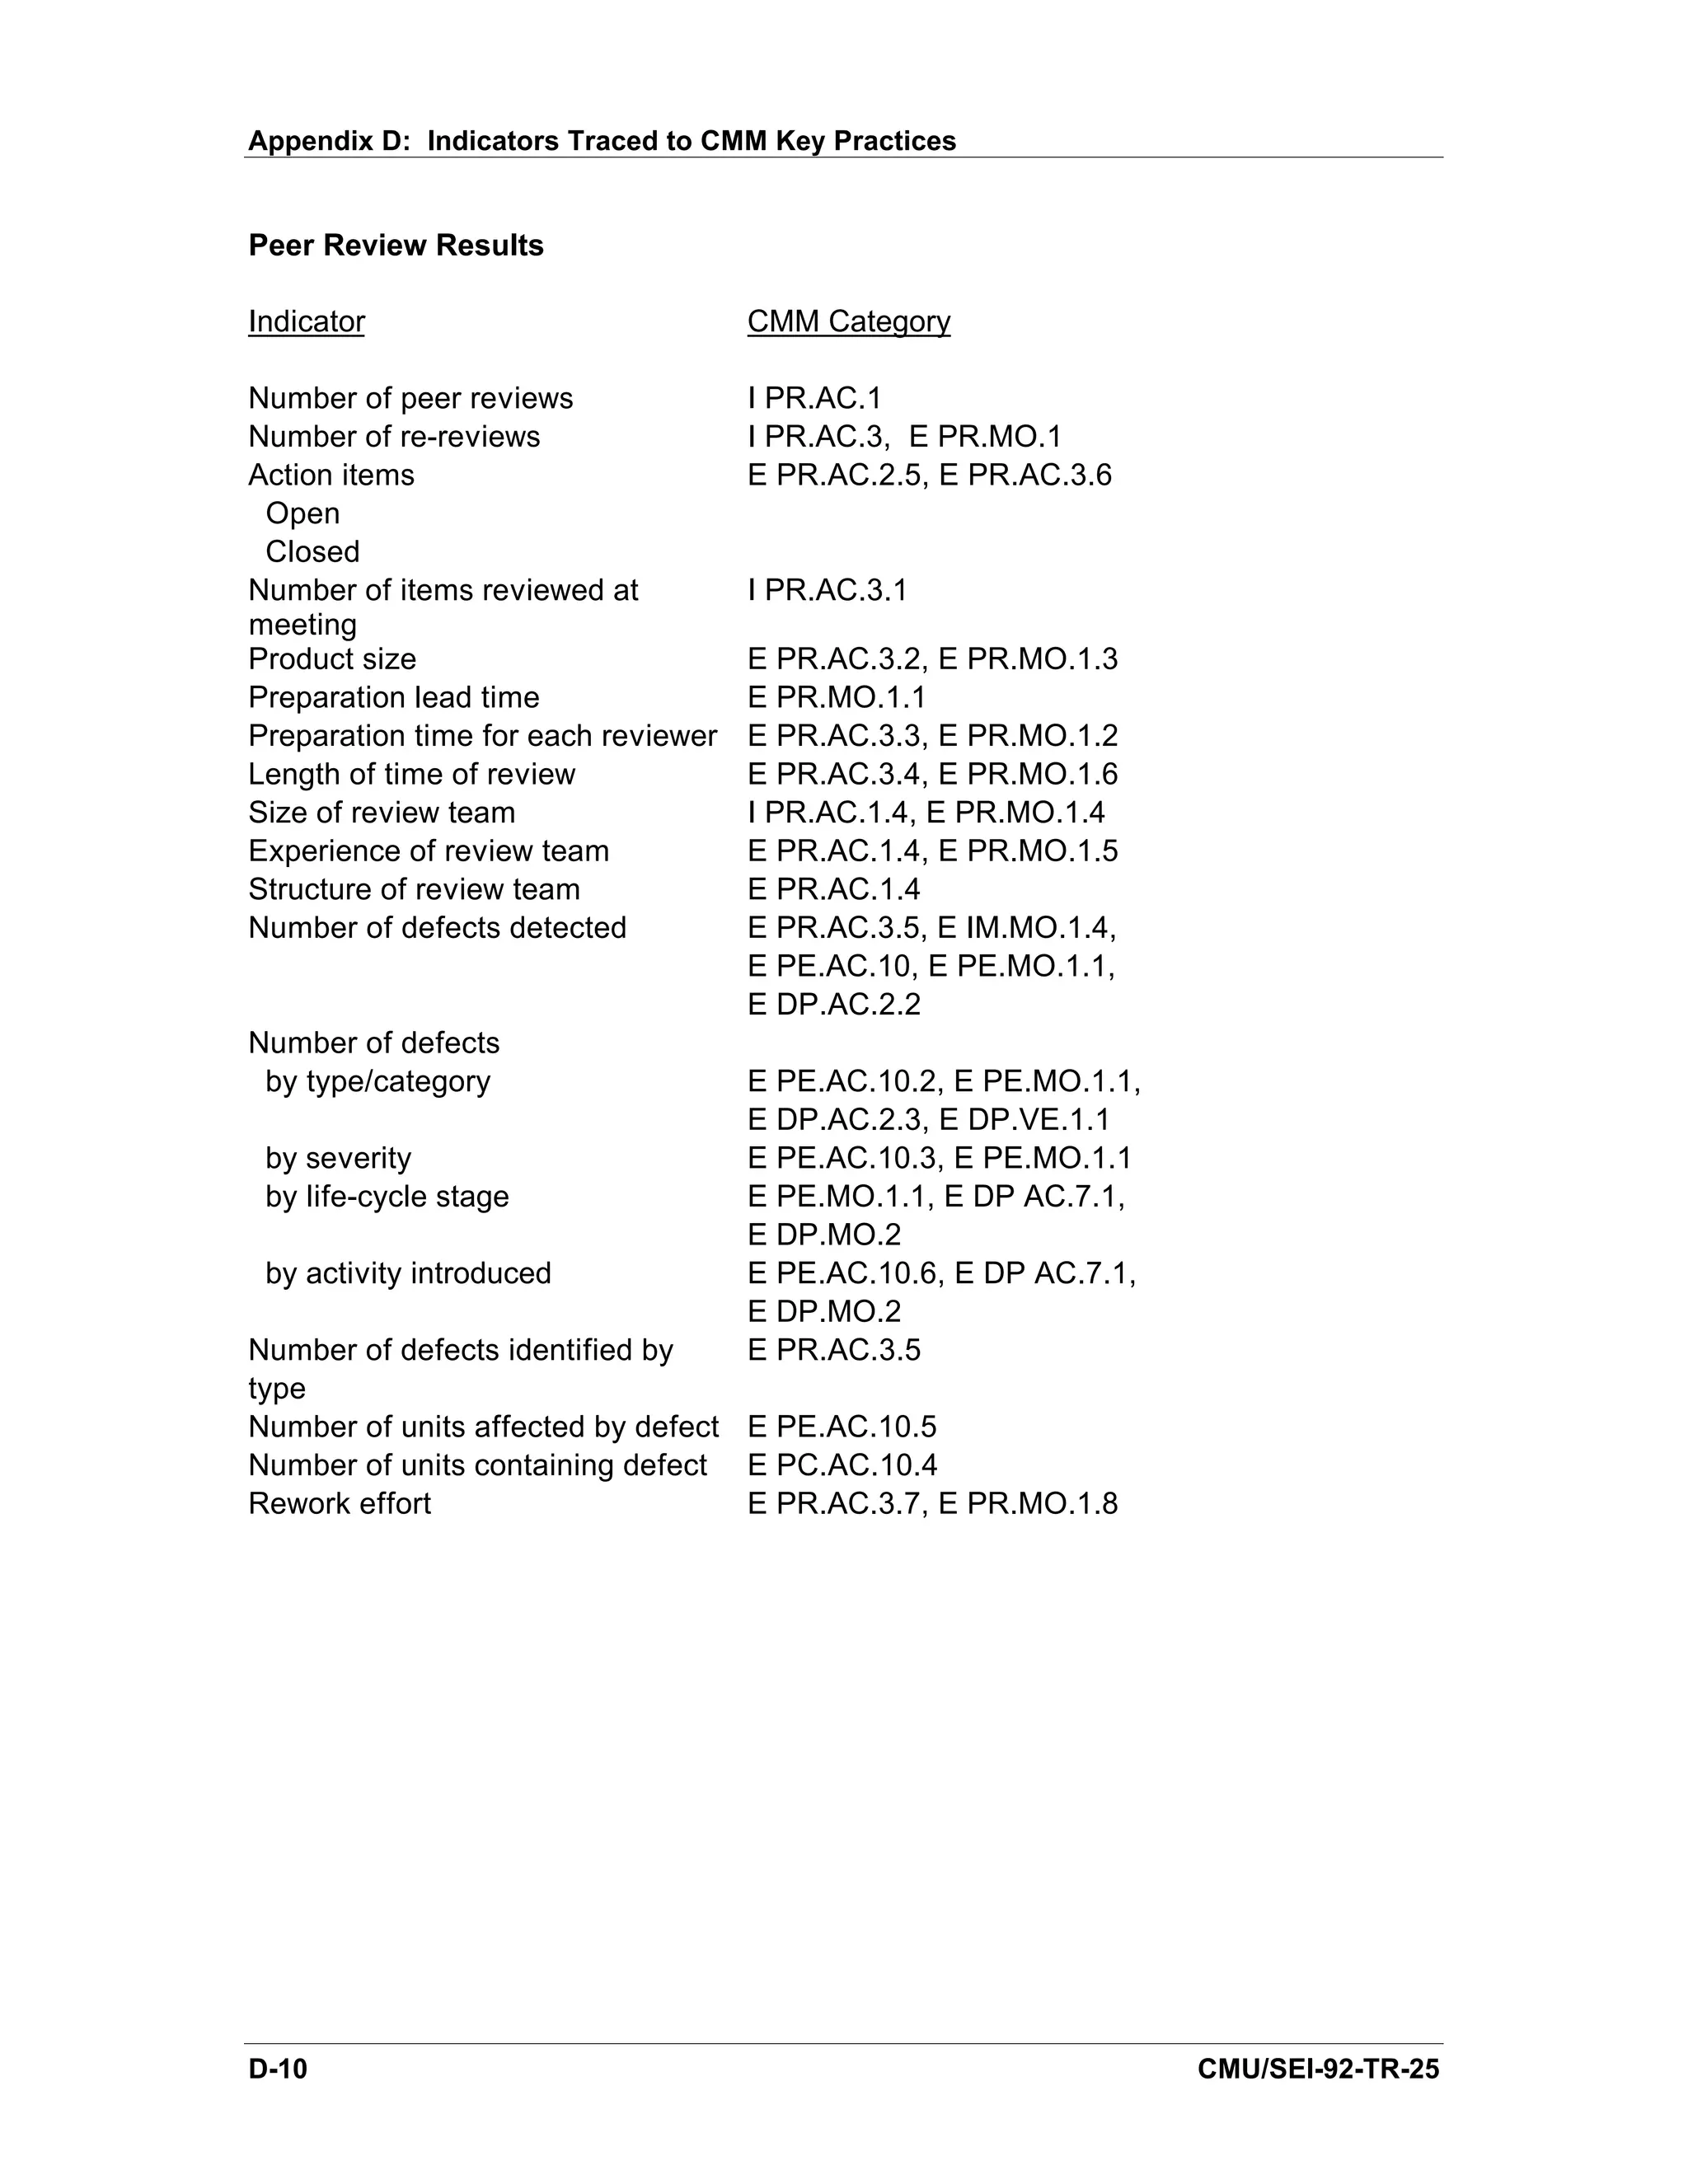
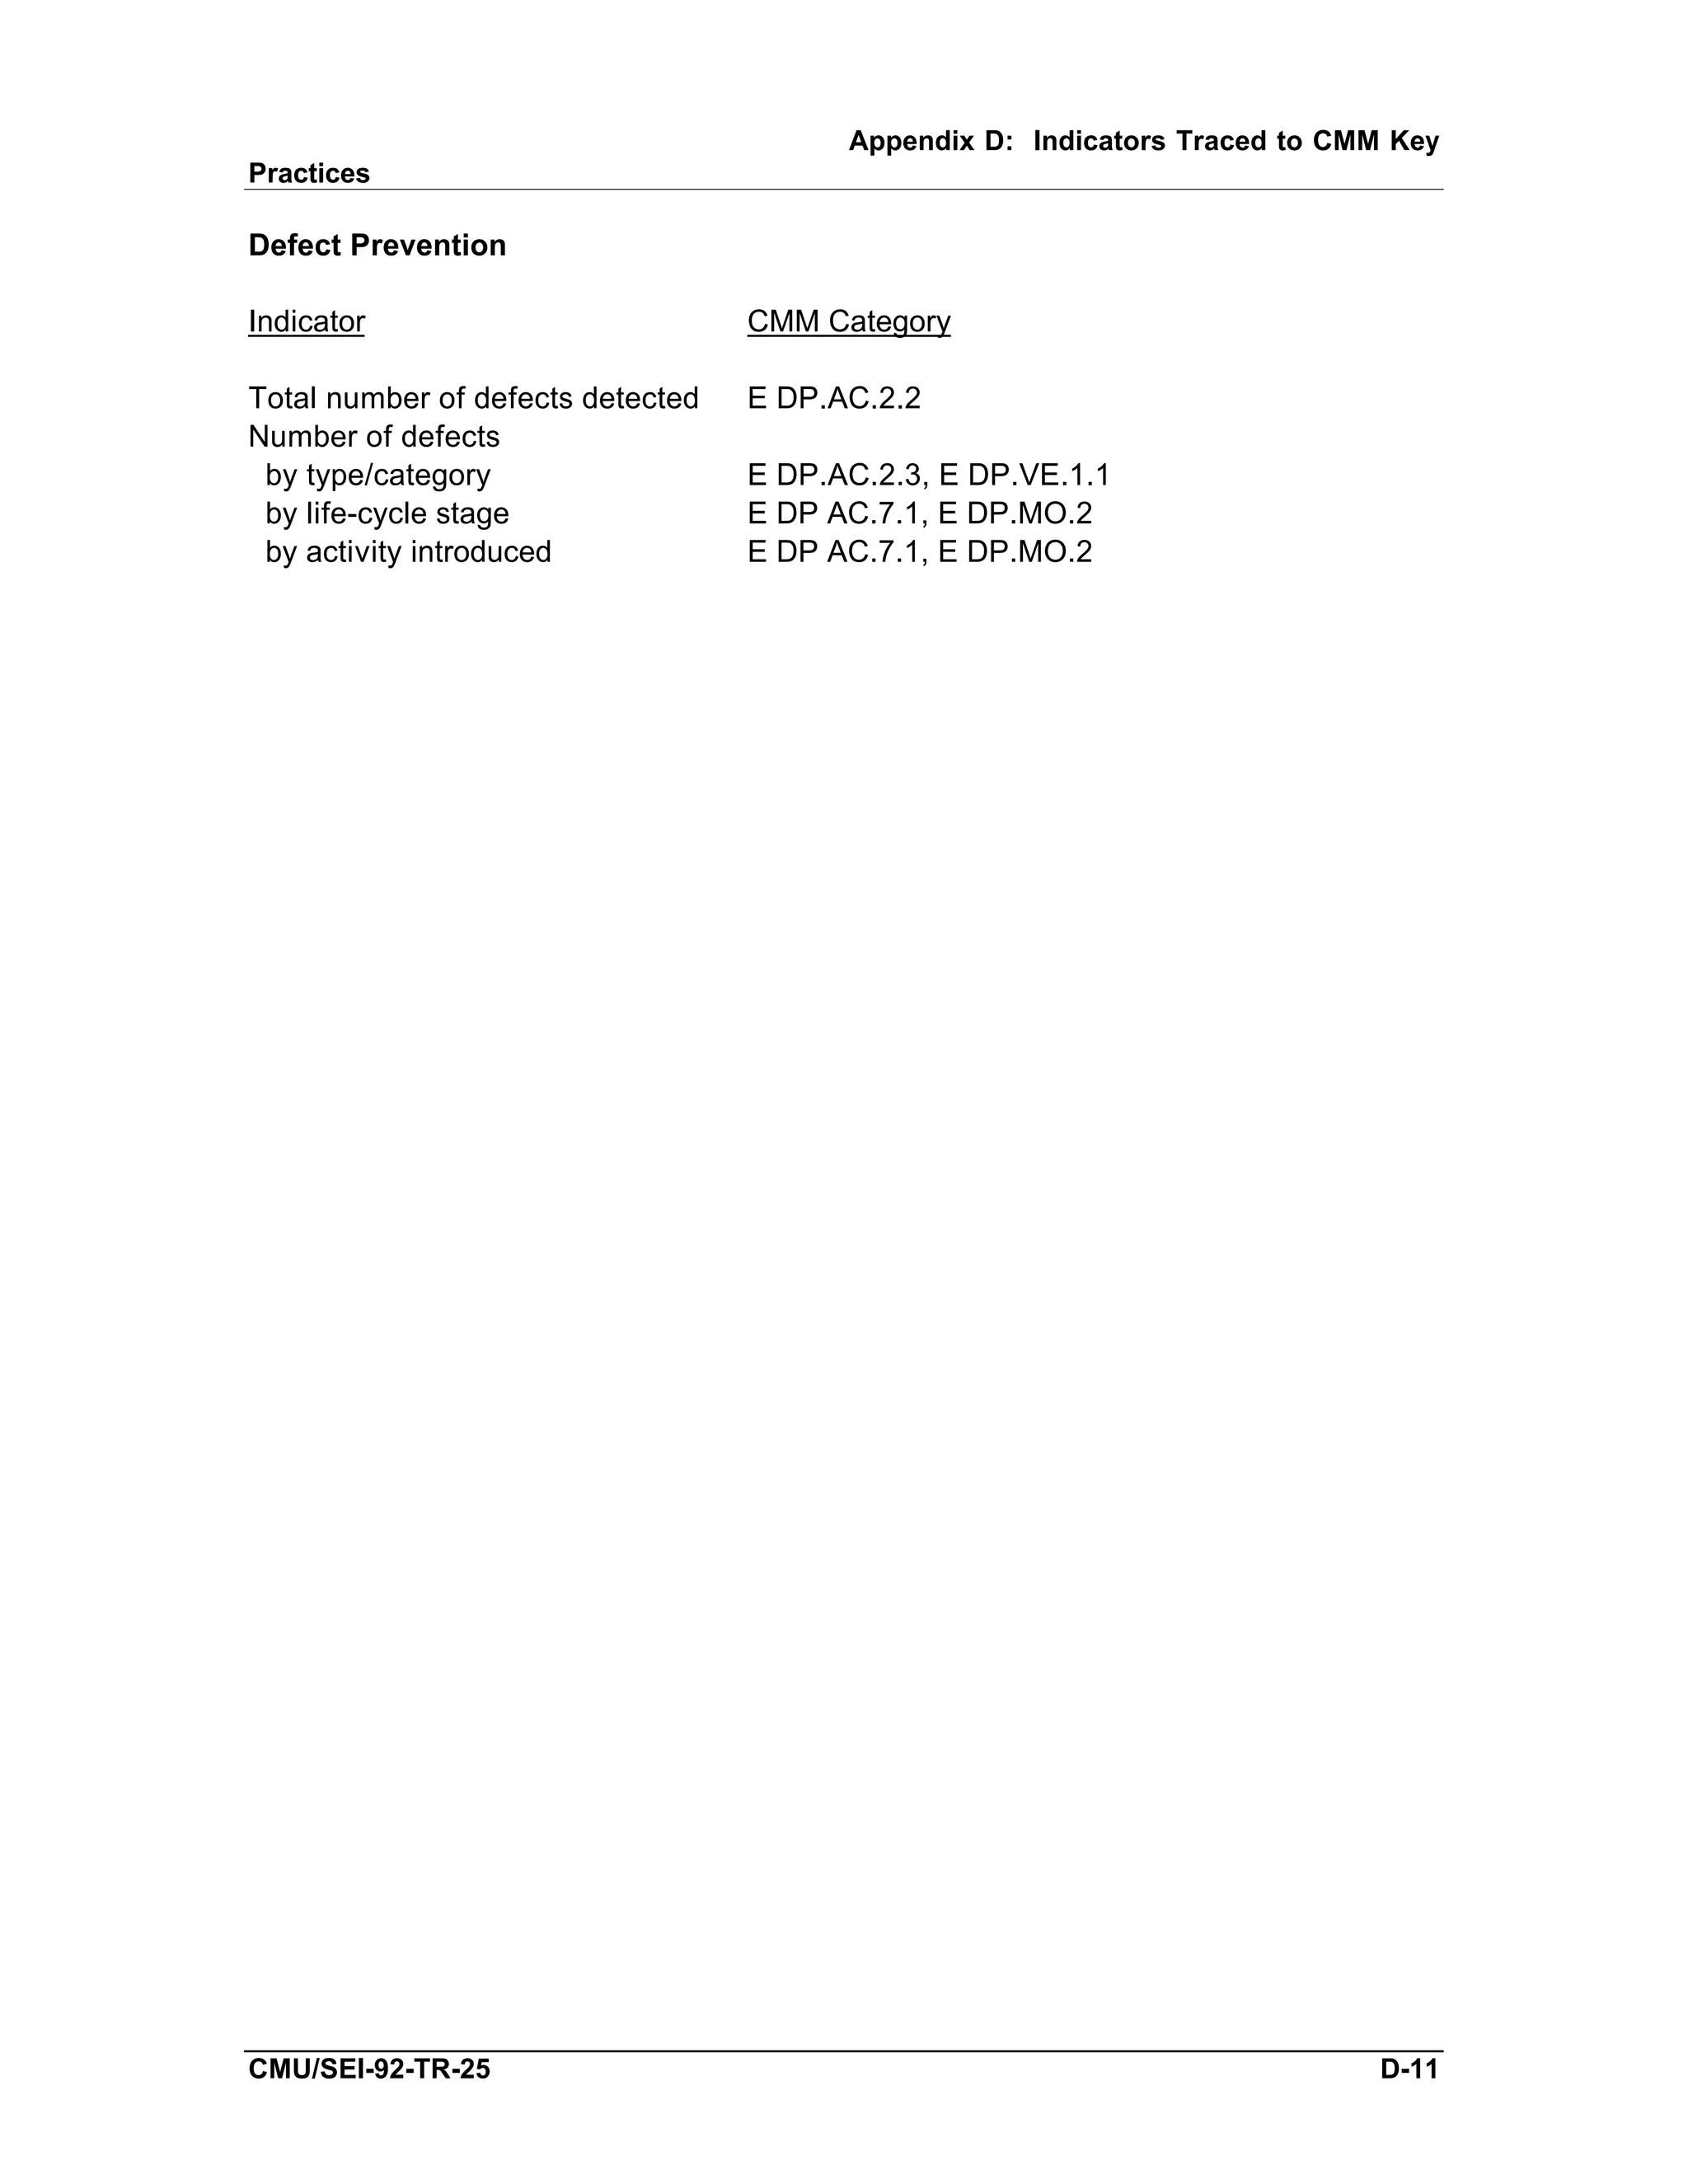
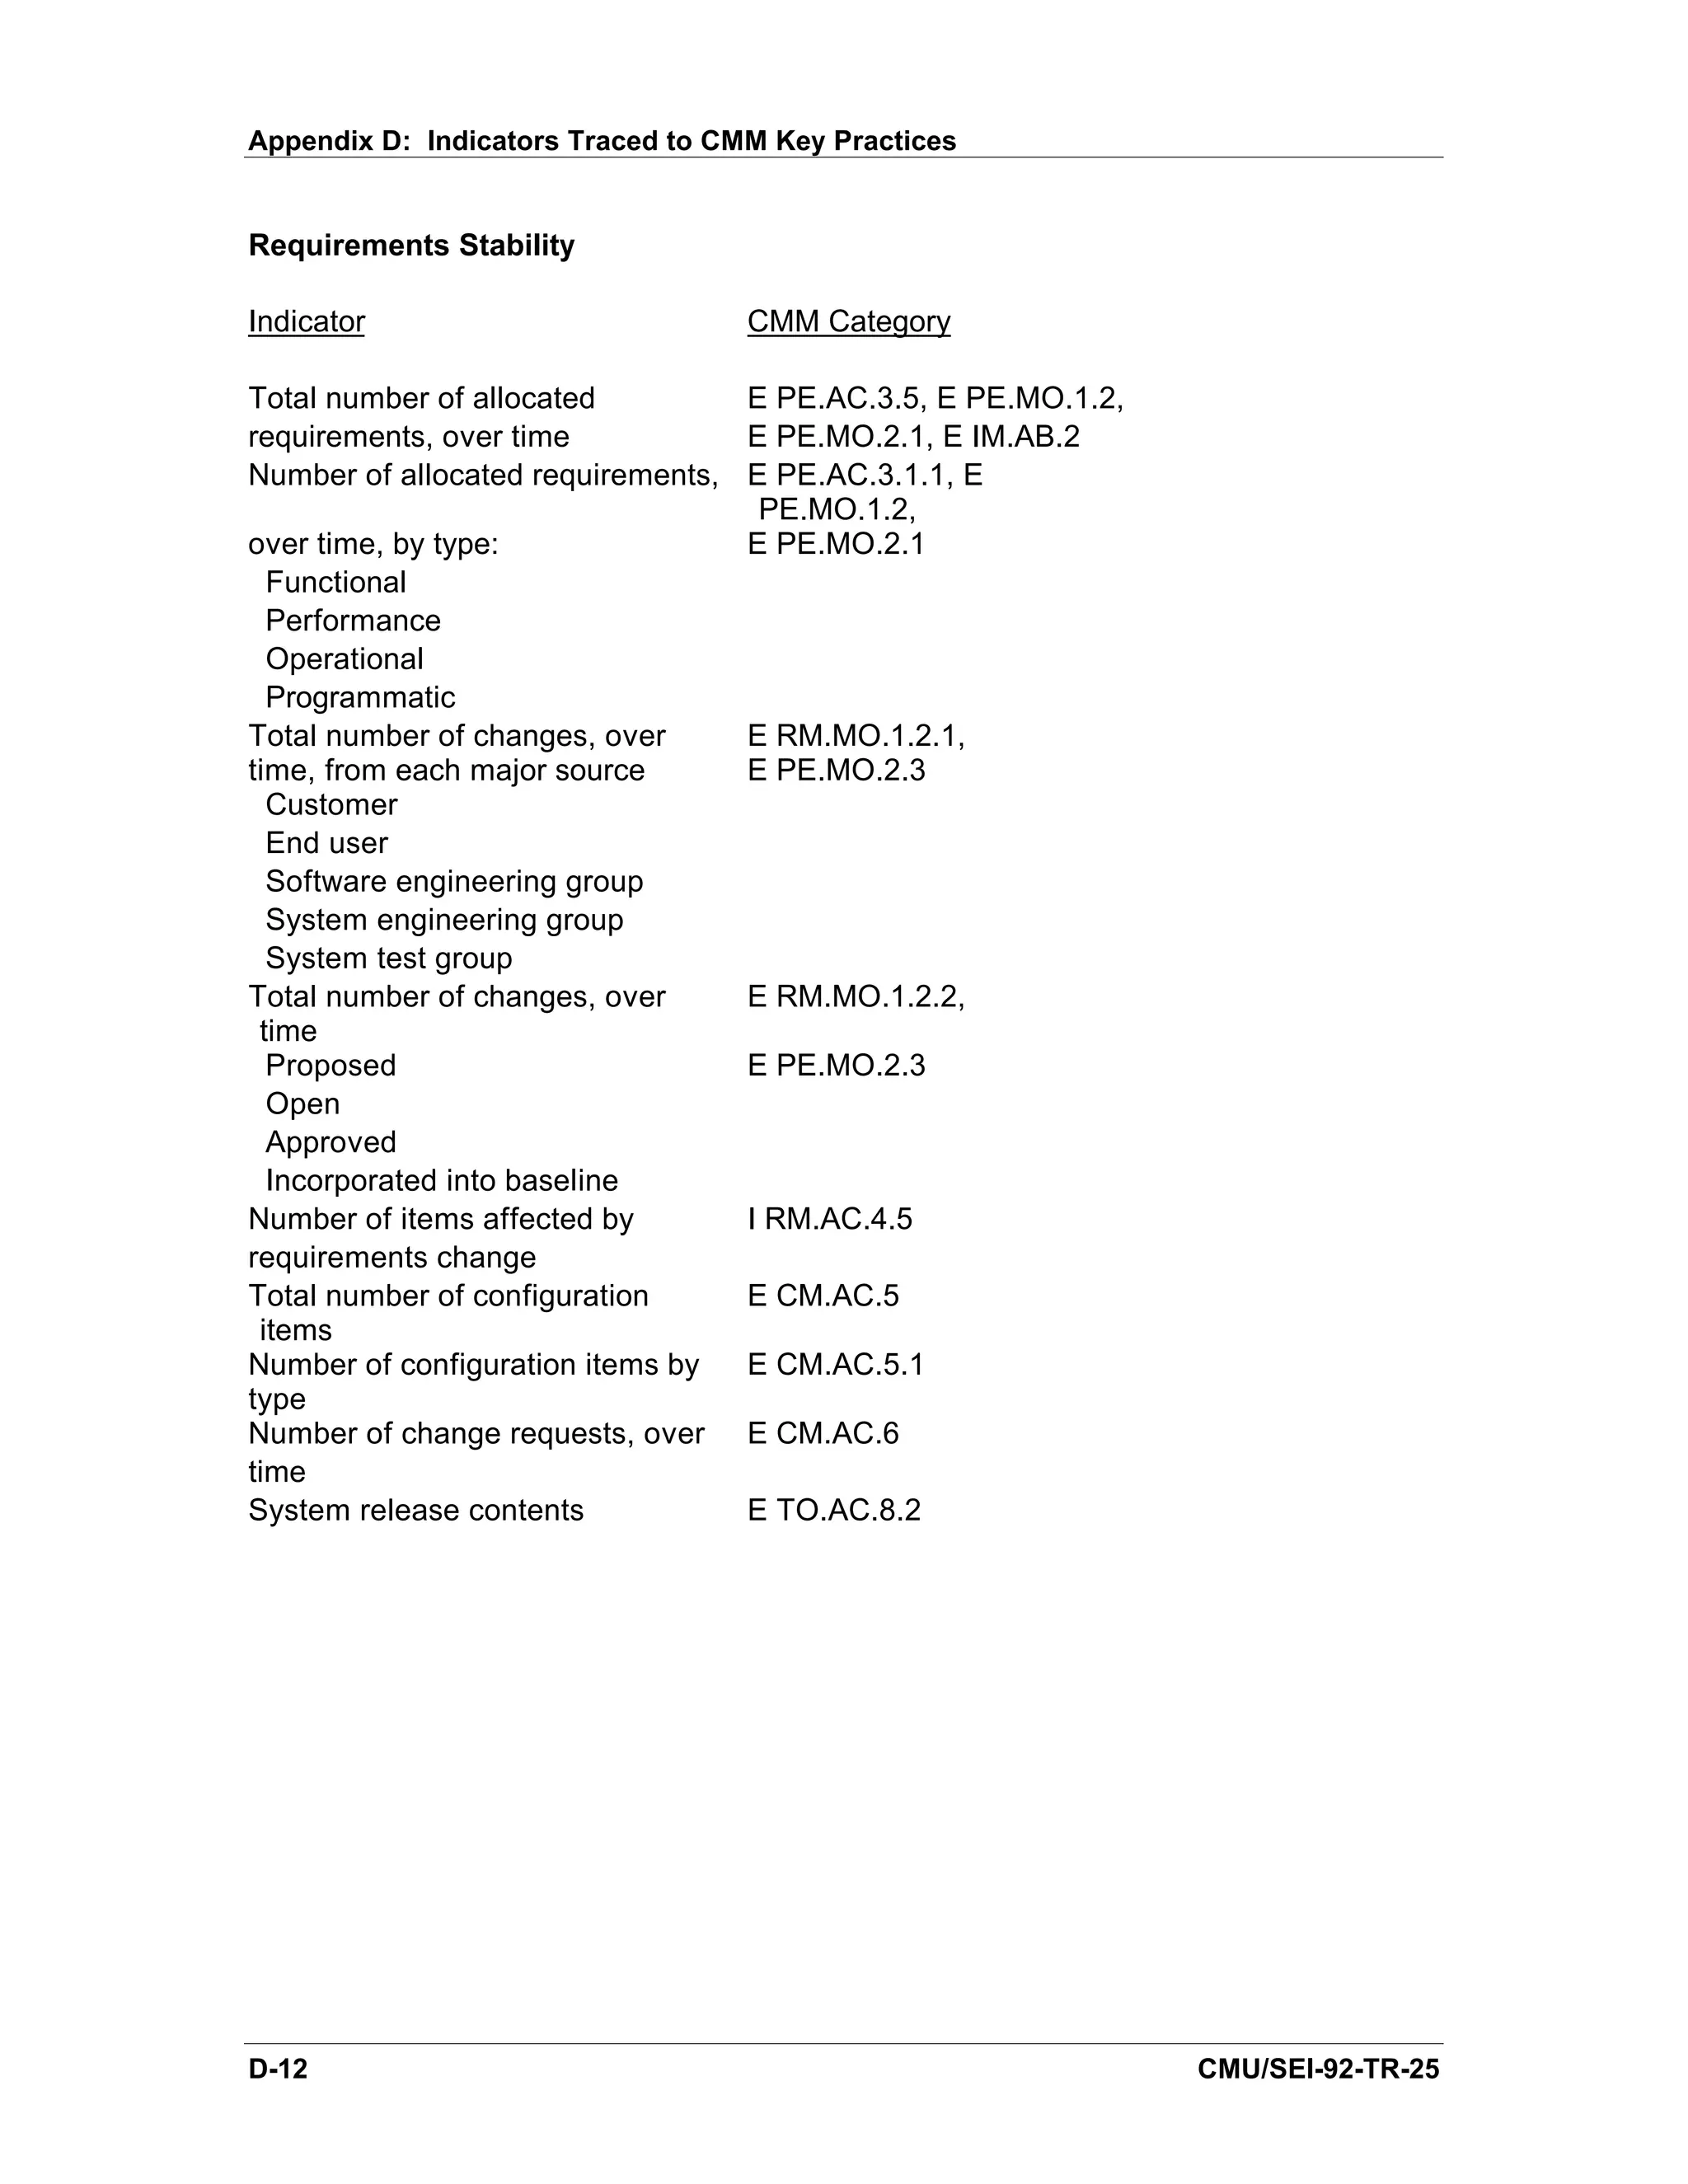
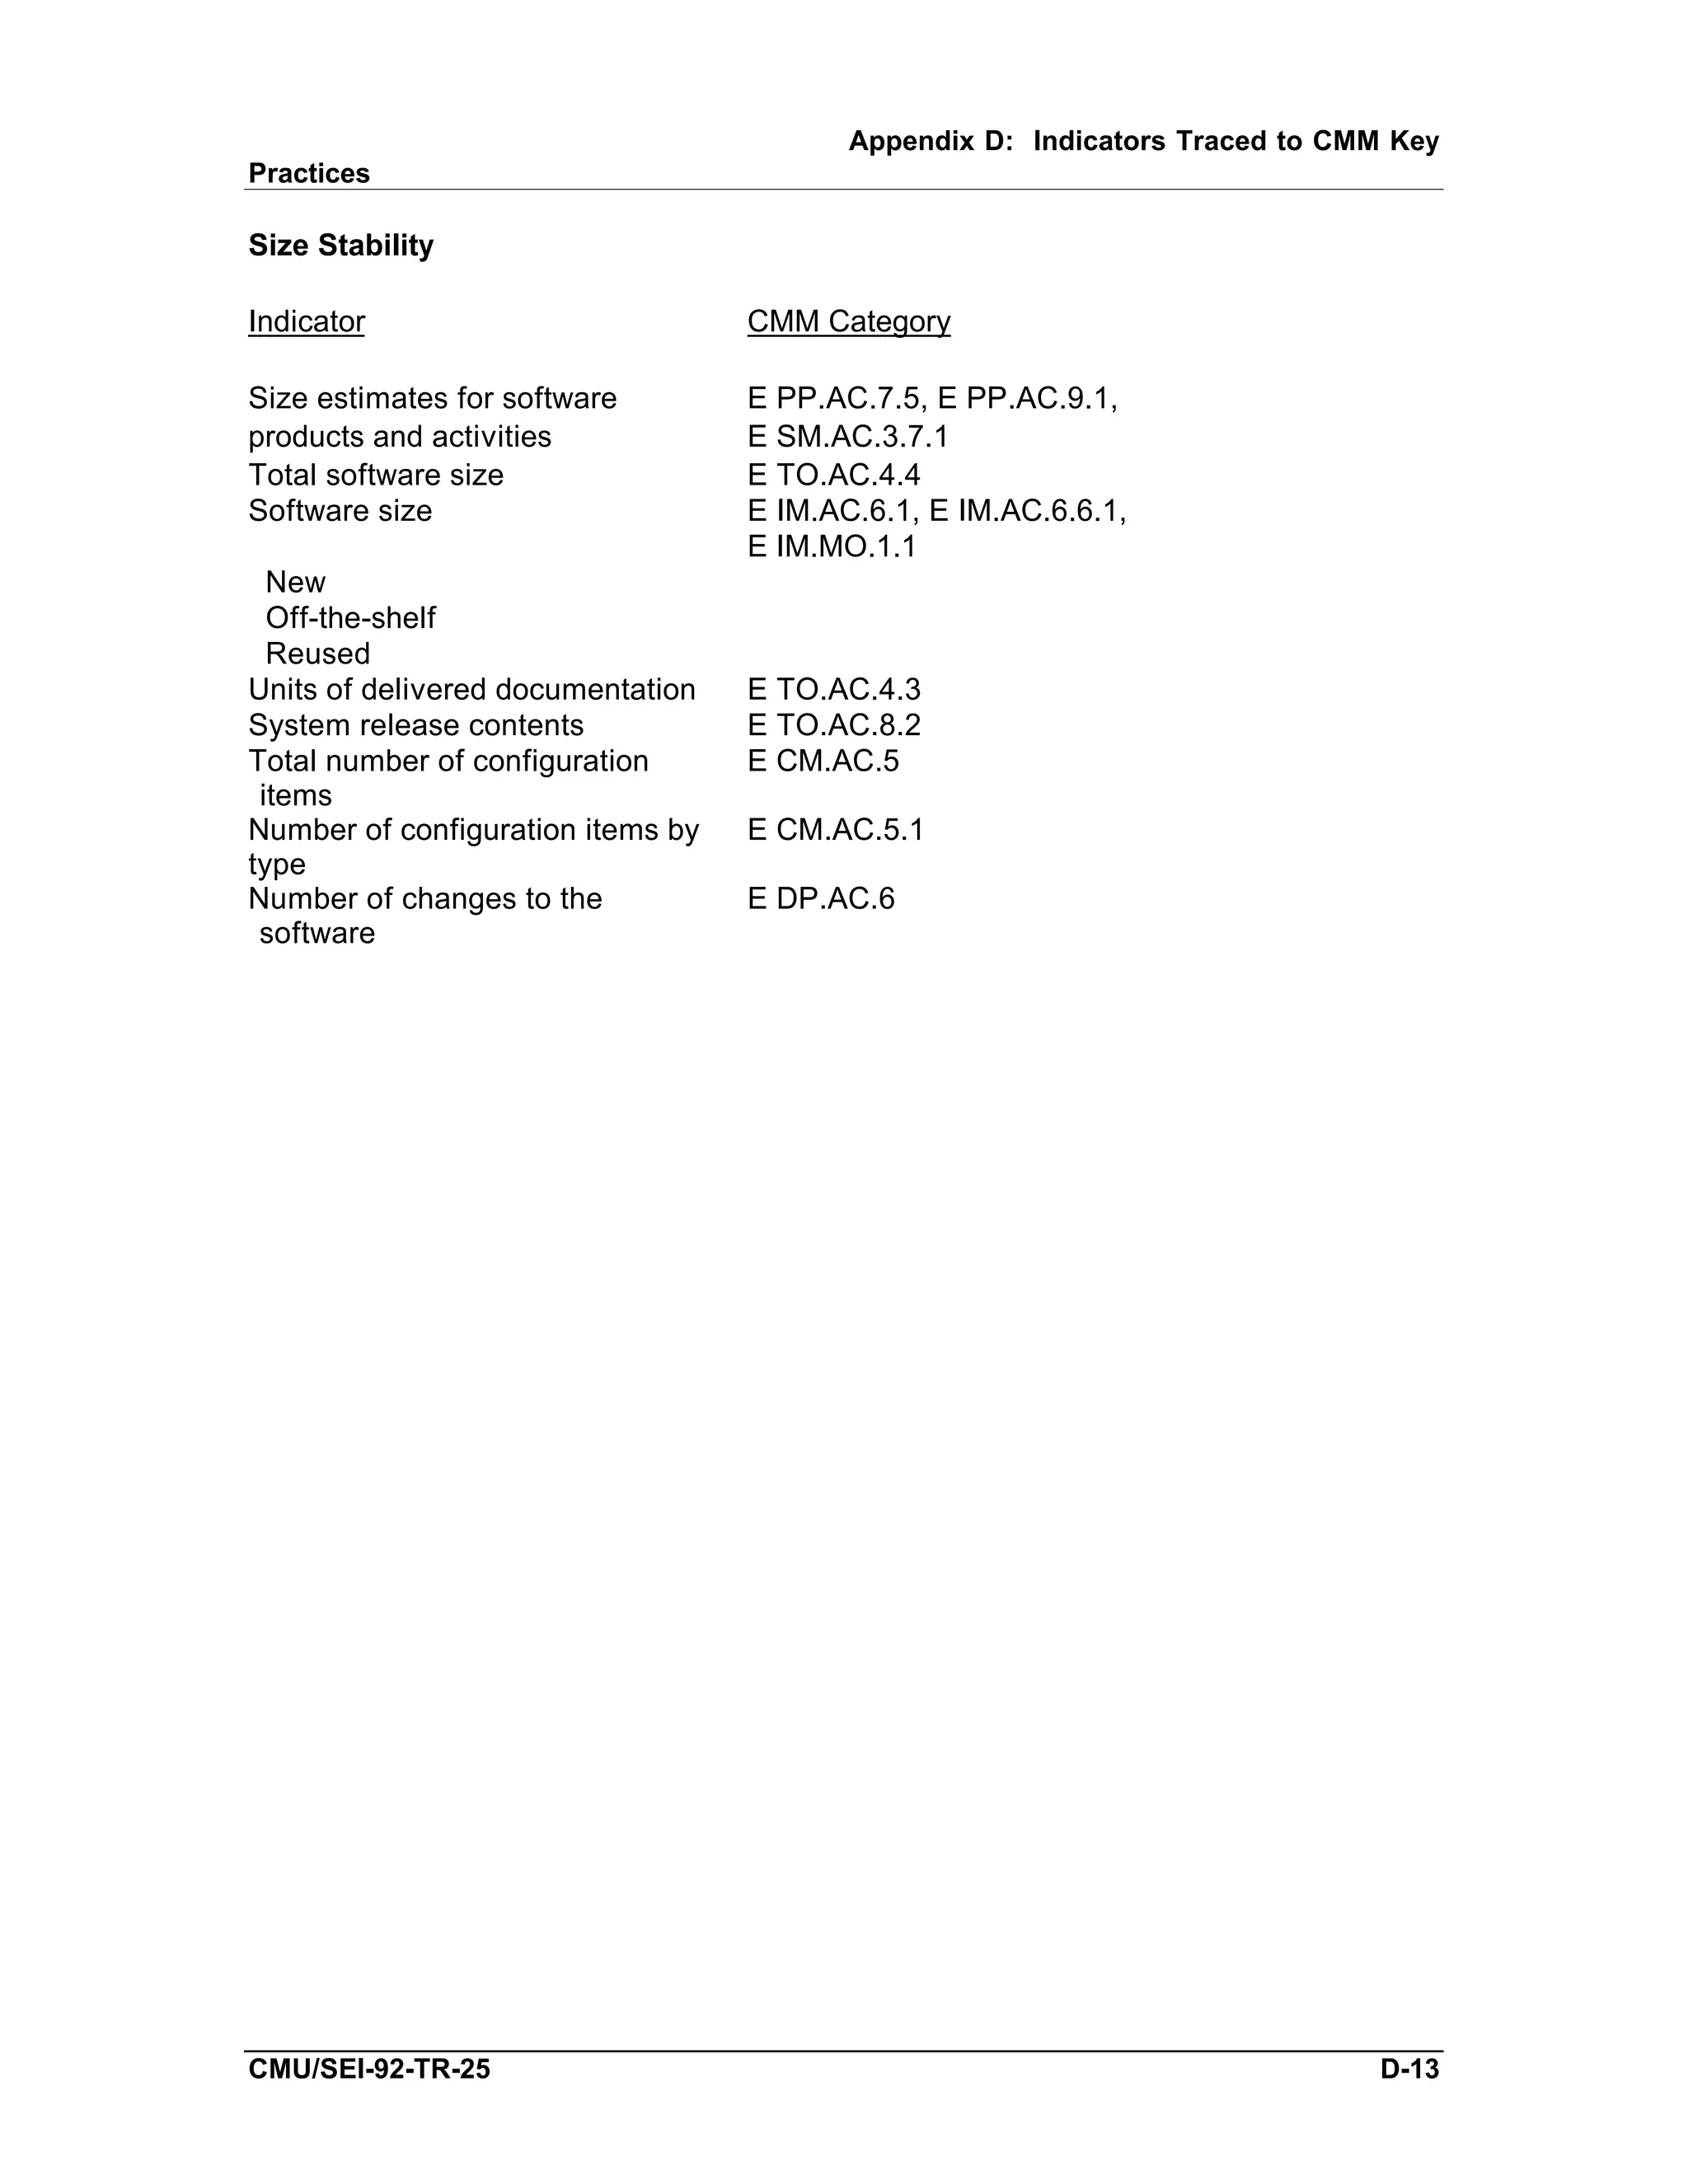
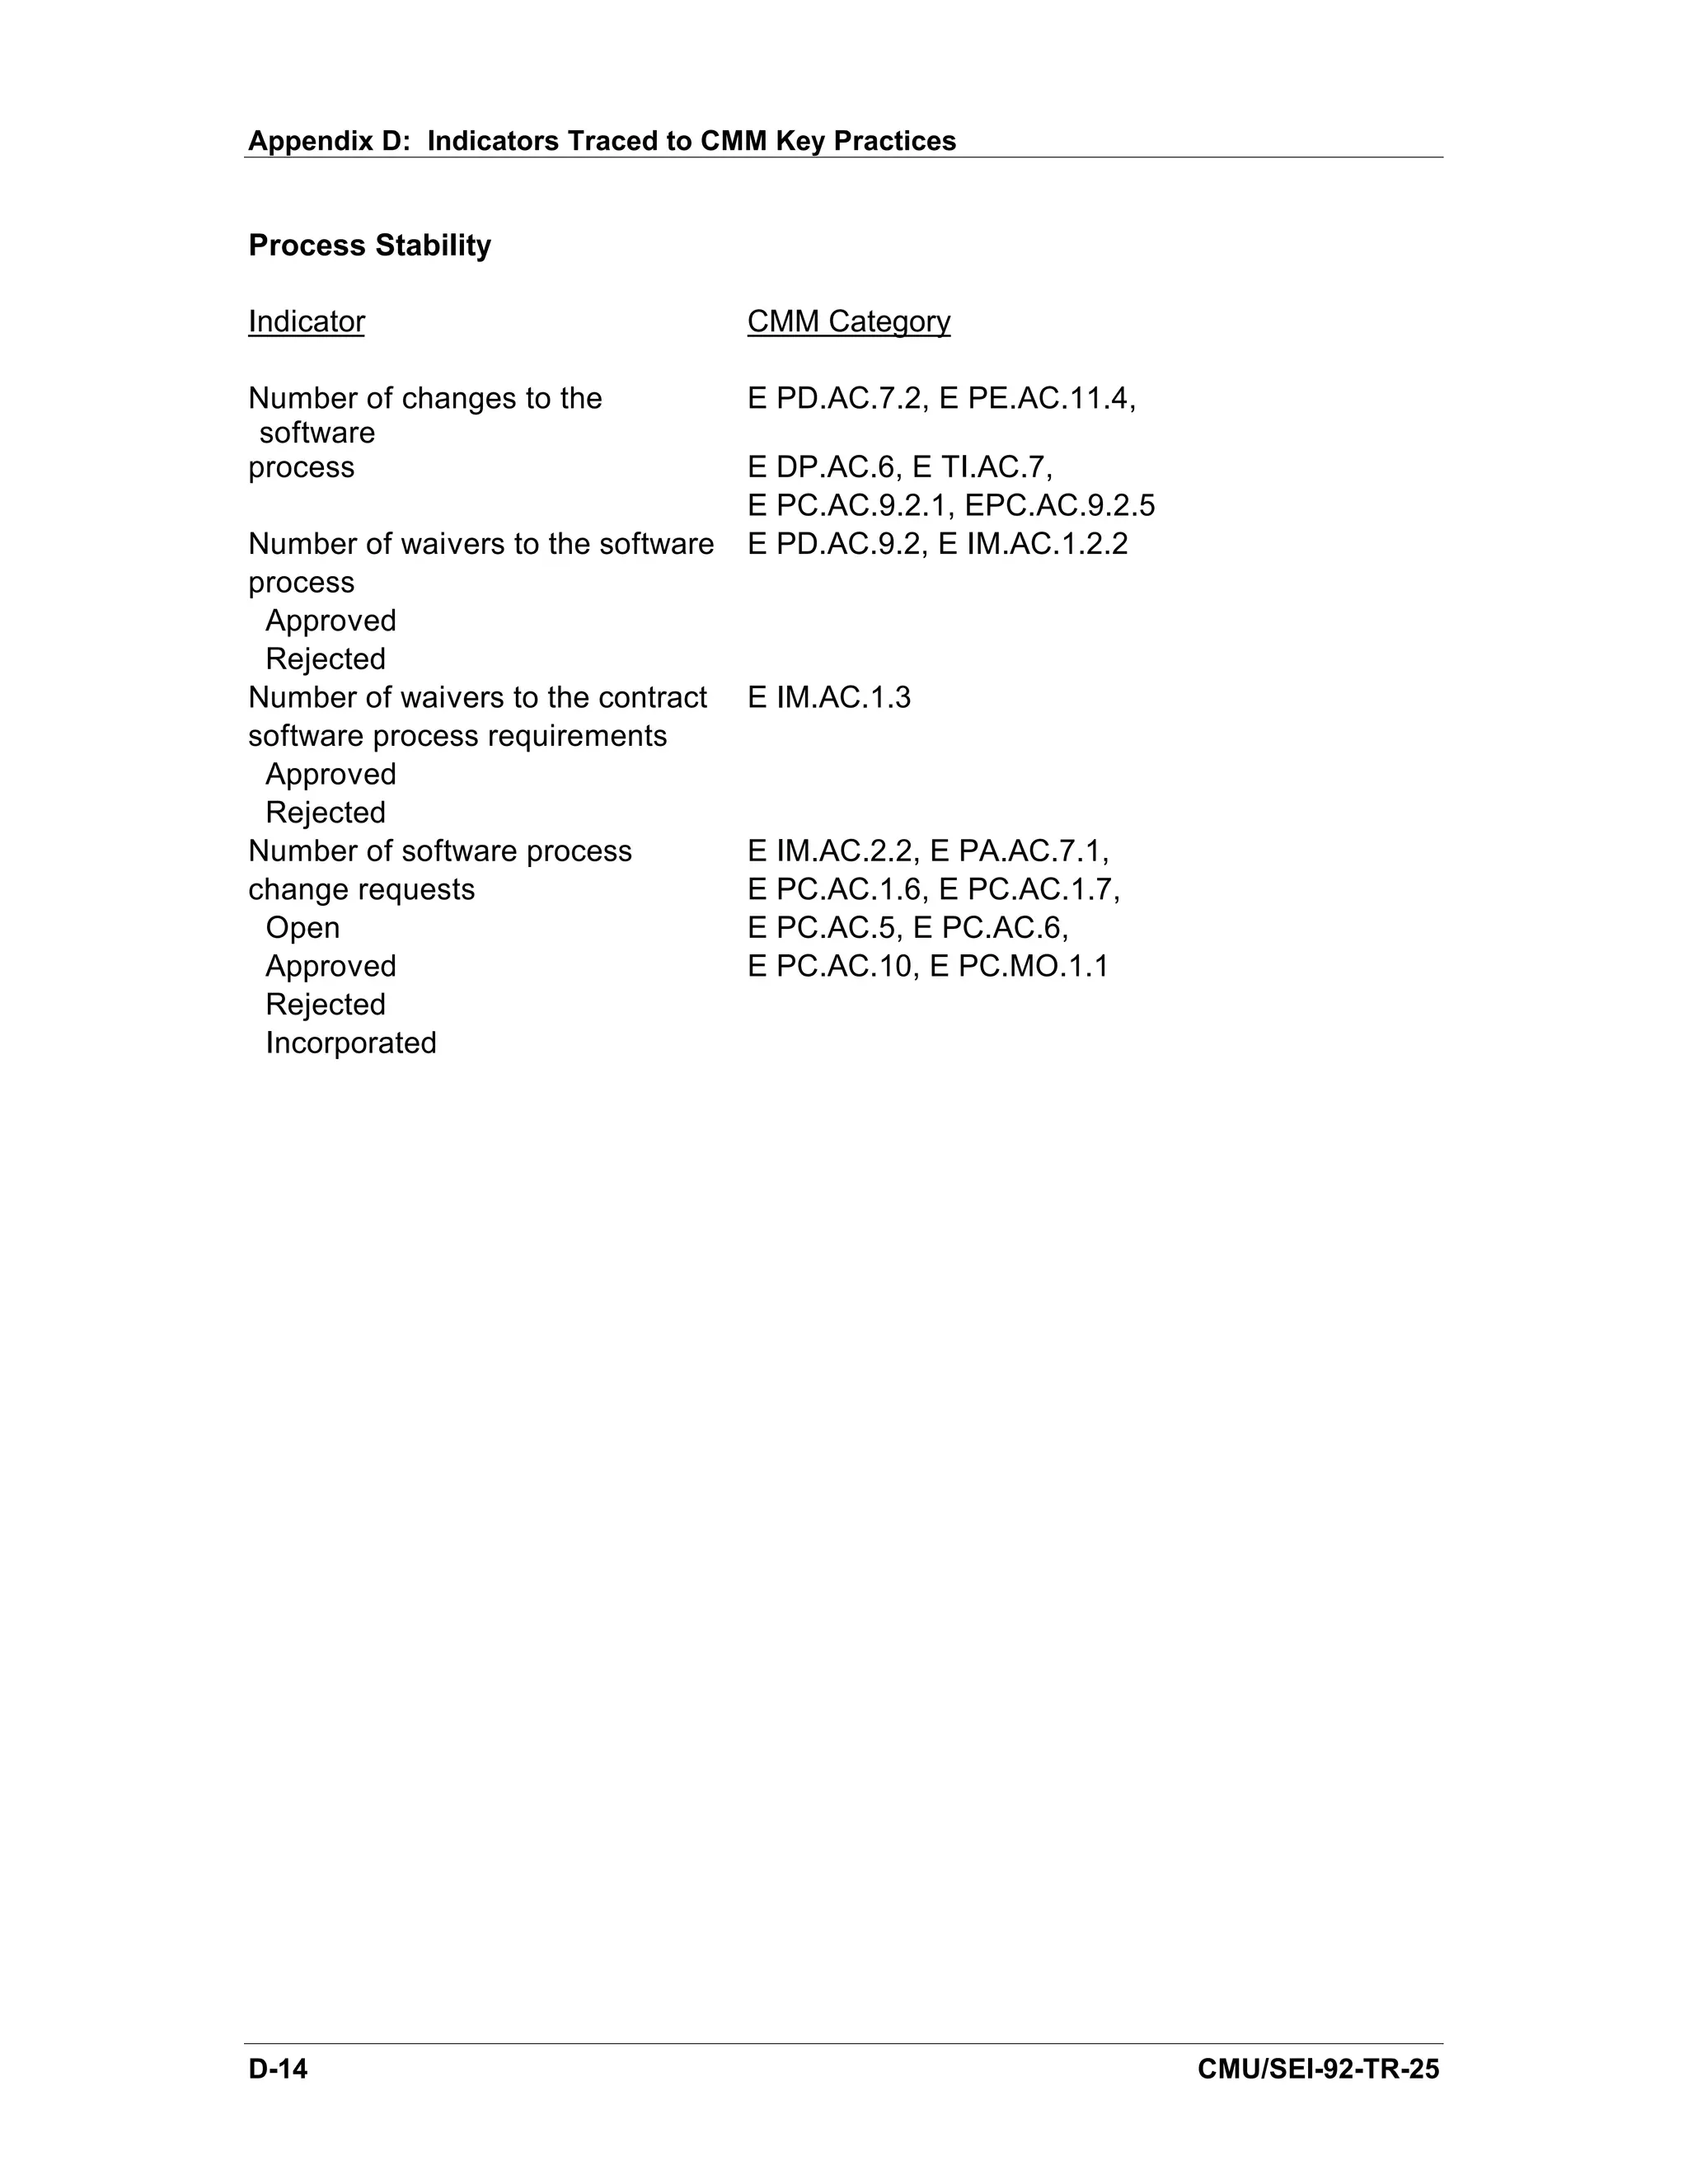
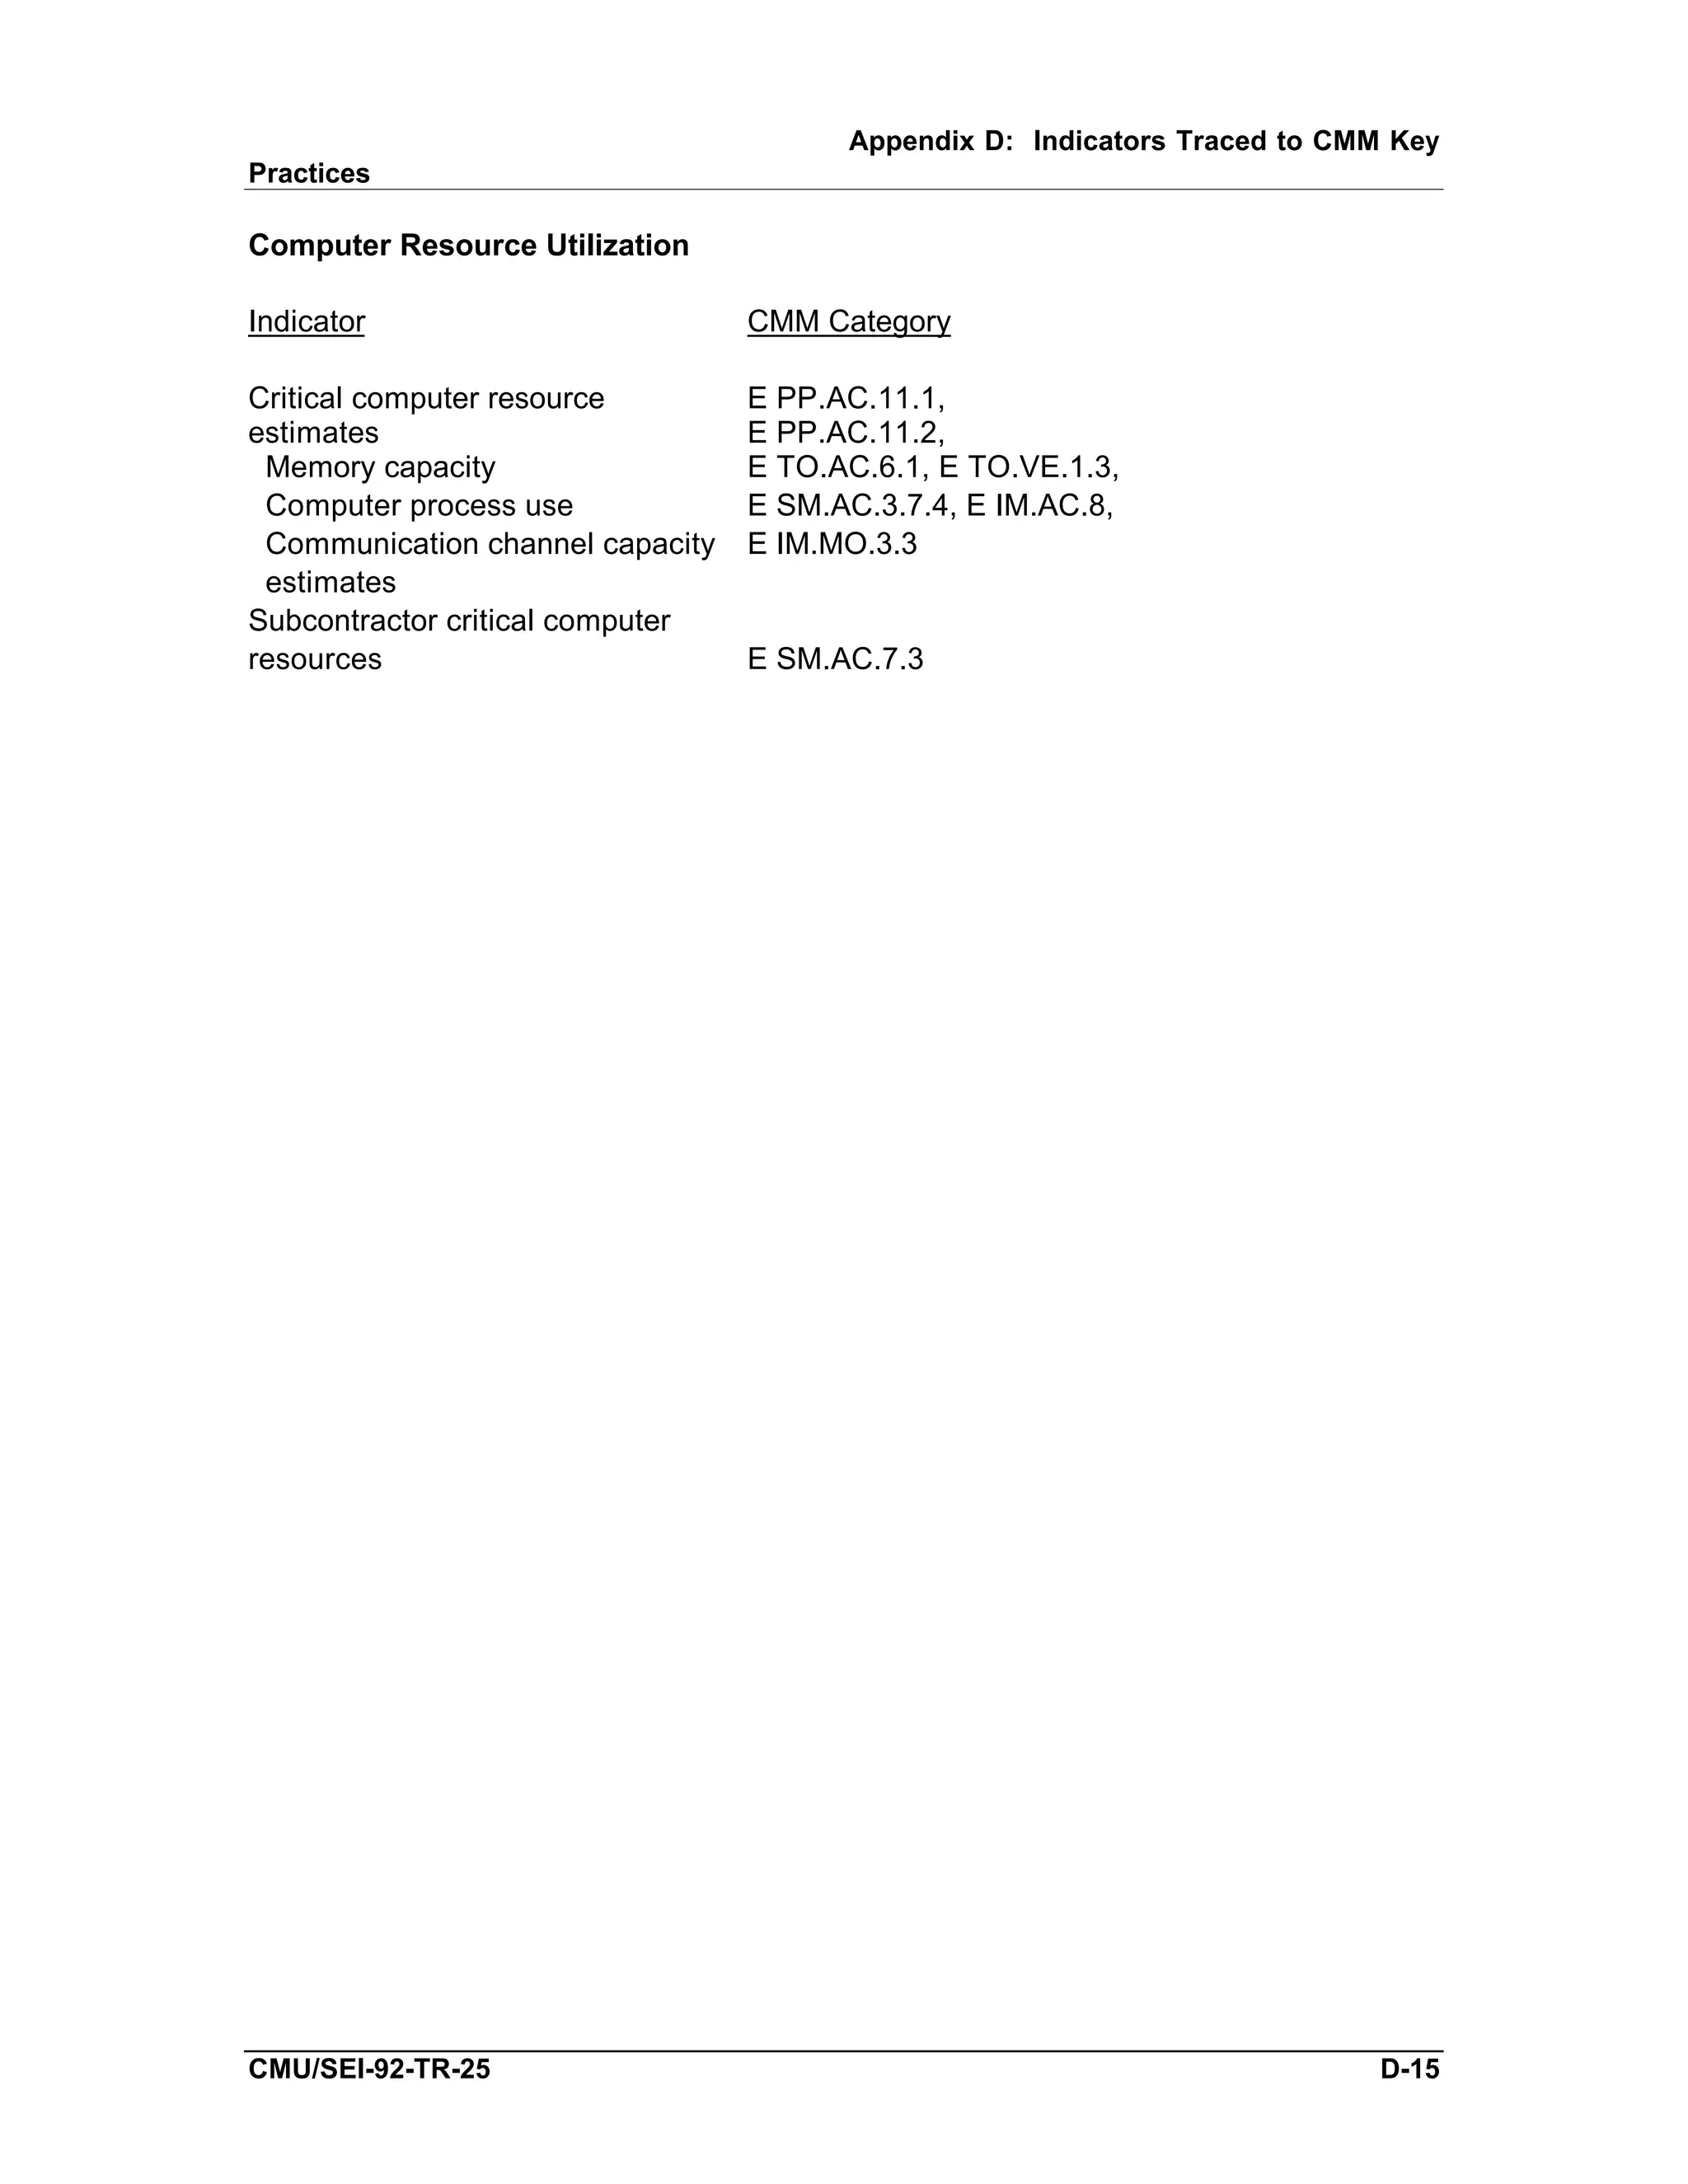
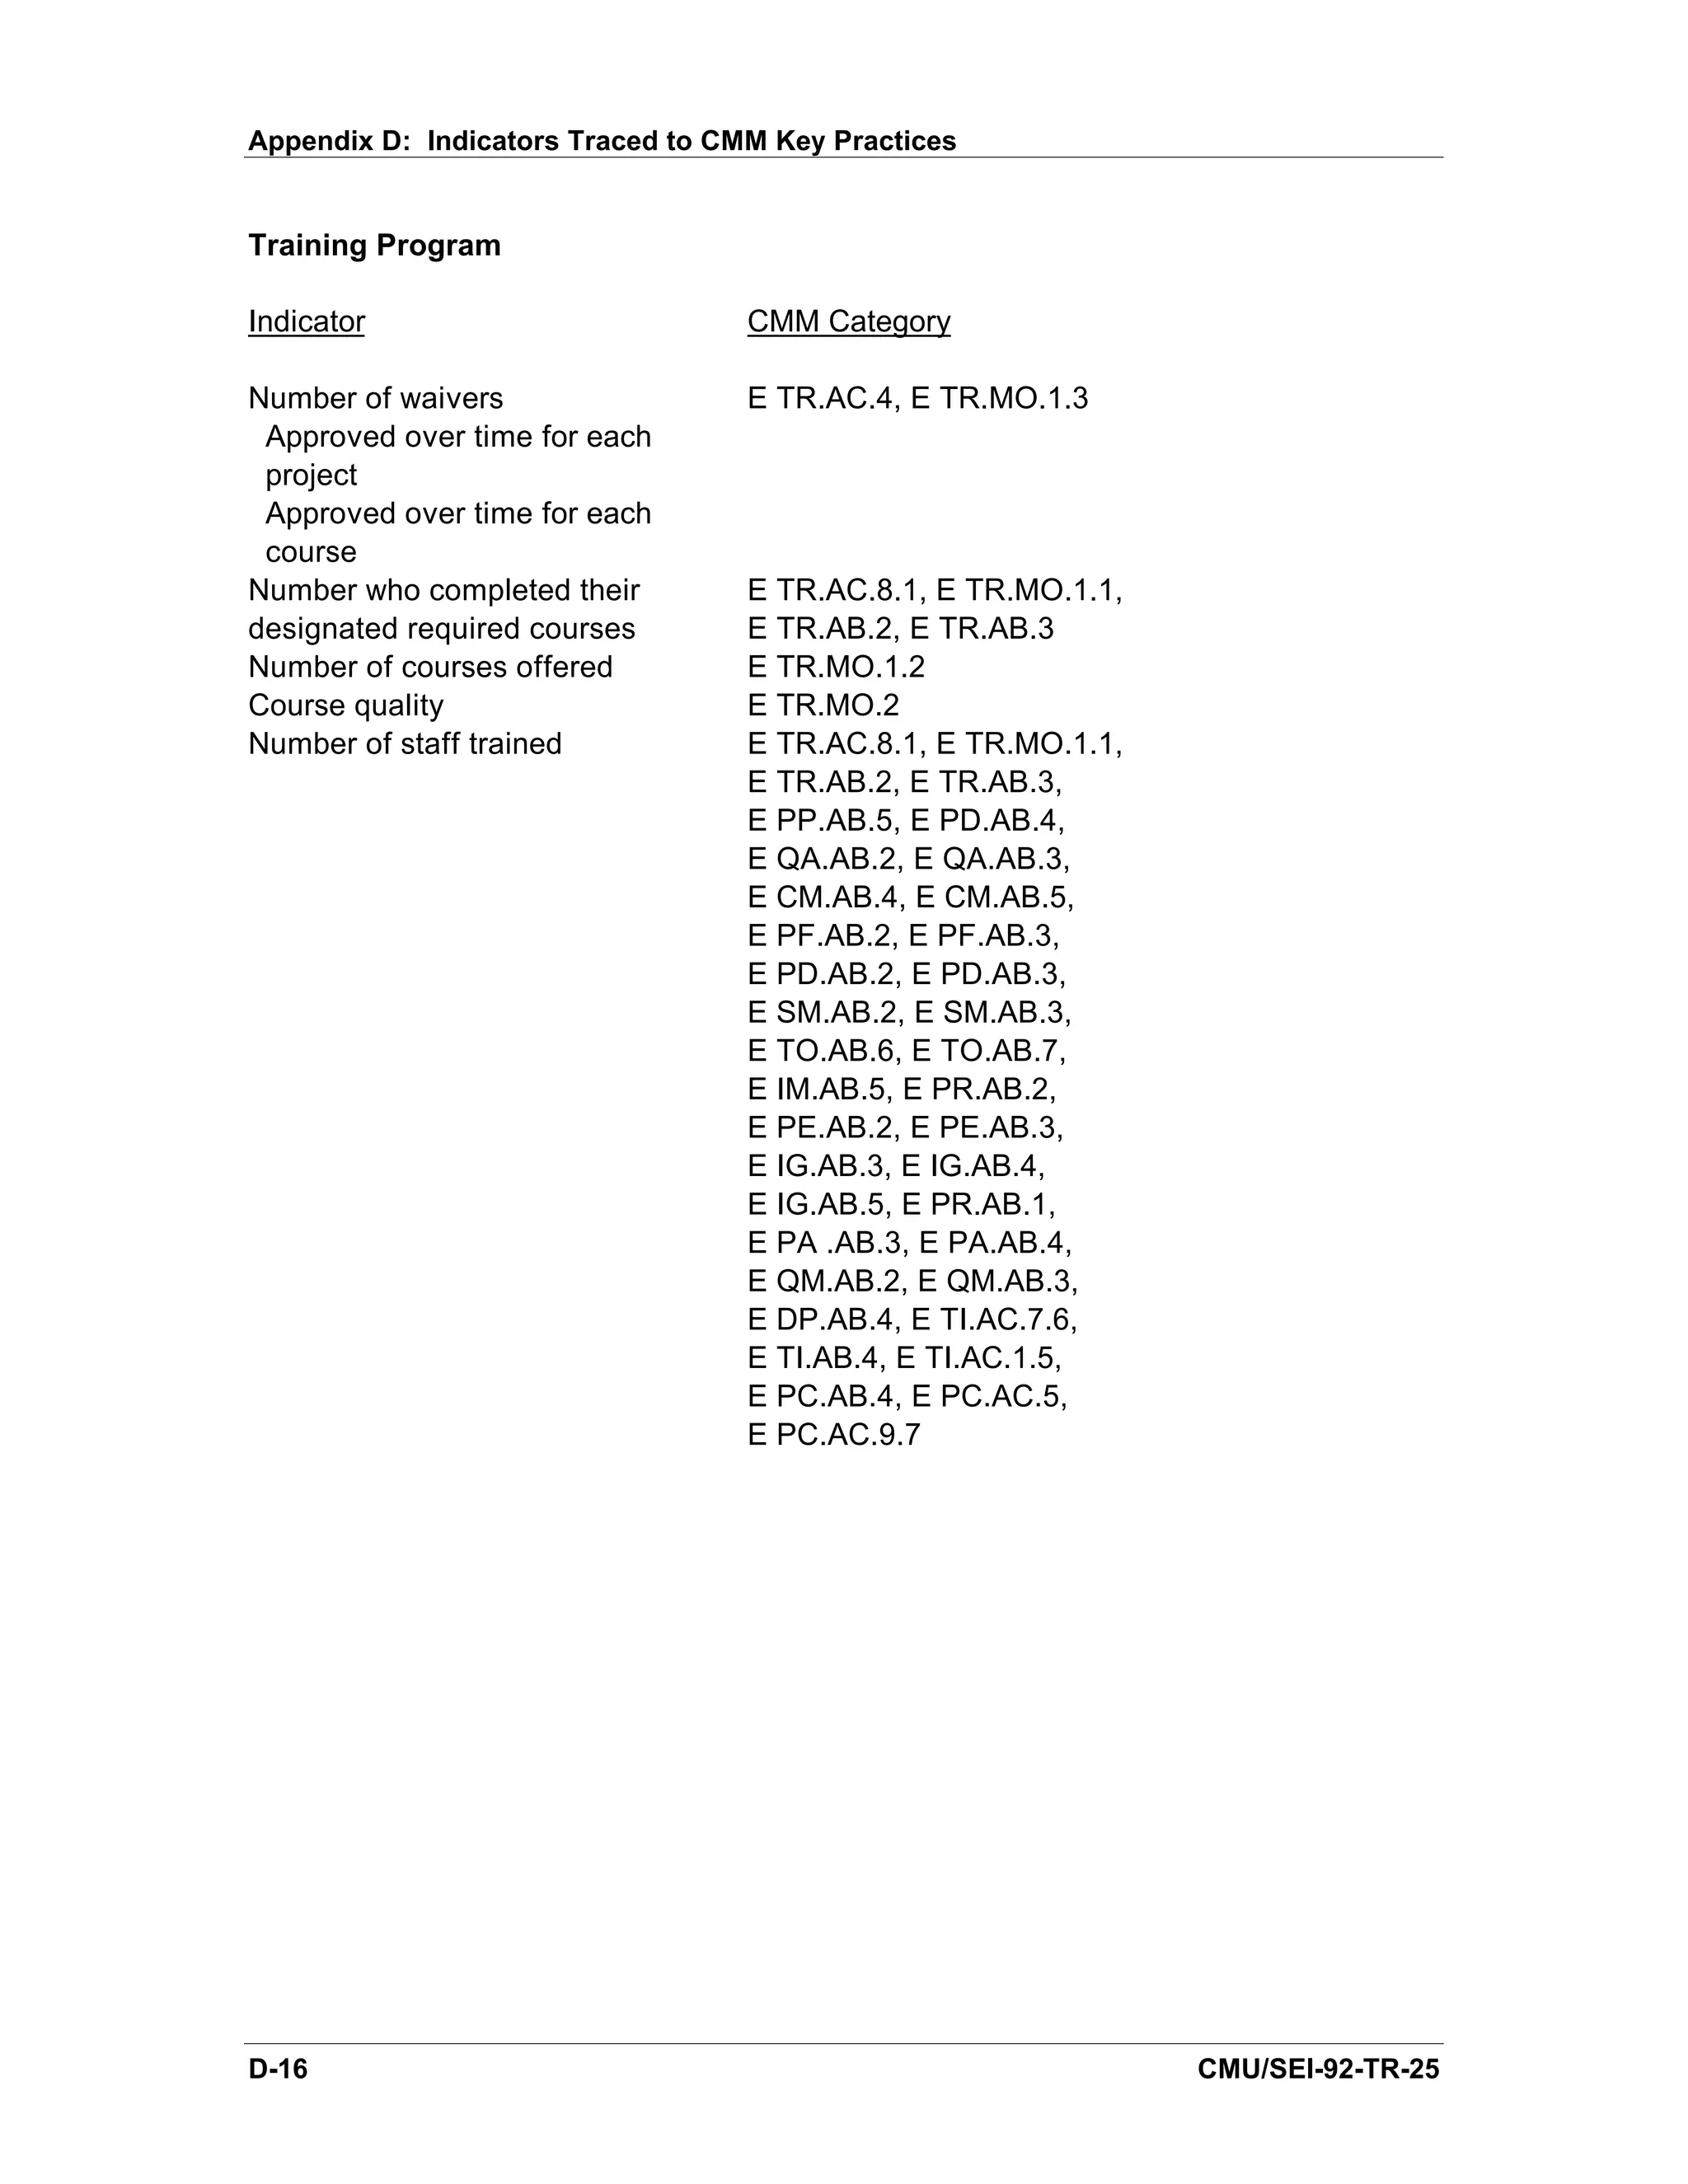
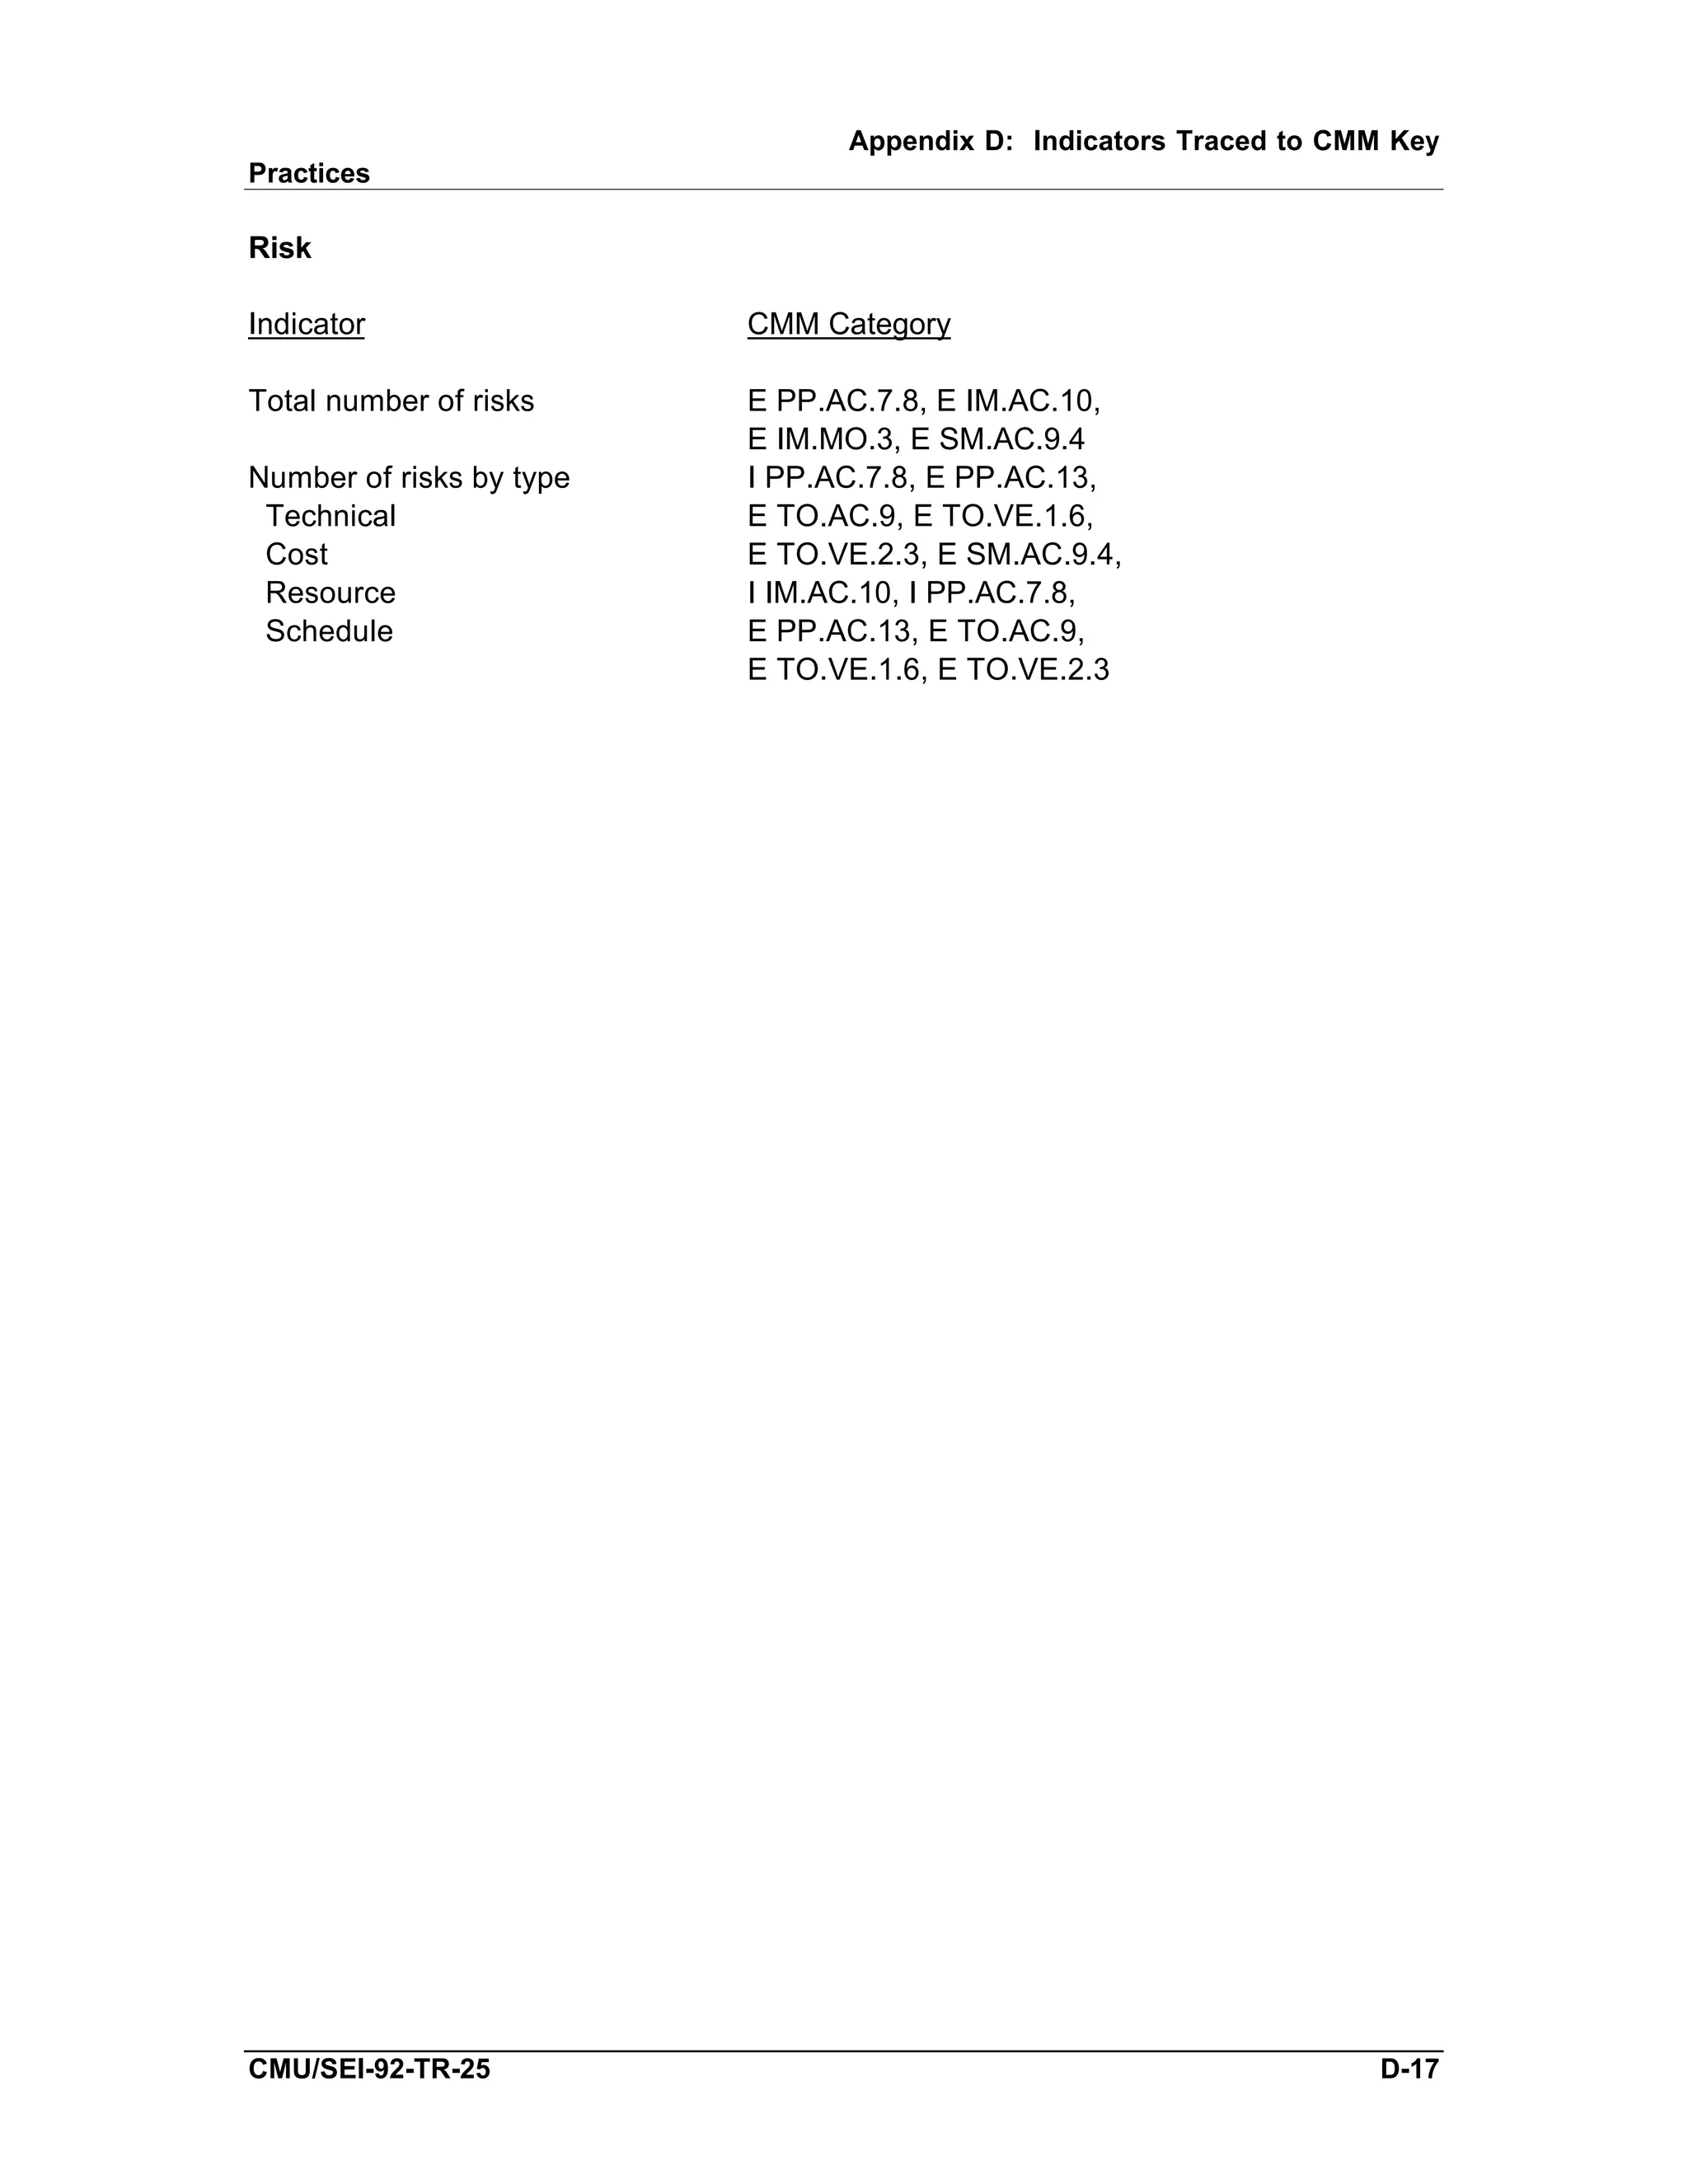


This technical report discusses software measures and indicators that can be used to assess an organization's process maturity based on the Capability Maturity Model (CMM). It provides overviews of indicators for each key process area at the Repeatable, Defined, Managed, and Optimizing maturity levels. The indicators focus on progress, effort, cost, quality, stability, computer resource utilization, and training.