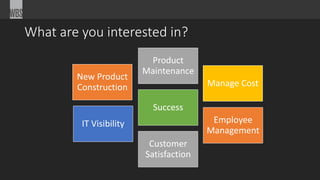
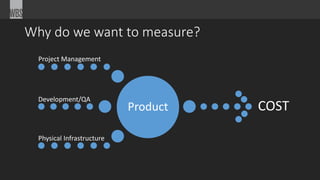
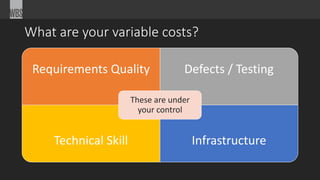
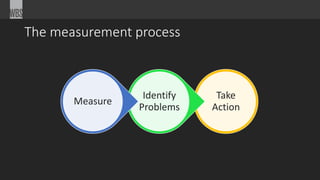
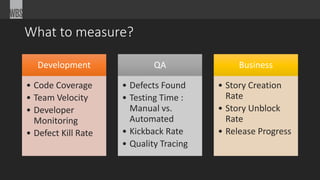
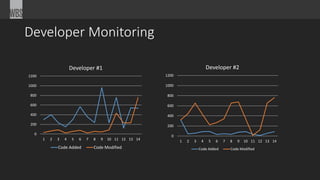
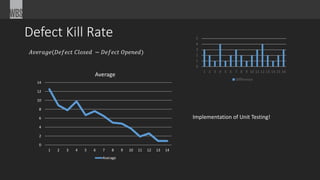
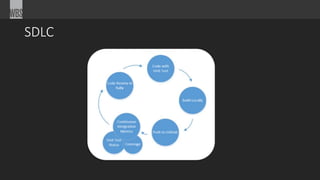
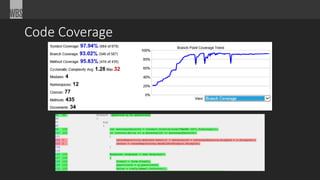
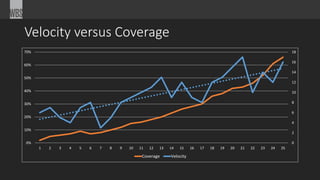
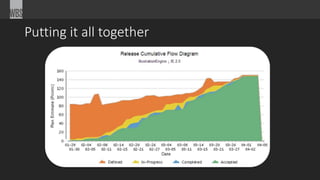
Software Development and Delivery
Wm. Barrett Simms
barrett@wbsimms.com
@wbsimms
What are you interested in?
New Product
Construction
Product
Maintenance
Manage Cost
IT Visibility
Success
Employee
Management
Customer
Satisfaction
What’s in it for you?
• Techniques
• Managing technical product delivery
• Managing product maintenance
• Metrics
• Measure Constraints for Visibility
• Philosophy
• The big picture has tons of little details
About Me
Software
Developer
Agile Team
Member
Team Lead
Agile
Advocate
SDLC
Implementer
Why do we want to measure?
Product
Development/QA
Physical Infrastructure
Project Management
COST
What are your variable costs?
Requirements Quality Defects / Testing
Technical Skill Infrastructure
These are under
your control
The measurement process
Take
Action
Identify
Problems
Measure
What to measure?
Development
• Code Coverage
• Team Velocity
• Developer
Monitoring
• Defect Kill Rate
QA
• Defects Found
• Testing Time :
Manual vs.
Automated
• Kickback Rate
• Quality Tracing
Business
• Story Creation
Rate
• Story Unblock
Rate
• Release Progress
Actionable Stories
0
20
40
60
80
100
120
140
160
180
Actionable
Added Unblocked
0
20
40
60
80
100
120
140
160
Blocked
Added Blocked
Unblock Rate
𝑈𝑛𝑏𝑙𝑜𝑐𝑘𝑒𝑑 − 𝐵𝑙𝑜𝑐𝑘𝑒𝑑
𝐴𝑑𝑑𝑒𝑑
-1.5
-1
-0.5
0
0.5
1
1.5
Iteration 1 Iteration 2 Iteration 3 Iteration 4 Iteration 5 Iteration 6
Unblock Score Unblock Rate
New Story Count Story Blocked Story Unblocked
10 3 7
10 10 0
10 6 4
10 0 10
10 5 5
10 7 3
The Hawthorne Effect
• Knowing you are being monitored will change your behavior
Quality Tracing
• Add findable defects in product
each week
• Track how long it takes to find all
defects
• Reveal the find/miss rate each
week
• Automated UI Testing
• QA Define Requirements
0.00%
10.00%
20.00%
30.00%
40.00%
50.00%
60.00%
70.00%
80.00%
90.00%
100.00%
1 2 3 4 5 6 7 8 9 10 11 12 13 14 15
Trace Defects Found
Iteration Flow (QA Constraint)
0%
10%
20%
30%
40%
50%
60%
70%
80%
90%
100%
1 2 3 4 5 6 7
Defined In Progress Completed Accepted
0%
10%
20%
30%
40%
50%
60%
70%
80%
90%
100%
1 2 3 4 5 6 7
Defined In Progress Completed Accepted
Team Velocity
Developer Monitoring
0
200
400
600
800
1000
1200
1 2 3 4 5 6 7 8 9 10 11 12 13 14
Developer #1
Code Added Code Modified
0
200
400
600
800
1000
1200
1 2 3 4 5 6 7 8 9 10 11 12 13 14
Developer #2
Code Added Code Modified
Defect Kill Rate
𝐴𝑣𝑒𝑟𝑎𝑔𝑒(𝐷𝑒𝑓𝑒𝑐𝑡 𝐶𝑙𝑜𝑠𝑒𝑑 − 𝐷𝑒𝑓𝑒𝑐𝑡 𝑂𝑝𝑒𝑛𝑒𝑑)
0
1
2
3
4
5
1 2 3 4 5 6 7 8 9 10 11 12 13 14 15 16
Difference
0
2
4
6
8
10
12
14
1 2 3 4 5 6 7 8 9 10 11 12 13 14
Average
Average
Implementation of Unit Testing!
SDLC
Code Coverage
Velocity versus Coverage
0
2
4
6
8
10
12
14
16
18
0%
10%
20%
30%
40%
50%
60%
70%
1 2 3 4 5 6 7 8 9 10 11 12 13 14 15 16 17 18 19 20 21 22 23 24 25
Coverage Velocity
Putting it all together

Software Development And Delivery Metrics That Matter

Editor's Notes

  • #2 Welcome!
  • #5 Focus on technical product delivery
  • #6 The three things that are required for product development… and they contribute to cost
  • #7 The things you can control!
  • #17 Code is easier to change. Automatically tested. Defect resolution is faster
  • #20 Week 25 Team is 3X more productive than Week 1
  • #21 7 days early. Team of 6. Saving about $47K.