Downloaded 510 times
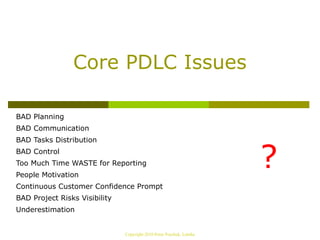
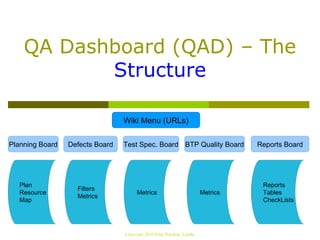
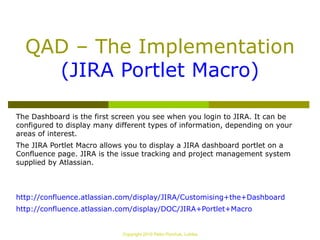

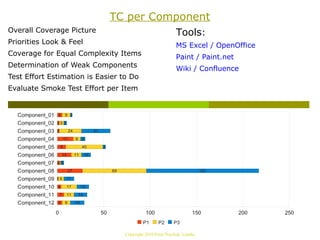
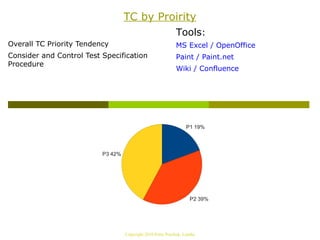
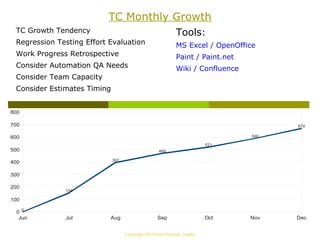
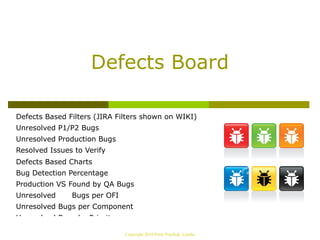
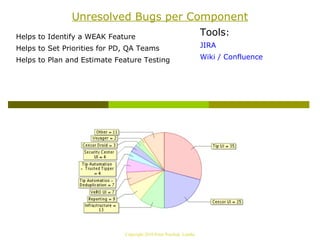
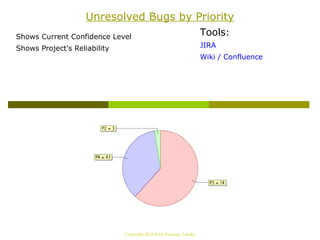
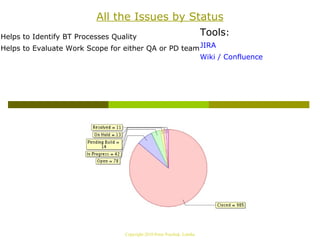
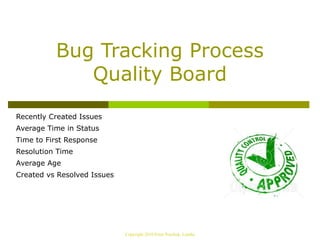
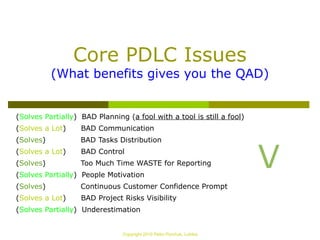

The document describes a QA dashboard (QAD) that was implemented for a real software project. The QAD provides structure and visibility into key project metrics through various boards and reports accessible via JIRA and Confluence. It is intended to help address common project issues like poor planning, communication, task distribution, and risk visibility by centralizing important testing and quality metrics.