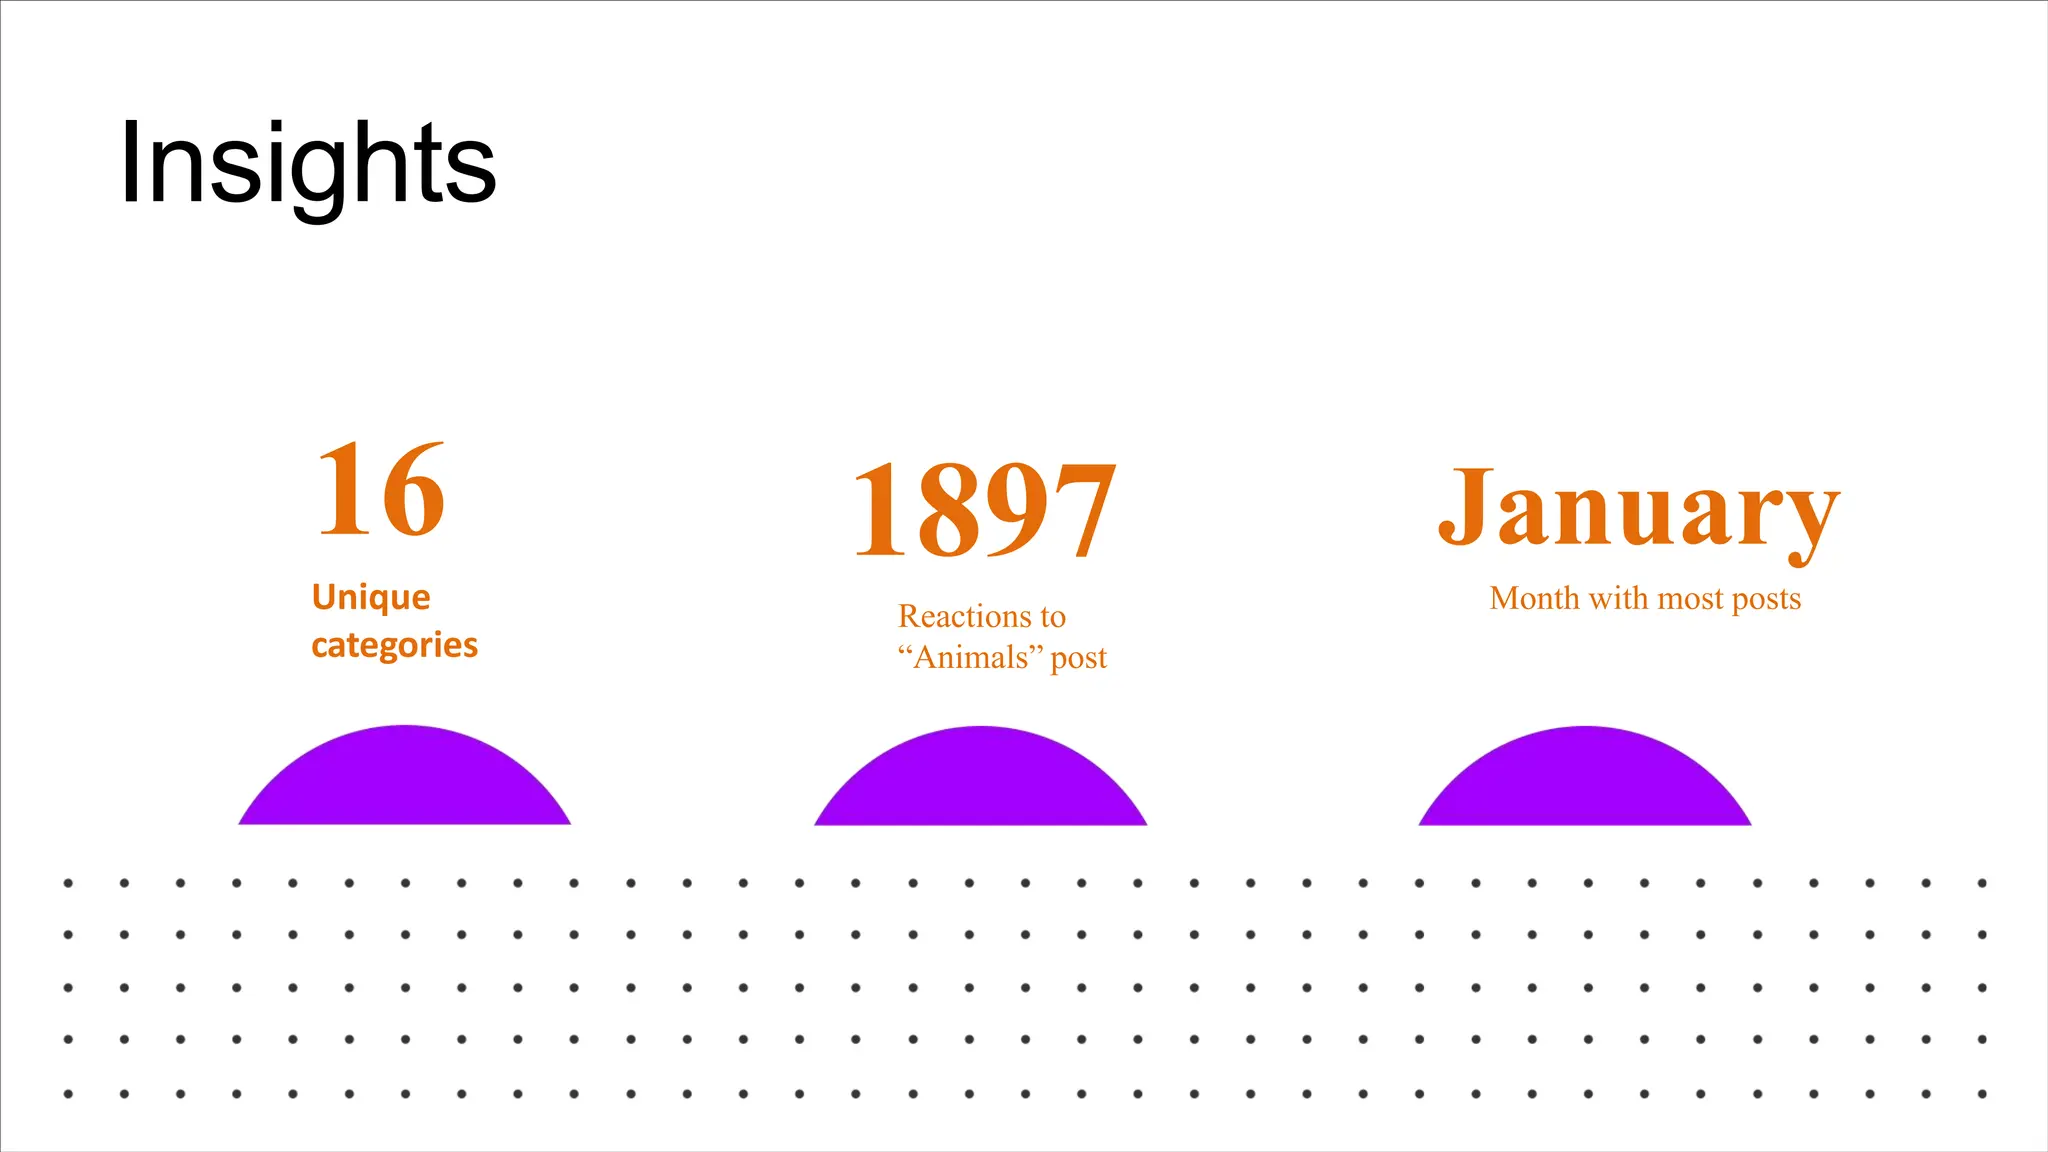
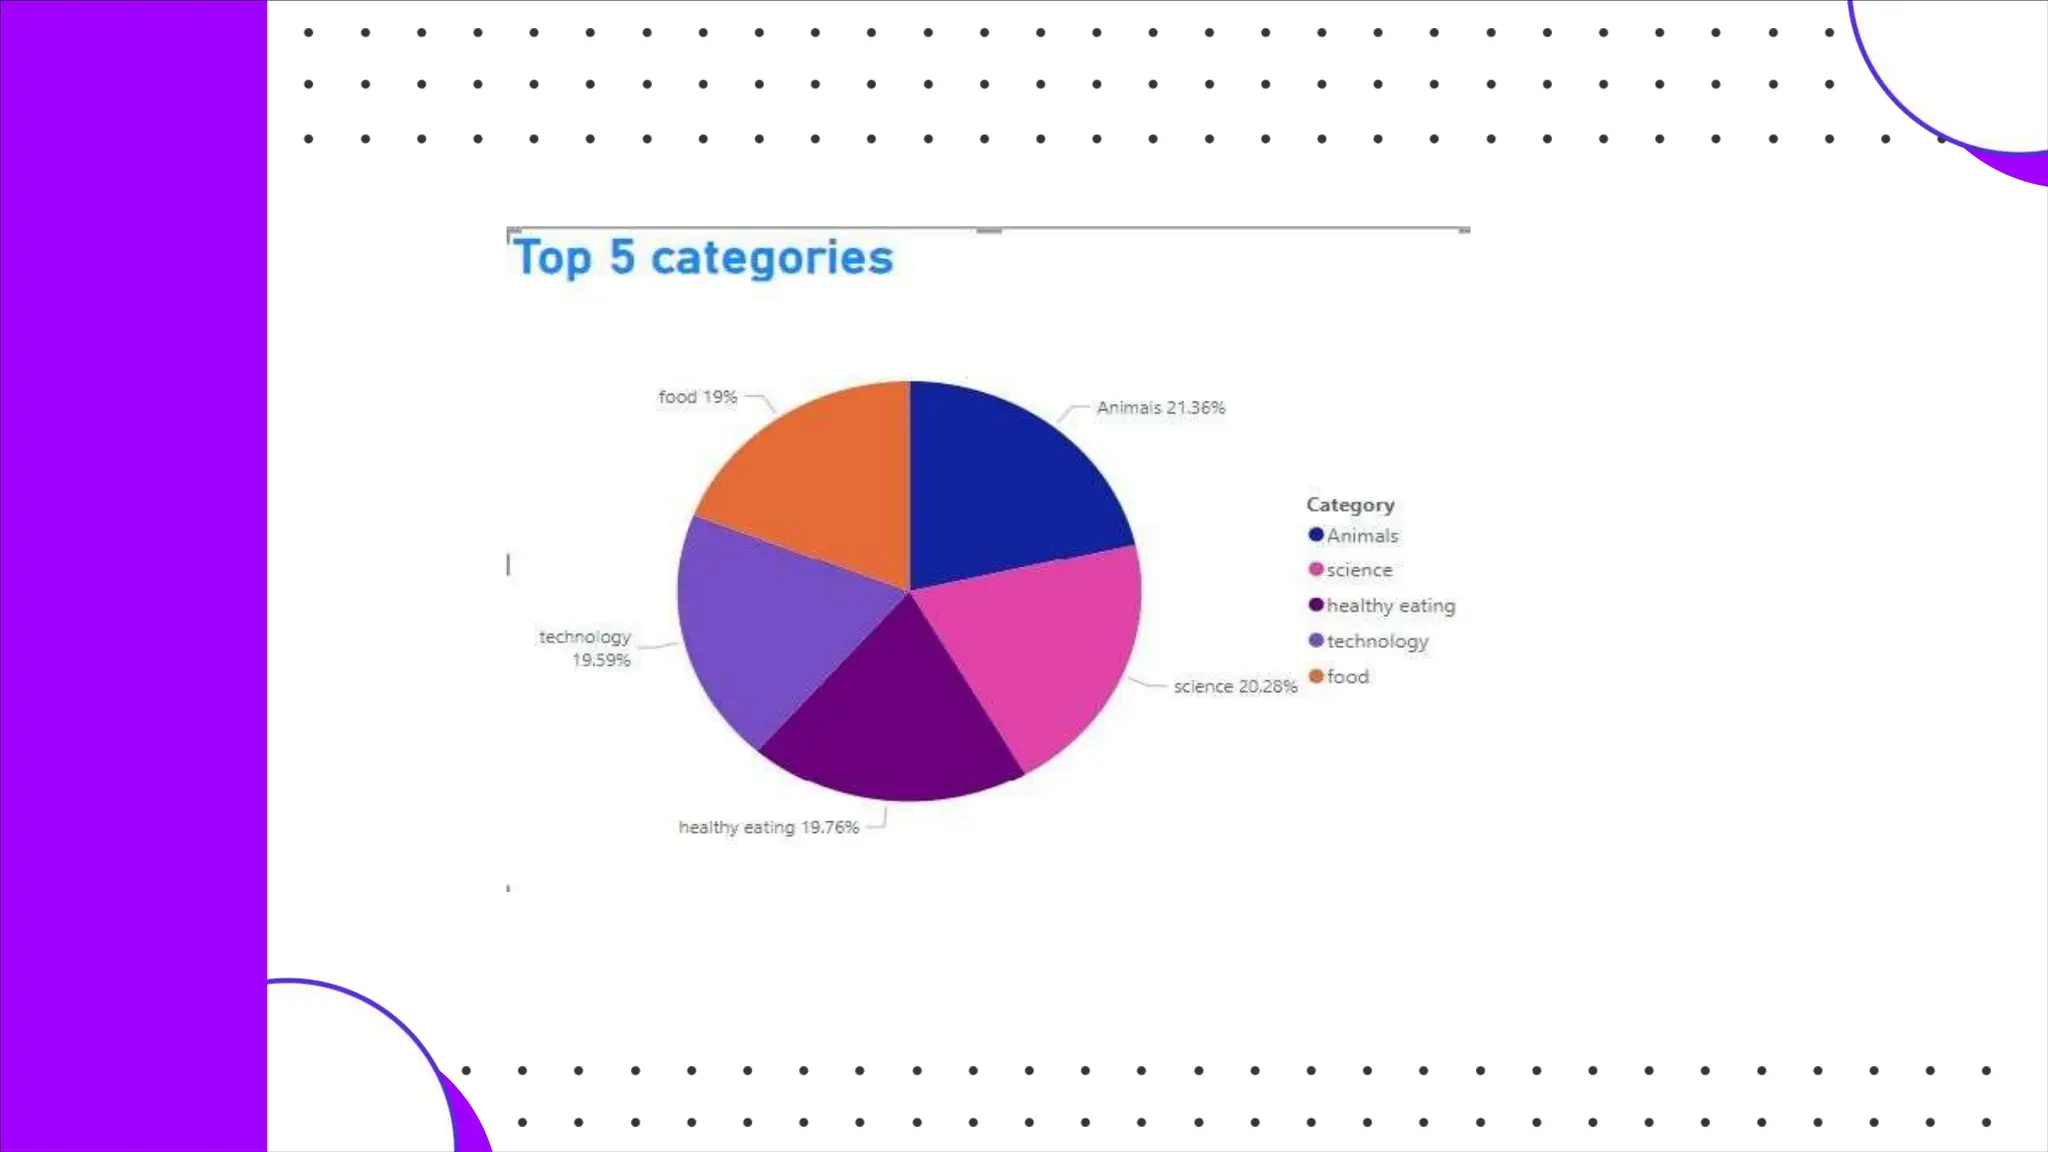
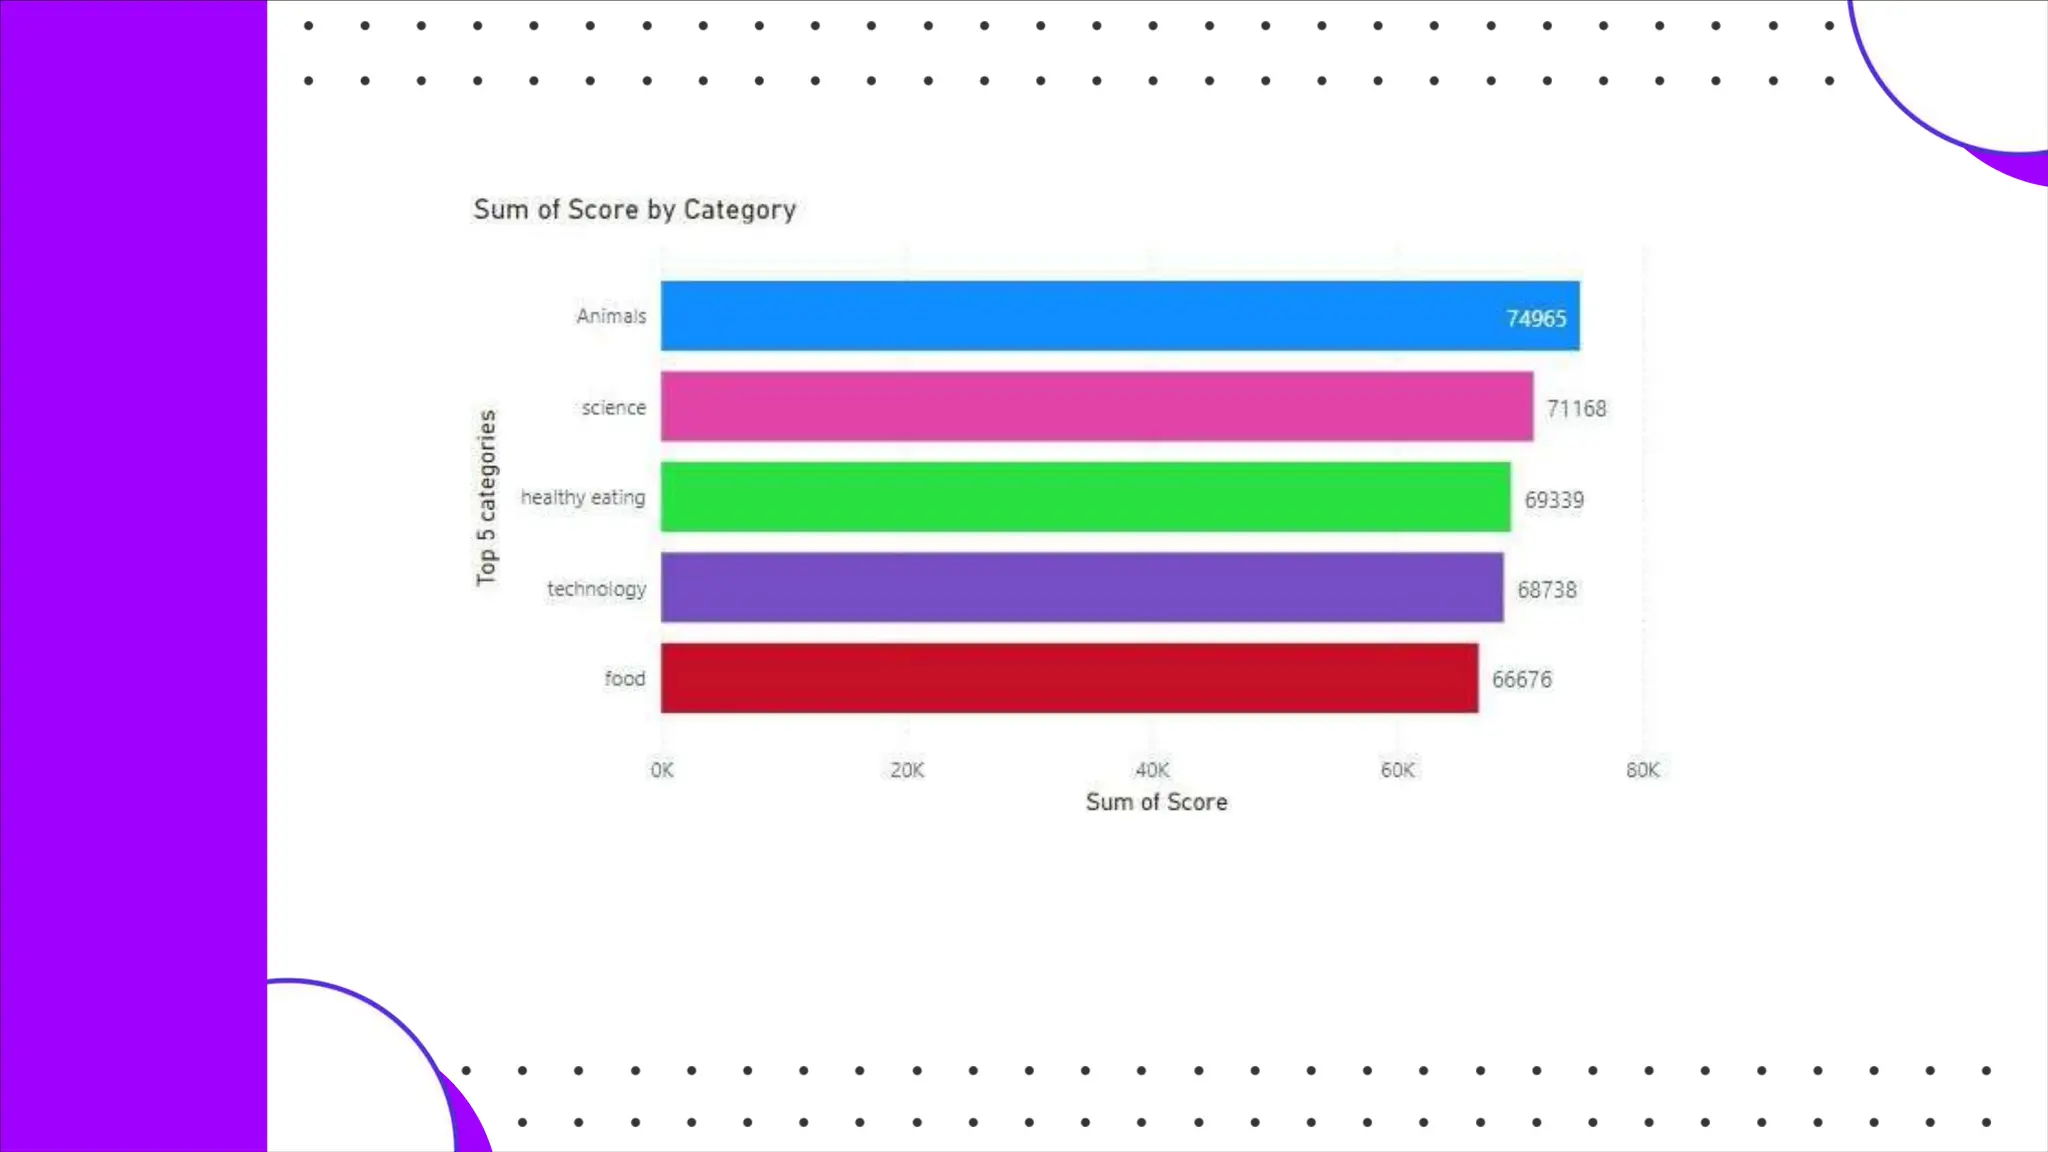
1.virtual experience program hosted by Accenture, providing insights into MNC dynamics and the role of a data analyst.
2.data cleaning, storytelling, and client presentation, using tool Excel and power point.
Predictive marketing extracts information from existing datasets allowing marketers to predict which actions are more likely to succeed and lets marketers determine future outcomes and trends.
Data Science is a form of science that focuses on dealing with huge chunks of data by using modern data analysis tools and techniques to discover hidden patterns, meaningful insights, and make critical business decisions.
A Data Science professional has to utilize complicated machine learning algorithms to develop predictive models. There could be multiple sources present in different formats used in data analysis.
Data Science With Python | Python For Data Science | Python Data Science Cour...Simplilearn
This Data Science with Python presentation will help you understand what is Data Science, basics of Python for data analysis, why learn Python, how to install Python, Python libraries for data analysis, exploratory analysis using Pandas, introduction to series and dataframe, loan prediction problem, data wrangling using Pandas, building a predictive model using Scikit-Learn and implementing logistic regression model using Python. The aim of this video is to provide a comprehensive knowledge to beginners who are new to Python for data analysis. This video provides a comprehensive overview of basic concepts that you need to learn to use Python for data analysis. Now, let us understand how Python is used in Data Science for data analysis.
This Data Science with Python presentation will cover the following topics:
1. What is Data Science?
2. Basics of Python for data analysis
- Why learn Python?
- How to install Python?
3. Python libraries for data analysis
4. Exploratory analysis using Pandas
- Introduction to series and dataframe
- Loan prediction problem
5. Data wrangling using Pandas
6. Building a predictive model using Scikit-learn
- Logistic regression
This Data Science with Python course will establish your mastery of data science and analytics techniques using Python. With this Python for Data Science Course, you'll learn the essential concepts of Python programming and become an expert in data analytics, machine learning, data visualization, web scraping and natural language processing. Python is a required skill for many data science positions, so jumpstart your career with this interactive, hands-on course.
Why learn Data Science?
Data Scientists are being deployed in all kinds of industries, creating a huge demand for skilled professionals. Data scientist is the pinnacle rank in an analytics organization. Glassdoor has ranked data scientist first in the 25 Best Jobs for 2016, and good data scientists are scarce and in great demand. As a data you will be required to understand the business problem, design the analysis, collect and format the required data, apply algorithms or techniques using the correct tools, and finally make recommendations backed by data.
You can gain in-depth knowledge of Data Science by taking our Data Science with python certification training course. With Simplilearn Data Science certification training course, you will prepare for a career as a Data Scientist as you master all the concepts and techniques.
Learn more at: https://www.simplilearn.com
The 4th Industrial Revolution: How U.S. Retail Giant Kroger Is Using AI And R...Bernard Marr
Since online grocery shopping is growing, traditional grocery retailers are trying to develop omnichannel approaches to stay viable for the 4th industrial revolution. Kroger, one of America's largest grocers, is making a significant commitment to creating the grocery experience of the future via today's latest technology.
Artificial intelligence in Energy and Utilities – Market OverviewIndigo Advisory Group
Artificial Intelligence has been around for decades, however, over the past 2-3 years the technology has been finding applications across a series of sectors, including energy and utilities. This presentation includes some of the highlights given on an Engerati Webinar on September 27th including three major application areas.
Building A Product Assortment Recommendation EngineDatabricks
Amid the increasingly competitive brewing industry, the ability of retailers and brewers to provide optimal product assortments for their consumers has become a key goal for business stakeholders. Consumer trends, regional heterogeneities and massive product portfolios combine to scale the complexity of assortment selection. At AB InBev, we approach this selection problem through a two-step method rooted in statistical learning techniques. First, regression models and collaborative filtering are used to predict product demand in partnering retailers. The second step involves robust optimization techniques to recommend a set of products that enhance business-specified performance indicators, including retailer revenue and product market share.
With the ultimate goal of scaling our approach to over 100k brick-and-mortar retailers across the United States and online platforms, we have implemented our algorithms in custom-built Python libraries using Apache Spark. We package and deploy production versions of Python wheels to a hosted repository for installation to production infrastructure.
To orchestrate the execution of these processes at scale, we use a combination of the Databricks API, Azure App Configuration, Azure Functions, Azure Event Grid and some custom-built utilities to deploy the production wheels to on-demand and interactive Databricks clusters. From there, we monitor execution with Azure Application Insights and log evaluation metrics to Databricks Delta tables on ADLS. To create a full-fledged product and deliver value to customers, we built a custom web application using React and GraphQL which allows users to request assortment recommendations in a self-service, ad-hoc fashion.
Cenacle Research is engaged in building Predictive Analytics Engines for Automotive, Healthcare, Retail, Energy and BFSI sector. This presentation details how our Big data Analytics platform can help retail businesses in a brief manner.
Big Data offers: Actionable Insights that let you make Informed Decisions, with the capability to:
+ Gain Insight
+ Take Proactive action
+ Reduce waste
+ Plan better strategy
To know more, write to us at: http://cenacle.co.in/
Introduction to Business Analytics and Simulation
http://nguyenngocbinhphuong.com/course/mo-phong-trong-kinh-doanh/
1) What is Business Analytics?
2) Types of Business Analytics: Descriptive, Predictive & Prescriptive
3) Data for Business Analytics: Structured & Unstructured or Semi-Structured
4) Models in Business Analytics: Logic-Driven Models & Data-Driven Models
5) Types of Business Simulation: Monte Carlo Simulation & System Simulation
AI in Insurance: How to Automate Insurance Claim Processing with Machine Lear...Skyl.ai
About the webinar
Insurance companies are looking at technology to solve complexity created by presence of cumbersome processes and presence of multiple entities like actuaries, support team and customers in the claim processing cycle.
Today, a lot of insurance companies are opting for Machine Learning to simplify and automate the processes to reduce fraudulent claims, predict underwriting risks, improve customer relationship management. This automated insurance claim process can remove excessive human intervention or manual errors and can report the claim, capture damage, update the system and communicate with the customers by itself. This leads to an effortless process enabling clients to file their claims without much hassle.
In this webinar, we will discuss how insurers are increasingly relying on machine learning to improve claim processing efficiency and increase ROI.
What you'll learn
- How Insurance companies are using ML to drive more efficiency and business gain
- Best practices to automate machine learning models
- Demo: A deeper understanding of the end-to-end machine learning workflow for car damage recognition using Skyl.ai
Artificial Intelligence Can Now Generate Amazing Images – What Does The Mean ...Bernard Marr
Figuring out the formula to help computers see as good (or better than) humans has been a challenge. Today, artificial intelligence can not only identify the subject of an image, but it’s also creating realistic images and original artwork. With the capability of image creation and other skills, artificial intelligence continues to revolutionize just about every industry.
Responsible AI & Cybersecurity: A tale of two technology risksLiming Zhu
With the broader adoption of digital technologies and AI, organisations face the emerging risks of AI, the unfamiliar, and the intensified risk of cybersecurity, the familiar. AI and cybersecurity are intertwined, but risk silos are often created when they are dealt with at the technology and governance levels. This talk will explore the interactions between responsible AI and cybersecurity risks via industry case studies. It will show how we can break down the risk silos and use emerging trust-enhancing technologies, architecture and end-to-end software engineering/DevOps practices to connect the two worlds and uplift the risk management posture for both.
Technology for everyone - AI ethics and BiasMarion Mulder
Slides from my talk at #ToonTechTalks on 27 september 2018
We all see the great potential AI is bringing us. But is it really bringing it to everyone? How are we ensuring under-represented groups are included and vulnerable people are protected? What to do when our technology is unintended biased and discriminating against certain groups. And what if the data and AI is correct, but the by-effect of it is that some groups are put at risk? All questions we need to think about when we are advancing technology for the benefit of humanity.
Sharing what I've learned from my work in diversity, digital and from following great minds in this field such as Joanna Bryson, Virginia Dignum, Rumman Chowdhury, Juriaan van Diggelen, Valerie Frissen, Catelijne Muller, and many more.
Data Analytics accenture- Tache3_final.pptx6mqj8cem4
Le marketing digital revêt aujourd'hui une grande importance pour les entreprises qui souhaitent se démarquer dans un environnement concurrentiel. Certains leviers clés du marketing digital sont le référencement et la visibilité, qui permettent d'attirer des visiteurs qualifiés sur un site web et de les convertir en clients. Ce cours vise à présenter les fondamentaux du référencement et de la visibilité dans le marketing digital. Nous allons explorer les différentes techniques de référencement et de visibilité, notamment l'optimisation des mots clés, la création de contenu de qualité, la gestion des backlinks et l'utilisation des réseaux sociaux. Nous allons en outre examiner les outils et les techniques de mesure de la performance, pour évaluer l'efficacité des stratégies mises en place. A la fin de ce cours, vous devriez avoir une bonne compréhension des meilleures pratiques pour améliorer le référencement et la visibilité d’une entreprise/personne et être capable de mettre en place une stratégie efficace.
David Bernstein of eQuest, the global leader in job-posting delivery and job board performance analytics, discusses how Big Data analysis provides organizations with greater recruitment marketing effectivenss than ever before. By not only delivering predictive information on job postings but by also taking a holistic look at your talent pipeline, Big Data analysis provides the insight organizations need to make better-informed decisions more quickly, reducing time-to-hire, costs and administrative burden.
White paper: The Past, Present and Future of Information ManagementLexisNexis Benelux
From a physical to digital information world. The information industry is being impacted by changes in technology, the growing volume of information, big data and social networks.
LexisNexis has undertaken this report to help organisations understand the nature and impact of these changes. Here we analyse the past and present, and look ahead with the aim of equipping today’s information managers with the right tools
#MITXData "Leveraging Data and Analytics for Your Marketing Strategy" present...MITX
-Jesse Harriott, Ph.D., Chief Analytics Officer, Constant Contact
-Dave Krupinksi, Co-Founder & Chief Technology Officer, Care.com
You may remember the days before the Web, social media, mobile, and Big Data. Instinct was a prized business characteristic and it, rather than data, drove many corporate marketing decisions.Companies now say that they are "data-driven" and only make quantitative marketing decisions. But these same companies are also overwhelmed by the sheer volume of data at their disposal and how to best analyze it to shape critical marketing questions. The issue today is not the lack of data, but rather how to prioritize, access, and use data in real time so it has the greatest impact on your business.
During this opening keynote, two top analytic leaders from major brands, Constant Contact and Care.com, will share best practices and proven strategies for incorporating analytics into your marketing strategy. Join Jesse Harriott, Chief Analytics Officer at Constant Contact, and Dave Krupinski, Co-founder and Chief Technology Officer at Care.com, as they discuss strategies to leverage data and analytics tools to inform marketing decisions and realize substantial ROI.
Big Data LDN 2018: FIGHTING DATA CHAOS: CONNECTING USERS TO DATA AT SCALEMatt Stubbs
Date: 13th November 2018
Location: Self-Service Analytics
Theatre Time: 12:30 - 13:00
Speaker: Joel McKelvey
Organisation: Looker
About: Companies that use data well are more efficient, effective, and profitable. Unfortunately, most organizations struggle to keep up with the changing supply of data — and the growing business demands for that data. The key is to connect data supply to data users in a way that scales, supports existing workflows, and serves as a foundation for the future.
This session will explore how to bring data to users where and when they need it without sacrificing data governance or unified metrics. This session will also present proven ways to build a data foundation for your organisation that can support future changes in both data supply and data demand.
Specifically, attendees will discover:
• The key considerations to driving the most value from data, including: self-service, governance, custom interfaces, modeling, and connections to existing business systems.
• How to provide users access to data in a way that naturally fits in their existing workflows and allows users to take immediate action.
• How companies like Deliveroo and King extract critical business insights from growing data and deliver those insights to their business users.
STATATHON: Unleashing the Power of Statistics in a 48-Hour Knowledge Extravag...sameer shah
"Join us for STATATHON, a dynamic 2-day event dedicated to exploring statistical knowledge and its real-world applications. From theory to practice, participants engage in intensive learning sessions, workshops, and challenges, fostering a deeper understanding of statistical methodologies and their significance in various fields."
Unleashing the Power of Data_ Choosing a Trusted Analytics Platform.pdfEnterprise Wired
In this guide, we'll explore the key considerations and features to look for when choosing a Trusted analytics platform that meets your organization's needs and delivers actionable intelligence you can trust.
The Building Blocks of QuestDB, a Time Series Databasejavier ramirez
Talk Delivered at Valencia Codes Meetup 2024-06.
Traditionally, databases have treated timestamps just as another data type. However, when performing real-time analytics, timestamps should be first class citizens and we need rich time semantics to get the most out of our data. We also need to deal with ever growing datasets while keeping performant, which is as fun as it sounds.
It is no wonder time-series databases are now more popular than ever before. Join me in this session to learn about the internal architecture and building blocks of QuestDB, an open source time-series database designed for speed. We will also review a history of some of the changes we have gone over the past two years to deal with late and unordered data, non-blocking writes, read-replicas, or faster batch ingestion.
Adjusting primitives for graph : SHORT REPORT / NOTESSubhajit Sahu
Graph algorithms, like PageRank Compressed Sparse Row (CSR) is an adjacency-list based graph representation that is
Multiply with different modes (map)
1. Performance of sequential execution based vs OpenMP based vector multiply.
2. Comparing various launch configs for CUDA based vector multiply.
Sum with different storage types (reduce)
1. Performance of vector element sum using float vs bfloat16 as the storage type.
Sum with different modes (reduce)
1. Performance of sequential execution based vs OpenMP based vector element sum.
2. Performance of memcpy vs in-place based CUDA based vector element sum.
3. Comparing various launch configs for CUDA based vector element sum (memcpy).
4. Comparing various launch configs for CUDA based vector element sum (in-place).
Sum with in-place strategies of CUDA mode (reduce)
1. Comparing various launch configs for CUDA based vector element sum (in-place).
Chatty Kathy - UNC Bootcamp Final Project Presentation - Final Version - 5.23...John Andrews
SlideShare Description for "Chatty Kathy - UNC Bootcamp Final Project Presentation"
Title: Chatty Kathy: Enhancing Physical Activity Among Older Adults
Description:
Discover how Chatty Kathy, an innovative project developed at the UNC Bootcamp, aims to tackle the challenge of low physical activity among older adults. Our AI-driven solution uses peer interaction to boost and sustain exercise levels, significantly improving health outcomes. This presentation covers our problem statement, the rationale behind Chatty Kathy, synthetic data and persona creation, model performance metrics, a visual demonstration of the project, and potential future developments. Join us for an insightful Q&A session to explore the potential of this groundbreaking project.
Project Team: Jay Requarth, Jana Avery, John Andrews, Dr. Dick Davis II, Nee Buntoum, Nam Yeongjin & Mat Nicholas
Analysis insight about a Flyball dog competition team's performanceroli9797
Insight of my analysis about a Flyball dog competition team's last year performance. Find more: https://github.com/rolandnagy-ds/flyball_race_analysis/tree/main
Adjusting OpenMP PageRank : SHORT REPORT / NOTESSubhajit Sahu
For massive graphs that fit in RAM, but not in GPU memory, it is possible to take
advantage of a shared memory system with multiple CPUs, each with multiple cores, to
accelerate pagerank computation. If the NUMA architecture of the system is properly taken
into account with good vertex partitioning, the speedup can be significant. To take steps in
this direction, experiments are conducted to implement pagerank in OpenMP using two
different approaches, uniform and hybrid. The uniform approach runs all primitives required
for pagerank in OpenMP mode (with multiple threads). On the other hand, the hybrid
approach runs certain primitives in sequential mode (i.e., sumAt, multiply).
3. Project
Recap
Brief info about the client’s company:
• Social Buzz is a Social media and content creation
company.
• Over the past 5 years, Social Buzz has reached over
500 million active user each month.
Why we?
• IPO Preparation Roadmap: Smoothly Navigating
the Path to public offering.
• Scaling solution for small companies: Empowering
growth through expert guidance.
• Data best practices for managing massive datasets:
Learning from corporate leaders.
4. Problem
• Scaling challenges:
Rapid growth
Strained resources
Infrastructure complexity
• Data management challenges:
Untructured data
Technology requirements
Data insight.
• IPO preparation challenges:
Limited resources
Lack of expertise
10. Summary
• ANALYSIS
Animals and Science are the two most popular categories
of content, showing that people enjoy “real-life” and
“factual” content the most.
• INSIGHT
Food is a common theme with the top 5 categories with
“Heathy Eating” ranking the highest. This may give an
indication to the audience within your user base. You
could use this insight to create a campaign and work with
healthy eating brands to boost user engagement.
• NEXT STEP
this ad-hoc analysis is insightful. But it’s time to take
this analysis into large scale production for real-time
understanding of your business. We can show you how to
do this.