Downloaded 15 times


![Progress in much CCG-local authority joint
working, despite disruption of NHS reform
Asked about joint working between NHS and local authority
commissioners:
• 8 cited effective joint working between local authority and CCG
• 3 referred to challenges from commissioning reform: complexity in
the system, a challenge to established integration of health and
social care, and development needs within CCGs
The immediate impact of the NHS transition process has been mixed:
• “the CCG authorisation process and the closedown of PCTs has
diverted staff time away from this agenda. We have still made
progress due to the tenacity of a few individuals”
• “a change of leadership within the PCT/CCG moved integration on
quickly”
• “[relationships] are generally positive here in [county] (i.e. Between
the Council and the CCGs) [...] CCGs are particularly pressed in
terms of time/capacity.”](https://image.slidesharecdn.com/snapshotofintegratedworking-130703053923-phpapp01/75/Snapshot-of-integrated-working-16-2048.jpg)


![Aspirations for integrated working
in April 2015
Delivery of integrated care
through Integrated Care
Organisations with
collaborative commissioning
arrangements with the CCG
With a strategic integrated
care plan for [our city] being
implemented in our 3 health
and care localities, overseen
and governed by our HWB.
Implementing on the ground
changes to our
services, workforce, estates
and financial models to deliver
integrated care services for the
20% most high need citizens
in [our city].
Our “default” is “why
wouldn't we do this
jointly?”](https://image.slidesharecdn.com/snapshotofintegratedworking-130703053923-phpapp01/75/Snapshot-of-integrated-working-30-2048.jpg)
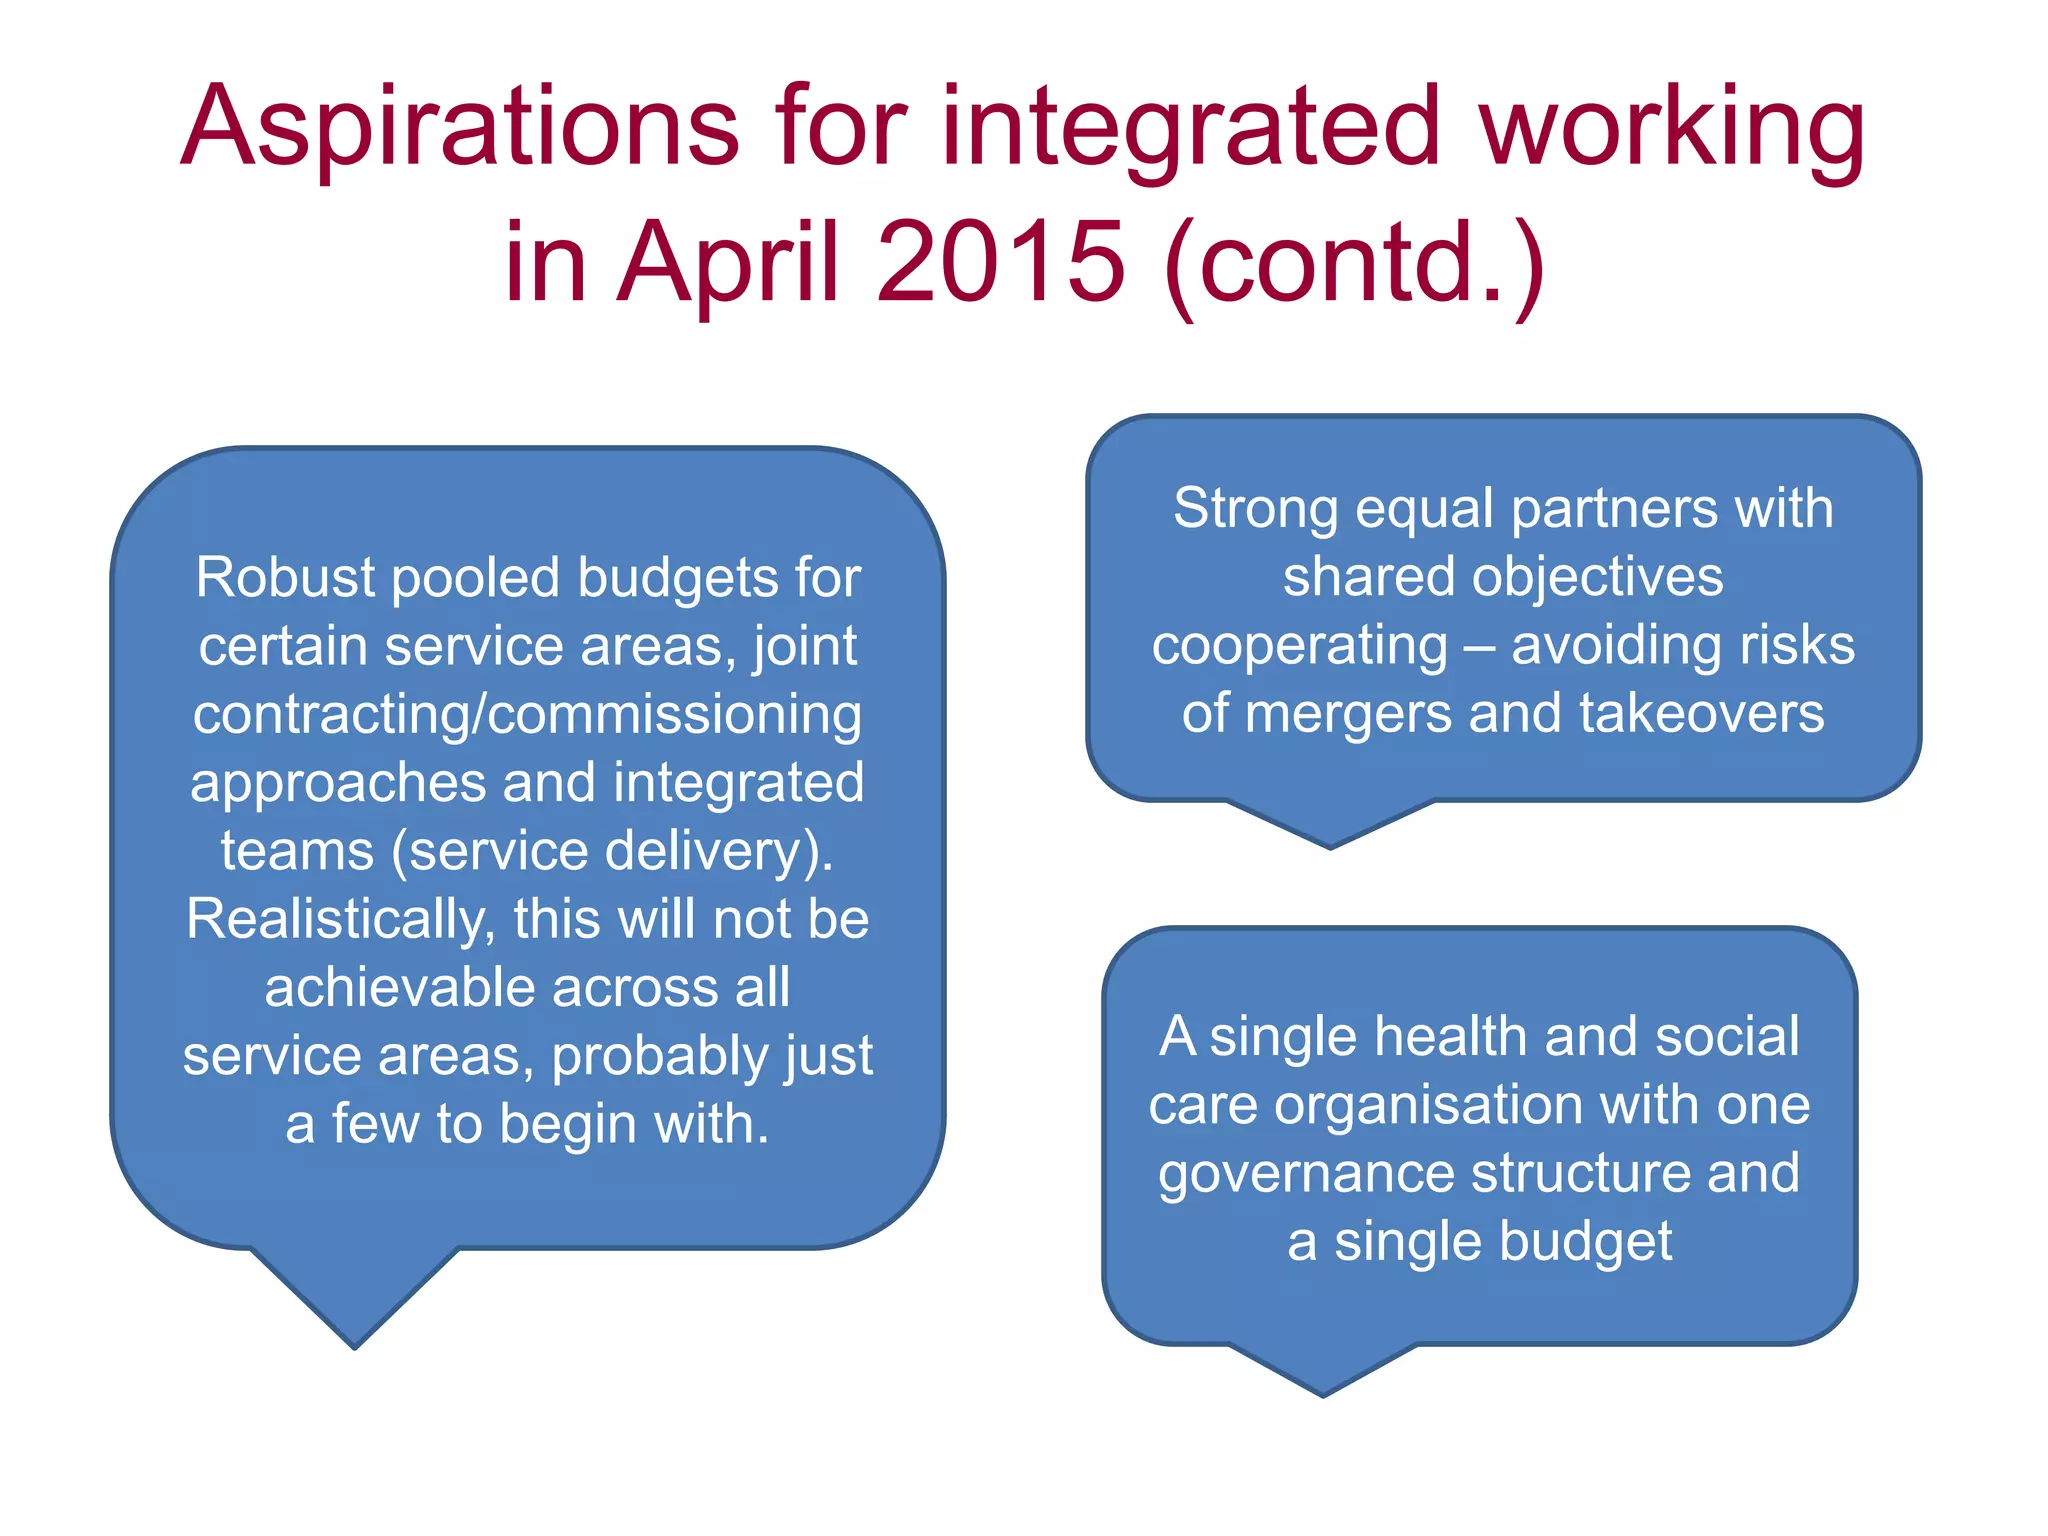

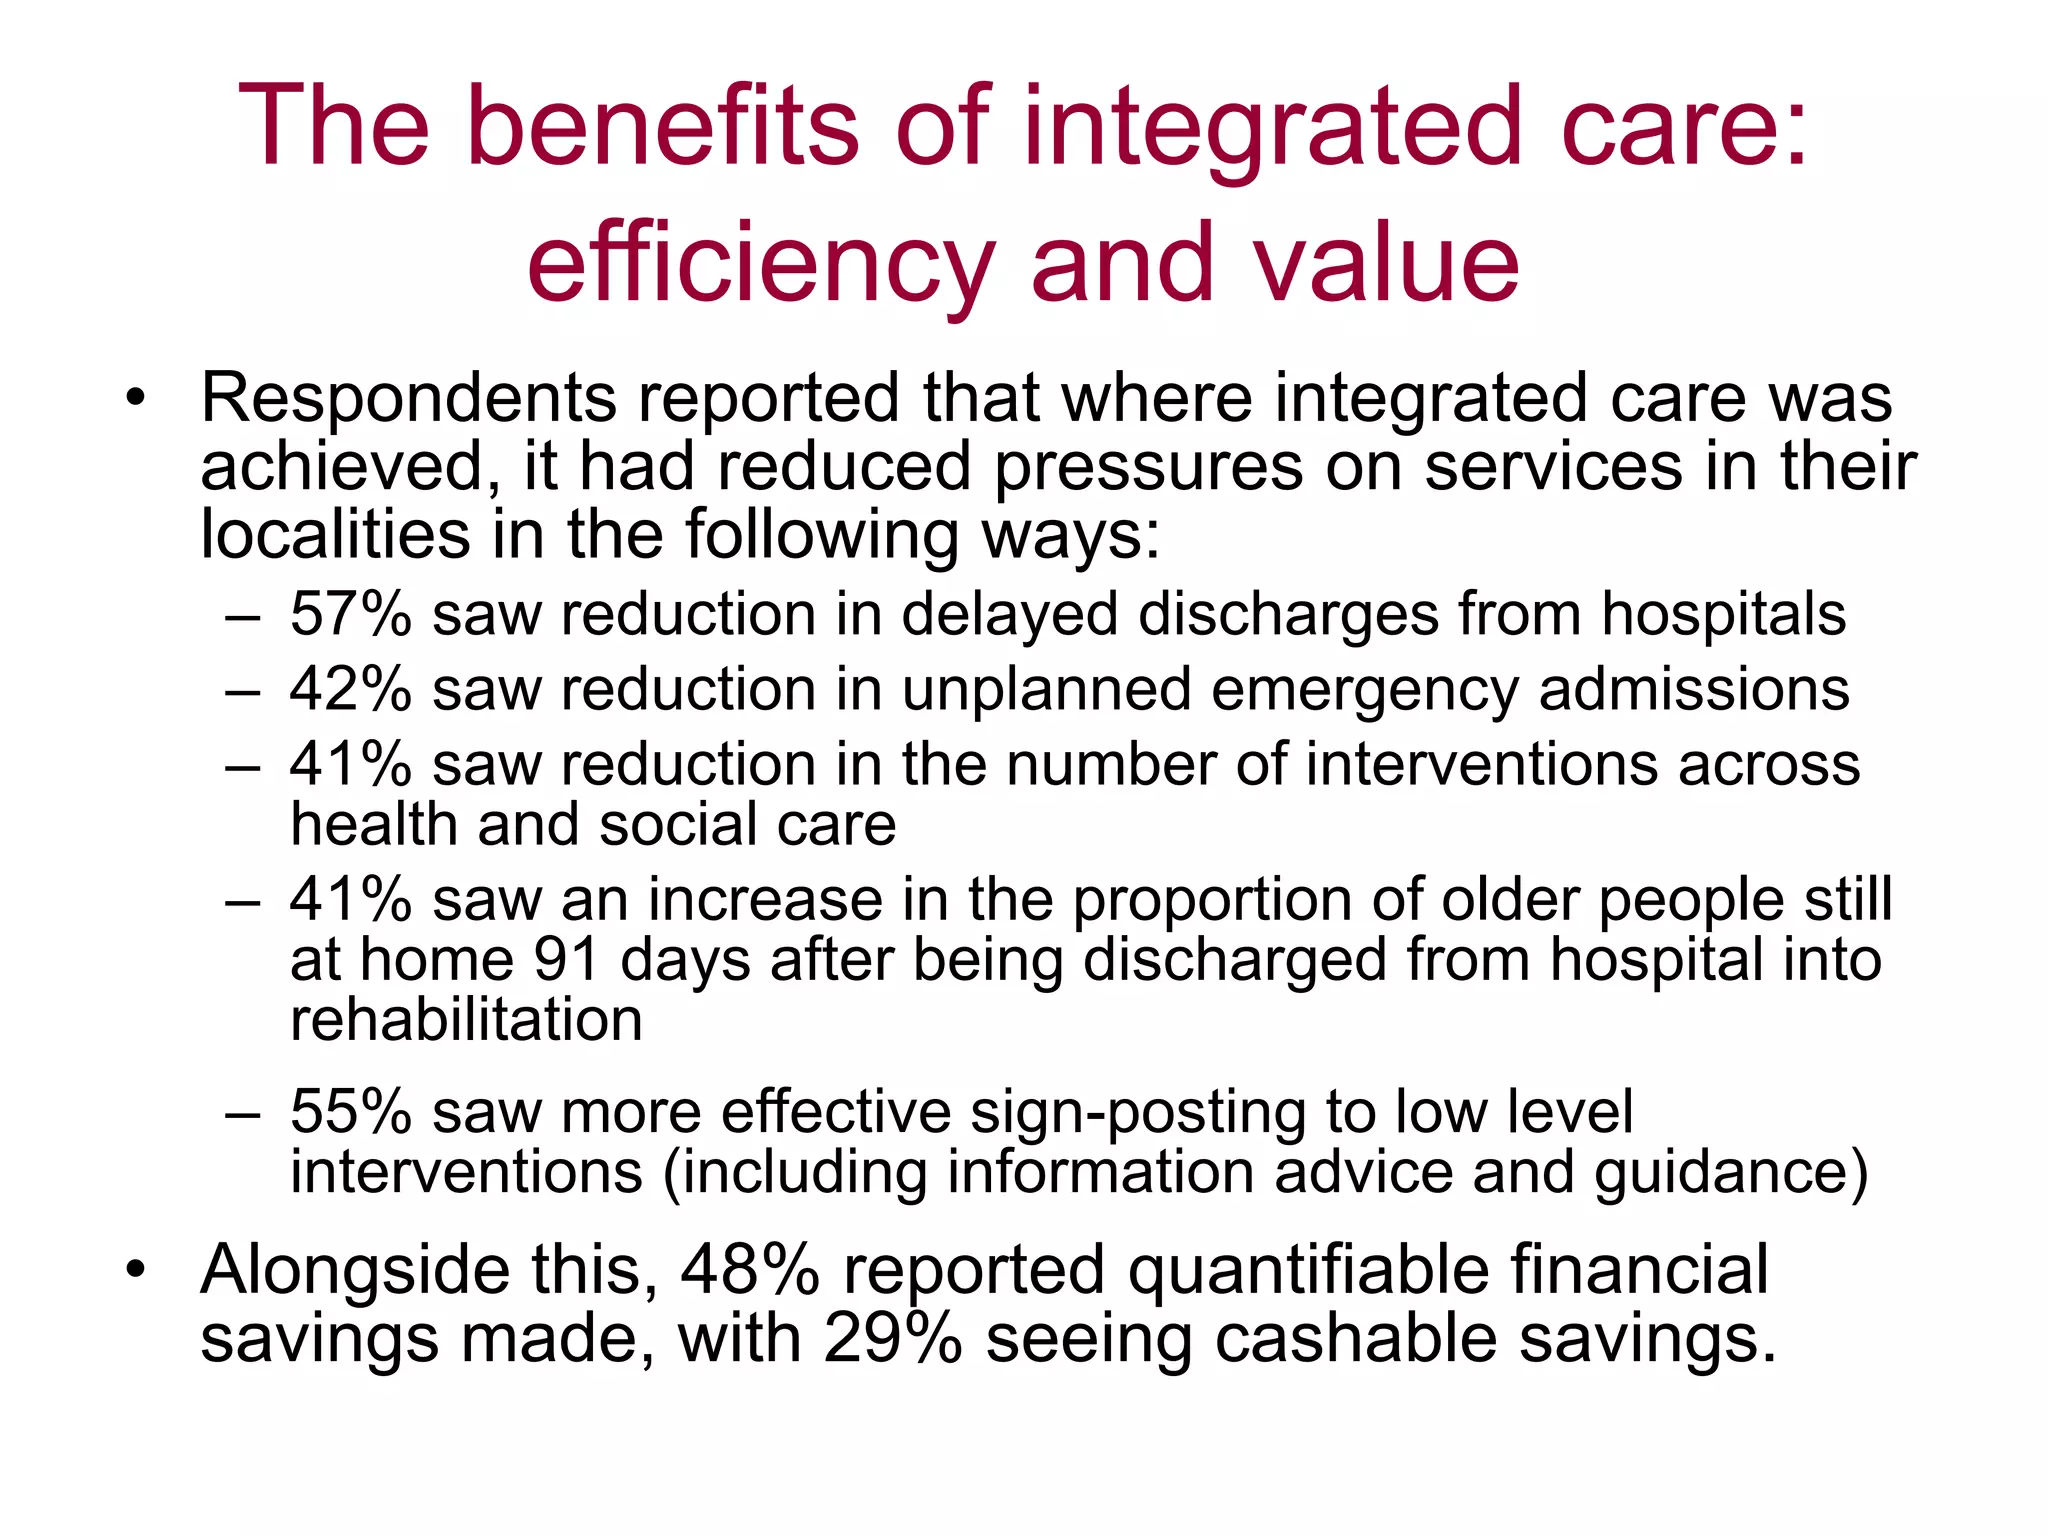
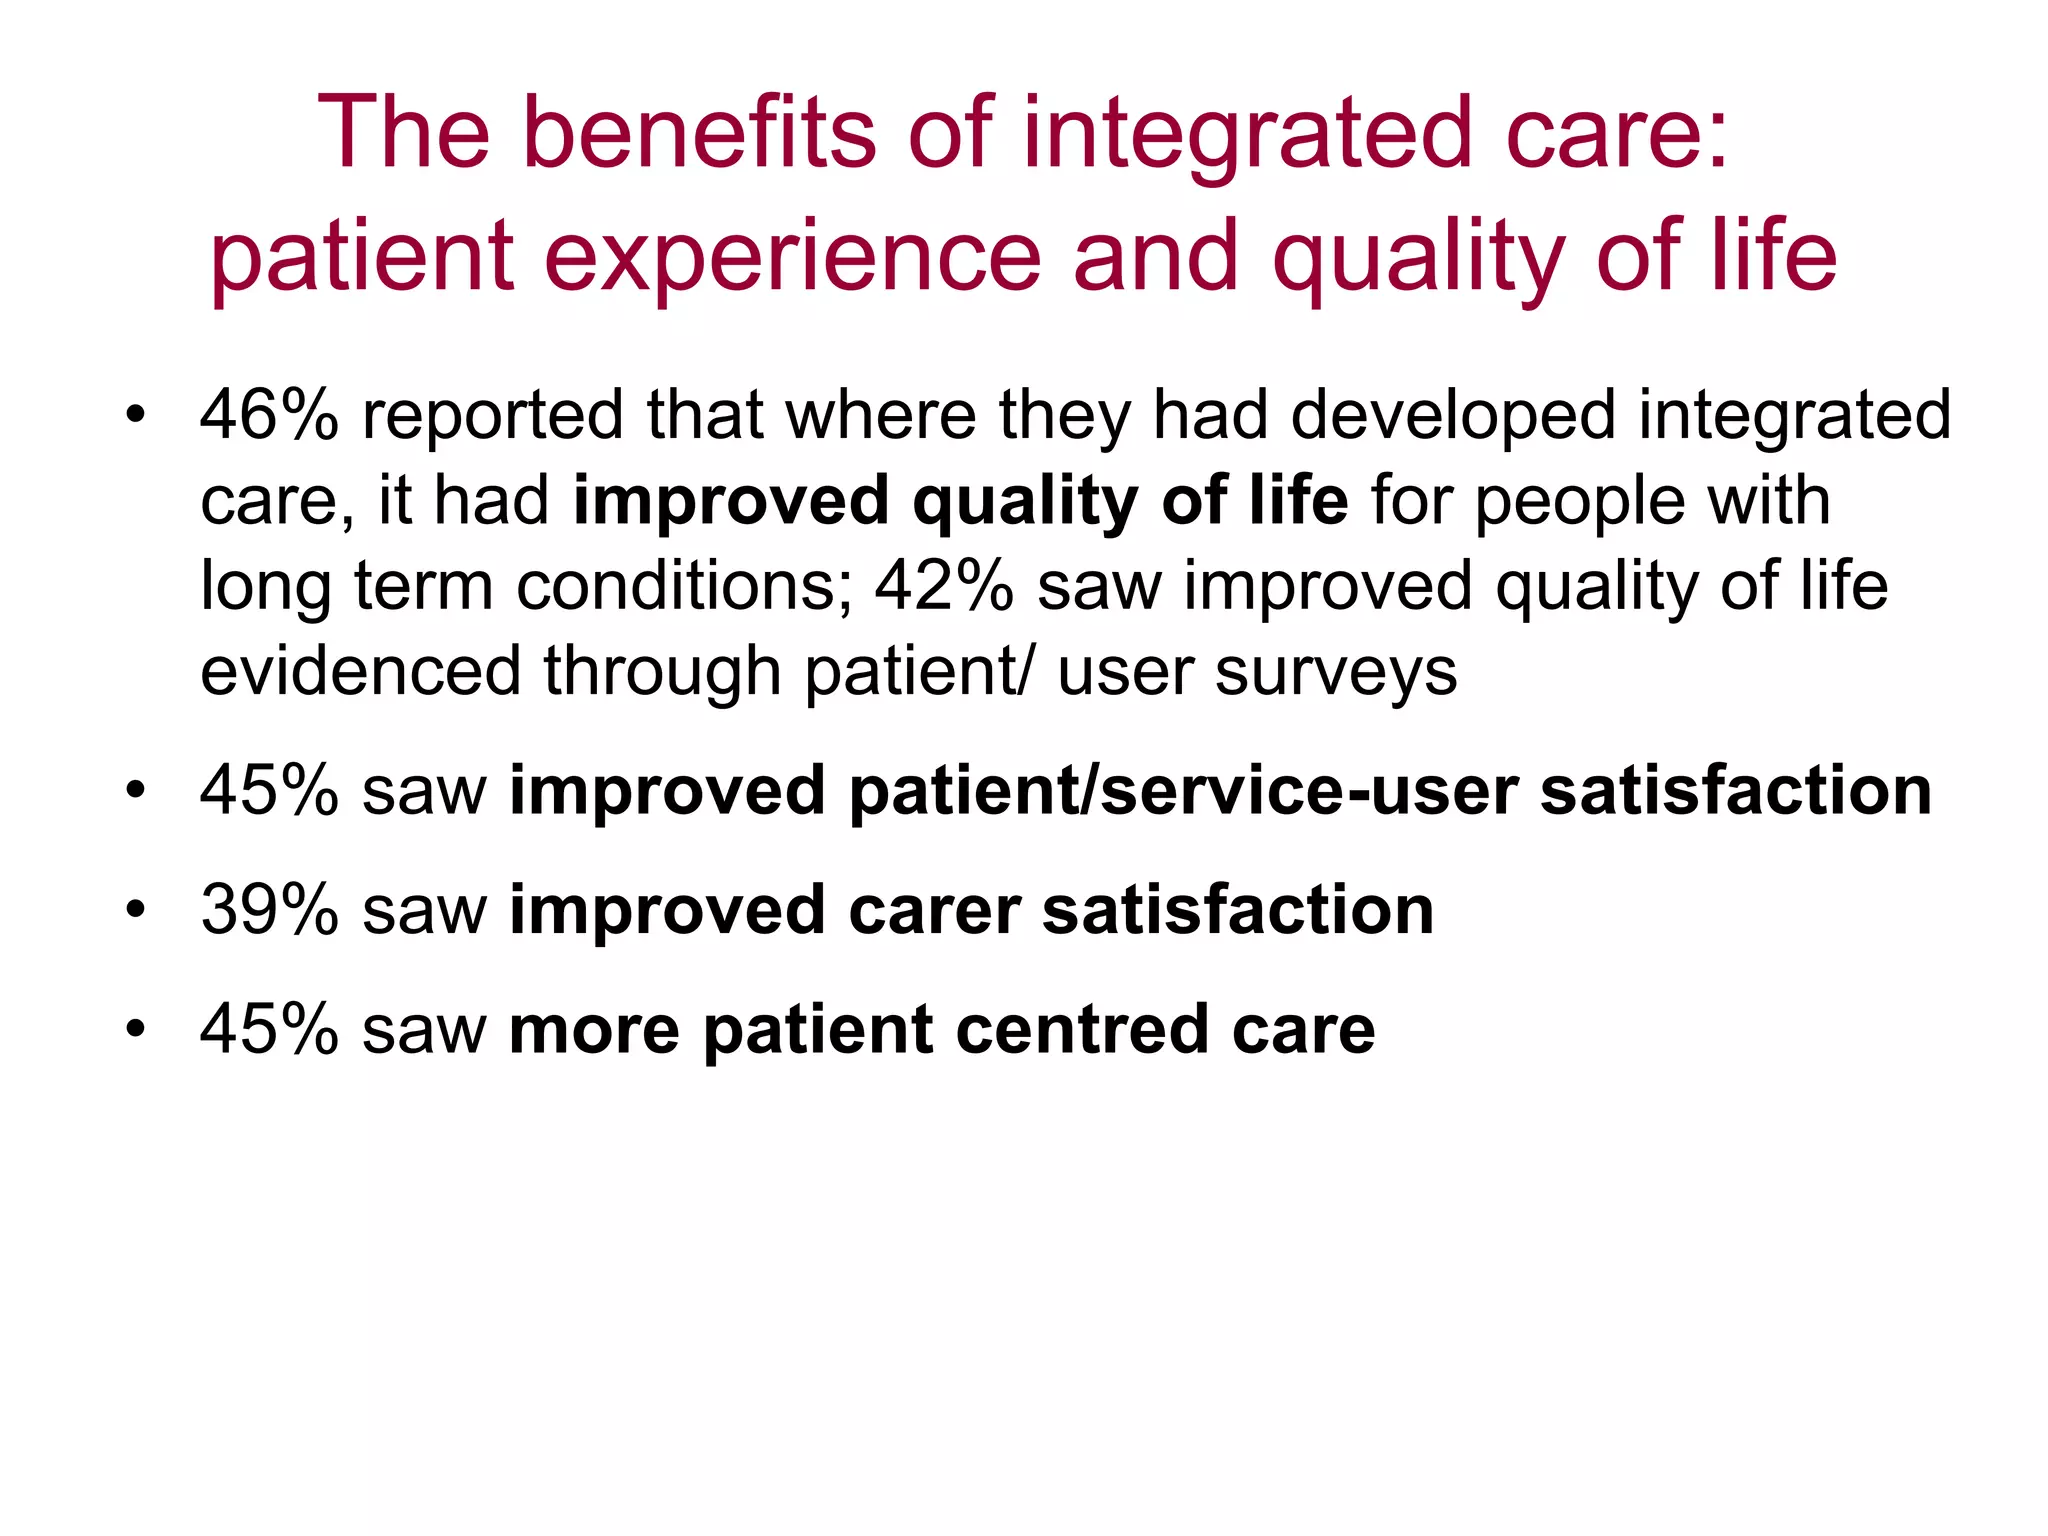
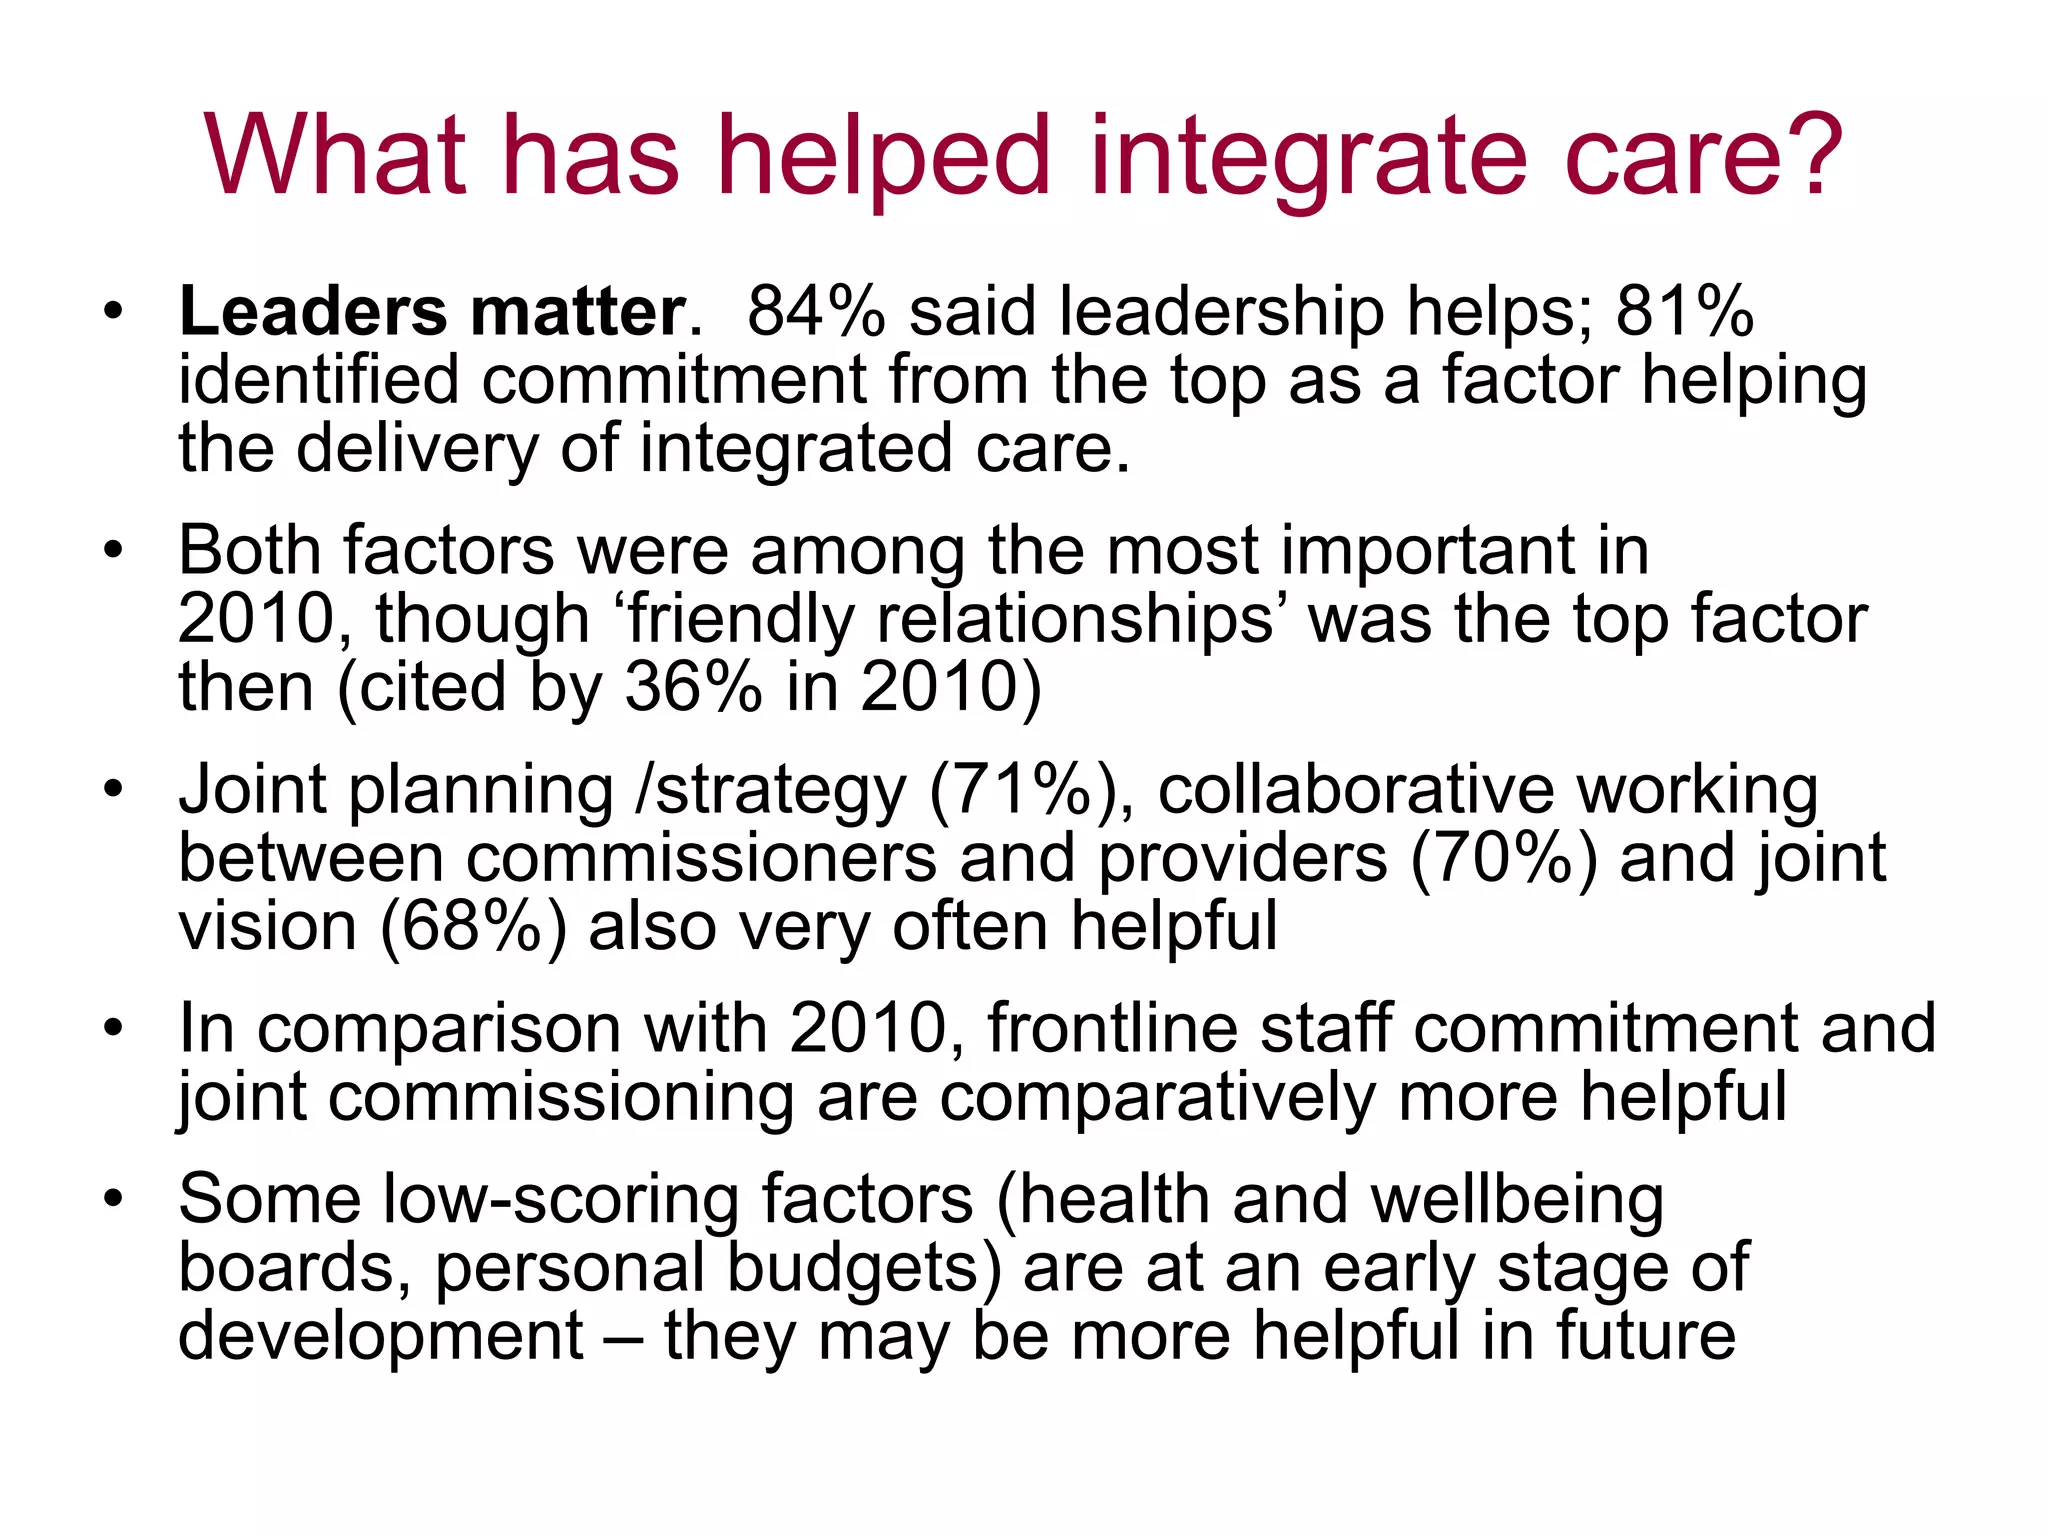
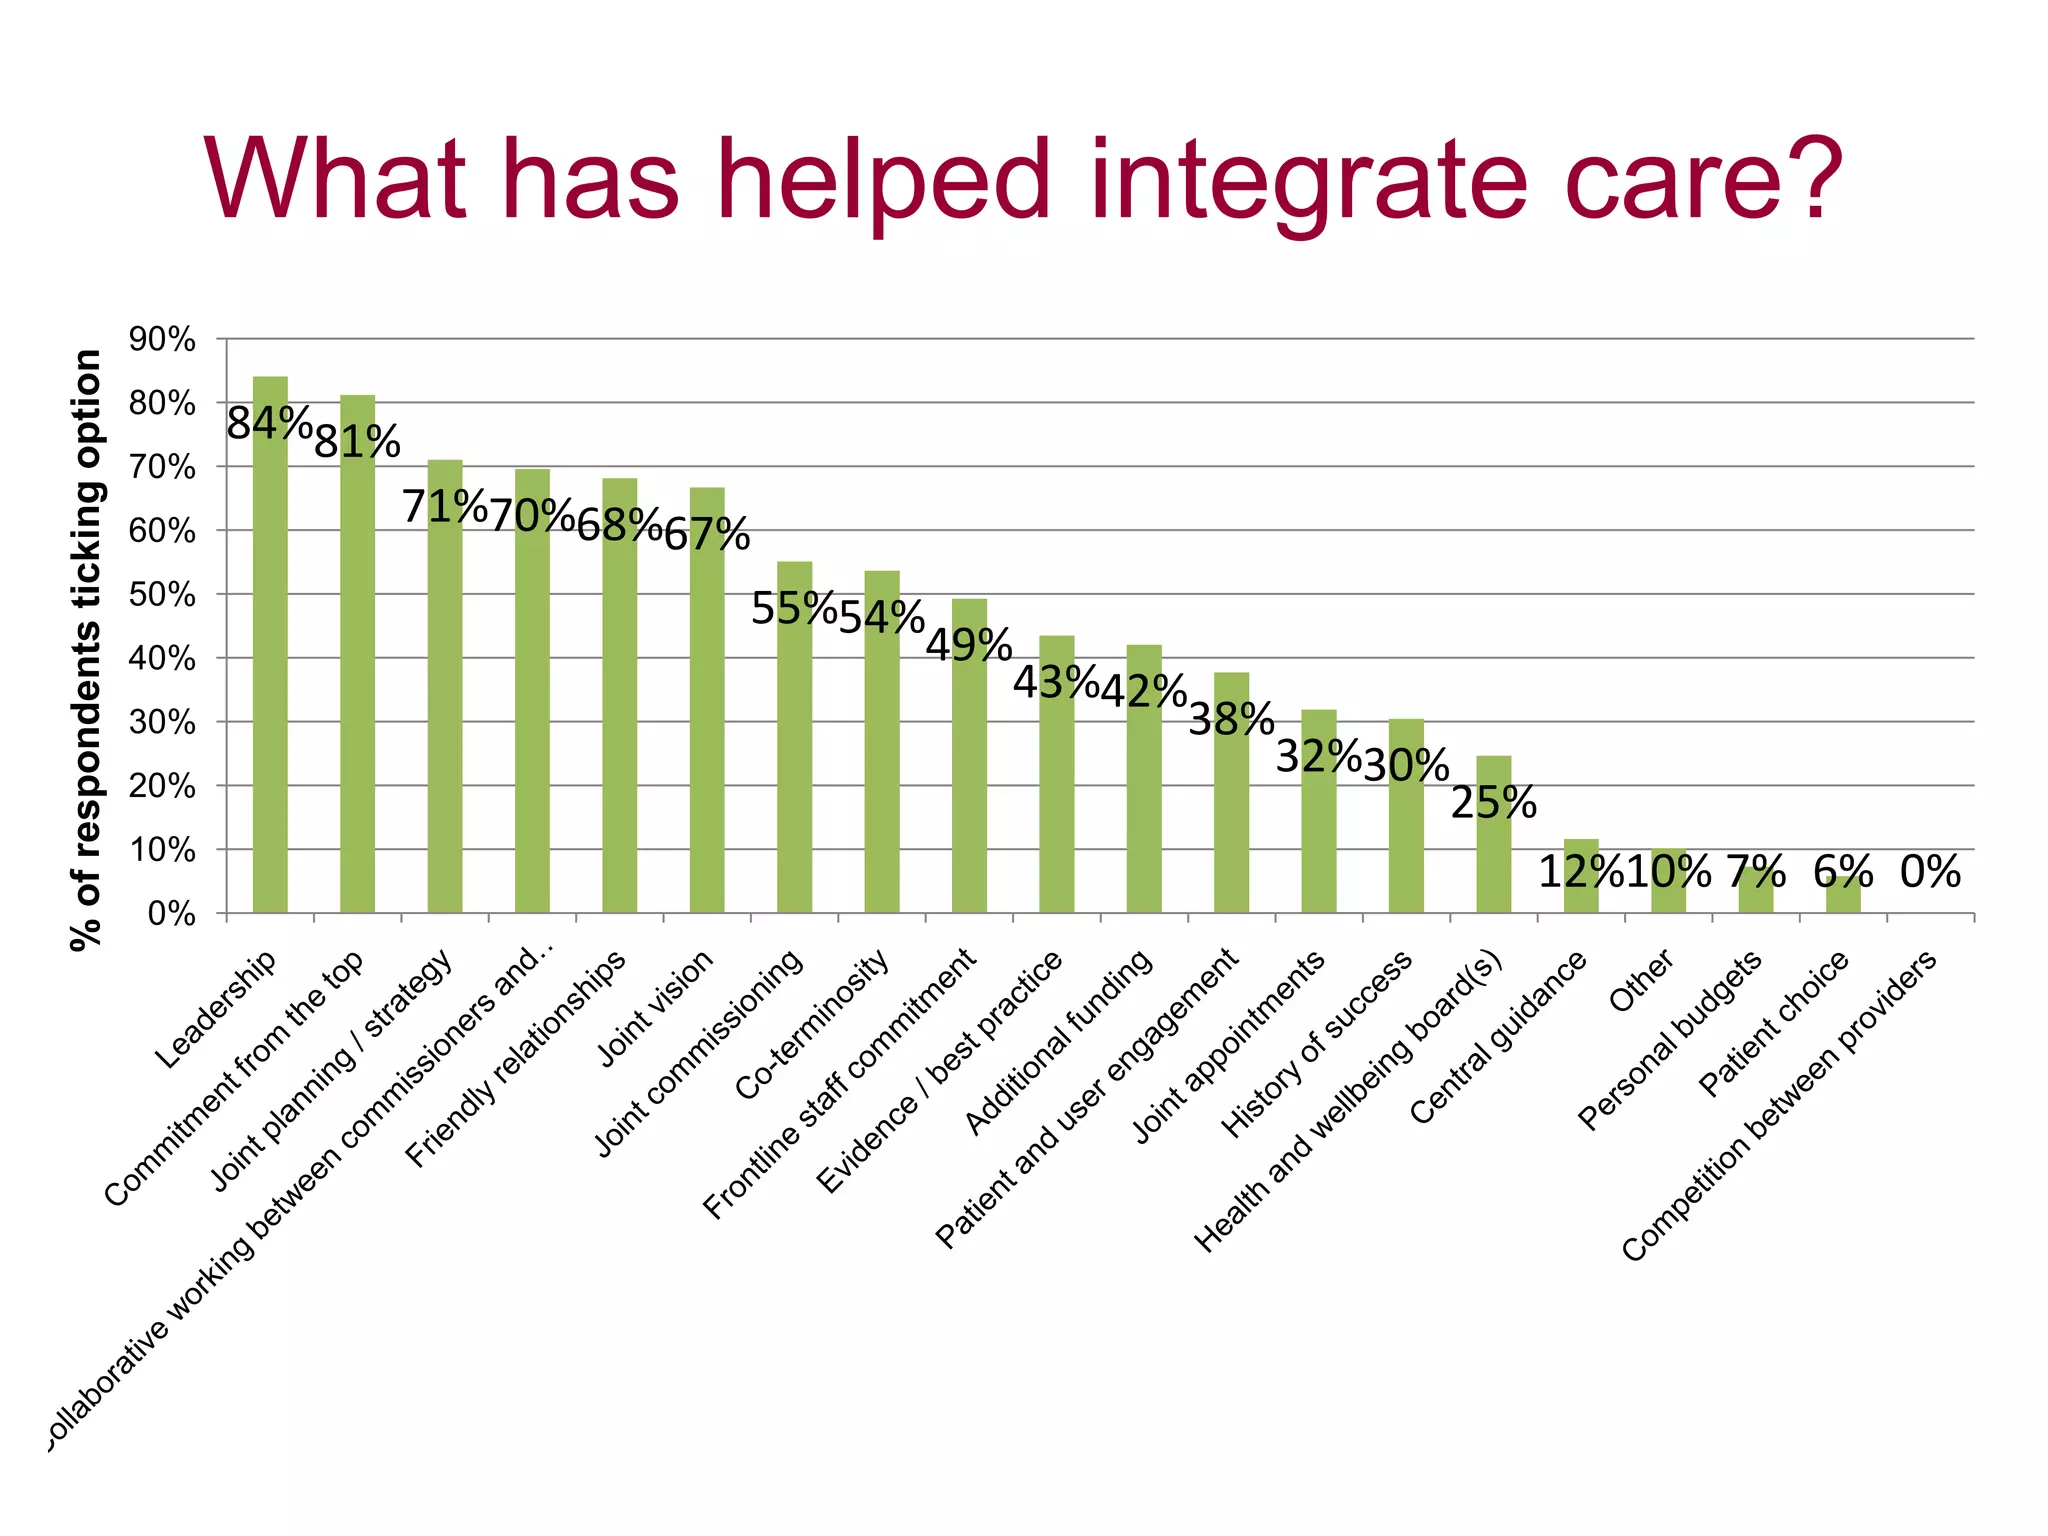
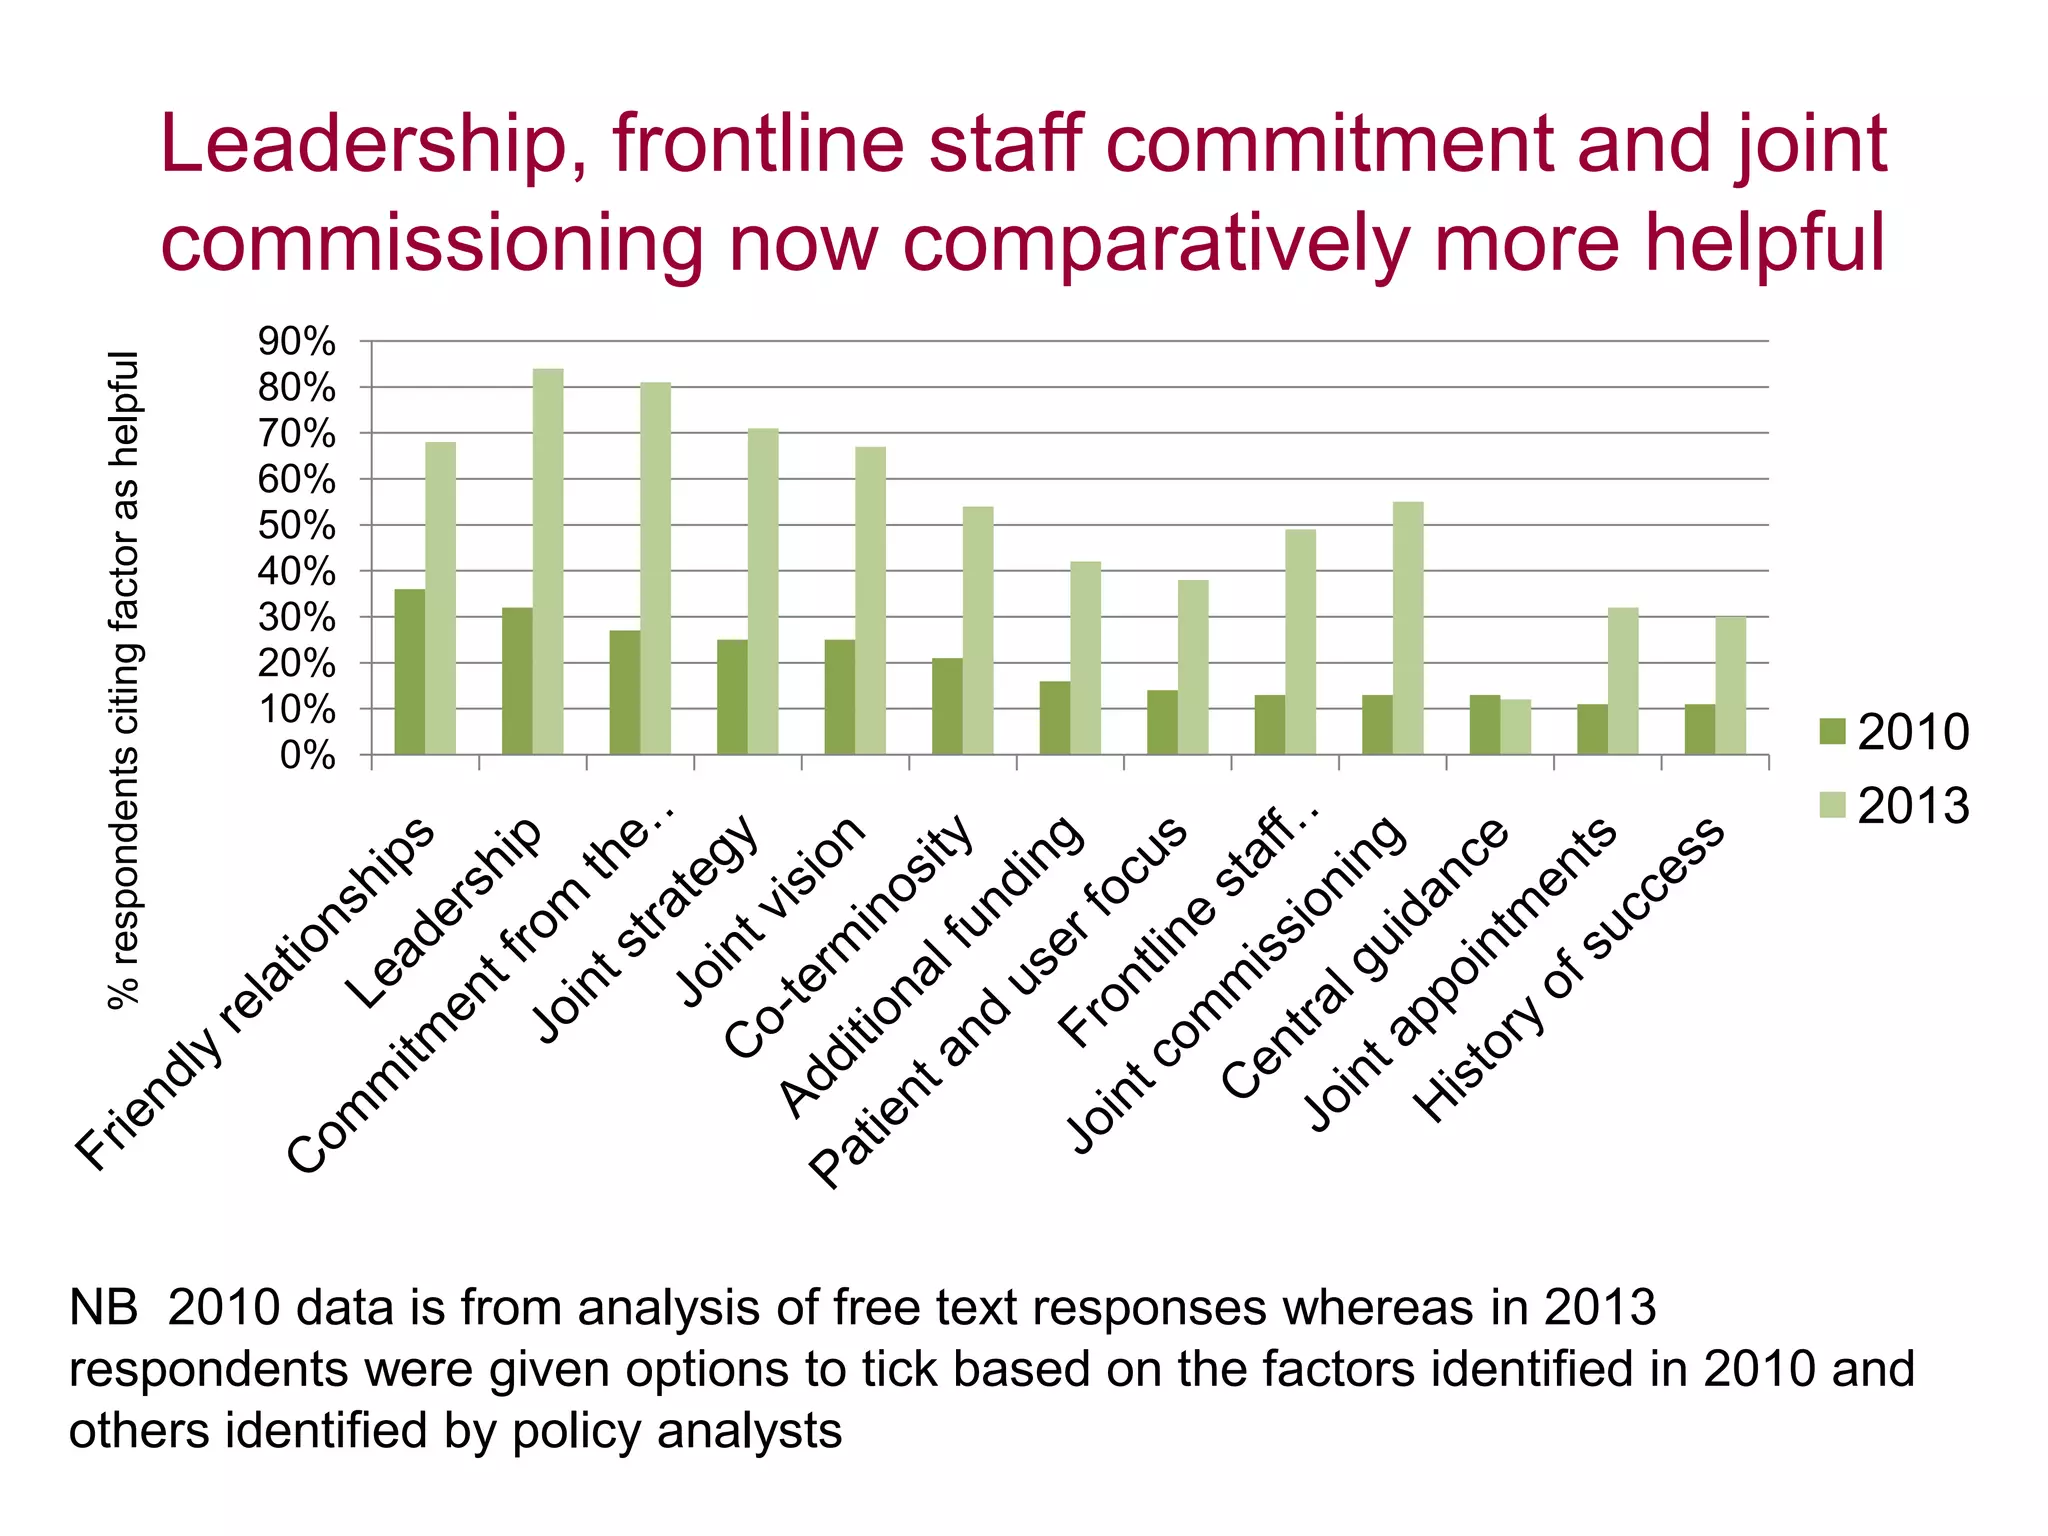
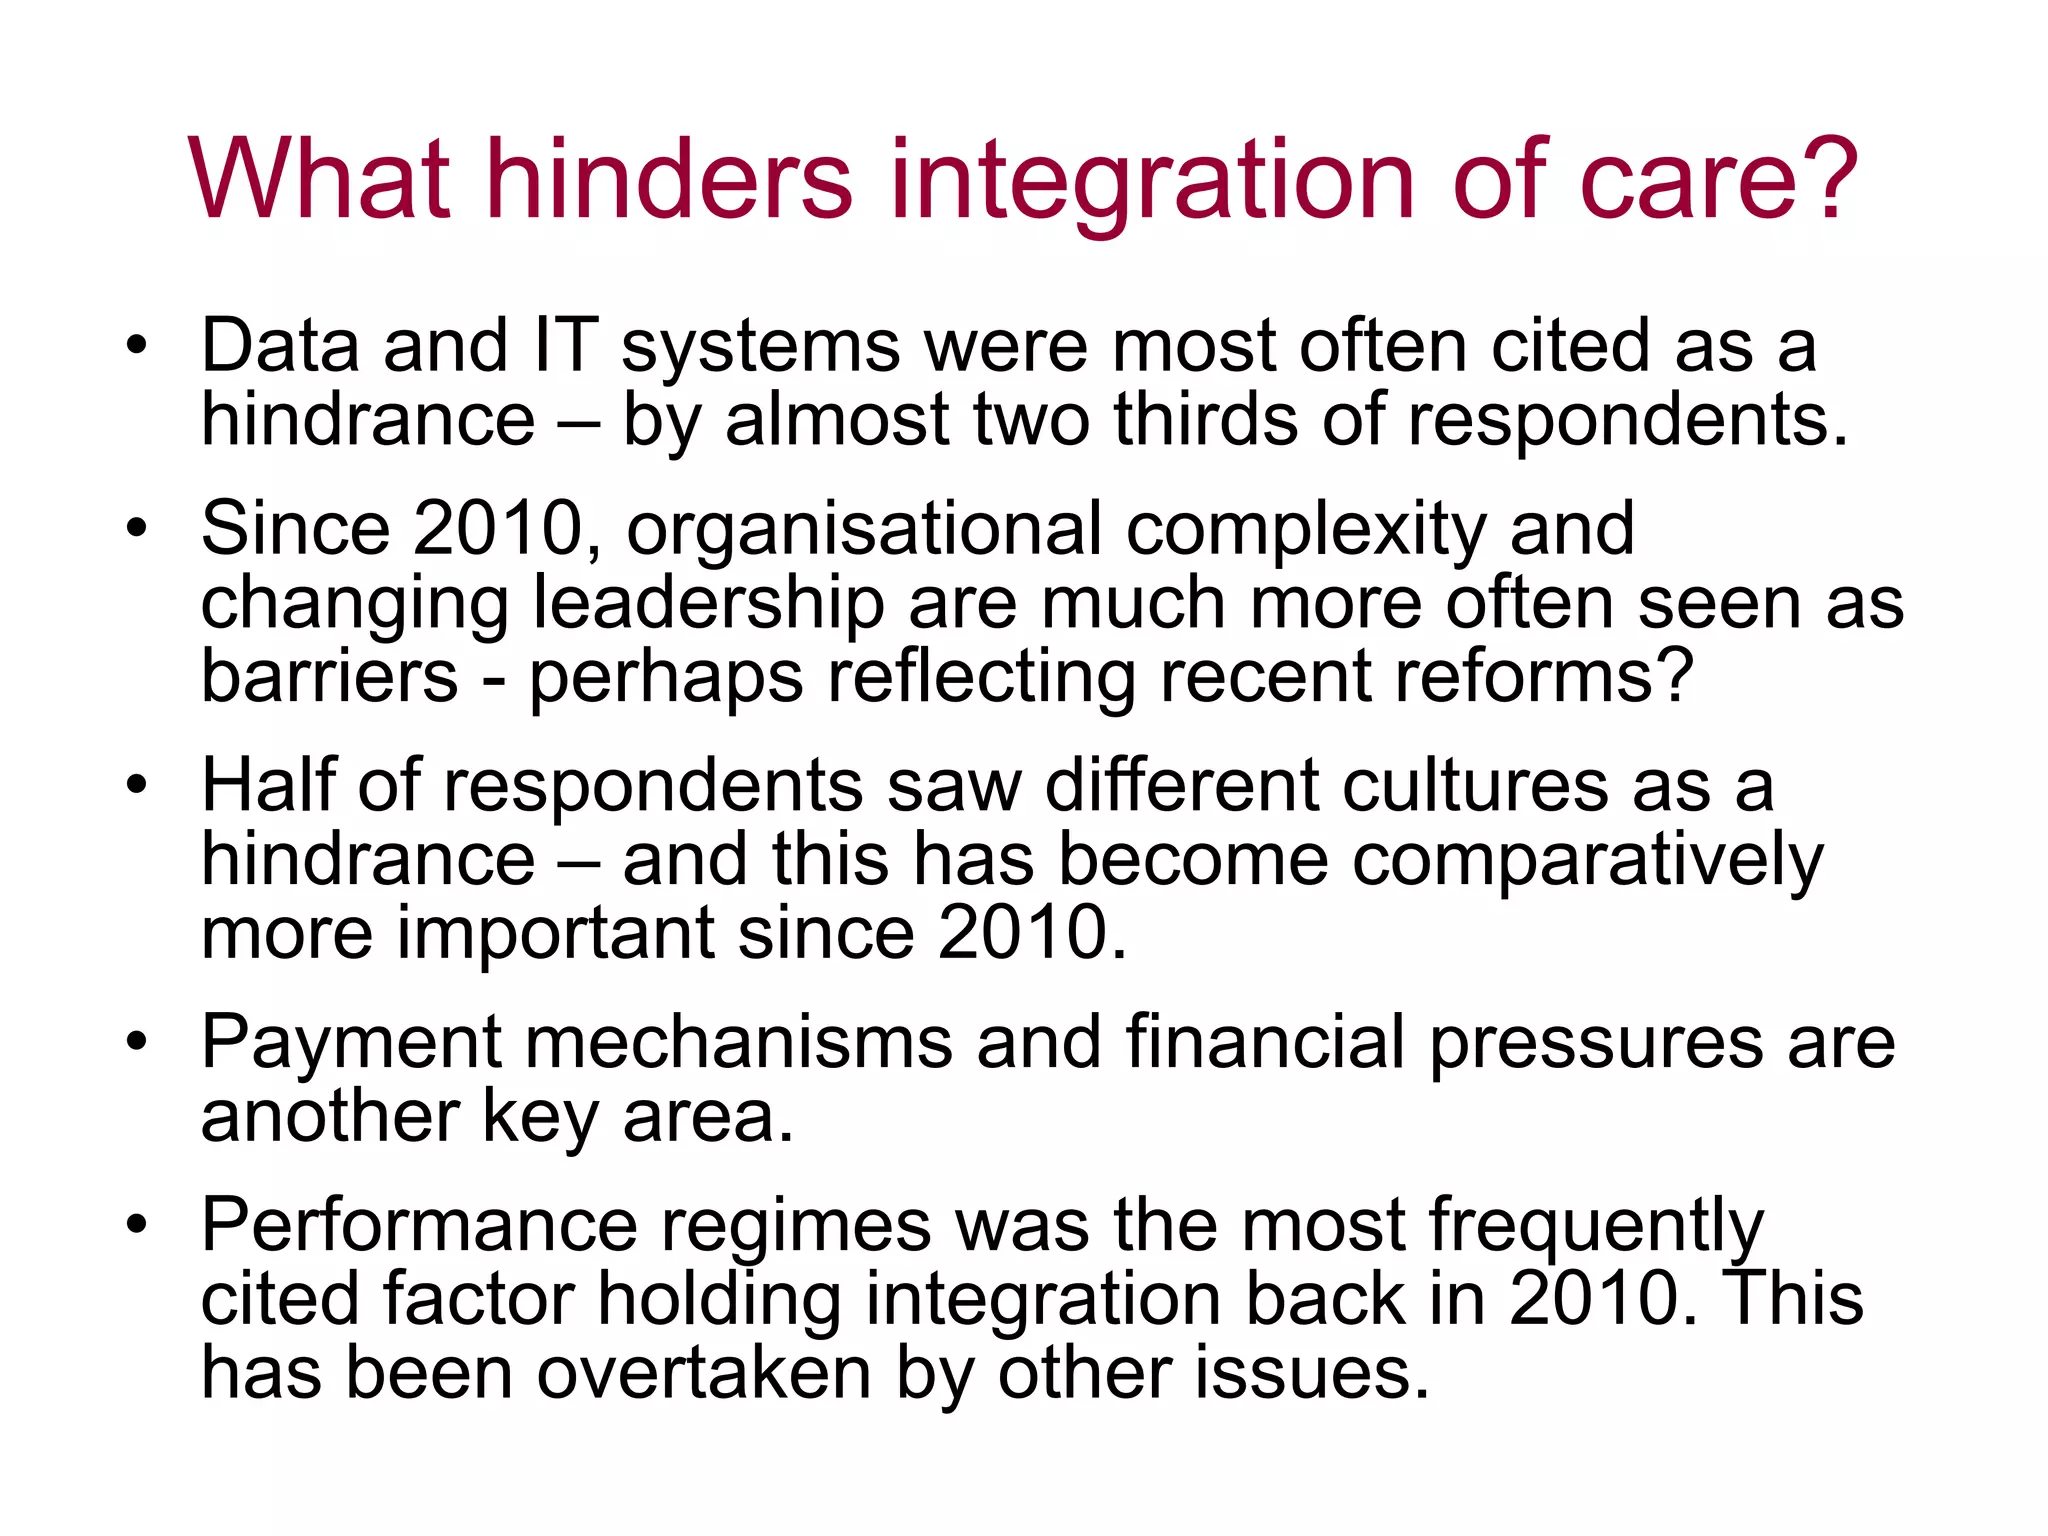
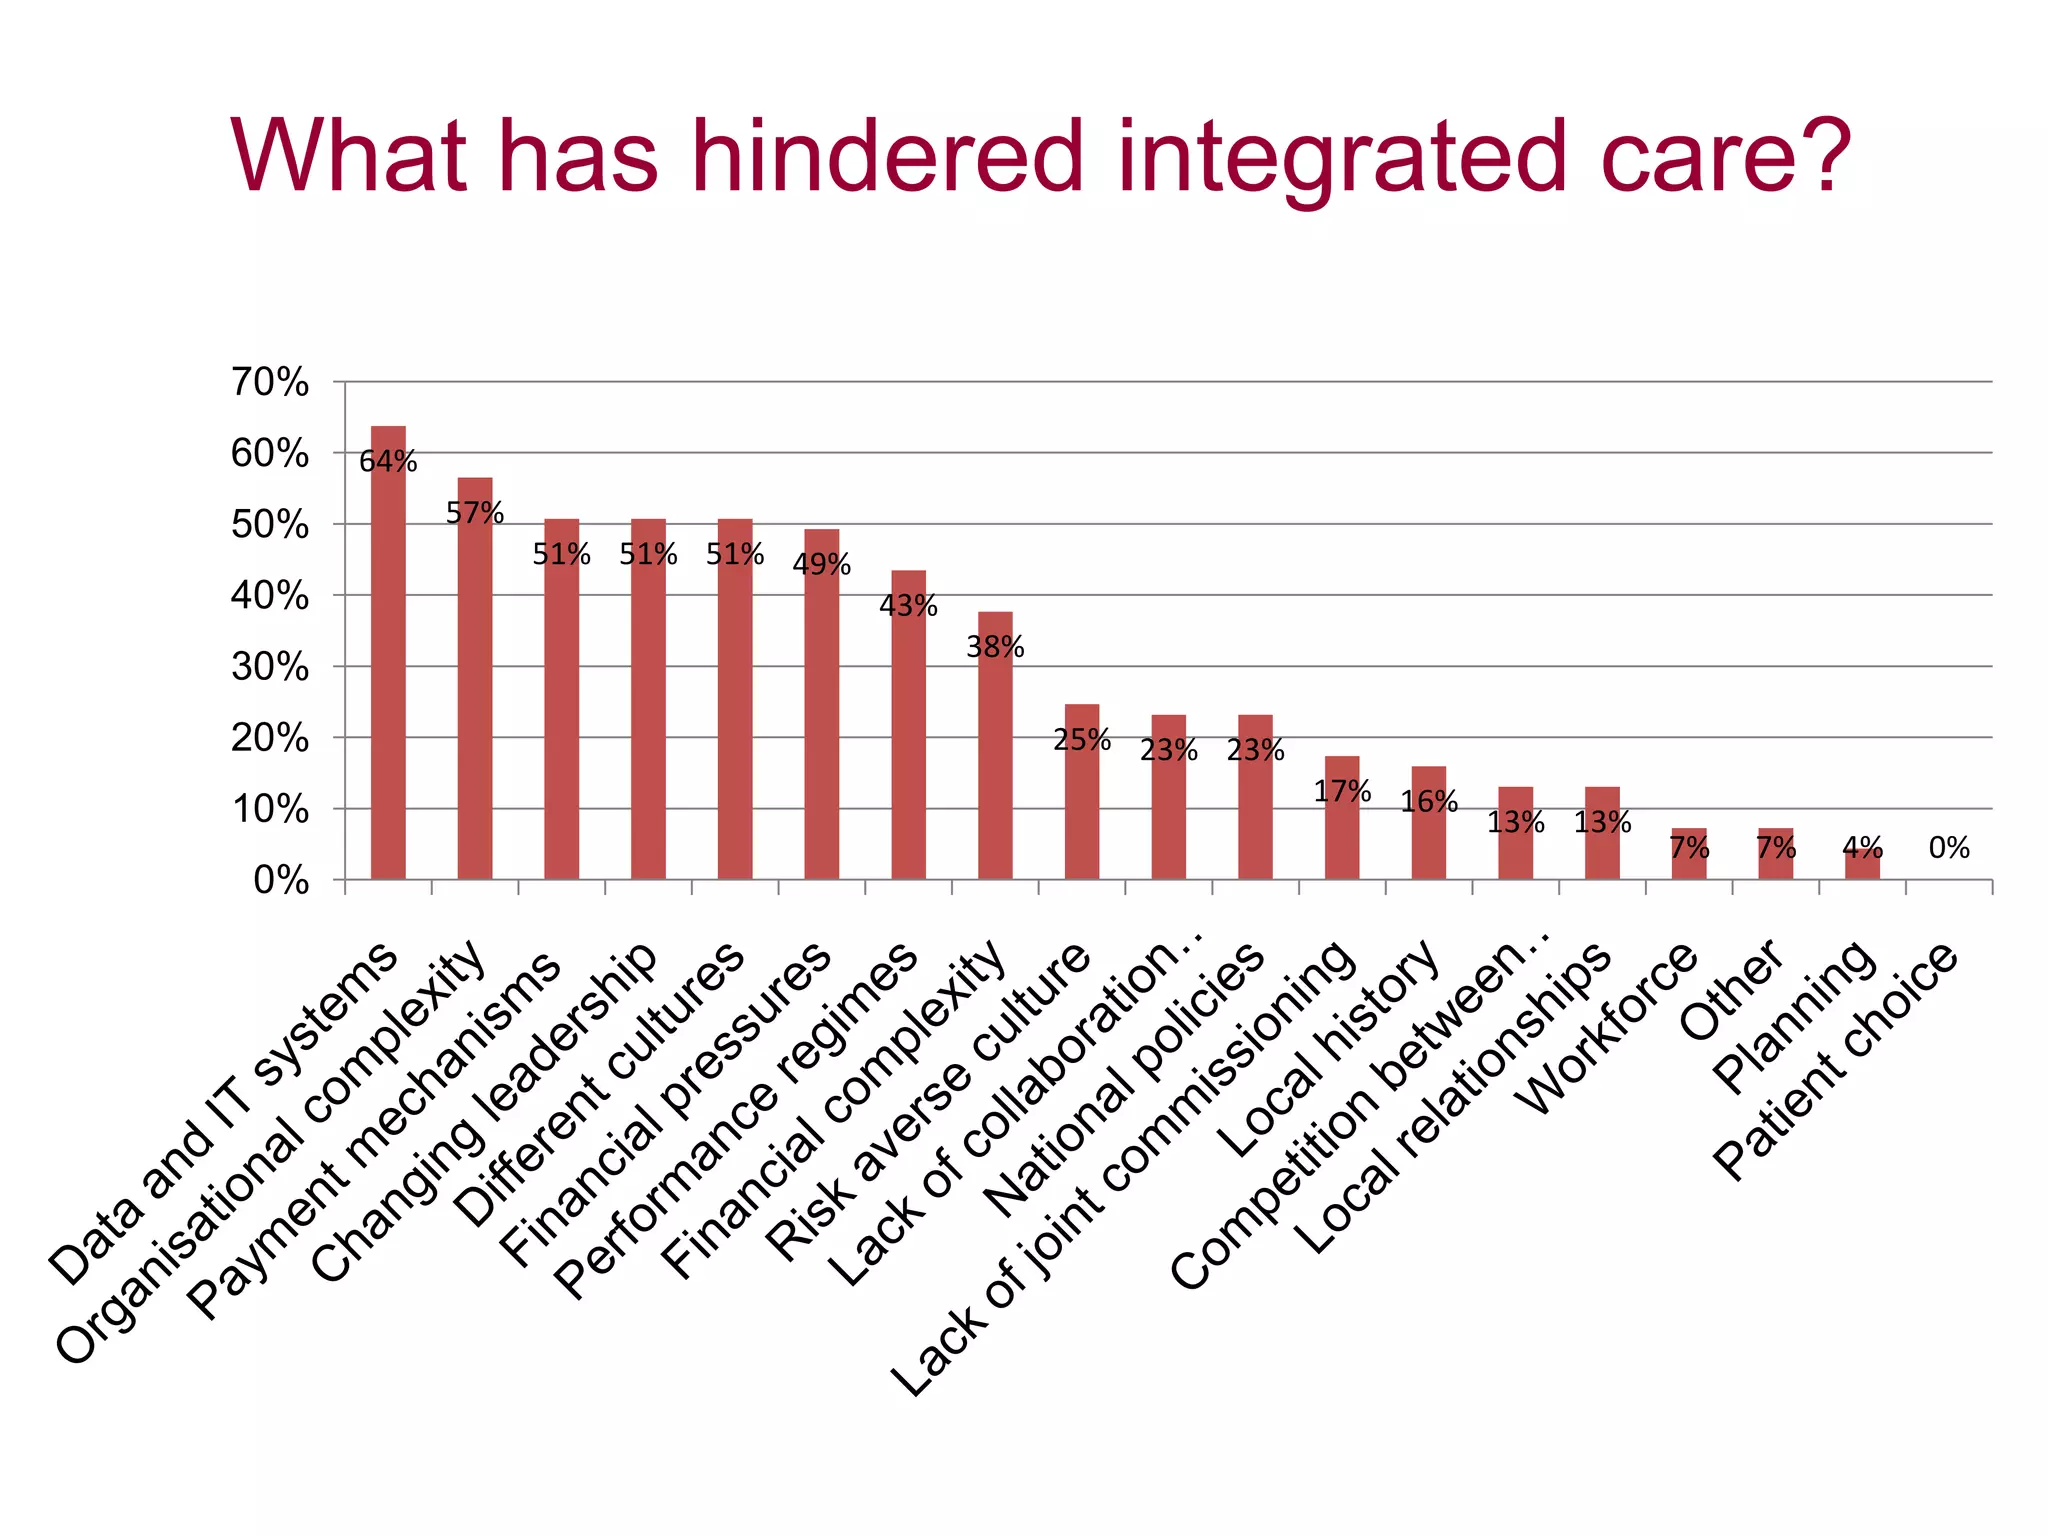
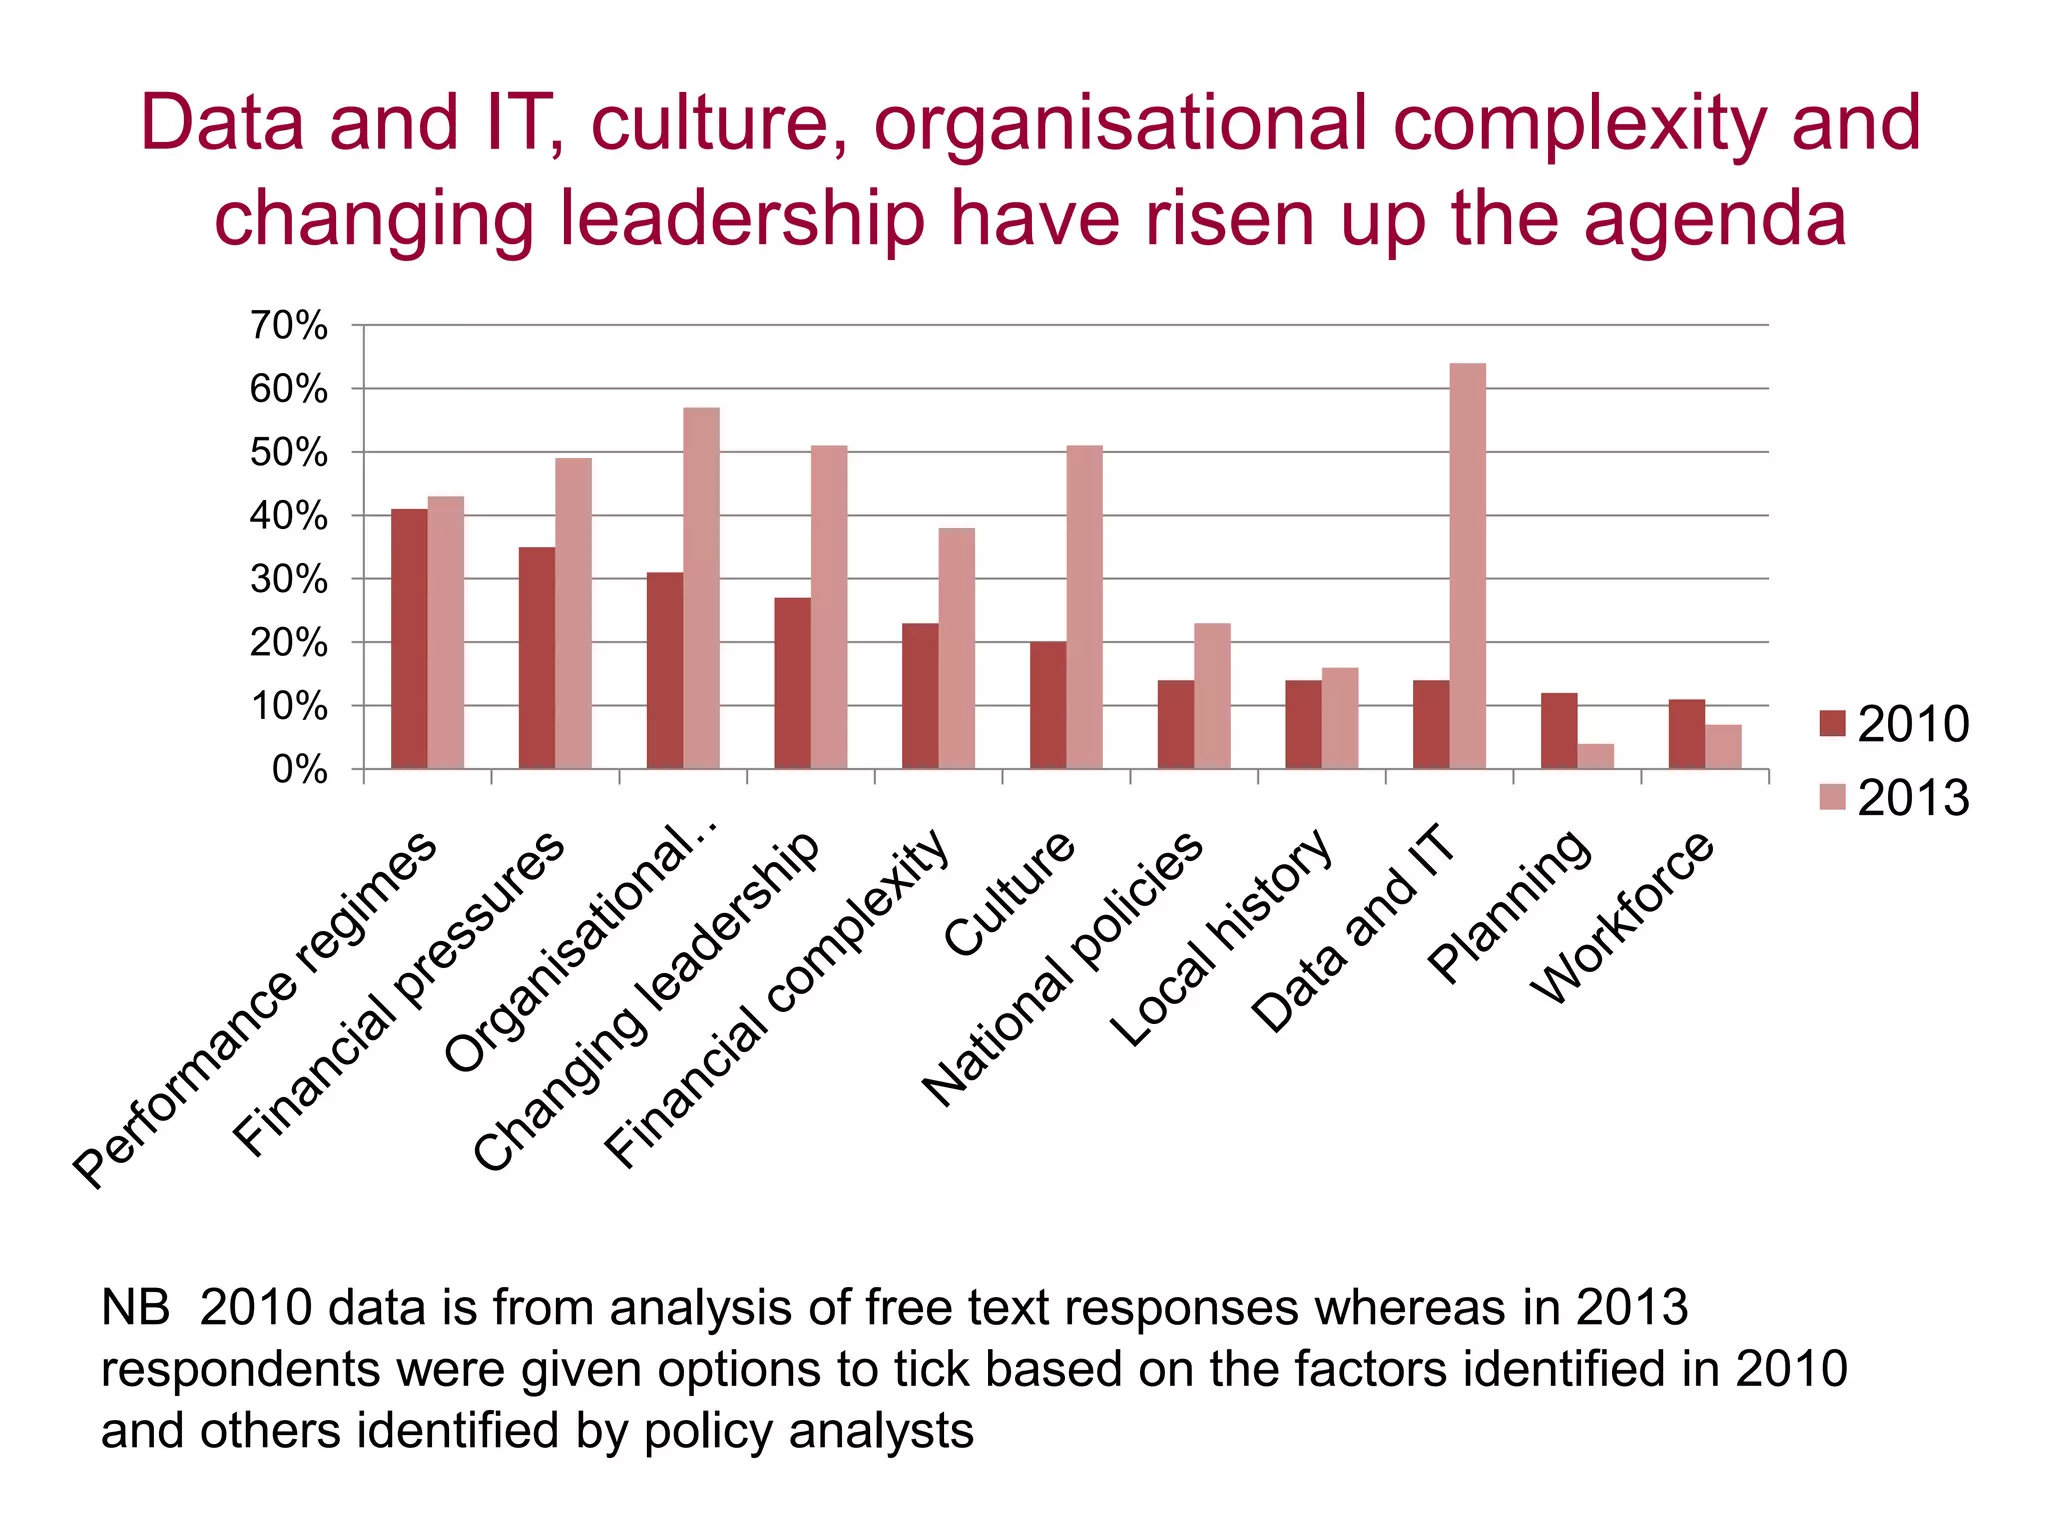
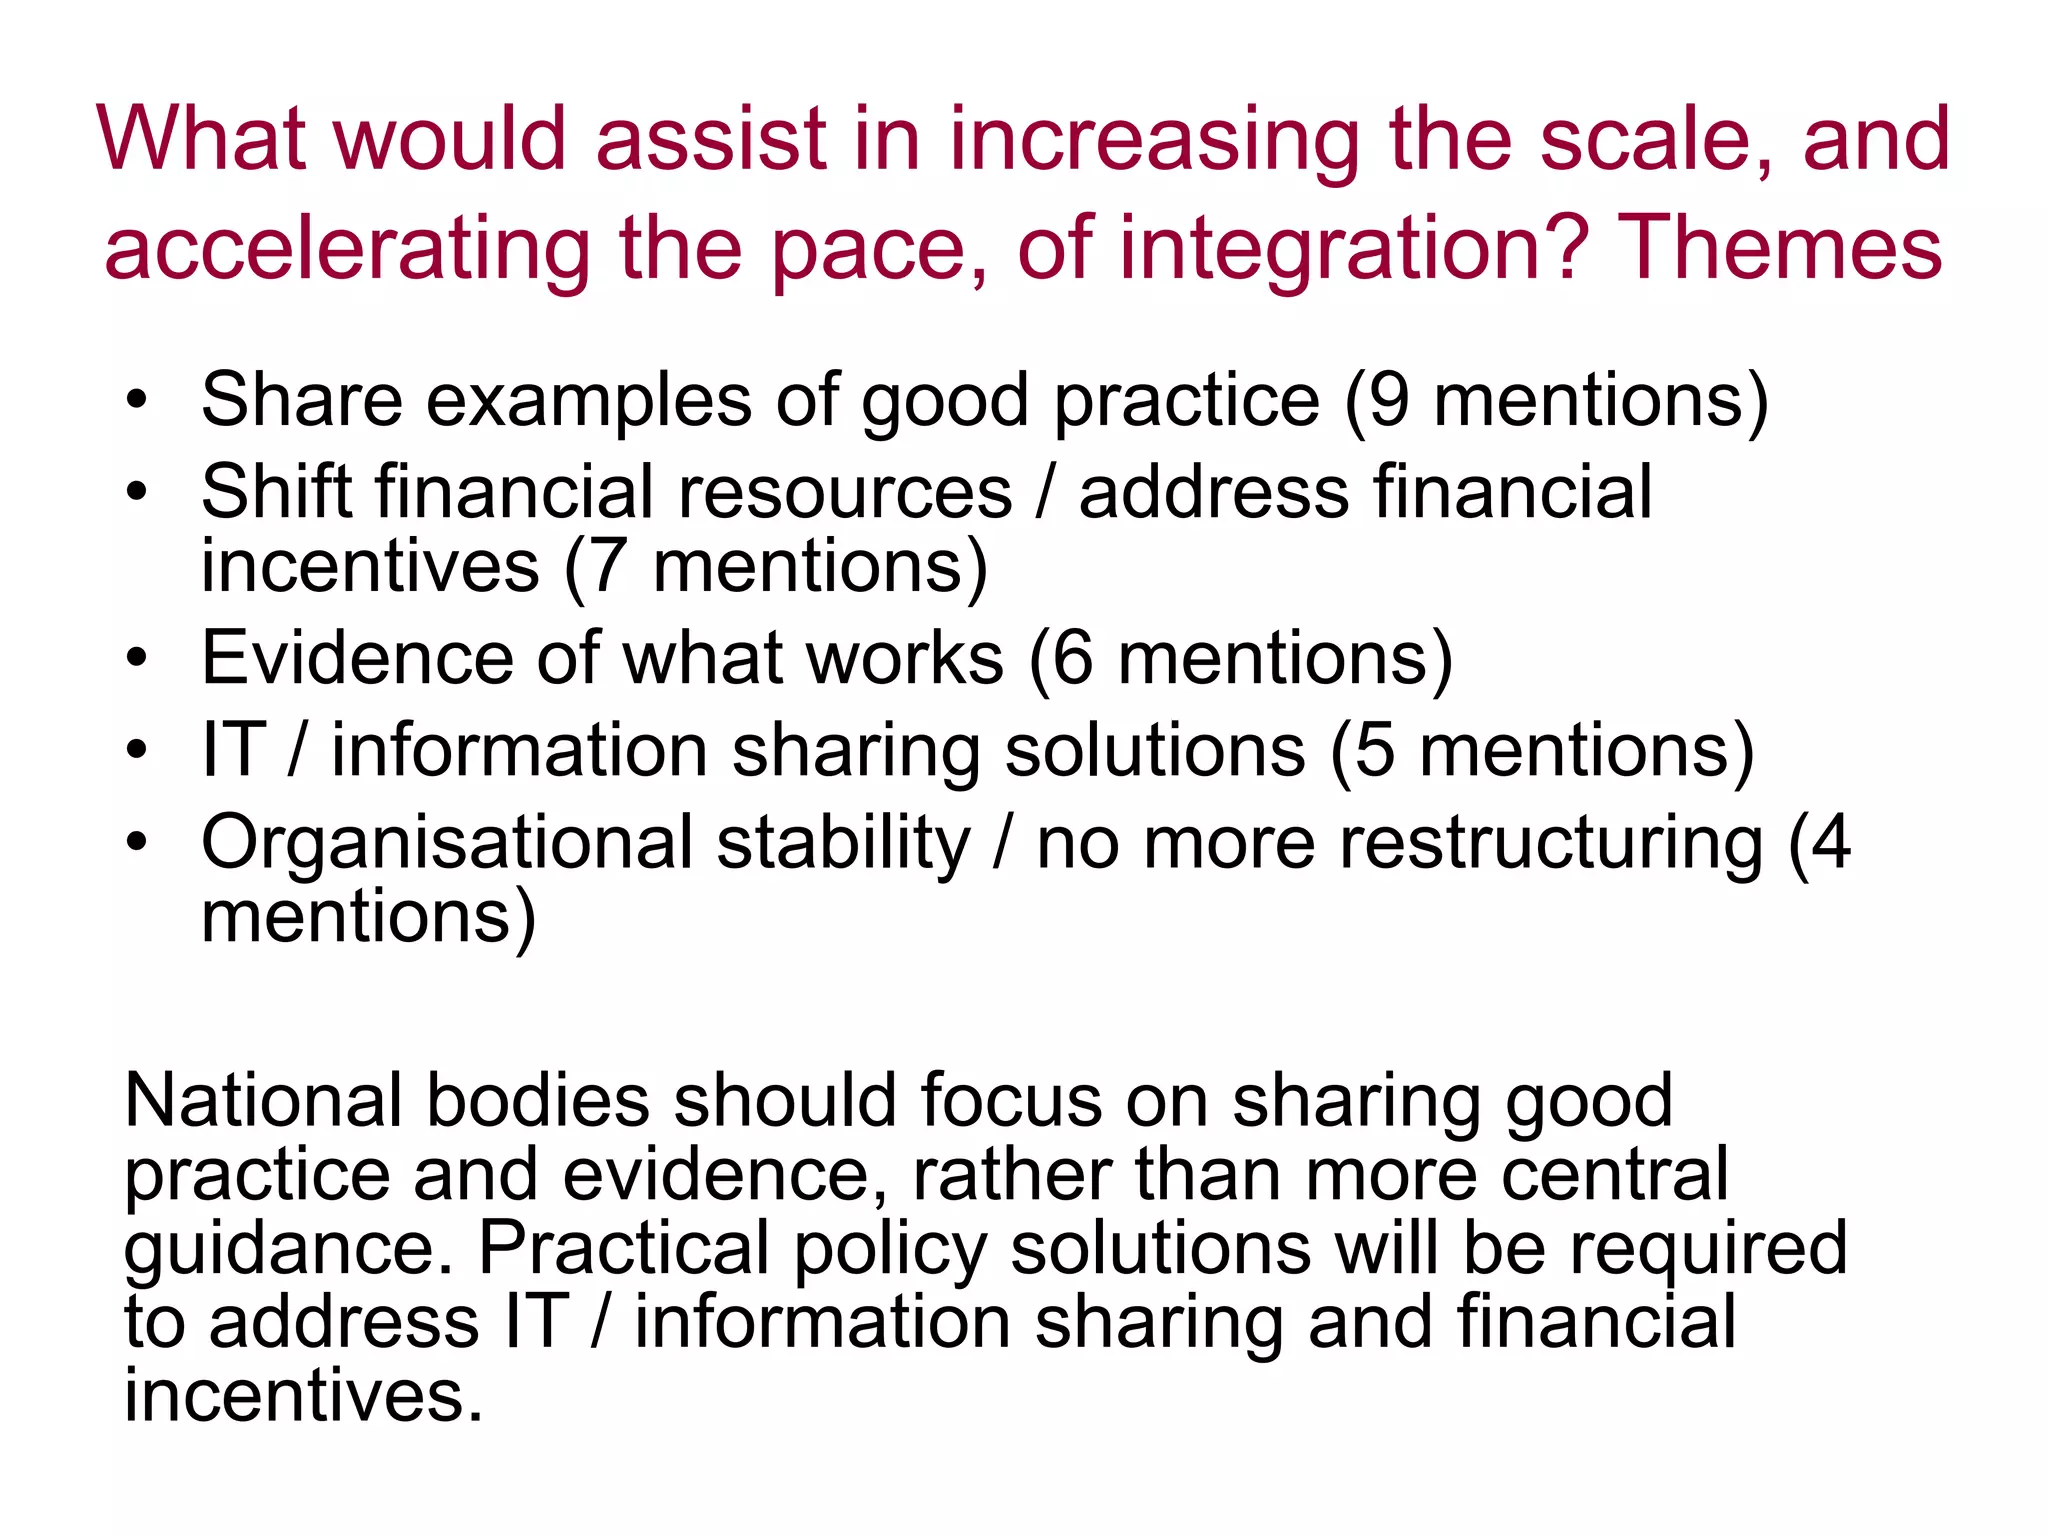
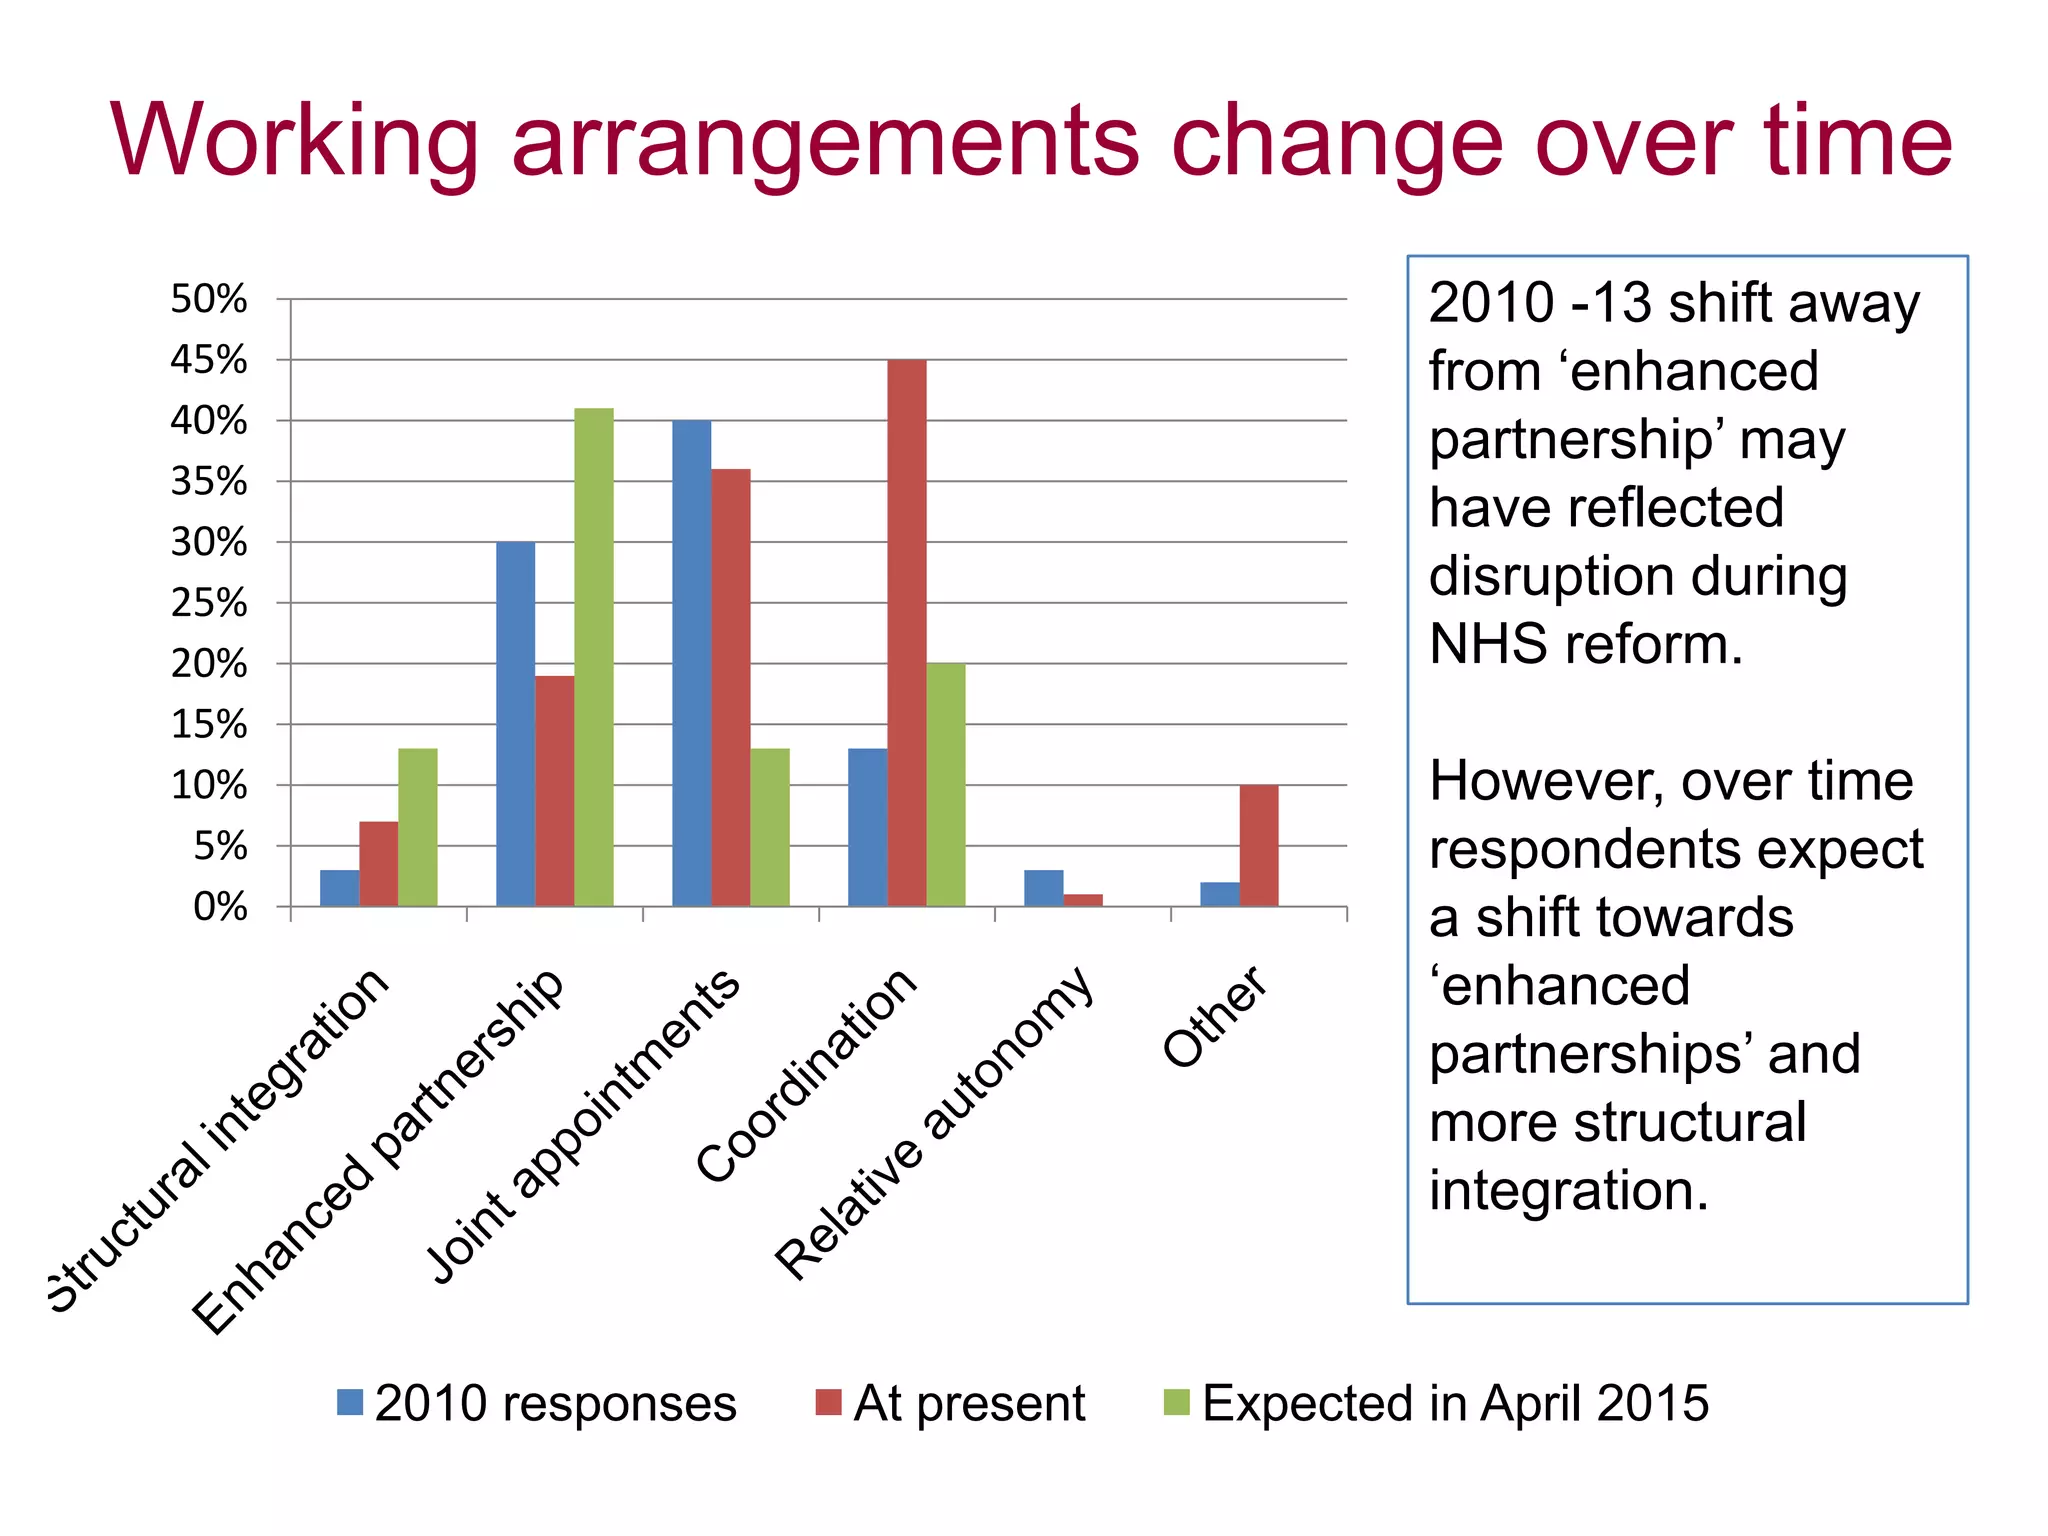
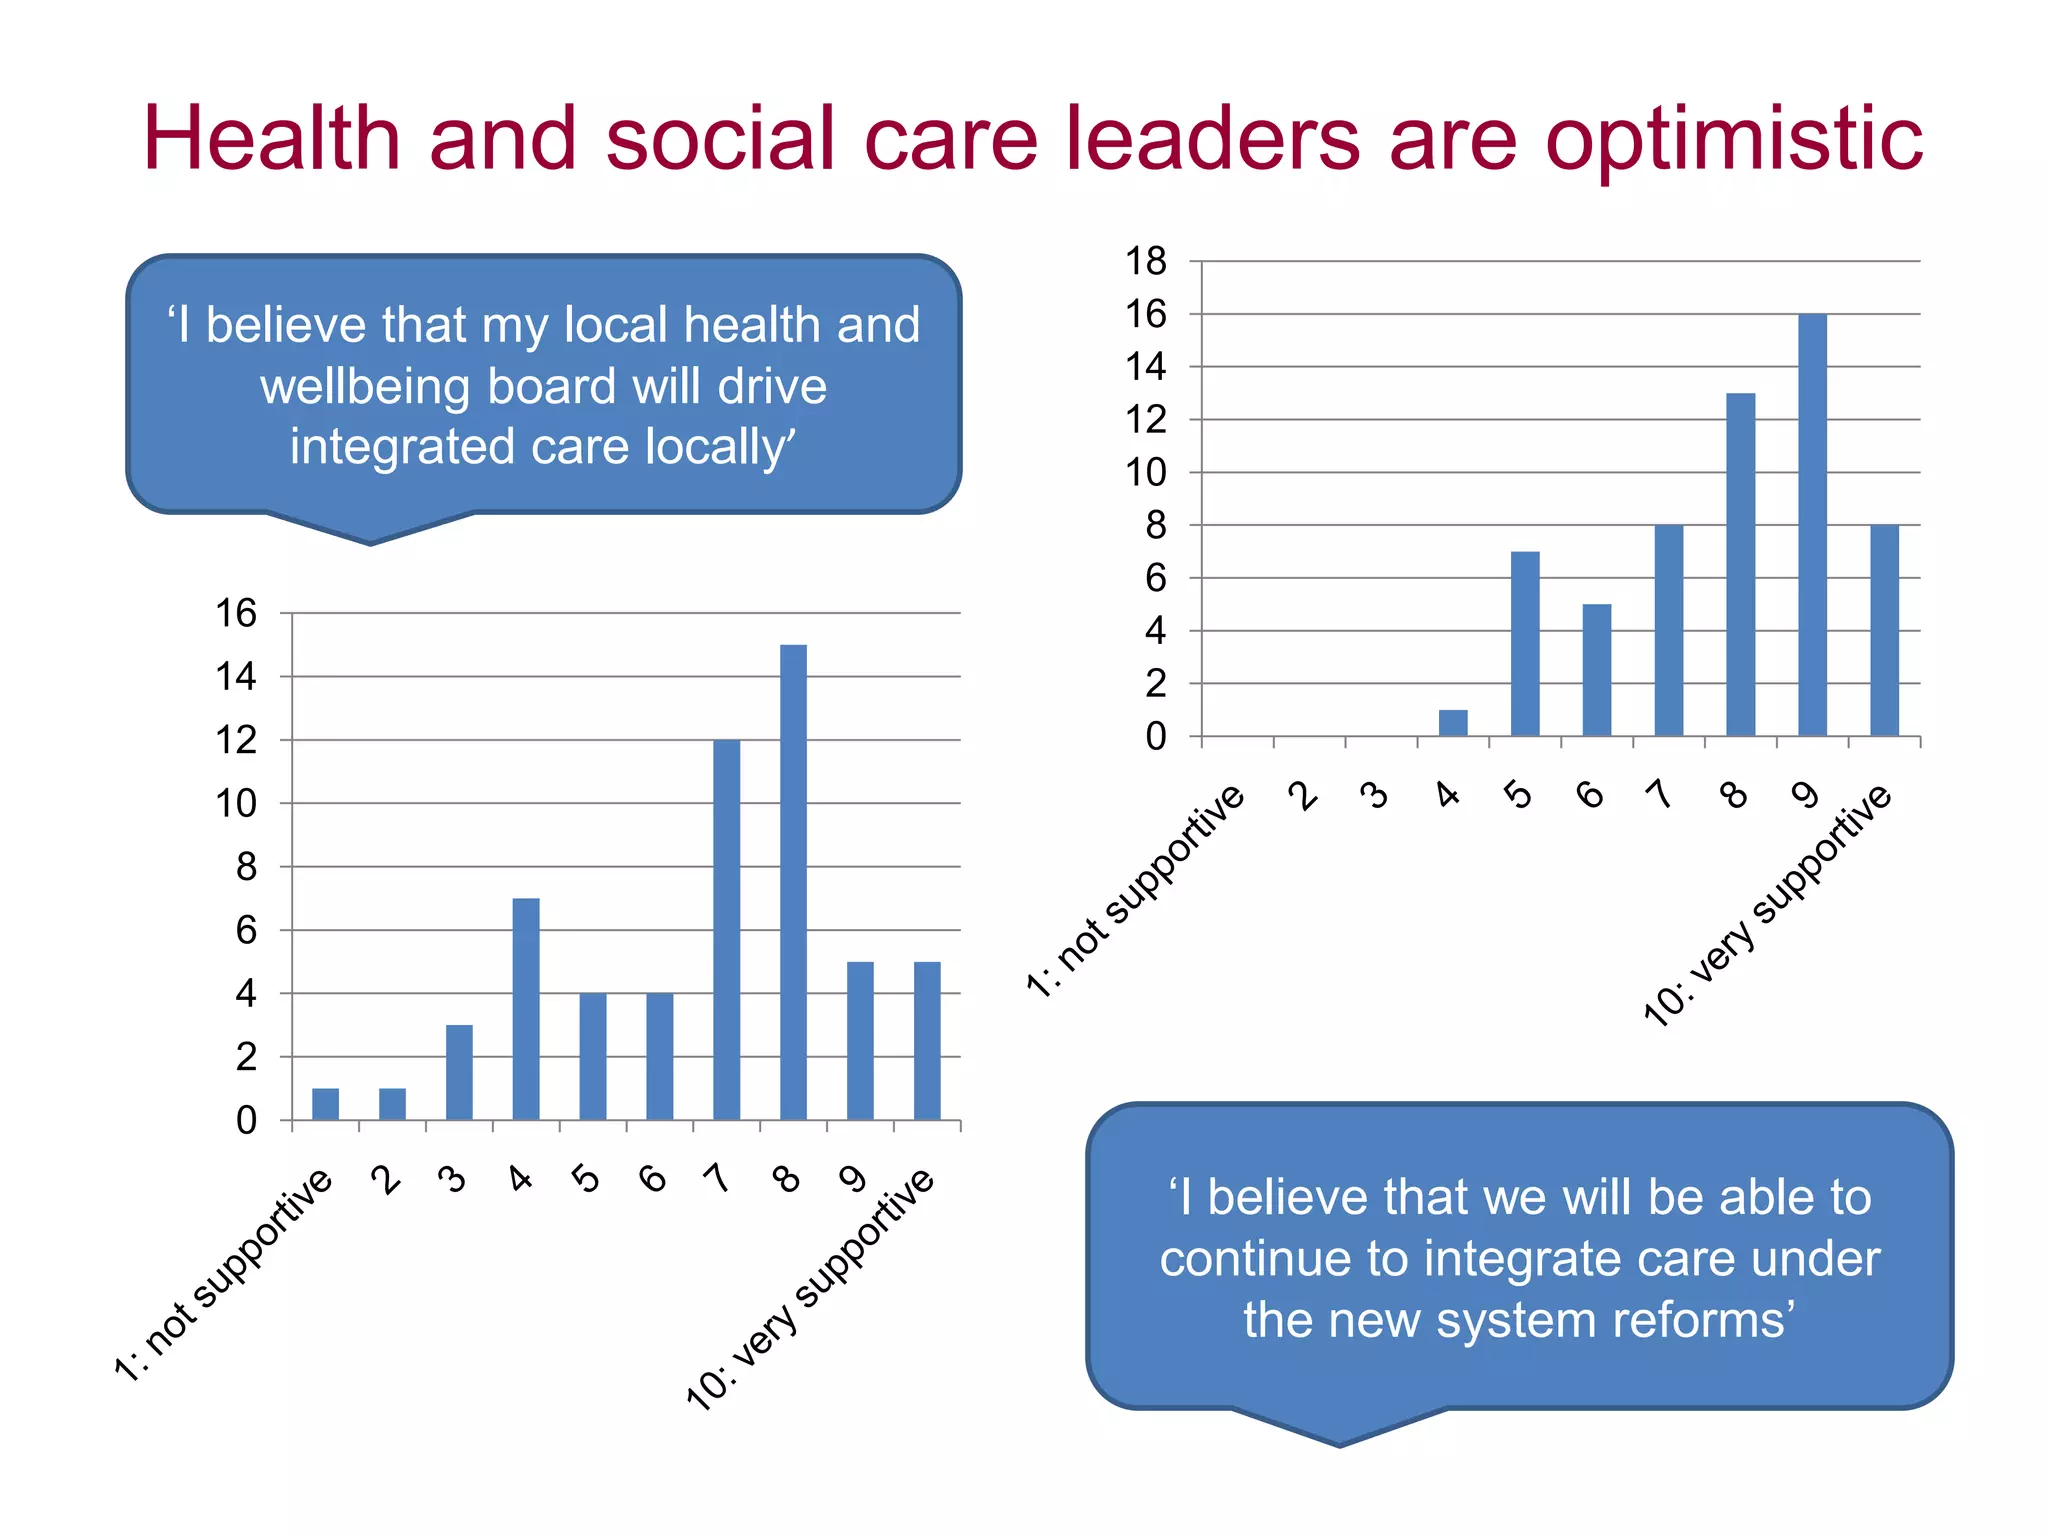
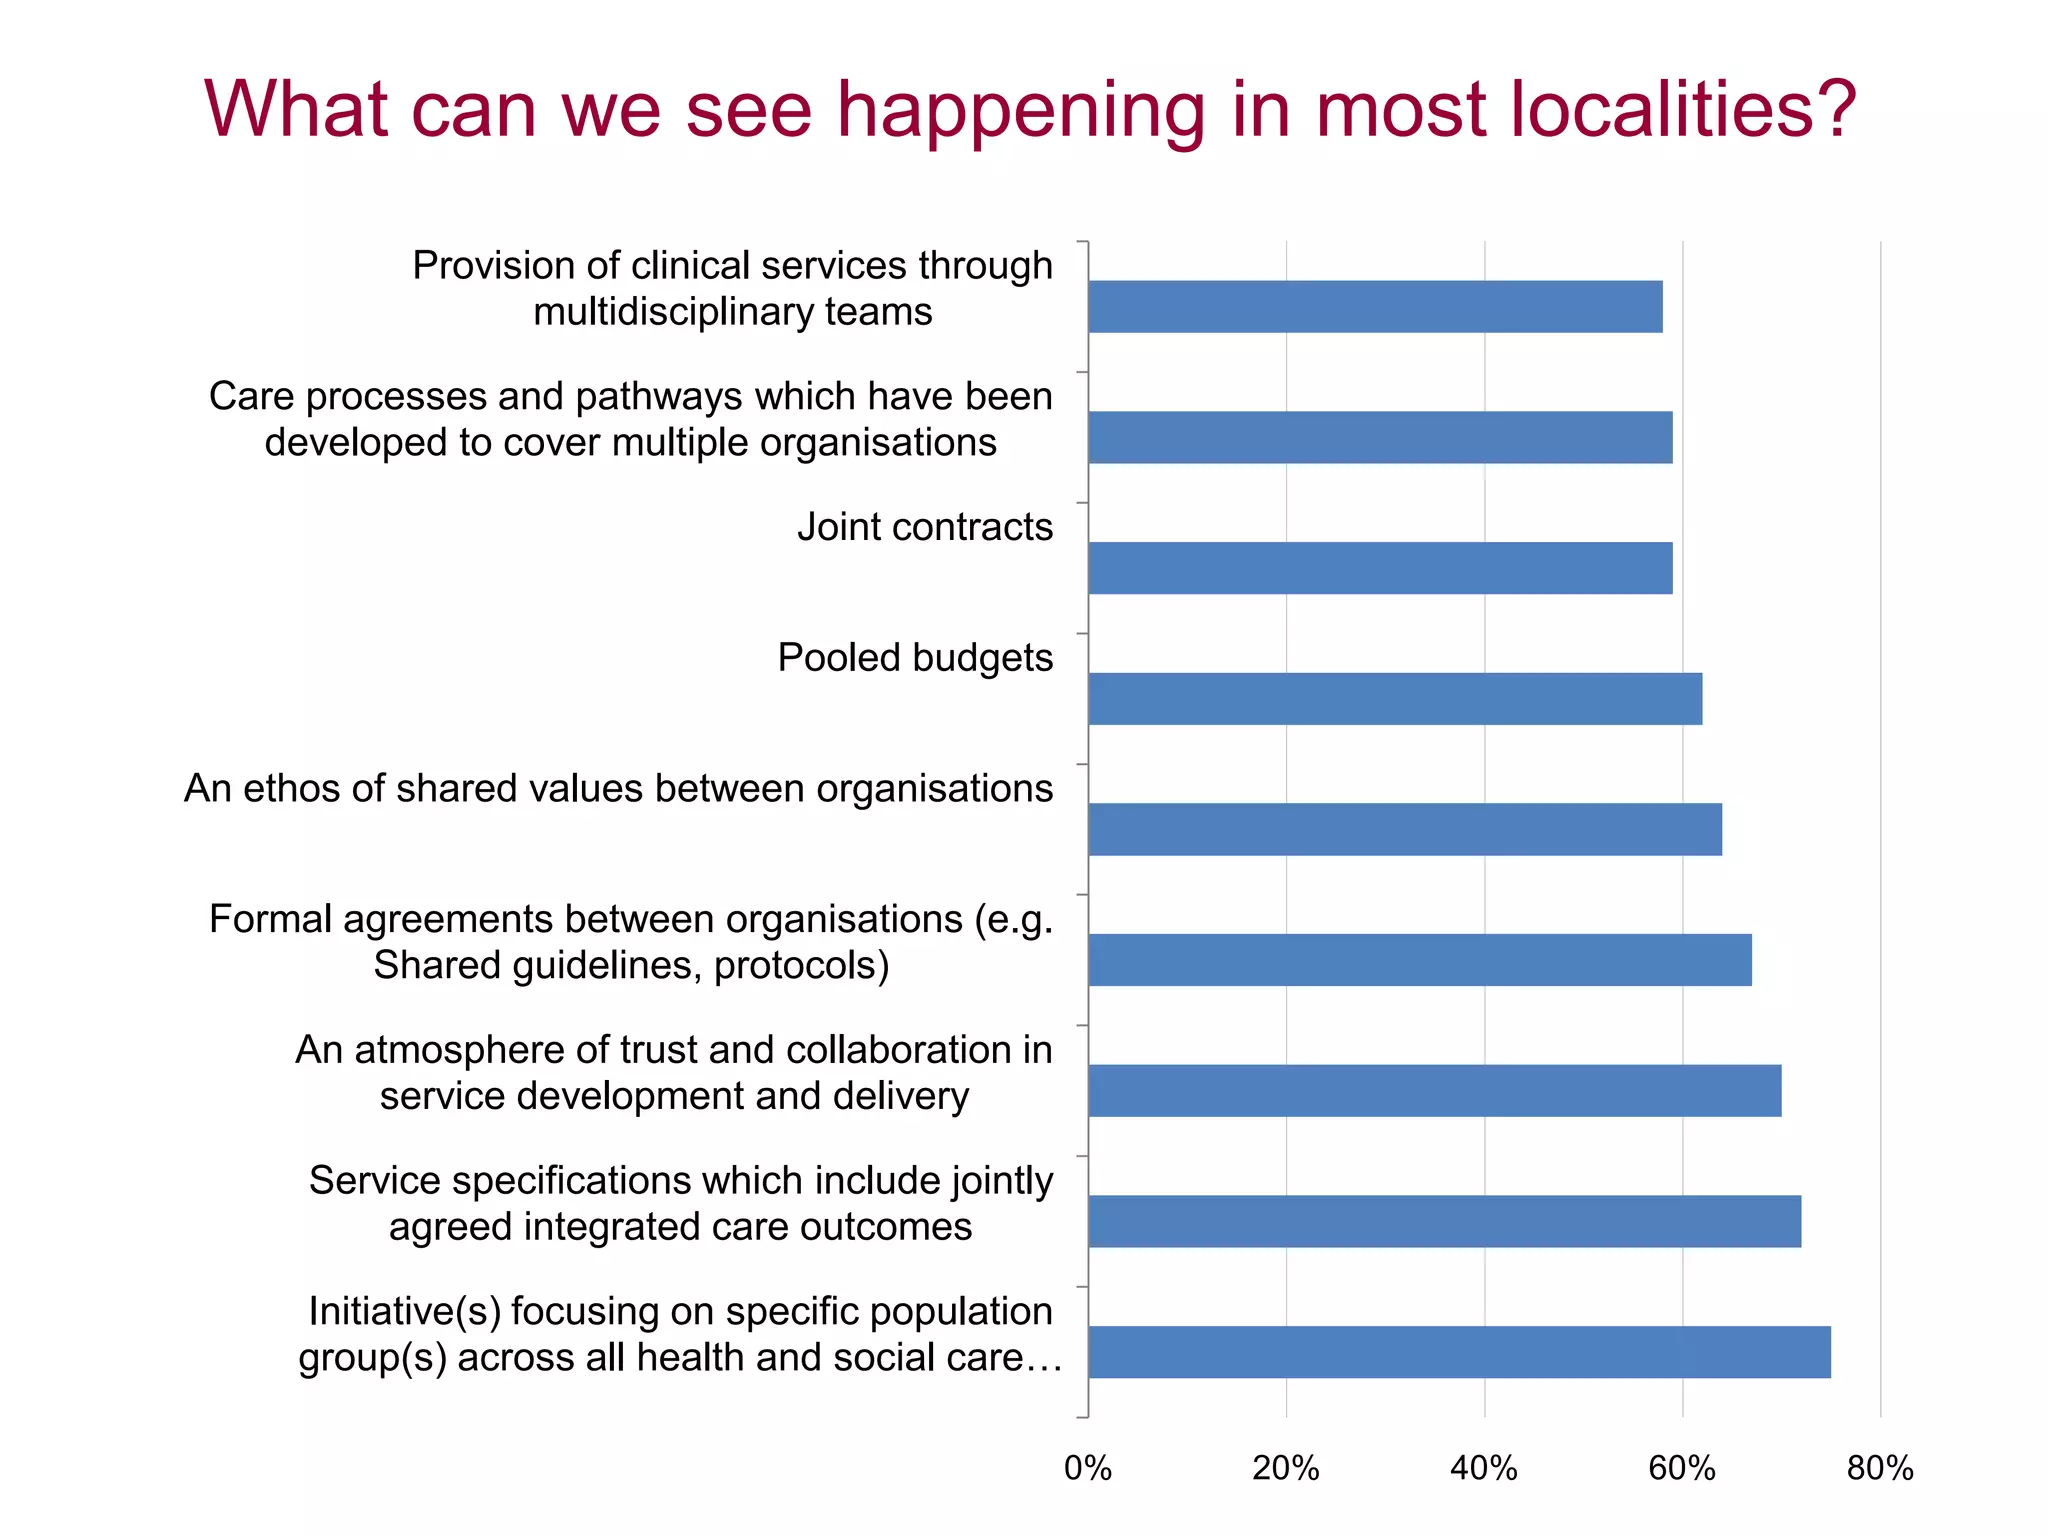
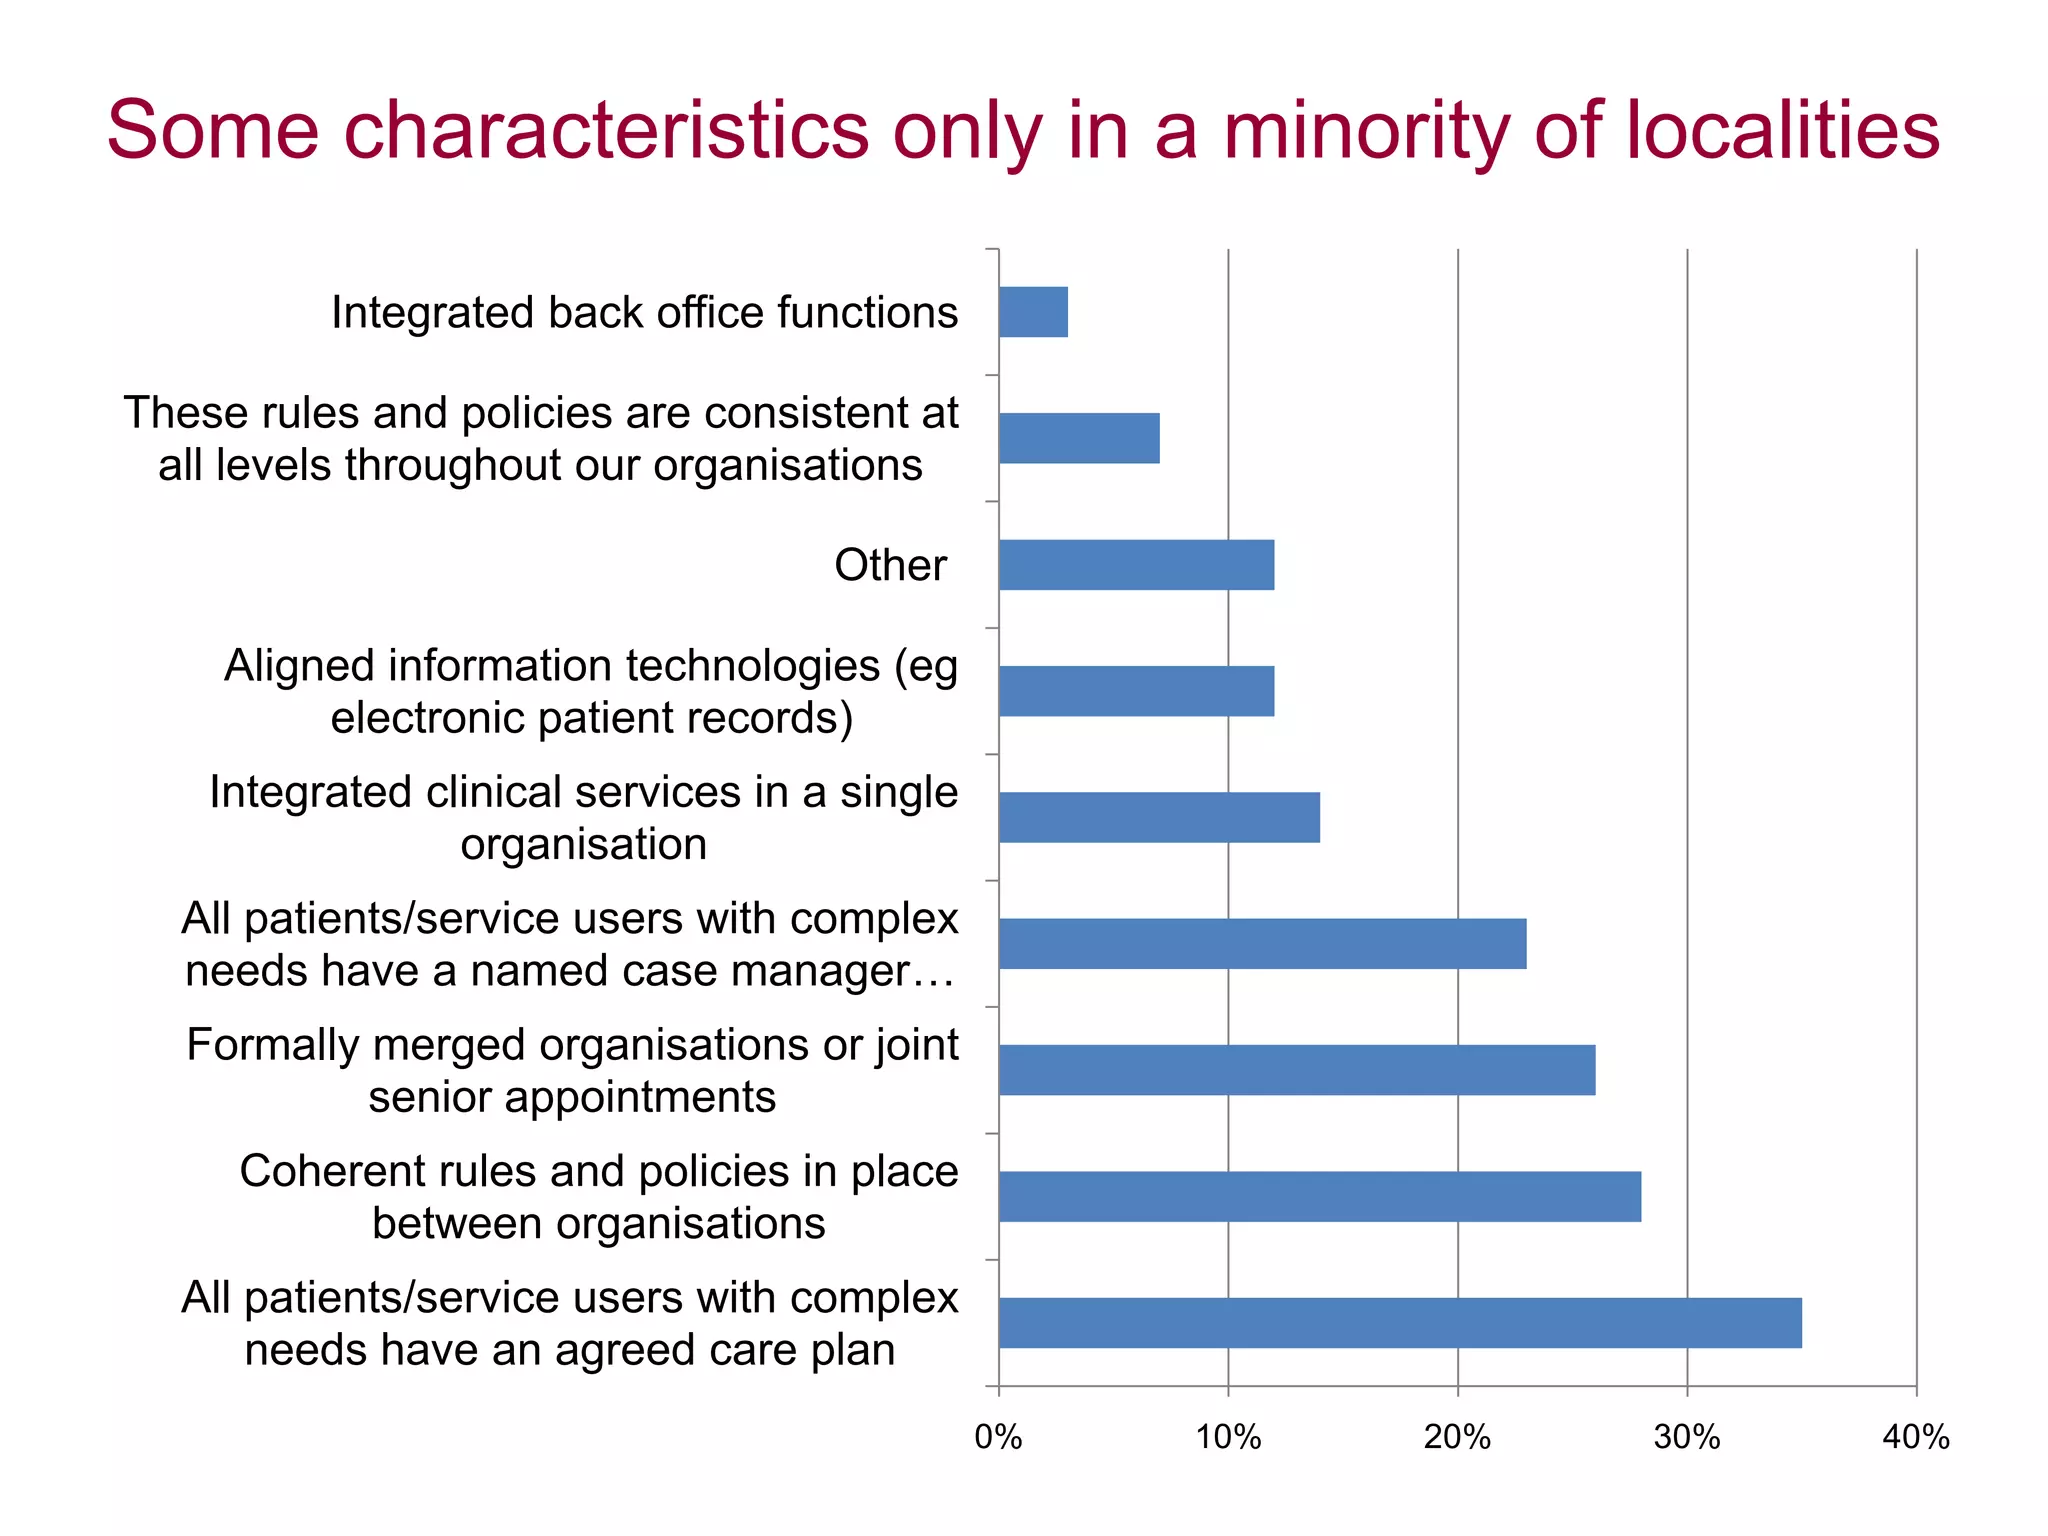
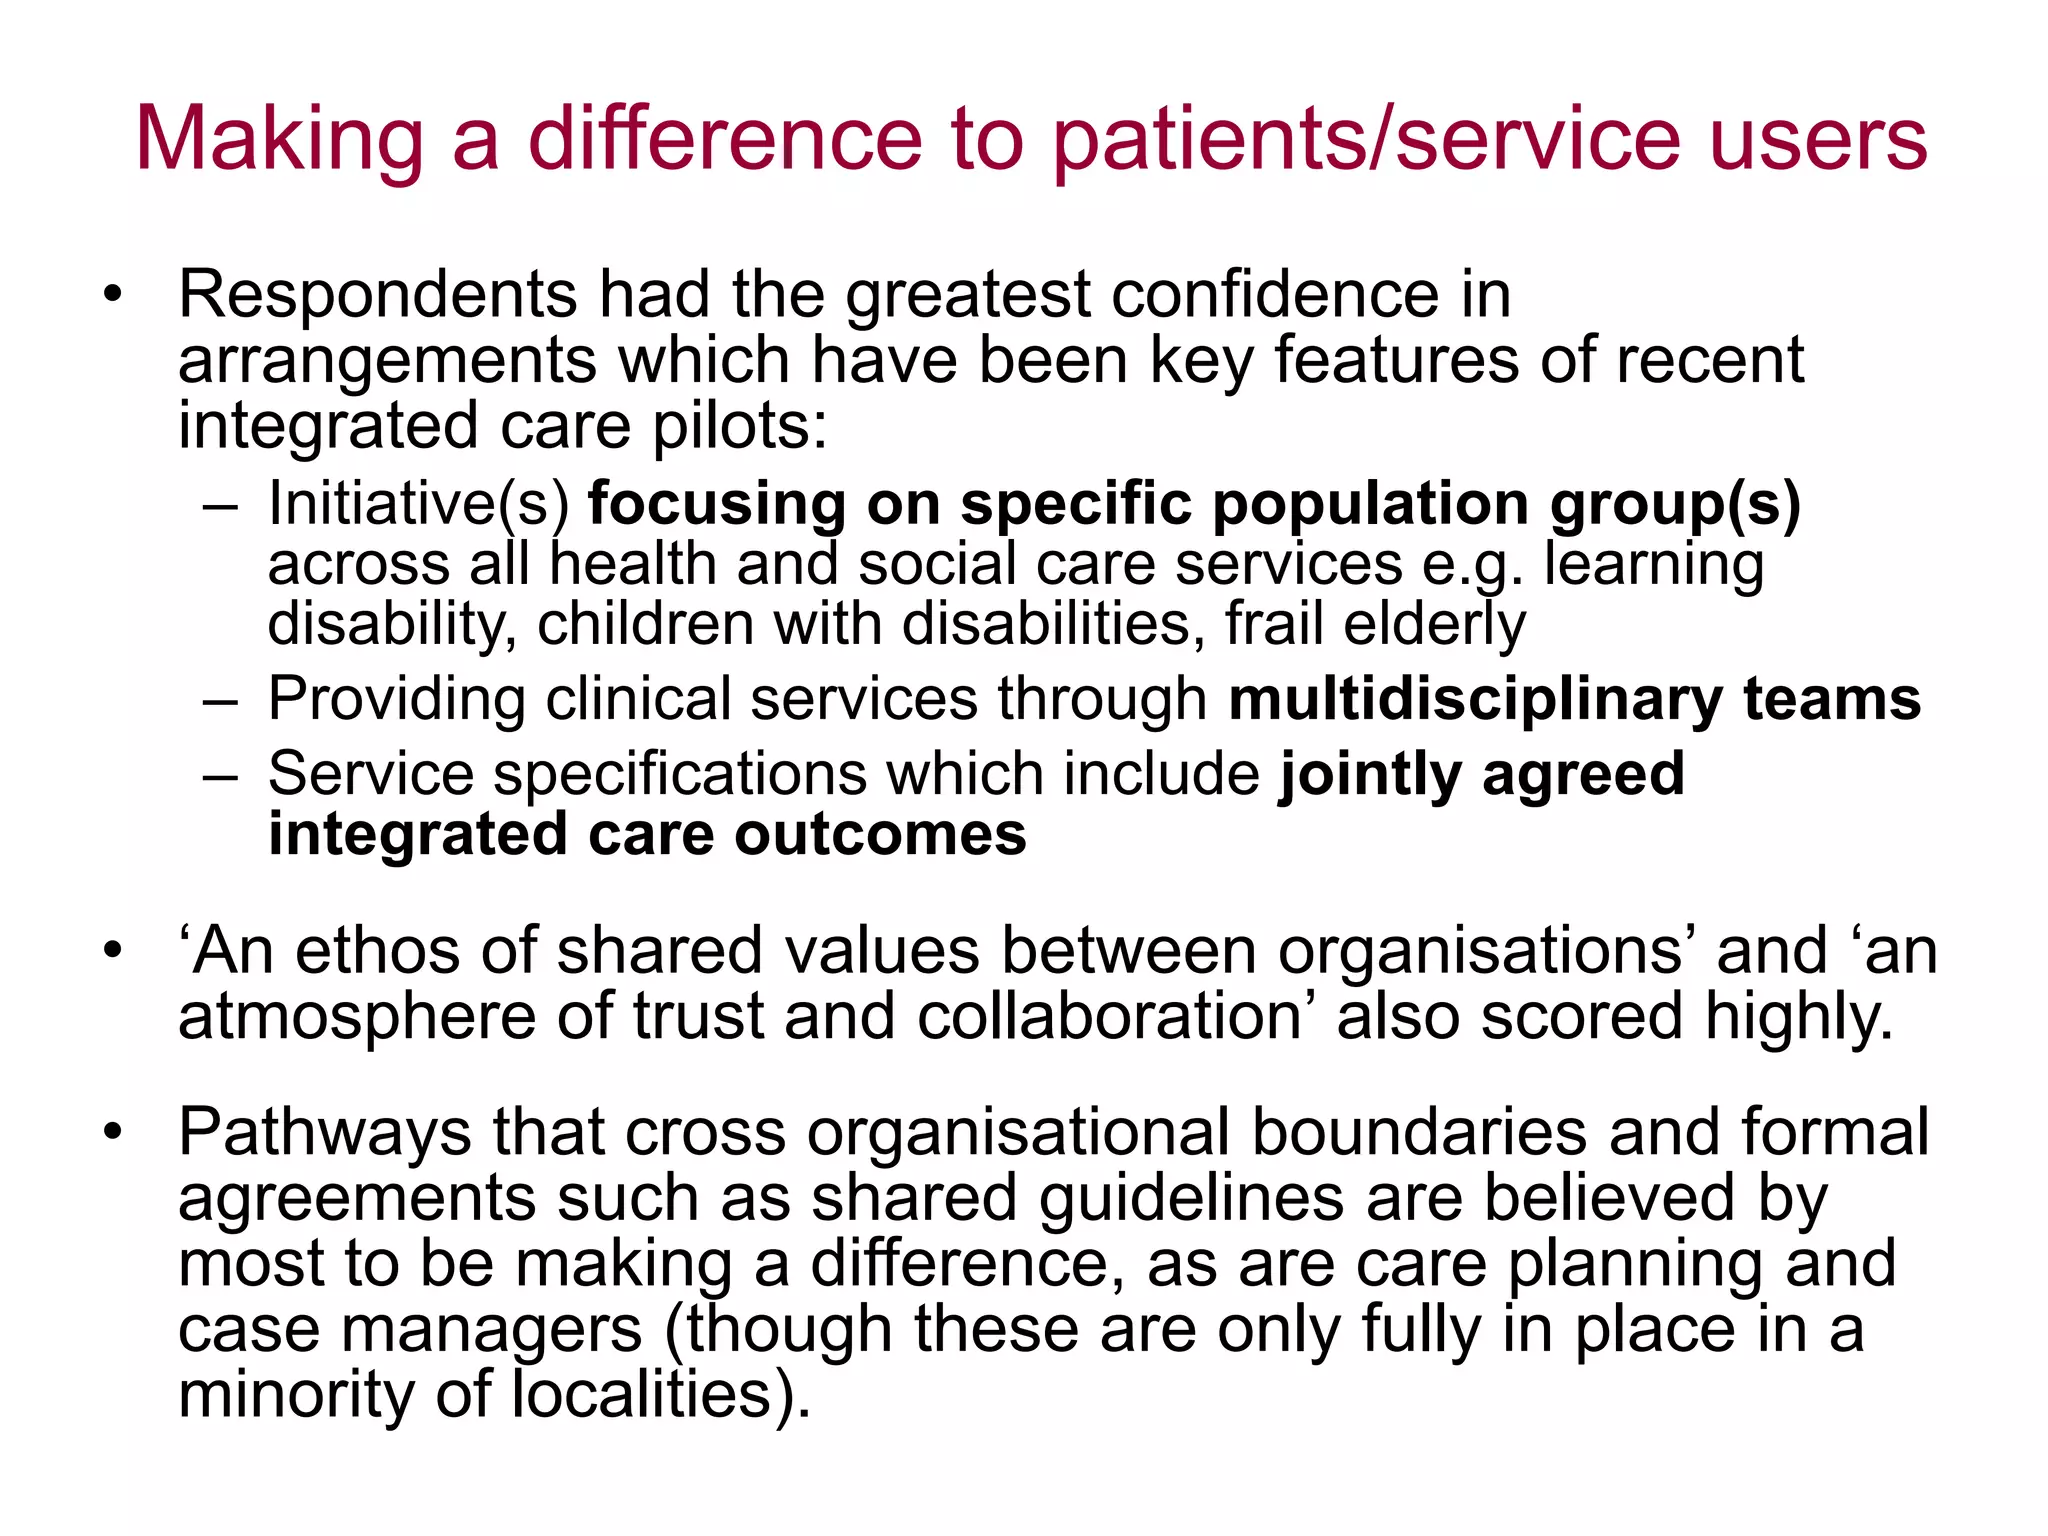
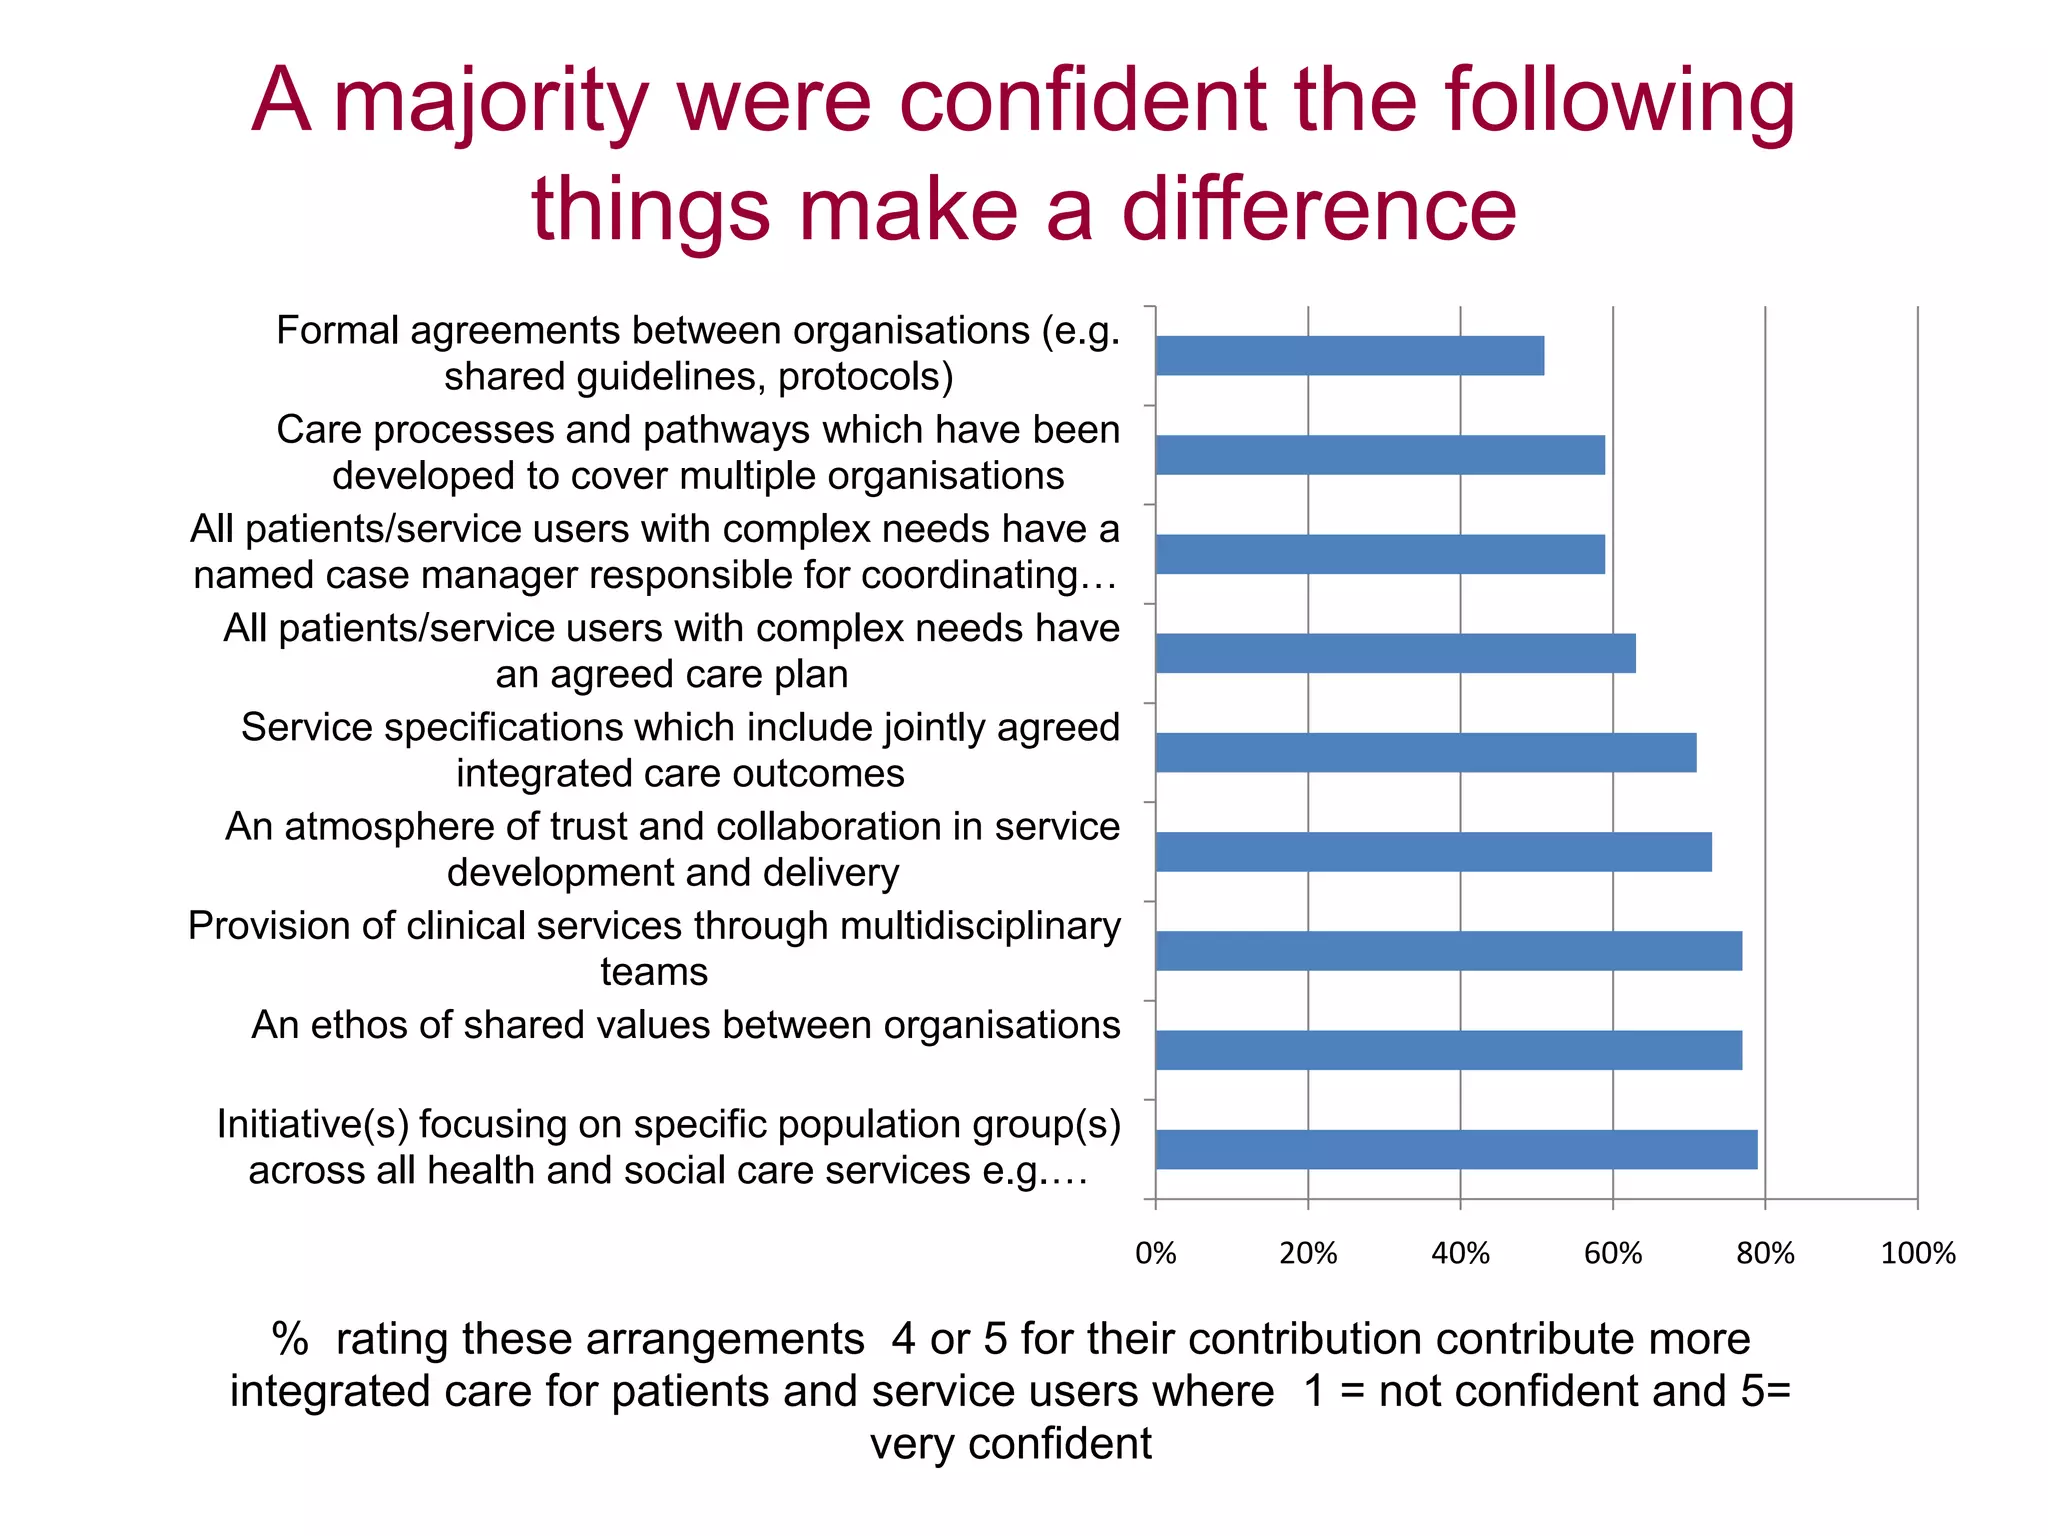
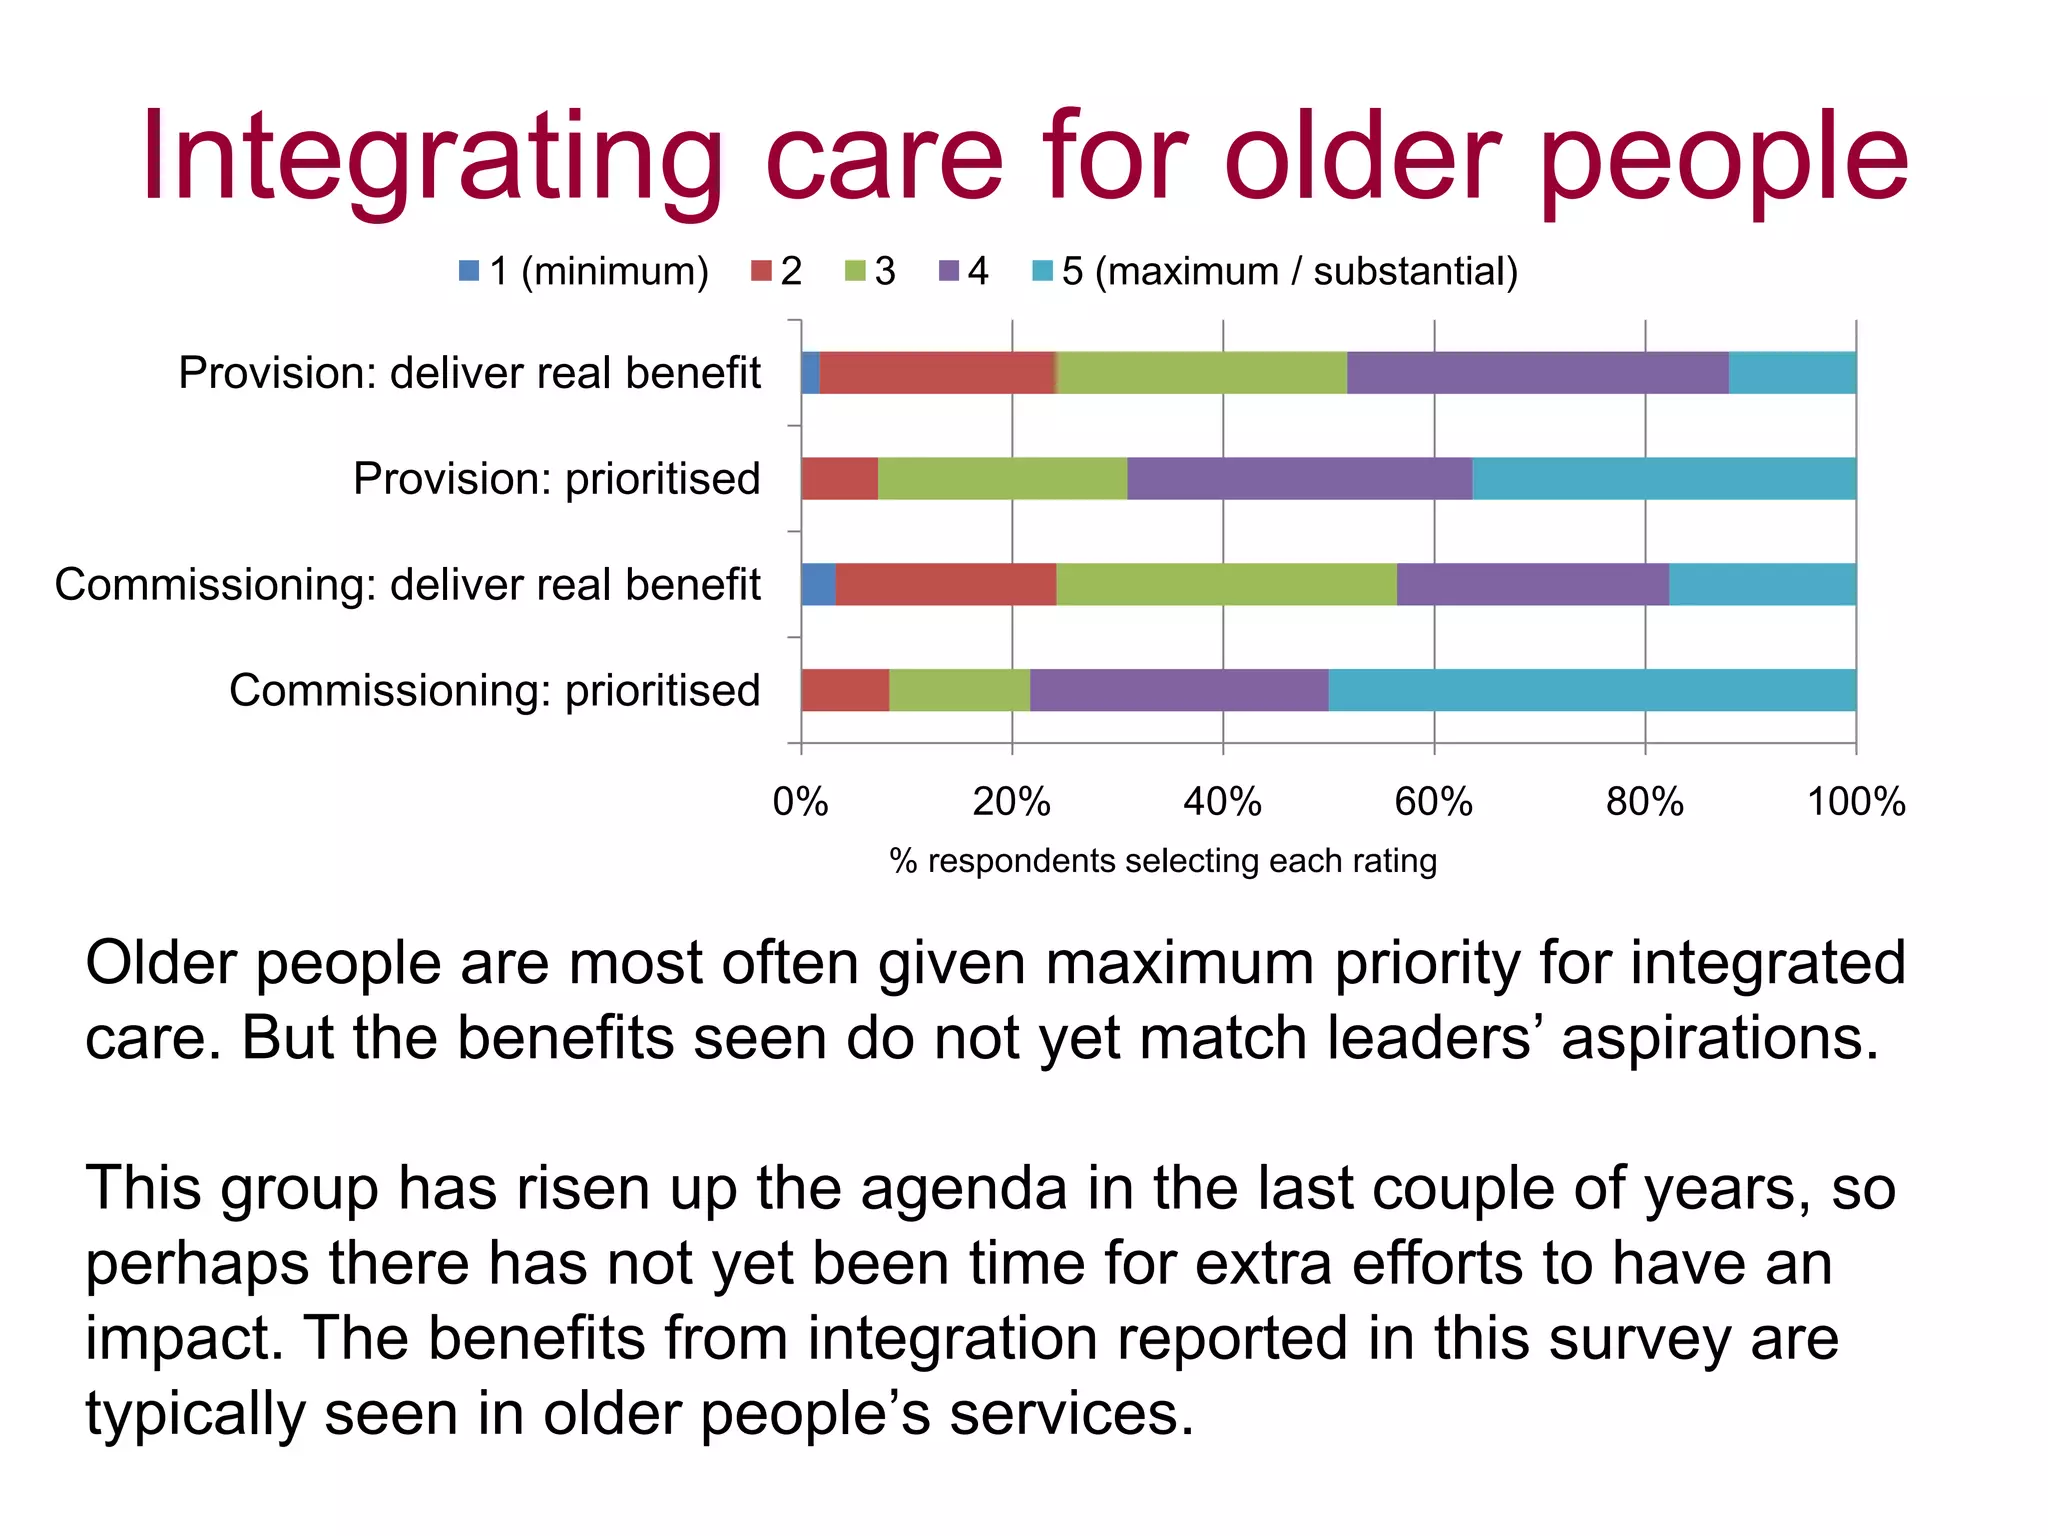
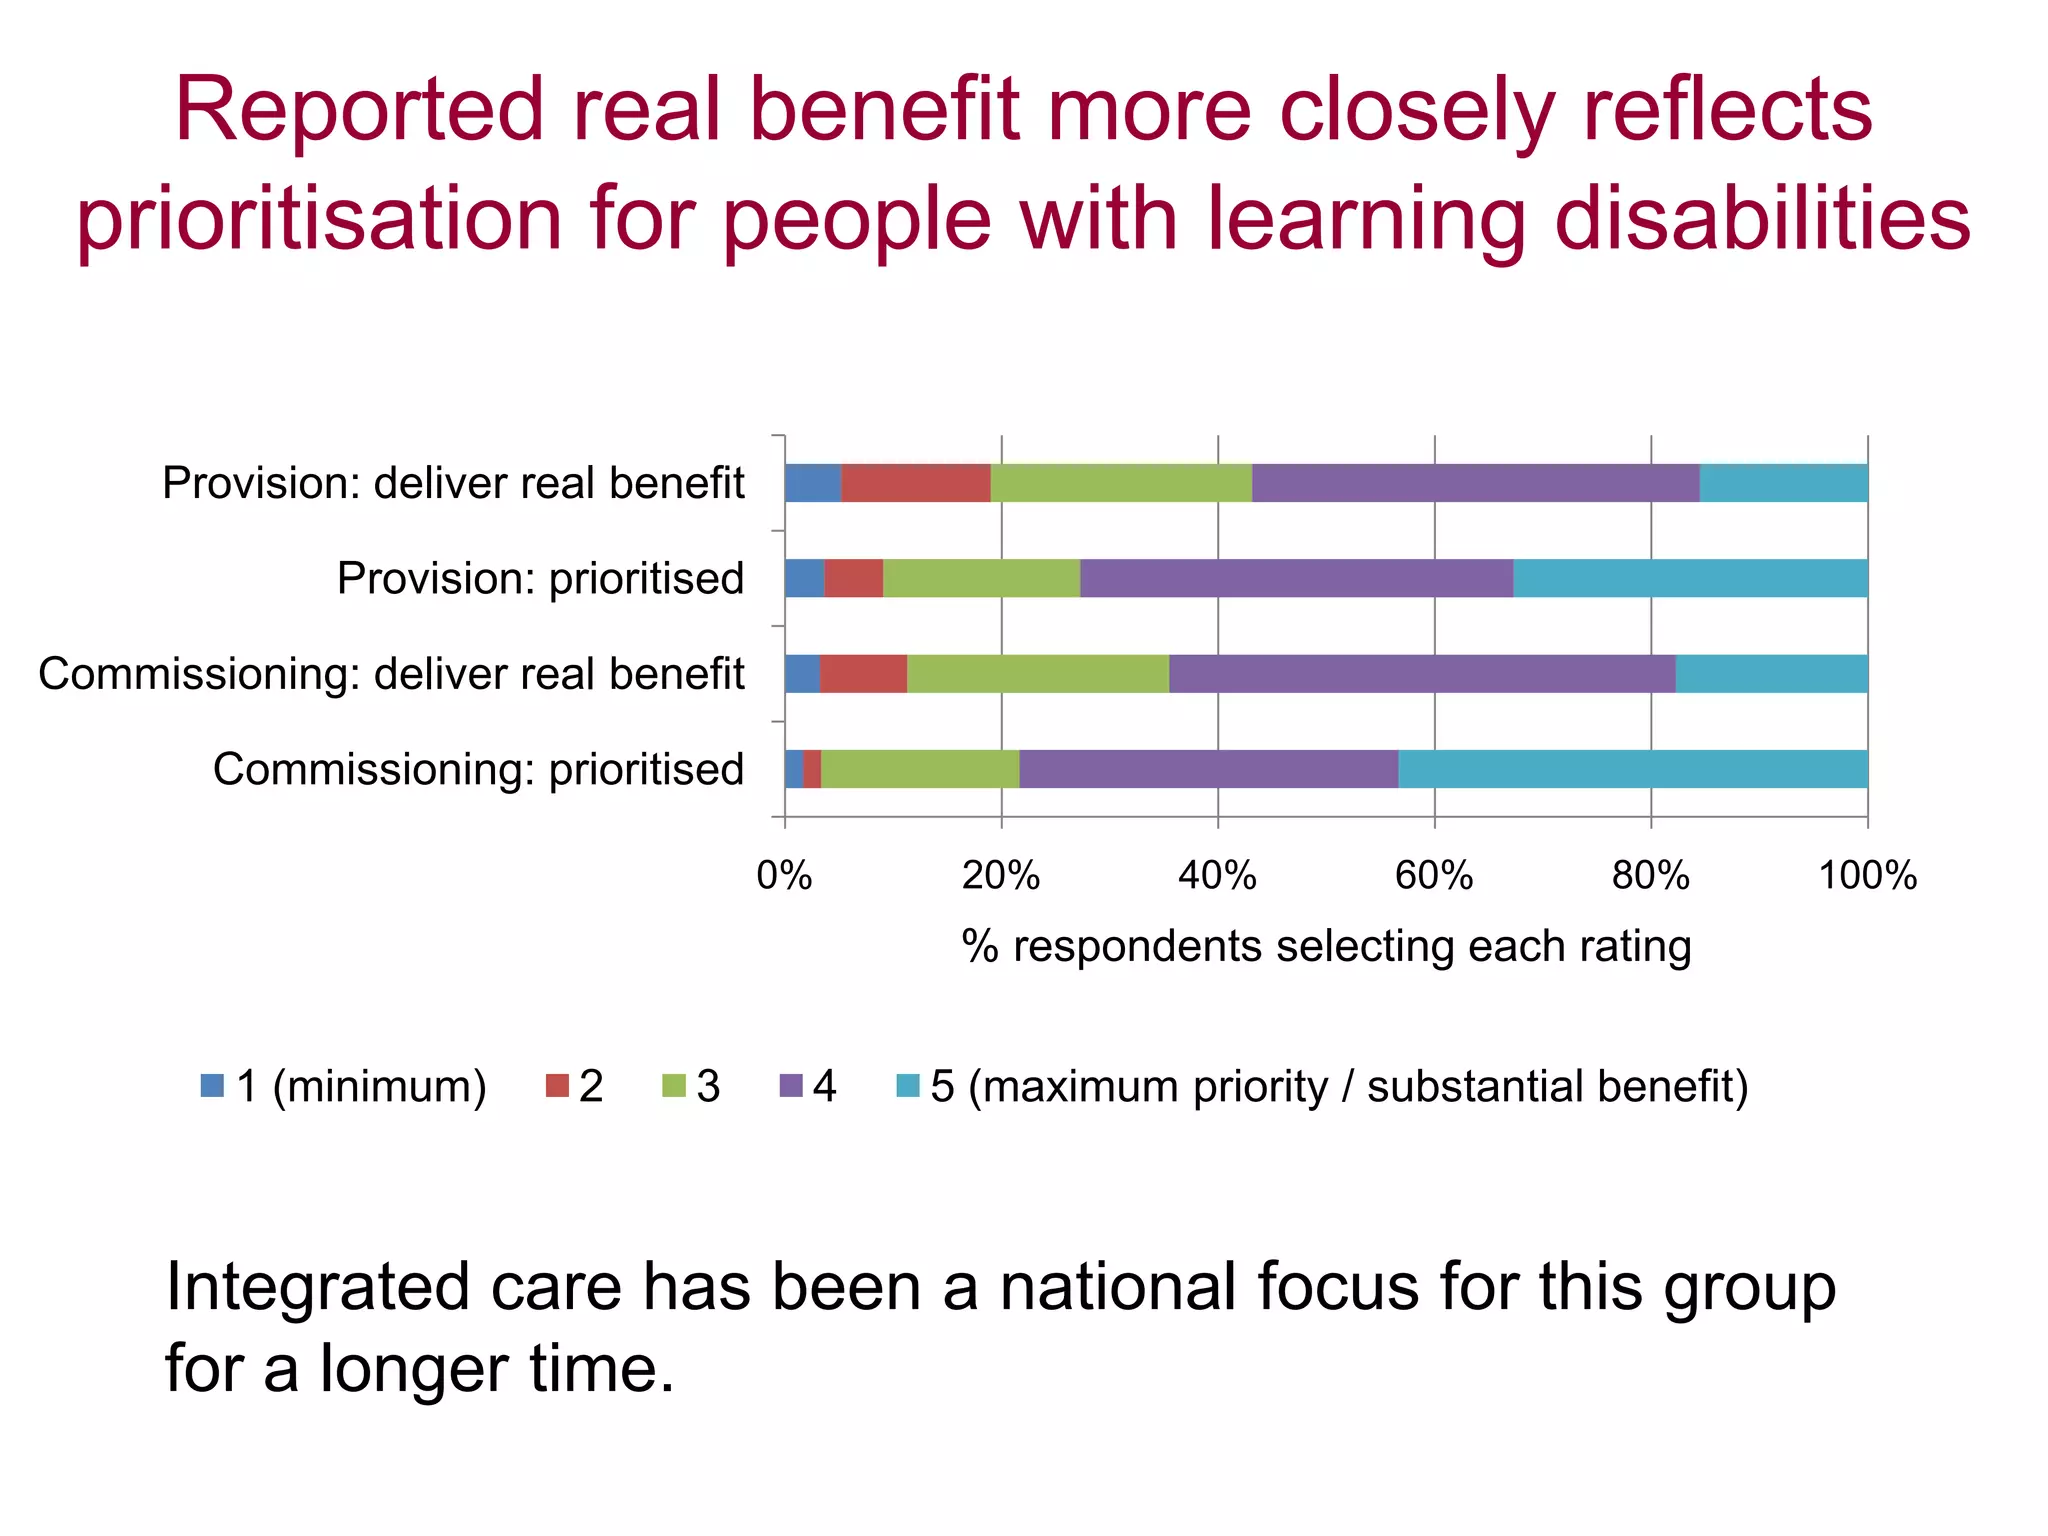
Local leaders report that integrated care can provide benefits like reduced hospital delays and admissions as well as improved patient experiences. Factors helping integration include leadership commitment, joint planning, and collaborative working between organizations. Hindrances include different data/IT systems, organizational complexity, and cultural differences. To accelerate integration, leaders emphasize sharing good practices, addressing financial barriers, and providing practical IT solutions rather than more central guidance. While reform disrupted some joint working, leaders remain optimistic about continuing integration under the new structures. Population-focused initiatives, multidisciplinary teams, and shared values are seen as most effective for patients. Efforts prioritize older adults, those with learning disabilities, and mental health patients. Aspirations for 2015 include further developing pooled budgets


![Node health seminar 8 april 2015_jan-erik johanson [compatibility mode]](https://cdn.slidesharecdn.com/ss_thumbnails/nodehealthseminar8april2015jan-erikjohansoncompatibilitymode-150413102141-conversion-gate01-thumbnail.jpg?width=640&height=640&fit=bounds)


![Apporach to lung biopsy [Auto-saved].pptx latest](https://cdn.slidesharecdn.com/ss_thumbnails/apporachtolungbiopsyauto-saved-251211225655-93258539-thumbnail.jpg?width=640&height=640&fit=bounds)


