This document reports on a study that measured protein folding thermodynamics and kinetics inside living E. coli cells and under physiologically relevant conditions using fluorine NMR spectroscopy. The results show that:
1) The model protein SH3 is not stabilized inside cells as predicted by crowding theory, and charge-charge interactions between SH3 and cellular components slow folding kinetics.
2) Cosolutes commonly used to mimic the cellular interior do not capture these effects and do not provide physiologically relevant information.
3) The findings establish that protein surfaces play an essential role in cellular environments through charge-charge interactions, contradicting predictions of crowding theory based only on volume exclusion effects.
![In-cell thermodynamics and a new role for
protein surfaces
Austin E. Smitha
, Larry Z. Zhoua
, Annelise H. Gorenseka
, Michael Senskeb
, and Gary J. Pielaka,c,d,1
a
Department of Chemistry, University of North Carolina at Chapel Hill, Chapel Hill, NC 27599; b
Department of Physical Chemistry II, Ruhr-Universität
Bochum, 44780 Bochum, Germany; c
Department of Biochemistry and Biophysics, University of North Carolina at Chapel Hill, Chapel Hill, NC 27599;
and d
Lineberger Comprehensive Cancer Center, University of North Carolina at Chapel Hill, Chapel Hill, NC 27599
Edited by Martin Gruebele, University of Illinois at Urbana–Champaign, Urbana, IL, and approved December 14, 2015 (received for review September
21, 2015)
There is abundant, physiologically relevant knowledge about pro-
tein cores; they are hydrophobic, exquisitely well packed, and
nearly all hydrogen bonds are satisfied. An equivalent understand-
ing of protein surfaces has remained elusive because proteins are
almost exclusively studied in vitro in simple aqueous solutions.
Here, we establish the essential physiological roles played by
protein surfaces by measuring the equilibrium thermodynamics
and kinetics of protein folding in the complex environment of living
Escherichia coli cells, and under physiologically relevant in vitro con-
ditions. Fluorine NMR data on the 7-kDa globular N-terminal SH3
domain of Drosophila signal transduction protein drk (SH3) show
that charge–charge interactions are fundamental to protein stability
and folding kinetics in cells. Our results contradict predictions from
accepted theories of macromolecular crowding and show that coso-
lutes commonly used to mimic the cellular interior do not yield
physiologically relevant information. As such, we provide the foun-
dation for a complete picture of protein chemistry in cells.
protein NMR | protein thermodynamics | protein folding | in-cell NMR
Classic theories about the effects of complex environments
consider only hard-core repulsions (volume exclusion) and
so predict entropy-driven protein stabilization (1-3). Here, we
use the 7-kDa globular N-terminal SH3 domain of Drosophila
signal transduction protein drk (SH3) as a model to test this idea
in living cells. SH3 exists in a dynamic equilibrium between
the folded state and the unfolded ensemble (4). This two-state
behavior (5) is ideal for NMR-based studies of folding.
Fluorine labeling (6) of its sole tryptophan leads to only two
19
F resonances (7): one from the folded state, the other from
the unfolded ensemble (Fig. 1A). The area under each resonance
is proportional to its population, ρf and ρu, respectively. These
populations are used to quantify protein stability via the modi-
fied standard state free energy of unfolding,
ΔG°′
U,T = −RTln
ρU
ρF
, [1]
where R is the gas constant and T is the absolute temperature.
Furthermore, the width at half height of each resonance is pro-
portional to the transverse relaxation rate, which is an approx-
imate measure of intermolecular interactions (8–10). Thus, this
simple system yields both quantitative thermodynamic knowl-
edge and information about interactions involving the folded
state and the unfolded ensemble.
To assess the enthalpic (ΔH°′
U) and entropic (ΔS°′
U) components,
we measured the temperature dependence of ΔG°′
U. These data
were fitted to the integrated Gibbs–Helmholtz equation (11), as-
suming a constant heat capacity of unfolding, ΔC°
p,U:
ΔG°′
U,T = ΔH°′
U,Tref
− TΔS°′
U,Tref
+ ΔC°′
p,U T − Tref − T ln
T
Tref
!
, [2]
where Tref is either the melting temperature, Tm (where ρf = ρu), or
the temperature of maximum stability, Ts (where ΔS°′
U = 0) (11).
Results and Discussion
Stability in Buffer. In buffer at pH 7.2 and 298 K, ΔG°′
U is 0.52 ±
0.03 kcal/mol, ΔH°′
U is 10 ± 1 kcal/mol, TΔS°′
U is 10 ± 1 kcal/mol, and
ΔC°′
p,U is 0.87 ± 0.06 kcal/mol/K (Fig. 1C and SI Appendix, Tables S1
and S2). ΔG°′
U is concentration independent from 11 μM to 1.1 mM
(SI Appendix, Fig. S1) and consistent with reported values (4, 7).
ΔC°′
p,U is also consistent with predictions (11, 12).
Stability in Cells. Spectra were then acquired in E. coli (Fig. 1B).
We know from cell lysate spectra that a 19
F-labeled metabolite
is present under the peak from the unfolded ensemble (Fig. 2).
Two approaches were used to account for this metabolite in
calculations of ΔG°′
U, T.
At one extreme, no correction was made, such that the equilib-
rium constant for unfolding equals the area of the composite in-cell
(IC) unfolded peak (
R
UIC) over the area of the folded form (
R
FIC):
ΔG°′
U,raw = −RTln
R
UIC
R
FIC
. [3]
This approach overestimates the population of the unfolded
ensemble, and thus gives a minimum value for ΔG°′
U, T (Eq. 3,
green curve in Fig. 1C).
The second method accounts for the metabolite by using the
following equations, which are described below:
Ufrac =
R
Ulysate
R
Ulysate +
R
Mlysate
, [4]
ΔG°′
U,corr = −RTln
À R
UIC −
R
S
Á
× Ufrac
R
FIC
. [5]
The first step removes the contribution from any leaked metabolite.
This was accomplished by examining the supernatant spectrum,
Significance
Understanding protein thermodynamics as it occurs inside cells is a
fundamental goal of biophysics, and, from a practical point of
view, will facilitate the design and improvement of protein-based
drugs and catalysts. By measuring the temperature dependence of
protein stability inside Escherichia coli cells, we show, contrary to
predictions, that proteins are not necessarily stabilized inside cells
compared with buffer alone. We also show that crowding-
induced charge–charge interactions slow folding because of pref-
erential interactions with the unfolded ensemble, and reducing
these interactions increases protein stability.
Author contributions: A.E.S. and G.J.P. designed research; A.E.S., L.Z.Z., A.H.G., and M.S.
performed research; A.E.S., L.Z.Z., A.H.G., M.S., and G.J.P. analyzed data; and A.E.S., L.Z.Z.,
A.H.G., M.S., and G.J.P. wrote the paper.
The authors declare no conflict of interest.
This article is a PNAS Direct Submission.
1
To whom correspondence should be addressed. Email: gary_pielak@unc.edu.
This article contains supporting information online at www.pnas.org/lookup/suppl/doi:10.
1073/pnas.1518620113/-/DCSupplemental.
www.pnas.org/cgi/doi/10.1073/pnas.1518620113 PNAS Early Edition | 1 of 6
CHEMISTRY](https://image.slidesharecdn.com/ae46ff67-6918-4882-ab11-23585cb39932-160202222314/85/Smith_PNAS_2016-1-320.jpg)
![In-cell thermodynamics and a new role for
protein surfaces
Austin E. Smitha
, Larry Z. Zhoua
, Annelise H. Gorenseka
, Michael Senskeb
, and Gary J. Pielaka,c,d,1
a
Department of Chemistry, University of North Carolina at Chapel Hill, Chapel Hill, NC 27599; b
Department of Physical Chemistry II, Ruhr-Universität
Bochum, 44780 Bochum, Germany; c
Department of Biochemistry and Biophysics, University of North Carolina at Chapel Hill, Chapel Hill, NC 27599;
and d
Lineberger Comprehensive Cancer Center, University of North Carolina at Chapel Hill, Chapel Hill, NC 27599
Edited by Martin Gruebele, University of Illinois at Urbana–Champaign, Urbana, IL, and approved December 14, 2015 (received for review September
21, 2015)
There is abundant, physiologically relevant knowledge about pro-
tein cores; they are hydrophobic, exquisitely well packed, and
nearly all hydrogen bonds are satisfied. An equivalent understand-
ing of protein surfaces has remained elusive because proteins are
almost exclusively studied in vitro in simple aqueous solutions.
Here, we establish the essential physiological roles played by
protein surfaces by measuring the equilibrium thermodynamics
and kinetics of protein folding in the complex environment of living
Escherichia coli cells, and under physiologically relevant in vitro con-
ditions. Fluorine NMR data on the 7-kDa globular N-terminal SH3
domain of Drosophila signal transduction protein drk (SH3) show
that charge–charge interactions are fundamental to protein stability
and folding kinetics in cells. Our results contradict predictions from
accepted theories of macromolecular crowding and show that coso-
lutes commonly used to mimic the cellular interior do not yield
physiologically relevant information. As such, we provide the foun-
dation for a complete picture of protein chemistry in cells.
protein NMR | protein thermodynamics | protein folding | in-cell NMR
Classic theories about the effects of complex environments
consider only hard-core repulsions (volume exclusion) and
so predict entropy-driven protein stabilization (1-3). Here, we
use the 7-kDa globular N-terminal SH3 domain of Drosophila
signal transduction protein drk (SH3) as a model to test this idea
in living cells. SH3 exists in a dynamic equilibrium between
the folded state and the unfolded ensemble (4). This two-state
behavior (5) is ideal for NMR-based studies of folding.
Fluorine labeling (6) of its sole tryptophan leads to only two
19
F resonances (7): one from the folded state, the other from
the unfolded ensemble (Fig. 1A). The area under each resonance
is proportional to its population, ρf and ρu, respectively. These
populations are used to quantify protein stability via the modi-
fied standard state free energy of unfolding,
ΔG°′
U,T = −RTln
ρU
ρF
, [1]
where R is the gas constant and T is the absolute temperature.
Furthermore, the width at half height of each resonance is pro-
portional to the transverse relaxation rate, which is an approx-
imate measure of intermolecular interactions (8–10). Thus, this
simple system yields both quantitative thermodynamic knowl-
edge and information about interactions involving the folded
state and the unfolded ensemble.
To assess the enthalpic (ΔH°′
U) and entropic (ΔS°′
U) components,
we measured the temperature dependence of ΔG°′
U. These data
were fitted to the integrated Gibbs–Helmholtz equation (11), as-
suming a constant heat capacity of unfolding, ΔC°
p,U:
ΔG°′
U,T = ΔH°′
U,Tref
− TΔS°′
U,Tref
+ ΔC°′
p,U T − Tref − T ln
T
Tref
!
, [2]
where Tref is either the melting temperature, Tm (where ρf = ρu), or
the temperature of maximum stability, Ts (where ΔS°′
U = 0) (11).
Results and Discussion
Stability in Buffer. In buffer at pH 7.2 and 298 K, ΔG°′
U is 0.52 ±
0.03 kcal/mol, ΔH°′
U is 10 ± 1 kcal/mol, TΔS°′
U is 10 ± 1 kcal/mol, and
ΔC°′
p,U is 0.87 ± 0.06 kcal/mol/K (Fig. 1C and SI Appendix, Tables S1
and S2). ΔG°′
U is concentration independent from 11 μM to 1.1 mM
(SI Appendix, Fig. S1) and consistent with reported values (4, 7).
ΔC°′
p,U is also consistent with predictions (11, 12).
Stability in Cells. Spectra were then acquired in E. coli (Fig. 1B).
We know from cell lysate spectra that a 19
F-labeled metabolite
is present under the peak from the unfolded ensemble (Fig. 2).
Two approaches were used to account for this metabolite in
calculations of ΔG°′
U, T.
At one extreme, no correction was made, such that the equilib-
rium constant for unfolding equals the area of the composite in-cell
(IC) unfolded peak (
R
UIC) over the area of the folded form (
R
FIC):
ΔG°′
U,raw = −RTln
R
UIC
R
FIC
. [3]
This approach overestimates the population of the unfolded
ensemble, and thus gives a minimum value for ΔG°′
U, T (Eq. 3,
green curve in Fig. 1C).
The second method accounts for the metabolite by using the
following equations, which are described below:
Ufrac =
R
Ulysate
R
Ulysate +
R
Mlysate
, [4]
ΔG°′
U,corr = −RTln
À R
UIC −
R
S
Á
× Ufrac
R
FIC
. [5]
The first step removes the contribution from any leaked metabolite.
This was accomplished by examining the supernatant spectrum,
Significance
Understanding protein thermodynamics as it occurs inside cells is a
fundamental goal of biophysics, and, from a practical point of
view, will facilitate the design and improvement of protein-based
drugs and catalysts. By measuring the temperature dependence of
protein stability inside Escherichia coli cells, we show, contrary to
predictions, that proteins are not necessarily stabilized inside cells
compared with buffer alone. We also show that crowding-
induced charge–charge interactions slow folding because of pref-
erential interactions with the unfolded ensemble, and reducing
these interactions increases protein stability.
Author contributions: A.E.S. and G.J.P. designed research; A.E.S., L.Z.Z., A.H.G., and M.S.
performed research; A.E.S., L.Z.Z., A.H.G., M.S., and G.J.P. analyzed data; and A.E.S., L.Z.Z.,
A.H.G., M.S., and G.J.P. wrote the paper.
The authors declare no conflict of interest.
This article is a PNAS Direct Submission.
1
To whom correspondence should be addressed. Email: gary_pielak@unc.edu.
This article contains supporting information online at www.pnas.org/lookup/suppl/doi:10.
1073/pnas.1518620113/-/DCSupplemental.
www.pnas.org/cgi/doi/10.1073/pnas.1518620113 PNAS Early Edition | 1 of 6
CHEMISTRY](https://image.slidesharecdn.com/ae46ff67-6918-4882-ab11-23585cb39932-160202222314/75/Smith_PNAS_2016-1-2048.jpg)
![which does not contain any SH3 protein, folded or unfolded. The
area of the metabolite resonance in the supernatant spectrum
(
R
S, Fig. 2 B and E) was subtracted from the area of the com-
posite peak in the in-cell spectrum (
R
UIC) to yield
R
UIC −
R
S.
The second step estimates Ufrac (Eq. 4), the fraction of the com-
posite in-cell peak, UIC, that represents the unfolded ensemble.
This estimation was accomplished by using the spectrum of the
cell lysate (Fig. 2 C and F), which contains resolved peaks for the
metabolite plus the unfolded ensemble in the lysate. The ratio of
the area of the unfolded peak (
R
Ulysate) to the total upfield peak
[
R
(Ulysate + Mlysate)] provides Ufrac (Eq. 4). The product of the two
terms [(
R
UIC −
R
S) * Ufrac] divided by the area from the reso-
nance of the folded form in cells (
R
FIC) gives a metabolite-cor-
rected approximation of the equilibrium constant that was used
to estimate ΔG°′
U, T in cells (Eq. 5, red curve in Fig. 1C).
Using Ufrac to correct the in-cell data is only an approximation
because it assumes the population of the unfolded ensemble does not
change on cell lysis. This approach probably overestimates ΔG°′
U, T
(gives the maximum stability, “cells-corrected” in Fig. 1C) because
in vitro studies with protein crowders as well as in-cell studies show
that destabilizing weak attractive interactions often dominate stabi-
lizing hard-core excluded volume effect (13–15). We expect the true
ΔG°′
U, T lies between the two values.
Both curves indicate that SH3 is not stabilized in cells (Fig. 1C).
Tm and ΔG°′
U either decreased or were unchanged compared with
buffer (SI Appendix, Tables S1 and S2), consistent with other
studies,(13, 15–18) but inconsistent with previously accepted
crowding theory (1, 2). ΔC°′
p,U is the same in buffer and in cells (SI
Appendix, Table S1). The stability decrease from the uncorrected
data (0.53 ± 0.07 kcal/mol at 298 K) arises from a decrease in ΔH°′
U
(SI Appendix, Table S3), which is also inconsistent with theory. The
corrected data indicate no change in ΔH°′
U, T. Further, diluted cell
lysates and 100 gdry/L reconstituted lysate (14, 19) had little effect
on SH3 stability (SI Appendix, Fig. S2). Because stabilizing hard-
core repulsions are always present, our data show that these re-
pulsions can be completely offset by attractive interactions in cells.
Charge–Charge Interactions. To probe electrostatic interactions
between SH3 (pIcalc 5, Fig. 1 D–F) and protein crowders, we then
performed in vitro experiments at several pH values in 100-g/L
solutions of BSA (66 kDa, pIcalc 6) or lysozyme (14 kDa, pIcalc 9).
At pH 7.2, lysozyme destabilized SH3 relative to buffer
(ΔΔG°′
U,298 K = −0.92 ± 0.03 kcal/mol, Fig. 1D) and broadened its
resonances (Fig. 3A and SI Appendix, Table S2). We attribute both
effects primarily to attractive, nonspecific, charge–charge interac-
tions between the protein surfaces. Consistent with this idea, adding
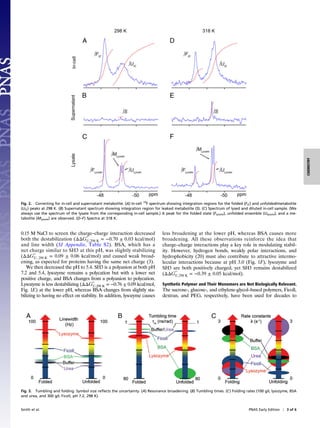
Fig. 1. Fluorine spectra acquired at 298 K, in buffer (A) and cells (B). The blue trace is from the postexperiment supernatant and shows that the red spectrum
arises from protein inside cells. Stability curves (C) in buffer (black), in cells (red and green), and in 100 g/L urea (magenta). In-cell metabolite correction and
analysis of uncertainties are discussed in Results and Discussion and Materials and Methods, respectively. Shaded regions are 95% confidence intervals. Error
bars for buffer are smaller than the labels and represent the SD of three trials. Error bars for the in-cell data at 273, 298, and 313 K represent the SD of three
trials. Stability in buffer (black) and solutions of 100 g/L BSA (blue) and lysozyme (red) at different pH values (D–F). The curve for buffer from C is reproduced
in D. The net charges on SH3, BSA, and lysozyme (based on sequence) are shown. Error bars (298 K) represent the SD from three trials. Appearance of new
resonances in the pH 3 BSA sample prevented extraction of thermodynamic parameters.
2 of 6 | www.pnas.org/cgi/doi/10.1073/pnas.1518620113 Smith et al.](https://image.slidesharecdn.com/ae46ff67-6918-4882-ab11-23585cb39932-160202222314/85/Smith_PNAS_2016-2-320.jpg)
![concentration) was used to induce expression. After 45 min, cells were pel-
leted at 1,000 × g and resuspended in M9 media without 5-fluoroindole, and
expression was again induced to ensure efficient incorporation of the label.
After 45 min, the cells were pelleted at 1,000 × g and washed three times
with in-cell NMR buffer (200 mM Hepes, 100 mM bis-Tris propane, 50 μg/mL
chloramphenicol, 150 μg/mL ampicillin, pH ∼7.6). Chloramphenicol was used
to halt protein expression before NMR. Cell pellets were resuspended in
300 μL of in-cell NMR buffer and loaded into standard 5-mm NMR tubes.
Typical cell slurries were 50% wet cells by volume.
Protein Expression for Purification. Transformation and growth were per-
formed as described in the first paragraph of the previous section.
The 50-mL cultures were shaken at 37 °C overnight, diluted to 1 L with
supplemented M9 media, and shaken until the optical density at 600 nm
reached 0.6. Five-fluoroindole was added (0.1 g/L final concentration) and
the culture shaken for an additional 30 min. IPTG (1 mM final concen-
tration) was used to induce expression. After 1 h, cells were pelleted at
1,000 g at 10 °C for 30 min, resuspended in 50 mM Tris (pH 7.5), and
frozen at −80 °C.
Protease inhibitors [Sigma-Aldrich P-2714, containing 4-(2-aminoethyl)
benzenesulfonyl fluoride, aprotinin, bestatin, E-64, EDTA, and leupeptin]
were added before lysis. Cells were lysed by sonication (Fisher Scientific
Sonic Dismembrator model 500, 15% amplitude, 15 min, 67% duty cycle)
on ice. Cell debris was removed by centrifugation at 16,000 × g at 10 °C for
30 min, and the sample was passed through a 0.45-μm filter. Purification
involved two chromatography steps using a GE AKTA FPLC. The first step
was anion exchange (GE Q column, 5–45% gradient, 50 mM Tris wash
buffer, 50 mM Tris/1 M NaCl eluant buffer, pH 7.5). SH3 binds weakly to
anion exchange media. Protease inhibitors were added to the SH3-containing
fractions, and the sample was passed through a 0.22-μm filter. The second
step was size exclusion chromatography (GE Superdex 75 column eluted
with 50 mM K2HPO4, 150 mM NaCl, 1 mM EDTA, pH 7.2). Purified protein
was dialyzed against 17 MΩ cm−1
H2O for 4 h at room temperature and/or
overnight at 5 °C. Buffer was changed every 1.5–2 h. After dialysis and fil-
tration through a 0.22-μm filter, the sample was flash frozen in a dry-ice/
ethanol bath and lyophilized for 12 h (Labconco FreeZone). Mass spectral
analysis showed a single mass of 6,880 Da, consistent with expected mass of
the fluorine-labeled protein, indicating the absence of the metabolite ob-
served in cells (see below).
NMR. In-cell samples were prepared as described above. For in vitro ex-
periments, purified fluorine-labeled protein was added to NMR buffer
(50 mM acetic acid/sodium acetate, Hepes, bis-Tris propane, pH 7.2) containing
the stated concentration of cosolute. The concentration of BSA/lysozyme
was verified by UV-visible spectroscopy (NanoDrop ND-1000). Polymer and
lysate crowders were weighed (Ohaus PA64). One experiment used NMR
buffer plus 150 mM NaCl, to assess salt dependence. Fluorine spectra were
acquired at 4 °C (5 °C for in-cell experiments), 10 °C, 15 °C, 20 °C, 25 °C, 30 °C,
35 °C, 40 °C, and 45 °C with a Bruker Avance III HD spectrometer operating
at a 19
F Larmor frequency of 470 MHz running Topspin Version 3.2 and
equipped with a Bruker QCI cryoprobe. Resonances were referenced to
trifluoroacetic acid (0.1%) in D2O placed in a coaxial insert inside the NMR
tube. The D2O also served to lock the spectrometer. The temperature was
calibrated with a two-point standard curve using deuterated methanol.
The total relaxation delay for one-dimensional experiments was 5 s. The
sweep width was 70 ppm. The number of scans depended on cosolute
and ranged from 32 to 256. Carr–Purcell–Meiboom–Gill-based spin–spin
relaxation time (T2) measurements used mixing times (tmix) of 1.0, 2.1,4.2
(×3), 6.3, 8.4, 16.8, 33.5, and 67.0 ms. A 955-Hz effective field was used
to negate effects of chemical exchange. The transmitter was placed on-
resonance to prevent ineffective refocusing. Spin-lattice relaxation times
(T1) were measured using an inversion recovery sequence [tmix: 0, 0.05 (×3),
0.10, 0.25, 0.50, 0.80, 1.00, and 1.50 s]. A Bruker library NOESY experiment
[tmix: 1.5, 50, 90, 150, 225, 300, 600, and 1,000 ms for buffer and 1.5, 70,
140 (×3), 210, 300, 500, and 800 ms for crowded samples] with a 2-s re-
laxation delay was used to measure folding/unfolding rates. Sweep widths
were 70 ppm in both dimensions; 1,024 complex points were collected
during t2 with 64 or 72 complex points in t1 at each tmix. Sixteen transients
were acquired per increment.
Fluorine spectra were acquired before and after the relaxation and ex-
change experiments to assess sample integrity and reversibility. Populations
of the folded and unfolded states remained constant, or the dataset was
discarded. For the in-cell samples, the cell slurry was removed after the
experiment and gently pelleted. The supernatant was diluted twofold.
The cells were resuspended in 0.4 mL of in-cell NMR buffer plus protease
inhibitors, lysed by sonication, and clarified at 16,000 × g. Spectra were ac-
quired on the supernatant to assess protein leakage and on the lysates to
assess the effect of lysates on stability. No protein leakage was observed.
Data Processing. Data were processed with Topspin 3.2. For temperature
variation experiments, free induction decays (fids, 50,000 points each) were
subjected to a 10–15-Hz broadening function before zero filling (to 131,000
points) and Fourier transformation. For T1 and T2 experiments, fids (50,000
points) were subjected to a 10- to 15-Hz broadening function before zero-
filling to 131,000 points. For exchange spectroscopy, t2 data (1,024 complex
points) were subjected to a cosine-squared bell function before zero filling
to 4,096 points. t1 data were linear predicted to 256 points before applica-
tion of a cosine-squared bell function. Subsequent zero filling to 512 points
and Fourier transformation yielded the final spectra.
Resonance intensities were extracted for relaxation experiments. For
temperature variation experiments, peaks were integrated. Peak volumes
were fitted as described. Published assignments were used (7).
Fluorine T1 (1/R1) and T2 (1/R2) data were fit using Model Free formalism
to calculate rotational correlation times (τm) (28, 29). The internal correlation
time (τe) and the order parameter (S2
) were set to 20 ps and 0.82 for the
folded state and 1,200 ps and 0.34 for the unfolded state, respectively (24).
Chemical shift anisotropy and asymmetry terms were set to −93.5 ppm
and 0.24, respectively (30). No μs-ms motion was observed in buffer, and a
950-Hz effective field was used for the R2 measurements. Therefore,
chemical exchange was not included in fitting. The average 19
F-1
H distances
(r) and τm were then minimized based on fitting the R1 and R2 data.
Analysis of Uncertainties. Triplicate datasets, using three different batches of
purified protein, were acquired for the pH 7.2 buffer dataset. The sample SDs
depended on temperature (±52 cal/mol, ±45 cal/mol, ±59 cal/mol, ±31
cal/mol, ±31 cal/mol, ±66 cal/mol, ±61 cal/mol, ±14 cal/mol, ±35 cal/mol at 4 °C,
10 °C, 15 °C, 20 °C, 25 °C, 30 °C, 35 °C, 40 °C, and 45 °C, respectively). For
buffer, we used these SDs to drive Monte Carlo error analysis. One thousand
randomly generated datasets were fitted to the integrated Gibbs–Helmholtz
equation at Tref. To extrapolate H°′
U, Tref
and ΔS°′
U, Tref
, and their uncertainties,
to 298 K, the average and sample SDs of ΔH°′
U, Tref
, Tref, and ΔC°′
p,U from this
analysis were used to drive another Monte Carlo analysis (n = 106
) using
Kirchhoff’s relations. The uncertainties in ΔH°′
U, 298 K and ΔS°′
U, 298 K are larger
than the uncertainty in ΔG°′
U, 298 K because the enthalpy and entropy of
unfolding are derived from for three variables (ΔH°′
U, Tref
, Tref, and ΔC°′
p,U) and
their uncertainties.
For the in-cell data, a similar method was used. Triplicate data were
obtained for the 10 °C, 25 °C, and 40 °C datasets. For the other datasets
uncertainties from the nearest-neighbor triplicate dataset were used to
drive the analysis. For example, the 5 °C and 15 °C used the uncertainty
associated with the 10 °C dataset.
For in vitro experiments in the presence of crowders, triplicate 25 °C data
were acquired on the same sample. The SD was used to scale the uncer-
tainties at other temperatures based on the SDs of the buffer dataset.
These scaled values were used to drive the Monte Carlo analysis.
For in vitro relaxation rates, one mixing time was acquired three times. The
sample SD was used to drive Monte Carlo analysis (n = 1,000) to obtain R1 and
R2. The mean and SDs from this analysis were used to drive another Monte
Carlo analysis (n = 1,000) using the Model Free approach (28, 29) to obtain r,
τm, and their uncertainties. Fitted r values varied from 1.8 to 2.1 Å for the
folded state and from 2.0 to 2.4 Å for the unfolded state.
Folding rate data in buffer were acquired in triplicate and fitted as
described (31). The uncertainty is the sample SD. For in vitro folding rates,
one mixing time was acquired three times. The sample SD was used to
drive Monte Carlo analysis (n = 100). For folding rates, R1 was fixed to
the value acquired from inversion recovery experiments for in vitro
crowded conditions.
In-Cell pH. Purified protein was resuspended in 50 mM citrate, 50 mM bis-Tris
propane, 50 mM Hepes, 50 mM borate, 5% D2O, 0.1% DSS (pH values: 5.0,
5.8, 6.5, 6.9, and 7.5). Data were acquired from 10 °C to 40 °C in 5 °C in-
crements. The difference in the 19
F chemical shifts between the two states is
sensitive to pH (SI Appendix, Fig. S3). These experiments were combined
with two NMR buffer experiments [50 mM acetate, 50 mM Hepes, 50 mM
bis-Tris at pH 7.2 (with and without 0.15 M NaCl)] to assess salt effects, which
were minimal. The shift change as a function of pH was fitted to a second-
order polynomial to produce a standard curve. Shift differences from in-cell
data sets were then compared with this standard curve to obtain the pH in
cells. The pH in cells, 7.2, compares favorably to the external meter reading
minus 0.4 pH units, as previously described (32, 33).
Smith et al. PNAS Early Edition | 5 of 6
CHEMISTRY](https://image.slidesharecdn.com/ae46ff67-6918-4882-ab11-23585cb39932-160202222314/85/Smith_PNAS_2016-5-320.jpg)


