More Related Content
Similar to SMASH - NMR of Fish Oil Poster - 9-24-13
Similar to SMASH - NMR of Fish Oil Poster - 9-24-13 (20)
More from John Edwards (20)
SMASH - NMR of Fish Oil Poster - 9-24-13
- 1. 1H
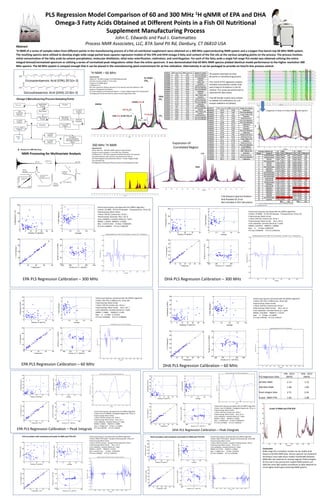
PLS Regression Model Comparison of 60 and 300 MHz qNMR of EPA and DHA
Omega-3 Fatty Acids Obtained at Different Points in a Fish Oil Nutritional
Supplement Manufacturing Process
John C. Edwards and Paul J. Giammatteo
Process NMR Associates, LLC, 87A Sand Pit Rd, Danbury, CT 06810 USA
Abstract
1H
NMR of a series of samples taken from different points in the manufacturing process of a fish oil nutritional supplement were obtained on a 300 MHz superconducting NMR system and a cryogen-free bench-top 60 MHz NMR system.
The resulting spectra were utilized to develop single wide-range partial least-squares regression models of the EPA and DHA omega-3 fatty acid content of the fish oils at the various sampling points on the process. The process involves
initial concentration of the fatty acids by solvent precipitation, molecular distillation, ethyl ester esterification, clathration, and centrifugation. For each of the fatty acids a single full range PLS model was obtained utilizing the entire
integral binned/normalized spectrum or utilizing a series of normalized peak integrations rather than the entire spectrum. It was demonstrated that 60 MHz NMR spectra yielded identical model performance to the higher resolution 300
MHz spectra. The 60 MHz system is compact enough that it can be placed in the manufacturing plant environment for at-line utilization. Alternatively it can be packaged to provide on-line/in-line process control.
NMR – 60 MHz
Experimental
In chain
Aspect AI – 60 MHz Cryogen-Free NMR Spectrometer
CH2
24 pulse on pure sample in 5 mm tube
Locked on 1H NMR signal
In MNova 8.1.2
SPC Files Imported, Stacked, Binned at 3 Hz interval, Area Normalized to 100
Saved as Transposed Ascii Matrix
For Peak Integrals Used Advanced Feature – Create Integral Graph from Stacked Plot
PLS Regression Performed Thermo Grams IQ and Eigenvector Solo
Eicosaoentaenoic Acid (EPA) 20:5(n-3)
Docosahexaenoic Acid (DHA) 22:6(n-3)
Ethyl
CH3
EtOOC-CH2-R
Olefins
=C-CH2-C=
R-CH2-C=
CH3-CH2-O-OC-CH2-R
DHA
300 MHz
1H
CH3
EPA
NMR ID
FO3h001
FO3h002
FO3h003
FO3h004
FO3h005
FO3h006
FO3h007
FO3h008
FO3h009
FO3h010
FO3h011
FO3h012
FO3h013
FO3h014
FO3h015
FO3h016
FO3h017
FO3h018
FO3h019
FO3h020
FO3h021
FO3h022
FO3h023
FO3h024
FO3h025
EPA (Area %)
0.64
21.55
62.97
29.43
14.21
52.74
15.21
7.18
16.95
36.35
61.09
13.32
71.78
41.40
1.19
11.73
43.38
6.07
9.77
58.93
10.62
43.91
54.05
0.00
26.97
Sample Description
First Esterification
First Esterification
Clathration
Mol Dist
Pollock Oil
Separator
PolyUnsat Ester
First Esterification
First Esterification
Clathration
Mol Dist
MSC Pollock Oil
Separator
PolyUnsat Ester
First Esterification
First Esterification
Clathration
Clath Raffinate
First Esterification
Mol Dist
MSC Pollock Oil
Separator
PolyUnsat Ester
First Esterification
First Esterification
50 sample initial data set from
All points in manufacturing process.
First round of PLS regression analysis
revealed concentration outliers that
were linked to limitations in the GC
method. This study was performed on
improved GC data values.
Final 80 Sample models were utilized
to validate the calibrations on a 24
sample validation set (below).
600
NMR ID
FO3h026
FO3h027
FO3h028
FO3h029
FO3h030
FO3h031
FO3h032
FO3h033
FO3h034
FO3h035
FO3h036
FO3h037
FO3h038
FO3h039
FO3h040
FO3h041
FO3h042
FO3h043
FO3h044
FO3h045
FO3h046
FO3h047
FO3h048
FO3h049
FO3h050
Expansion of
Correlated Region
NMR
Experimental
Varian Mercury - 300 MHz NMR Supercon Spectrometer
4 pulse on pure sample in 5 mm tube, Run Unlocked
In MNova 8.1.2 SPC Files Imported, Stacked, Binned at 3 Hz interval,
Area Normalized to 100, Saved as Transposed Ascii Matrix
For Peak Integrals Used Advanced Feature – Create Integral Graph
from Stacked Plot
PLS Regression Performed Thermo Grams IQ and Eigenvector Solo
NMR Processing for Multivariate Analysis
DHA (Area %)
0.01
13.34
15.66
18.16
9.54
28.90
10.51
0.23
10.04
16.47
21.26
5.95
7.43
25.91
0.06
12.23
19.30
2.78
0.72
23.41
5.18
21.52
28.18
0.00
12.82
EPA
EPA (Area %) DHA (Area %)
44.55
19.30
16.69
9.89
6.87
4.53
62.79
19.43
37.29
22.03
9.71
0.38
32.00
15.10
38.79
26.75
41.87
23.25
35.49
43.99
0.30
0.00
34.09
8.09
15.44
9.82
60.08
24.52
8.77
5.75
12.41
57.59
36.36
21.49
3.79
0.15
29.23
13.78
45.99
33.51
12.10
5.69
24.57
14.32
45.86
33.61
6.39
3.68
58.13
24.66
Sample Description
Clathration
First Esterification
Crude Pollock Oil
Separator
PolyUnsat Ester
First Esterification
First Esterification
Clathration
Mol Dist
Separator
First Esterification
Clathration
MonoUnsat Ester
PolyUnsat Ester
Crude Salmon Oil
Separator
PolyUnsat Ester
First Esterification
Clath Raffinate
PolyUnsat Ester
MSC Pollock Oil
Separator
PolyUnsat Ester
First Esterification
Clathration
400
300
200
100
0
-100
4
Partial Least Squares calculated with the SIMPLS algorithm
X-block: 1H NMR - 50 Fish Oil Samples - Transposed.xlsx 50 by 135
Preprocessing: Mean Center
Y-block: EPA GC Content.xlsx 50 by 1
Preprocessing: Autoscale Num. LVs: 8
Cross validation: venetian blinds w/ 7 splits
RMSEC: 1.20344 RMSECV: 1.67825
Bias: -3.55271e-015 CV Bias: -0.0822205
R^2 Cal: 0.996441 R^2 CV: 0.993139
1
0
-1
-2
0
5
10
15
20
Hotelling T^2 (99.89%)
25
30
0
0.2
0.4
Leverage
0.6
100
50
2
1
0
-1
-2
0.8
0
4
5
6
Variables
7
8
GC
DHA
20.64
20.93
23.94
4.5
33.56
12.63
23.09
23.79
12.53
0.27
0.15
8.57
5.6
4.92
23.36
0.67
5.87
14.59
20.8
26.39
20.59
36.98
0.09
13.59
9
NMR
EPA
45.53
32.74
36.01
4.22
44.56
26.48
42.18
35.23
20.33
7.79
3.62
17.25
15.95
8.88
57.17
1.85
13.23
7.09
41.61
46.93
61.34
44.45
-0.52
26.77
SEV =
10
11
Difference
-2.24
-0.48
0.52
-2.53
-1.83
-2.37
-1.37
-2.36
1.21
-0.43
-0.56
-1.87
4.66
-1.88
0.27
0.03
-0.11
-23.54
-3.52
-6.79
-0.93
1.76
-0.82
1.49
1.64
**
**
#
**
Partial Least Squares calculated with the SIMPLS algorithm
X-block: 1H NMR - 55 Fish Oil Samples - Transposed.xlsx 50 by 135
Preprocessing: Mean Center
Y-block: DHA GC Content.xlsx 50 by 1
Preprocessing: Mean Center Num. LVs: 8
Cross validation: venetian blinds w/ 7 splits
RMSEC: 0.837073 RMSECV: 1.08906
Bias: 0 CV Bias: 0.0445129
R^2 Cal: 0.994978 R^2 CV: 0.991523
3
-3
0
3
4
Y Stdnt Residual 1
50
2
Q Residuals (0.15%)
Y Stdnt Residual 1
Q Residuals (0.11%)
100
150
2
NMR
GC
DHA Difference EPA
20.71
0.07
47.77
19.84
-1.09
33.22
25.7
1.76
35.49
3.81
-0.69
6.75
33.21
-0.35
46.39
12.11
-0.52
28.85
22.76
-0.33
43.55
23.9
0.11
37.59
12.66
0.13
19.12
0.38
0.11
8.22
0.67
0.52
4.18
8.55
-0.02
19.12
10.23
4.63
11.29
6.34
1.42
10.76
24.27
0.91
56.9
1.74
1.07
1.82
4.99
-0.88
13.34
15.15
0.56
30.63
20.71
-0.09
45.13
27.61
1.22
53.72
20.86
0.27
62.27
35.92
-1.06
42.69
5.27
5.18
0.3
12.83
-0.76
25.28
SEV=
0.81
*** - Viscosity Related Spectrum Issue and/or M-Distance Outlier
# - Possible GC Error
3 M-Distance Spectral Outliers
And Possible GC Error
Not included in SEV Calculation
3
1
24 Sample Validation Set
Sample
Sample ID
1
Finished Product
2
Finished Product
3
Mol Dist
4
First Esterification
5
Mol Dist
6
Mol Dist
7
First Esterification
8
Clathration
9
Clathration
10
First Esterification
11
First Esterification
12
First Esterification
13
Crude Fish Oil
14
Crude Fish Oil
15
Finished Product
16
Clathration
17
Crude Fish Oil
18
Clathration
19
Clathration
20
Clathration
21
Separator
22
Separator
23
First Esterification
24
Separator
DHA
150
Integration of Peaks to Produce Multivariate Spectra
500
Data
1H
-3
0
10
20
30
Hotelling T^2 (99.85%)
Variables/Loadings Plot for 1H NMR - 55 Fish Oil Samples - Processed - 8-9-13 - Transposed.xlsx
0.04
40
0
0.2
0.4
Leverage
0.6
0.8
Variables/Loadings Plot for 1H NMR - 55 Fish Oil Samples - Processed - 8-9-13 - Transposed.xlsx
0.6
20
0.02
0
-20
0.01
0
40
30
20
10
50
0.2
Reg Vector for Y 1
20
0.4
Scores on LV 2 (1.01%)
40
100
50
Y CV Predicted 1
60
60
0.03
Reg Vector for Y 1
Scores on LV 2 (0.45%)
40
0
-0.01
0
0
20
40
Y Measured 1
60
-40
-400
80
0
-200
0
200
Scores on LV 1 (95.40%)
400
0
10
20
30
40
Y Measured 1
-0.02
-0.03
20
40
60
80
100
50
-50
-400
60
-200
0
200
Scores on LV 1 (94.90%)
120
30
15
10
1
0
-1
-2
5
-3
0
5
10
15
Hotelling T^2 (99.91%)
20
0
0.2
0.4
Leverage
0.6
20
15
10
0.8
0
40
60
80
100
120
Variable
Partial Least Squares calculated with the SIMPLS algorithm
X-block: SPC Files in MNova.xlsx 49 by 220
Preprocessing: Mean Center
Y-block: DHA GC Content.xlsx 49 by 1
Preprocessing: Mean Center Num. LVs: 8
Cross validation: venetian blinds w/ 7 splits
RMSEC: 0.613656 RMSECV: 1.13119
Bias: 0 CV Bias: -0.118407
R^2 Cal: 0.99739 R^2 CV: 0.99137
2
0
-2
5
0
5
10
15
20
Hotelling T^2 (99.91%)
Variables/Loadings Plot for SPC Files in MNova.xlsx
1
80
20
4
Y Stdnt Residual 1
20
-0.8
25
Q Residuals (0.09%)
2
Y Stdnt Residual 1
Q Residuals (0.09%)
25
0
DHA PLS Regression Calibration – 300 MHz
Partial Least Squares calculated with the SIMPLS algorithm
X-block: SPC Files in MNova.xlsx 50 by 220
Preprocessing: Mean Center
Y-block: EPA GC Content.xlsx 50 by 1
Preprocessing: Mean Center Num. LVs: 7
Cross validation: venetian blinds w/ 7 splits
RMSEC: 1.54867 RMSECV: 2.1229
Bias: 0 CV Bias: -0.112162
R^2 Cal: 0.993826 R^2 CV: 0.988456
3
-0.2
-0.6
EPA PLS Regression Calibration – 300 MHz
30
0
-0.4
Variable
25
-4
30
0
0.2
0.4
Leverage
0.6
0.8
20
Variables/Loadings Plot for SPC Files in MNova.xlsx
0
0
20
40
Y Measured 1
60
0
-10
-20
80
-200
-100
0
100
Scores on LV 1 (98.04%)
200
0
-0.5
-1
1
40
30
20
10
10
0.5
0
Reg Vector for Y 1
20
50
Scores on LV 2 (0.36%)
40
20
10
Y CV Predicted 1
Y CV Predicted 1
60
60
0.5
Reg Vector for Y 1
Scores on LV 2 (0.64%)
1.5
-10
0
-0.5
0
-1.5
20
40
60
80
100
120
Variable
140
160
180
200
220
EPA PLS Regression Calibration – 60 MHz
0
10
20
30
40
Y Measured 1
50
-20
60
-200
-100
0
100
Scores on LV 1 (97.83%)
200
-1
DHA PLS Regression Calibration – 60 MHz
-1.5
20
40
60
80
100
120
Variable
20
10
0
0
5
10
15
Hotelling T^2 (99.98%)
0
-2
-4
20
0
0.1
0.2
Leverage
0.3
0.2
0
3
40
30
20
2
0
-1
2.13
1.13
1.68
1.09
2.71
2.24
Fused - NMR-FTIR
1.62
1.08
-0.2
-0.4
0.4
0
-0.2
220
Peak Integral Data
0
-2
10
200
300 MHz NMR
0.2
1
180
60 MHz NMR
PLS Regression Data
0.4
Reg Vector for Y 1
30
0.4
Reg Vector for Y 1 EPA
40
50
0.6
2
4
Y Stdnt Residual 1
Y Stdnt Residual 1 EPA
Q Residuals (0.02%)
50
60
160
DHA - SECV
(Wt%)
0.8
4
Q Residuals (0.03%)
60
140
EPA - SECV
(Wt%)
Variables/Loadings Plot for aaa-1H-300MHz_IntelligentIntegrals.xlsx
0.6
Variables/Loadings Plot for aaa-1H-300MHz_IntelligentIntegrals.xlsx
-3
0
5
10
15
20
Hotelling T^2 (99.97%)
25
30
0
0.2
0.4
Leverage
0.6
0.8
-0.6
-0.4
-0.8
40
20
-0.6
0
-20
-40
0
0
20
40
60
Y Measured 1 EPA
1
2
3
4
20
80
-500
0
Scores on LV 1 (98.20%)
500
EPA PLS Regression Calibration – Peak Integrals
5
6
Variable
7
8
9
10
11
50
Partial Least Squares calculated with the SIMPLS algorithm
X-block: aaa-1H-300MHz_IntelligentIntegrals.xlsx 49 by 11
Preprocessing: Mean Center
Y-block: EPA GC Content.xlsx 49 by 1
Preprocessing: Mean Center Num. LVs: 5
Cross validation: venetian blinds w/ 7 splits
RMSEC: 2.20056 RMSECV: 2.70883
Bias: 1.77636e-014 CV Bias: -0.116845
R^2 Cal: 0.987561 R^2 CV: 0.98129
40
30
20
10
2
3
4
5
0
10
20
30
40
Y Measured 1
50
60
6
Variable
7
8
9
10
11
140
Partial Least Squares calculated with the SIMPLS algorithm
X-block: aaa-1H-300MHz_IntelligentIntegrals.xlsx 49 by 11
Preprocessing: Mean Center
Y-block: DHA GC Content.xlsx 49 by 1
Preprocessing: Mean Center Num. LVs: 5
Cross validation: venetian blinds w/ 7 splits
RMSEC: 1.8631 RMSECV: 2.24092
Bias: -1.24345e-014 CV Bias: 0.00464222
R^2 Cal: 0.974603 R^2 CV: 0.963534
50
0
-50
0
1
100
Scores on LV 2 (1.20%)
60
60
Y CV Predicted 1
Scores on LV 2 (0.66%)
Y CV Predicted 1 EPA
40
-500
0
Scores on LV 1 (98.13%)
500
120
Fused 1H NMR and FTIR-ATR
100
80
Data
80
60
40
DHA PLS Regression Calibration – Peak Integrals
20
-2
250
200
150
100
50
Variables/Loadings Plot for NMR_FTIR Scaled - Sample 24 Removed.xlsx
0
5
10
15
Hotelling T^2 (99.85%)
-4
20
0.2
0
0.1
0.2
Leverage
0.3
20
0
20
40
60
Y Measured 1 EPA
80
10
20
30
Hotelling T^2 (99.87%)
-4
40
0
0.2
0.4
Leverage
0.6
0.8
Variables/Loadings Plot for NMR_FTIR Scaled - Sample 24 Removed.xlsx
100
0
100
0.05
0
-0.05
-0.1
-100
0.25
60
-0.15
50
40
30
20
10
0.2
0.15
50
0
-50
0.1
0.05
0
-0.05
-0.1
-100
0
-0.2
0
-2
0.3
Y CV Predicted 1 DHA
Reg Vector for Y 1 EPA
Scores on LV 2 (8.12%)
40
0
0.15
200
60
0
0.4
0.1
80
2
0.25
0
0
4
Reg Vector for Y 1 DHA
50
0
300
Scores on LV 2 (4.42%)
100
2
Partial Least Squares calculated with the SIMPLS algorithm
X-block: NMR_FTIR Scaled - Sample 24 Removed.xlsx 49 by 998
Preprocessing: Mean Center
Y-block: DHA GC Content - Sample 24 Removed.xlsx 49 by 1
Preprocessing: Mean Center Num. LVs: 7
Cross validation: venetian blinds w/ 7 splits
RMSEC: 0.677763 RMSECV: 1.08301
Bias: -5.32907e-015 CV Bias: 0.010442
R^2 Cal: 0.996822 R^2 CV: 0.992286
DHA Correlation with Combined and Scaled 1H NMR and FTIR-ATR
Y Stdnt Residual 1 DHA
4
Y Stdnt Residual 1 EPA
Q Residuals (0.15%)
150
Partial Least Squares calculated with the SIMPLS algorithm
X-block: NMR_FTIR Scaled - Sample 24 Removed.xlsx 49 by 977
Preprocessing: Mean Center
Y-block: EPA GC Content - Sample 24 Removed.xlsx 49 by 1
Preprocessing: Mean Center Num. LVs: 6
Cross validation: venetian blinds w/ 7 splits
RMSEC: 1.16039 RMSECV: 1.62525
Bias: 3.55271e-015
CV Bias: -0.0432842
R^2 Cal: 0.996587 R^2 CV: 0.993315
Q Residuals (0.13%)
EPA Correlation with Combined and Scaled 1H NMR and FTIR-ATR
Y CV Predicted 1 EPA
Y CV Predicted 1
80
-200
-500
0
Scores on LV 1 (87.67%)
500
-0.25
200
400
600
800
1000
Variable
1200
1400
1600
-0.15
0
10
20
30
40
Y Measured 1 DHA
50
60
-500
0
Scores on LV 1 (85.17%)
500
-0.2
200
400
600
800
1000
Variable
1200
1400
1600
0
-20
200
400
600
800
1000
Variables
1200
1400
1600
Conclusion
Wide range PLS correlation models can be readily built
based on 60 MHz NMR data. Various spectral ‘de-resolution’
techniques may make these models transferable between
NMR data sets obtained at varying magnetic field strengths.
At-line and in-line permanent magnet NMR systems can
yield the same high quality correlations as data obtained on
much higher field superconducting NMR systems.