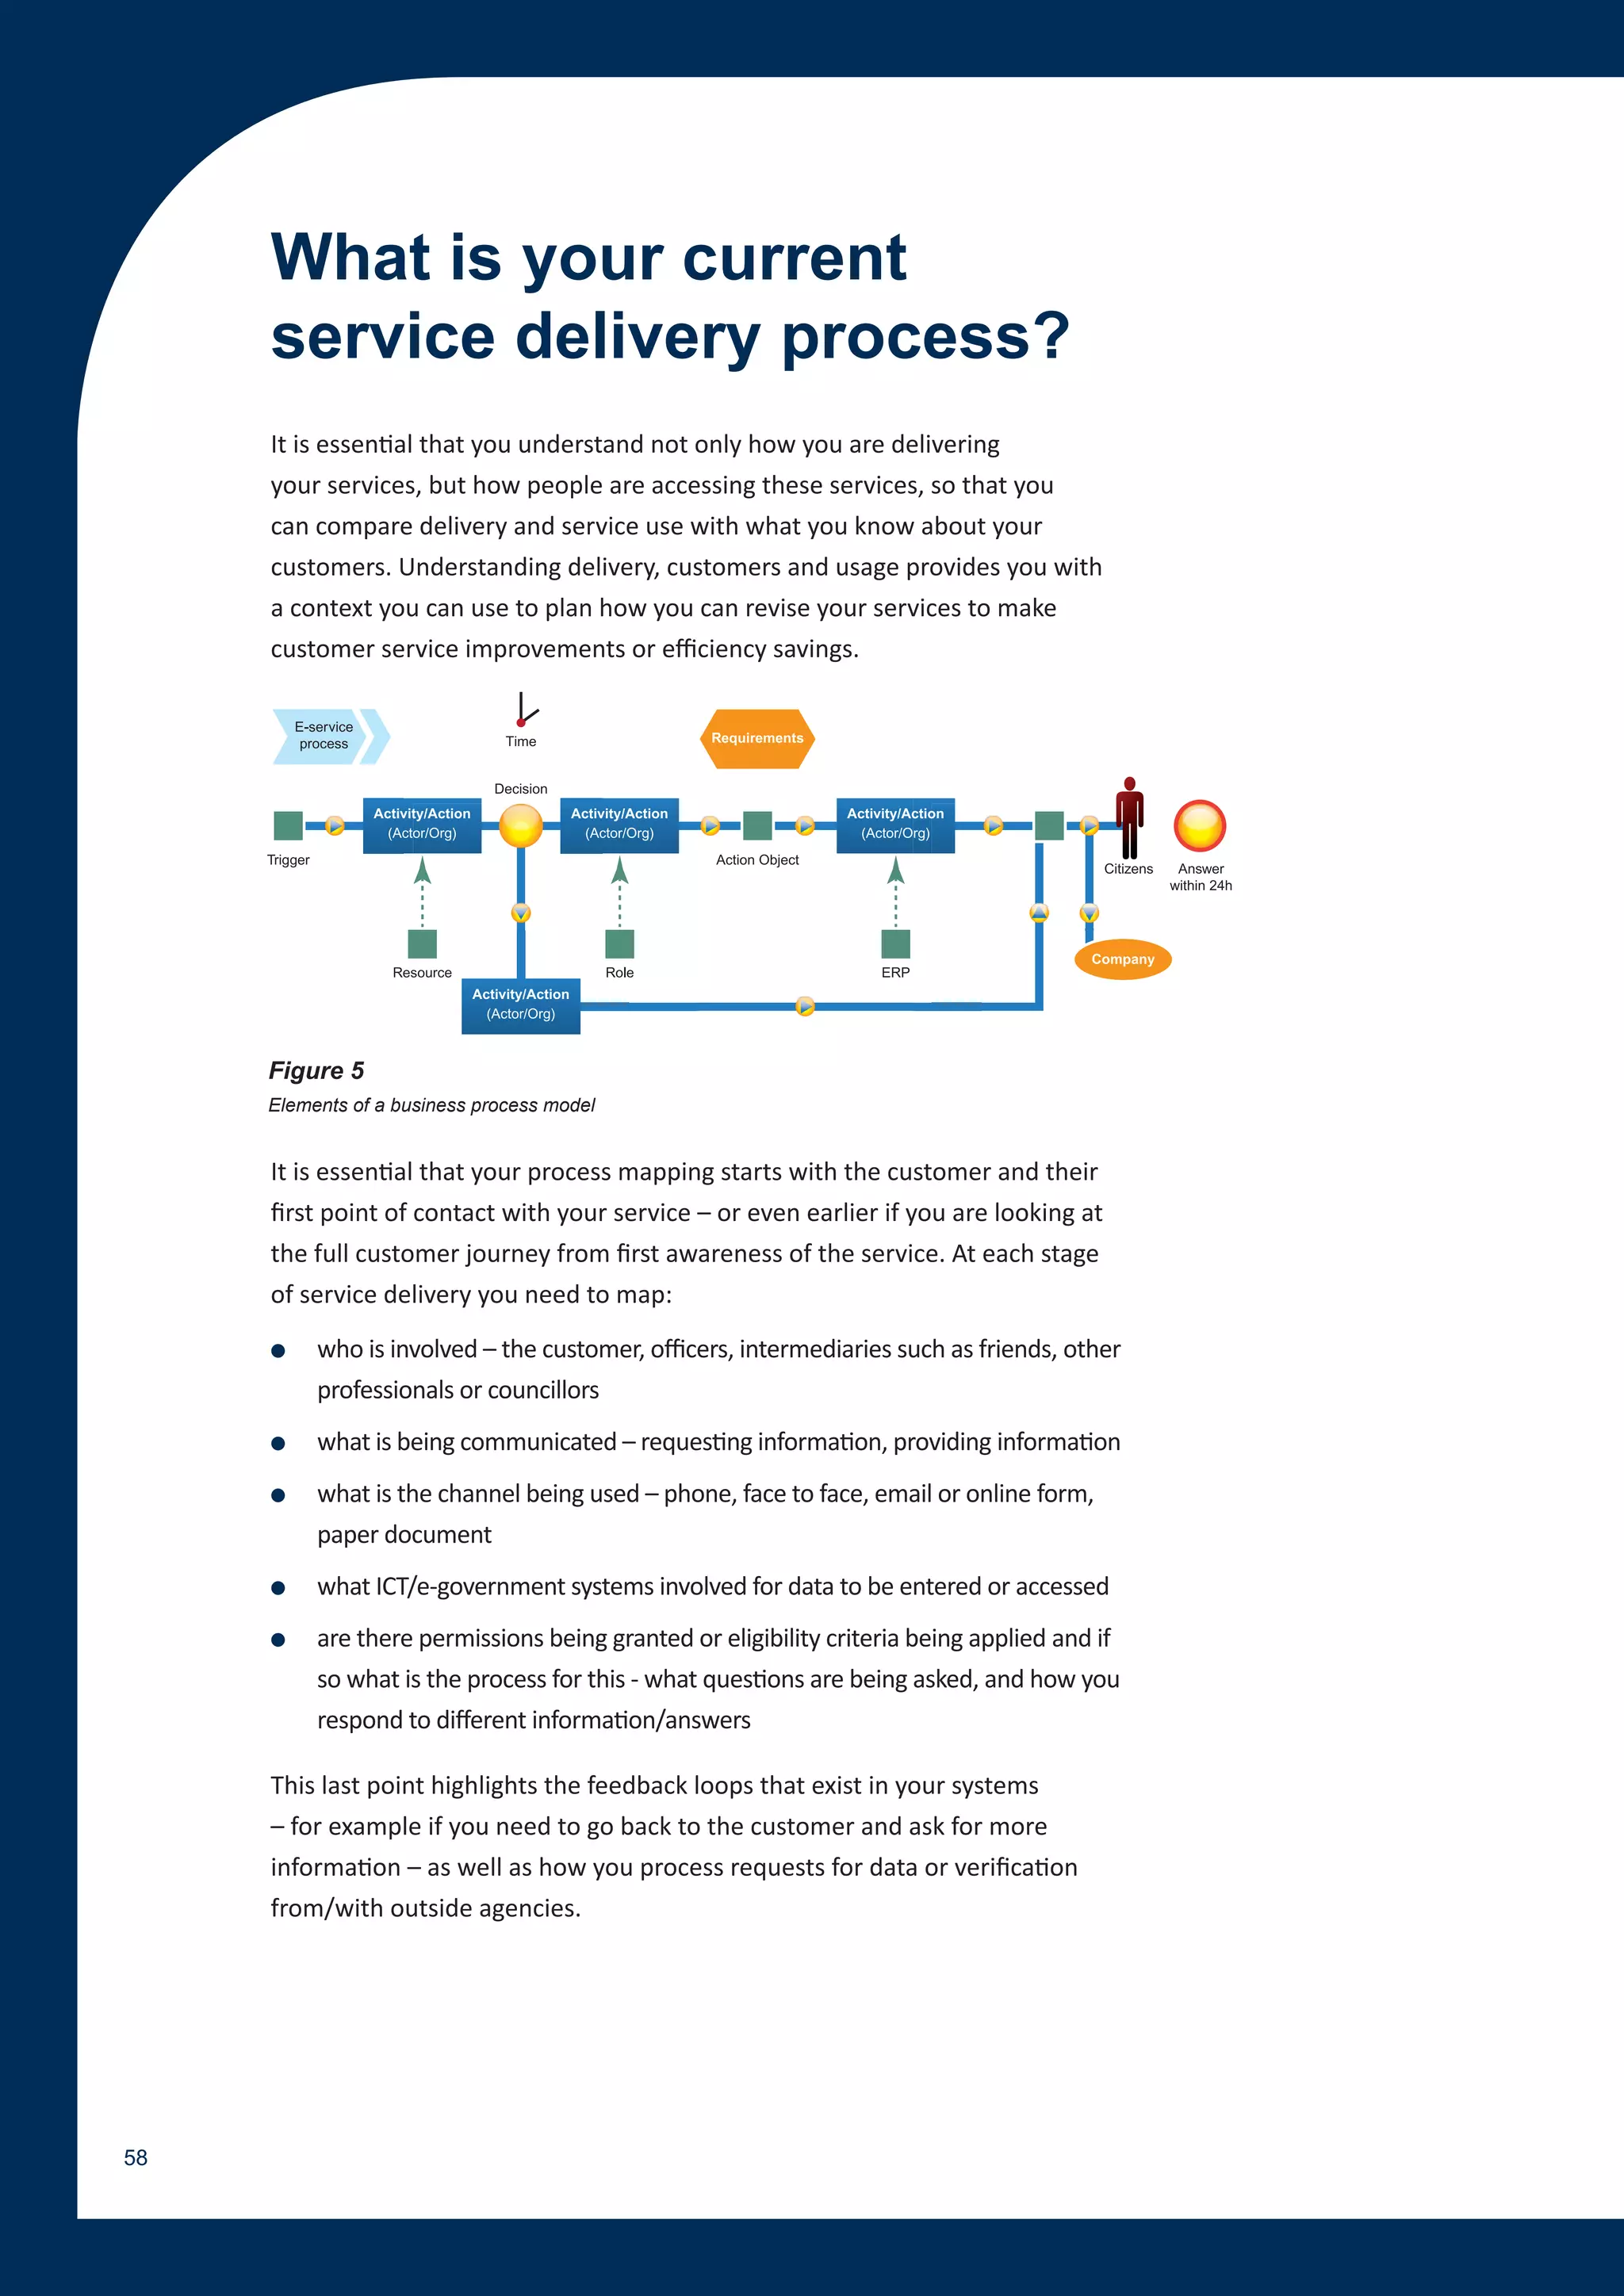
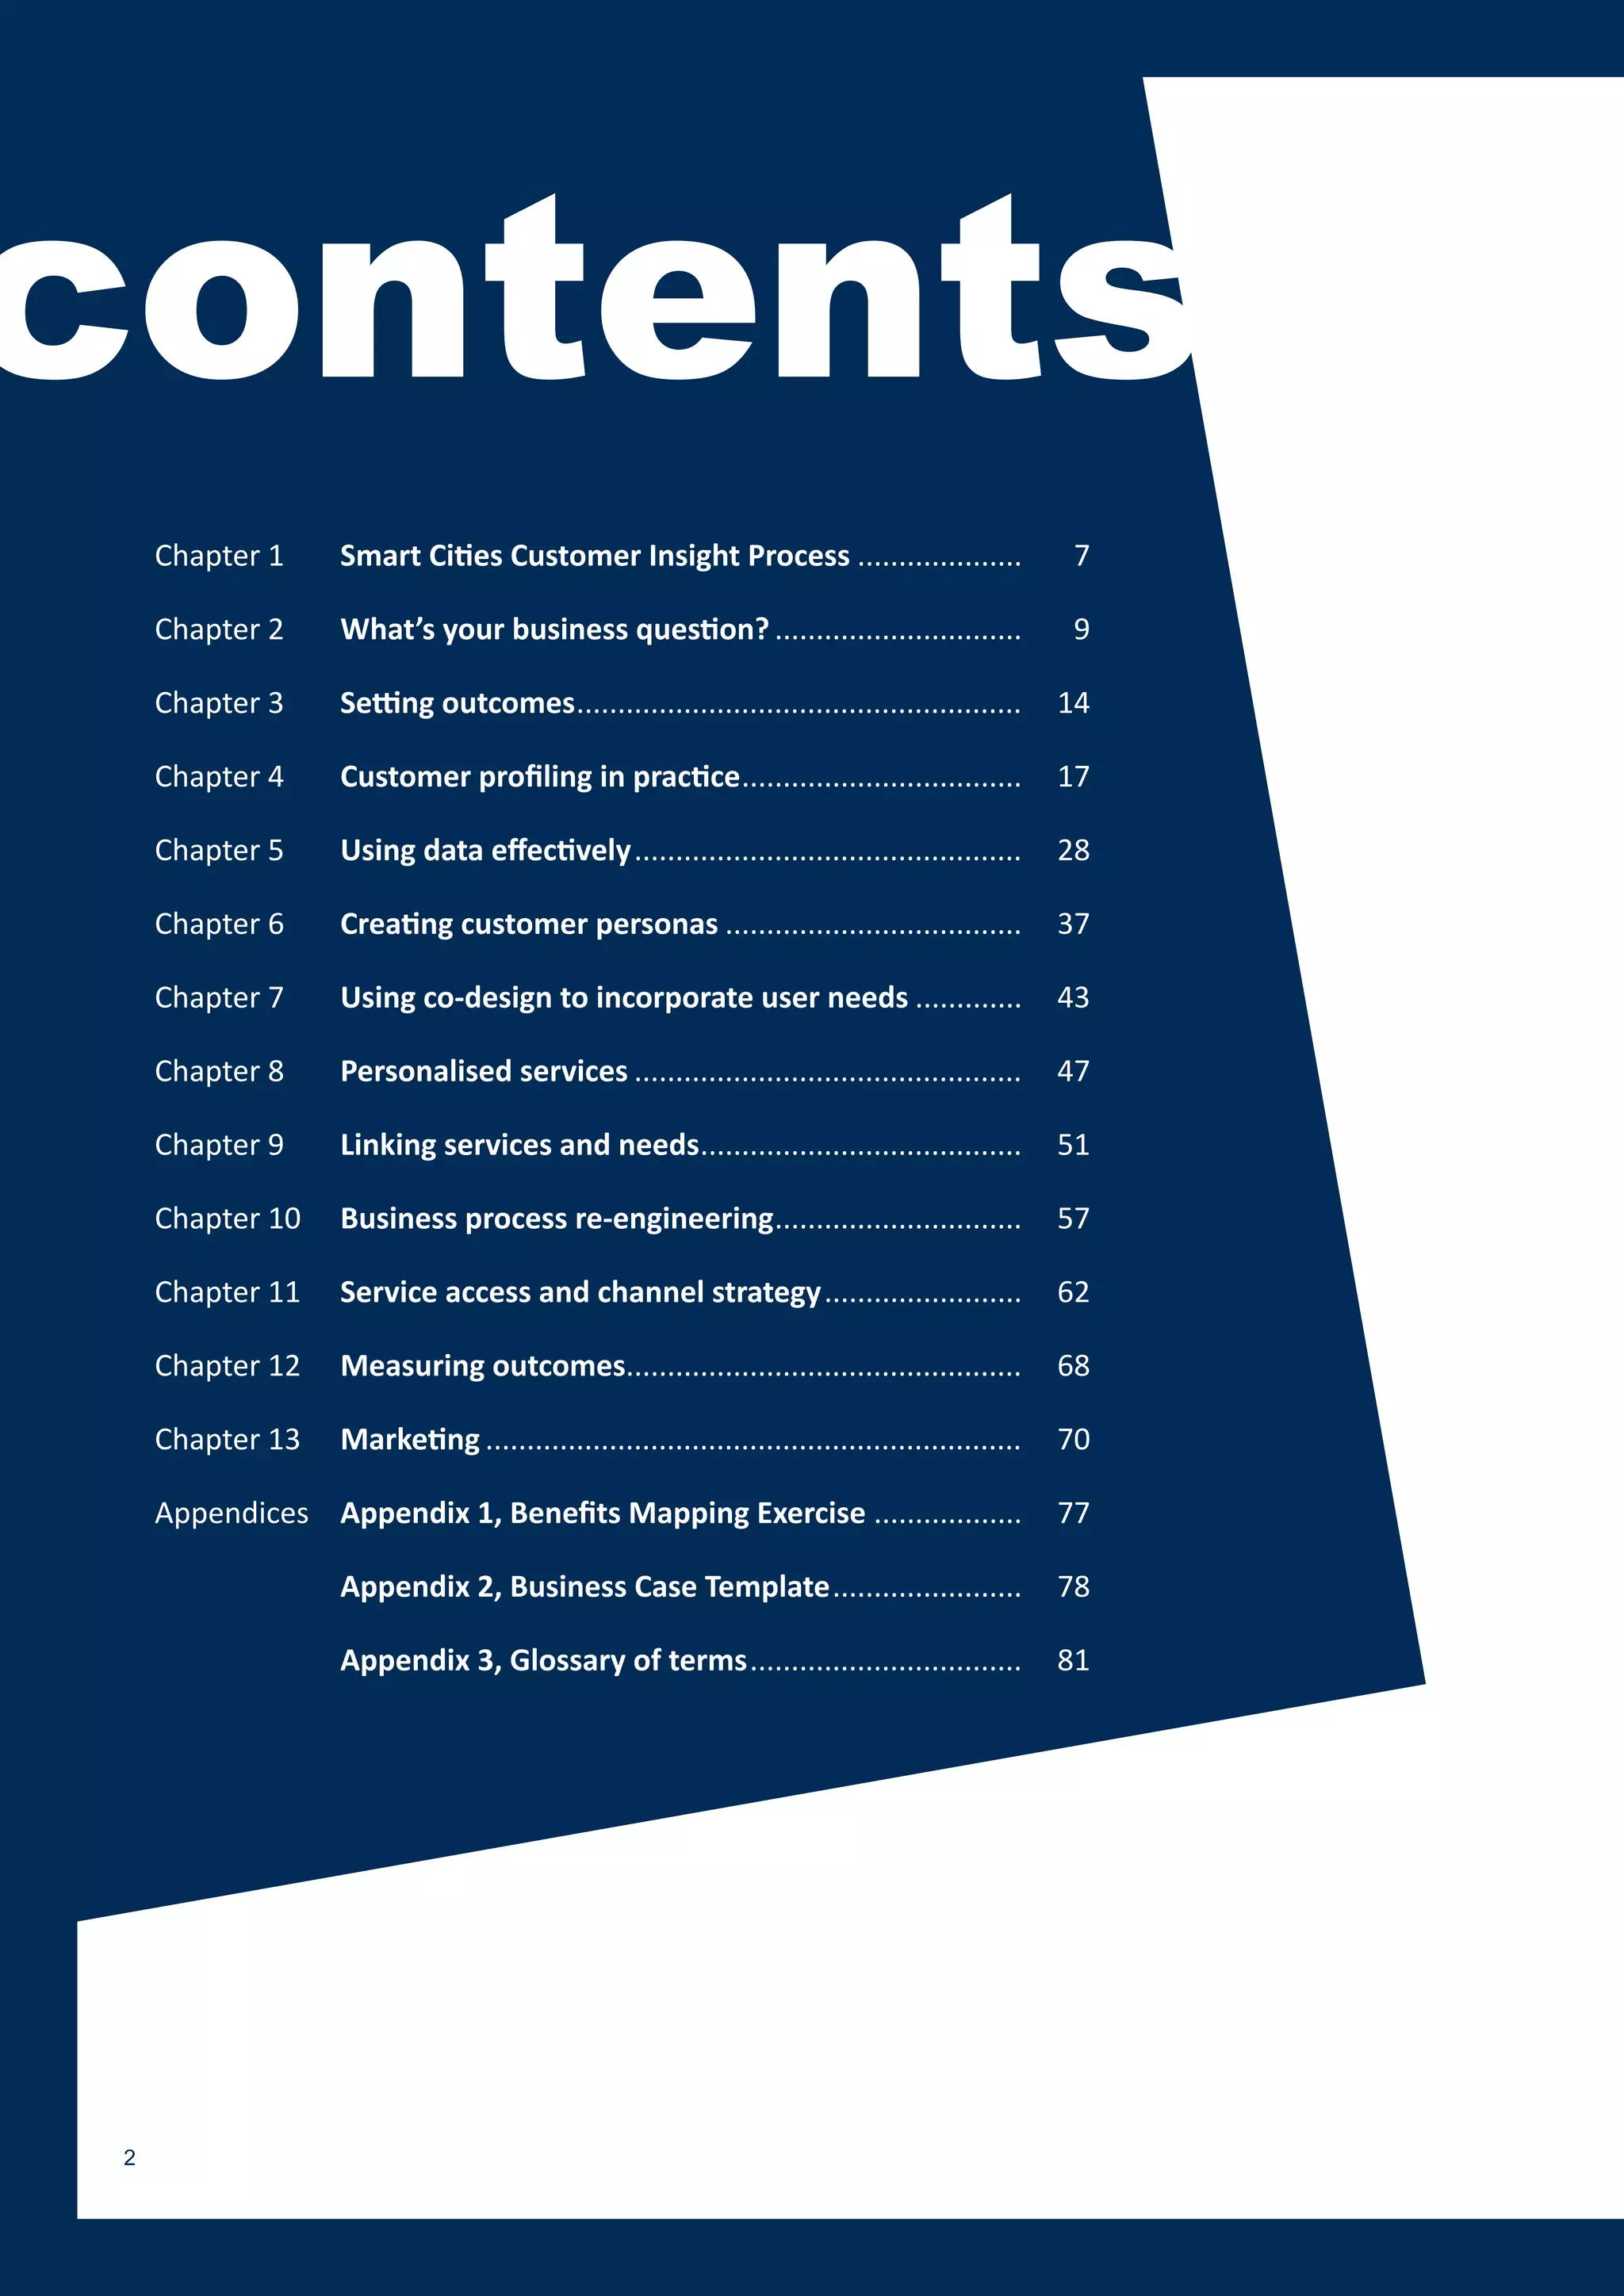
Do you understand your customers? Your citizens? The communities you’re trying to help?
Customer Insight - working to use data and evidence to better understand citizens and communities - is a key tool for municipalities to use if they want to deliver better, more targeted and more effective services to communities and citizens.
Smart Cities - a guide to Customer Insight Profiling and Service Design
1. an innovation network helping cities
develop better electronic services
Customer Insight
Profiling and Service
Design Guide
2. contents
Chapter 1 Smart Cities Customer Insight Process .................... 7
Chapter 2 What’s your business question? .............................. 9
Chapter 3 Setting outcomes ...................................................... 14
Chapter 4 Customer profiling in practice .................................. 17
Chapter 5 Using data effectively ............................................... 28
Chapter 6 Creating customer personas .................................... 37
Chapter 7 Using co-design to incorporate user needs ............. 43
Chapter 8 Personalised services ............................................... 47
Chapter 9 Linking services and needs....................................... 51
Chapter 10 Business process re-engineering.............................. 57
Chapter 11 Service access and channel strategy ........................ 62
Chapter 12 Measuring outcomes................................................ 68
Chapter 13 Marketing ................................................................. 70
Appendices Appendix 1, Benefits Mapping Exercise .................. 77
Appendix 2, Business Case Template ....................... 78
Appendix 3, Glossary of terms ................................. 81
2
3. introduction
Do you understand your
customers? Your citizens? The
communities you’re trying to
help?
Customer Insight - working
to use data and evidence to
better understand citizens and
communities - is a key tool for
municipalities to use if they want
to deliver better, more targeted
and more effective services to
communities and citizens.
3
4. This document outlines the customer insight process - it shows how to do
customer and community profiling, and how these tools will help you to
better understand your clients and communities. This document is just one
of a number of outputs from the Smart Cities project, which focuses on using
e-government tools and techniques to improve service delivery.
The Smart Cities project is an innovation network made up of thirteen
governments and academic partners from six countries that is working to
improve the development and take-up of e-services and e-government
across Europe’s North Sea region. Project partners are improving e-service-
delivery by rethinking the basics of service delivery, by changing their
innovation methodology, by transferring their best practices to other project
partners, and by working with academic and research partners.
The municipalities in the Smart Cities project have used a wide range
of geographical, transactional, demographic and survey data to better
understand citizen’s needs and to reengineer services for communities.
This has allowed partners to identify and use the most appropriate service
channels for different target groups, and to proactively provide services that
will meet their needs.
When combined with co-design approaches, this will allow municipalities
to use a strong mix of information and established best practices to better
understand their customers and to identify the most appropriate channels
for service delivery.
This guide is based on the lessons that have been learned by the Smart Cities
partners and their UK colleagues. We would like to thank everyone for their
generous help and co-operation.
Tim Anderson
Tim Anderson was until recently the e-Service Officer for Norfolk County
Council where he was involved in many EU and UK e-government projects
including being a board member in all strands of the UK’s national local
e-government programme. A former journalist, he is the author of the Smart
Cities Customer Insight Guide.
information
www.cabinetoffice.gov.uk/public_service_reform/innovation/
resources.aspx
www.westmidlandsiep.gov.uk/download.php?did=1866
A comprehensive study of using customer insight in the context of Total
Place has been carried out by the Department of Communities and Local
Government has been published at,
www.communities.gov.uk/publications/localgovernment/
4 spendcountcustomerinsight
5. information
In the UK customer profiling is part of the Customer Insight process, and general
information about this can be accessed at the website of the Cabinet Office. A
comprehensive study of using customer insight in the context of Total Place has
been carried out. Total Place is a programme supported by the UK’s previous Labour
Government and continued by the new UK’s new coalition government. Total
Place looks at what public and voluntary sector partners in a local area spend on a
particular group of people or issue, to see if how they can do this more effectively.
A number of pilots have been funded by Central Government and the Regional
Innovation and Efficiency Partnerships, and the learning
Customer journey planning
case study
for people leaving prison
Lewisham used customer journey planning to identify the range of services
that are available for people leaving prison and to find ways to better align
them. As well as improving the customer experience, it was able to target
resources from Probation Services to those who were felt to be the most
likely to re-offend, and to provide rehabilitation courses to meet each
individual’s needs and skills. Bradford Council has also studied this issue,
alongside that of other types of people who were leaving institutions – such
as people leaving health care and young people leaving the care system.
Annabel.saunders@lewisham.gov.uk
Identification of future
case study
unemployment hotspots
Central Bedfordshire and Luton councils combined the information they had
on people claiming various benefits to identify hot spots with high levels
of claims and also future hotspots where there were areas of potential
unemployment. This enabled them to redesign services around their needs -
such as neighbourhood plans.
sue.nelson@centralbedfordshire.gov.uk
5
6. Improving services for
case study
vulnerable families
Croydon developed 10 customer journey maps for vulnerable families.
This gave them a richer picture of what life was like for local families, and
helped improve customer satisfaction from its low level of 42% to 45%. One
element was Croydon Xpress – their participation service for young people
which used a range of online and offline tools to tackle issues such as those
faced by families with severely disabled children. It found that families
needed better coordination of services and more respite care.
graham.cadle@croydon.gov.uk
Using a Network
case study
of older people for
consultation
Bournemouth and Dorset councils and their local partners looked at the
needs of older people through their Citizen’s Panels and through a series of
focus groups, which have been developed into a network of older people for
consultation and research.
6
8. Policy Objectives: increasing efficiencies and improved customer service
Smart Cities Customer Insight Process
Smart Cities Process
Population Data What is the Customer Data
• Explicit business question? • Service specific
• Implicit • Comparable services
Customer Profile
User needs co-design
Personalised Services
Community Profiles
Maps Services
against needs
Process List
Business Process
Re-engineering
e-Government tools
Access/Channel
Strategy
Web
Face to face Phone
Intermediaries
Training
Marketing
Key
Processes
Outputs
Measure and evaluate
Inputs
8
10. All work needs to have a business question or objective. The two key reasons
for improvement are:
Improving customer service
● increasing the take up of services among key groups to achieve targets
● making it easier to access services
● giving a better service
● giving a service targeted to individual needs
● giving access to a broader range of services
Improving efficiency
● increasing take up among key groups to increase income
● increasing early take up and reducing more expensive interventions later
● improving processes to streamline services and reduce costs
● switching customers to more cost efficient channels
The definition of a business question should include the specific services
involved. Where possible, this list of services should link to relevant service
lists, so municipalities can take advantage of relevant information held
elsewhere - e.g. within the esd toolkit in the UK - such as existing customer
profiling and process mapping work which has been done by other local
authorities.
Figure 1
Libraries service –
Decision tree for increased service take-up
10
11. In the Kortrijk region in Belgium a website provides information on childcare
examples
availability so that parents can find provision that suits them. However,
the local councils know that there are some groups of people who are not
getting childcare, and who therefore are not able to start work. These tend
to be families on low incomes or new ethnic communities.
The business question these councils had was “How do we get more children
from low income families into childcare?” This question is quantifiable - you
can measure the level of service take up before and after an intervention. Its
key aim is to increase the take up of child care by a targeted group.
What Leiedal, the regional body doing the customer profile project, now
needed to do was to identify what the research questions were which
supported this business question. The first was “who and where are the
groups who are not taking up childcare?” This required research to find out
where there were families with children who were eligible for childcare but
who were not getting it.
The second question is “Why are they not accessing childcare?” This could
be for a number of reasons:
● They do not know it is available
● They cannot afford it
● They cannot use the online system
● They cannot find childcare suitable to their needs – age, cost, location
● They are using other childcare facilities that are not on the system
Once you find out the answers to these questions you can decide what sort
of intervention is needed – is it a marketing issue, are there problems with
the online registration system, are there concerns about the availability
or suitability of childcare, or is this not really a problem because there is
alternative childcare provision available? The research also needed to tell
them how big the under-use problem was, and what the unit cost of any
changes may be. To determine if it was cost effective to make any changes,
they also needed to know the cost of not intervening - e.g. what is lost to
the system through underemployment and welfare benefits of people not
getting into work.
The Smart Cities project has developed a series of Project Documents based
on PRINCE templates which will be useful in defining the business question
and the customer profiling project.
www.smartcities.info/projects
11
12. The esd toolkit
case study
customer profiling project
A number of authorities participating in the esd toolkit customer profiling
project have achieved significant cost savings as a result of customer profiling:
● Coventry improved its collection of council tax arrears by £700,000 in one year
● Tower Hamlets reduced attendance at Accident and Emergency services
by 6% saving around £500,000
● Colchester increased take up of direct debits for council tax payments by
2% and Wear Valley had similar success
The project also uncovered “nuggets” of customer information for councils:
● Elderly customers often applied for disabled bus passes rather than
elderly bus passes
● There was a high take up of free services from affluent groups who could
afford to pay for them
● People were still using face-to-face or postal access to services when
they would be happy to use other channels
● People on low incomes are low users of libraries - except where they are
a minority in largely affluent areas
Cost per 1,000 Annual savings per Annual savings per
households 1,000 households 1,000 households
Payment channel Unit payment cost (estimated on from direct debit from Bank over
10,000 instalments (over alternative alternative methods
per year) methods)
Direct Debit £0.04 £400 n/a +£500
Bank £0.09* £900 -£500 n/a
LA Cashiers £0.73 £7,300 -£6,900 -£6,400
Post Office £1.44 £14,400 -£14,000 -£13,500
Counter
Figure 2
Calculating the cost of service delivery across different channels
* The cost of bank payments are £0.09 per cheque or £0.09 per £100 if paying by cash. £0.09 is being used for simplicity.
12
13. Motivating people to
case study switch to direct debit
Wear Valley Council wanted to get people to switch to using direct debit
to pay their council taxes, and profiled their citizens at at ward and
case study
neighbourhood levels. This allowed them to identify areas where people
who were willing and able to use different service channels still paid their
council tax in person. The MOSAIC profiles they used allowed them to
see what sorts of media those groups used most so they could design an
effective marketing campaign.
information
The findings from this work – together with work by East Herts, Plymouth and Nuneaton
and Bedworth were developed in an esd toolkit workshop, when a model of how to
tackle this issue was developed,
http://esd.org.uk/esdtoolkit/News/NewsDetail.aspx?Item=622 .
Reducing motorcycle
case study
accidents
Norfolk County Council profiled the people who were involved in motorcycle
accidents in the county. These 1% of road users were 31% of road casualties.
Using MOSAIC - a commercial customer profiling tool - they identified the
groups which were most at risk - young and middle aged men. Norfolk then
commissioned a marketing campaign that was aimed at these at risk groups
and which used the information channels they were likely to use, as well as
targeting areas where they were most likely to live in the county to reach
them with the THINK message.
information
The video is at,
www.youtube.com/user/NorfolkCountyCouncil#p/u/35/Q9KxwPM7asU.
13
15. What are the types
of outcomes?
Whatever the business reasons for customer profiling, they need to be
definable and quantifiable. If you want to increase take up of a service by
different target groups, you need to know how many people are in that
group, whether can you define them by age, gender, income, or other
criteria, and by what number or percentage do you want to increase their
take up of services. Whatever target you set needs to be measurable if you
are to be able to show whether you have delivered your outcomes.
You also need to know whether or not you require your customers to change
their behaviour - i.e. how they use your services - or whether you are
informing them of services that are available. Behavioural change means you
want them to do something differently. This may be something as simple as
getting them to go online to find information or to access services, or you
may be trying to deliver more fundamental changes - such as encouraging
healthy exercise or stopping smoking.
Informing customers about services lets them know that services which you
feel are relevant to them are available, in the hope that this will drive the
adoption and use of services. These efforts can range from advertising the
completion of a new country walk in their area, or something as complex
as trying to get citizens to talk to professionals if they feel their child needs
extra help to help them achieve their potential.
information
In England there are National Indicators (NIs) which set out the outcomes central
government expects local agencies and partnerships to deliver, and how these should
be measured. Wherever possible, you should try and link the outcomes you want to
achieve to these NIs or to other pre-existing local indicators that your authority or
partnership uses.
www.communities.gov.uk/localgovernment/performanceframeworkpartnerships/
nationalindicators
15
16. Once you have decided what the project is, you can set short-term, medium-
term and long-term goals. In the Leiedal example a short term goal may be
raising awareness of the availability of an online childcare tool, a medium-
term goal might be getting more people from lower income groups to access
childcare, while a long-term goal might be getting more people from these
groups into work and out of the benefits system.
The goals you have may not just be about increasing things – they may also
be about reducing inequalities - such as the income gap between low-
income families and ‘average’ families.
One way of quickly establishing what benefits or outcomes are relevant to
different key stakeholder groups is to use a balanced scorecard approach,
which will show different aspects of what will be delivered and by who.
This example shows a balanced scorecard analysis for efforts to increase
the use of the Common Assessment Framework (CAF) in Norfolk to improve
early intervention.
Service/Customer Performance
● Families get the help the need ● Will improve performance
sooner against a large number of
● Families offered a broader range National Indicators in the
of relevant services medium to long term
● Greater take up of the common
assessment framework
● Better scores in OFSTED (Office
for Standards in Education)
inspections
Staff Financial
● CAF training targeted at staff and ● Supports more effective and
partners most likely to benefit efficient commissioning
information
A more rigorous approach is to do a full benefits mapping exercise. An
example can be found in the mynorfolk bid at www.my.norfolk.gov.uk/
mynorfolk/our-bid.htm from page 48 onwards. A sample benefits map is
attached as Appendix 1.
16
18. Customer segmentation
Customer segmentation is the practice of dividing customers into groups
of individuals that are similar in specific ways - such as age, gender,
interests, spending habits, and so on. Customer segmentation allows service
providers to target groups effectively, and to allocate marketing resources
appropriately.
Figure 2
The service profiling process
There is a significant opportunity for local government to improve its
performance through the effective use of customer intelligence. Customer
information is an underutilised resource, and its value as an ‘asset’ that
can be used to drive improvements to service and performance is not
sufficiently recognised by local government. There is increasing pressure for
local authorities to demonstrate that they can pro-actively identify customer
needs and demonstrate how those needs are being met. Measuring
performance in terms of impact on customers and their views will become
an increasingly important feature of performance management. It is unlikely
that the council of the future will be seen as regarded as performing well
unless it is using customer information to drive and measure performance.
Furthermore, financial constraints on local authorities, together with the
possibility of limited increases in tax revenues over the medium term
requires local authorities to think about prioritising services and methods
of service delivery. It will be hard to do this effectively and even harder to
justify performance levels without reference to hard data about customers’
use of services and their channel preferences.
Citizens may be segmented by a range of different profile characteristics,
including age, ethnicity, sexual orientation, ability/disability, gender, level of
affluence and state of health.
18
19. Segmentation is often used in conjunction with customer profiling, but
there are some differences between the techniques. For instance, customer
profiles are not suitable for identifying certain population segments: people
with disabilities for example are usually distributed across a wide range of
neighbourhoods. Similarly, it is not advisable to use gender distribution as
theme for neighbourhood segmentation. For other factors - such as age and
ethnicity - composite profiles can only support broad general analyses.
Who are your customers?
Service providers should have some customer data: information about who
your customers are. This knowledge will be either:
● Explicit – you will have records of who has or is currently using a service
- for example from a CRM system or other records
● Implicit – using the knowledge of staff or partners who are dealing with
customers to delivering the service.
information
A useful audit tool for what data you have is www.westmidlandsiep.gov.uk/
download.php?did=1181. Even if this is a new service, you should be able to make
an educated guess about the types of customer who may use it, based on who uses
existing services which target similar customer groups.
If you have no knowledge about your customers or your knowledge is sketchy, you
can always carry out market research – probably using qualitative techniques (such as
in-depth interviews or focus groups) rather than quantitative ones (such as surveys) so
that your service can be discussed with potential users.
information
A guide to customer profiling produced by Smart Cities is www.smartcities.info/files/
Smart_Cities_Research_Brief_Customer_profiling_to_target_service_delivery.pdf
There is also a UK guide to customer segmentation at
www.cabinetoffice.gov.uk/public_service_reform/innovation/segmentation.aspx
19
20. Explicit information
If you have explicit information about your customers you can convert it
into a customer profile. This can be done either by extracting other data you
have about those customers (age, gender, income, etc.) from your customer
records or by comparing the addresses of customers with other data you
have about those addresses or areas.
information
One way to do this is to use a commercially available customer profile, such as Experian’s MOSAIC or CACI’s
ACORN. These profiles use a wide range of public and private data sources to identify different socioeconomic and
lifestyle groups (e.g. ‘new homemakers’, ‘suburban mindsets’, ‘active retirement’ and ‘careers and kids’) through
sophisticated cluster analysis and market research techniques. You could then use a spreadsheet or database to
look up the MOSAIC or ACORN profile of your customers’ addresses and compile a table showing their distribution
across different customer profiles.
High
A B C D
Sophisticated Bourgeois Career Comfortable
Singles Prosperity and Family Retirement
Affluence
Routine Service Hard Working
E Workers F Blue Collar
G H I J
Metropolitan Low Income Post Industrial Rural
Strugglers Elders Survivors Inheritance Figure 3
Low
Experian Mosaic global profile groups
Urban Rural
This can also be done with population data: you can download census-style socio-economic information about
small areas e.g www.statistics.gov.uk/hub/population/index.html If you aggregate your customer records to the
geographical areas used in the census data (in England this would be Super Output Areas) you can then calculate
the percentages of customers who have the various characteristics you are exploring.
If your implicit information suggests a customer group also use other
services which you have records for, your can use the data matching
approaches described above to create a profile which says “x% of people
who use service A also use service B”.
In addition to statistics and data which are available locally or nationally,
there may be further explicit information available about your customers in
academic or commercial analysis based on primary research with citizens.
Although this will probably have been done with customers in areas other
than your own, the patterns of behaviour of similar citizens are likely to be
equally applicable to people in your location.
20
21. Implicit information
Implicit information - the knowledge and experience of customers of your
staff - can be turned into a more formal profile by using workshops and/or
questionnaires to ask staff what they think customers are like against key criteria
- e.g. from census style information, customer profiles, or other services they
use where you do have more specific address based customer data.
Even if you have explicit customer information, you should ask staff for their
views of customer characteristics as this will help round out a picture of
● who your customers are
● why they use the service
● how they use the service
● what their other needs are
● what other services they need
● who could or should use the service but doesn’t
This can be done either by a survey – if you have specific questions – or by a
workshop or focus group if you want to ask more open ended questions.
You may also want to use the same techniques to ask questions of the
customers themselves as part of the customer co-design process.
information
A useful guide is www.demos.co.uk/files/File/CollabWeb.pdf If you can contact
existing clients, or have an idea of the sort of people who are potential clients, you
can also organise a focus group to find out more about their needs and behaviours.
A guide to understanding demand for services is www.smartcities.info/files/Smart_
Cities_Research_Brief_Measuring_levels_of_supply_and_demand_for_eservices_
and_egov_0.pdf
21
22. What do you already know
about your customers?
You need to try to identify all the information you already might have about
your customers. In addition to the information identified above, you should
remember that the customers of your service may also be customers of
other parts of your organisation or of partner organisations. For example,
you may want to encourage new parents take parenting classes to help them
look after their babies. You may only have basic information about them as
new parents – perhaps from the health service or from birth registrations.
They may however have older children and those children’s schools may
have more information about them and their families. The parents may also
have had other contact with the health sector or with adult social services –
for example for disability or receipt of benefits.
It is important that you do not try and cross reference too much information,
but stick to information that is relevant to your business question. There
are two reasons for this. Firstly, you do not want to make the analysis too
complex or to take up too much time or resources. Secondly, you need to
consider privacy and data protection issues carefully when collecting and
comparing information. Where possible you should make it clear you will
be re-using information for this reason when you collect it and gain explicit
consent for this re-use.
The key thing with all information you use when customer or community
profiling is that your data should have a geospatial reference and that it
should be as “clean” as possible. Records that have lots of incomplete or
inaccurate data should be avoided. If you are planning on doing a lot of data
analysis (and not just customer profiling) your organisation should have good
data quality processes and training in place.
There are companies and software that will carry out bulk data matching and
identify those records which are incomplete or where possible matches have
to be checked - e.g. is ‘John Smith’ the same person as ‘J.S. Smith’ and is ‘The
Laurels, Coronation Street’ the same as ‘12 Coronation Street’.
Not all data will be able to be cleaned and matched precisely, even
when using the techniques described above. A technique called “fuzzy
mapping” takes customer data and cross references it with other known
characteristics. The areas where there are the largest clustering of values
show the most likely characteristics of that customer group, and this can
then be attributed to them as an expected characteristic.
22
23. What more can
you find out?
As mentioned above, there may be information available in other parts of
your organisation or in external organisations which is relevant.
Other tiers of government will often have data sets which are geospatially
referenced and which can be downloaded or requested from them. The
EU directive on re-use of public sector information is a good lever to use
to persuade partners to share information – especially if you can then
reciprocate with your data or analysis. A list of data sets for each country has
been developed.
There are also commercially available data sets and companies who carry
out research and/or data matching. It may be possible to purchase data or to
commission these companies to do research or analysis for you.
information
esd toolkit in the UK has the Local Government Business Model http://doc.esd.
org.uk/#/?tab=data-lgbm which links to the Local Government Service List http://
doc.esd.org.uk/lgsl/3.07.html to show which groups access which services. Some
services have already been profiled by other UK local authorities against MOSAIC
customer types, so you can see what the typical pattern of service use by these
groups is.
23
24. Housing Benefits
0 50 100 150 200 250
Care at Home
0 50 100 150 200 250
Free School Meals
0 50 100 150 200 250
Figure 4
Propensity graphs by UK profile group for social services
Key
A - Symbols of Success E - Urban Intelligence I - Twilight Subsistence
B - Happy Families F - Welfare Borderline J - Grey Perspectives
C - Suburban Comfort G - Municipal Depenency K - Rural Isolation
D - Ties of Community H - Blue Collar Enterprise
24
25. case study Identifying demand for
new library services
Nottinghamshire County Council wanted to open a new library and a one
stop shop and used customer profiling to identify current and potential
demand. This found that that one ward had twice as much library usage as
any other, and that one locality had a higher number of residents than was
expected living there, and so needed a one stop shop.
Increasing the use
case study
of direct debit for
council tax payments
East Northamptonshire Council wanted to look at two issues – increasing
the use of direct debits to pay council tax, and reducing the number of rats
in the area. In both cases they uploaded and profiled service use onto the
esd toolkit to identify areas which had the highest potential for change. They
were able to identify which people with council tax arrears were most and
least likely to be able to pay via direct debit, and targeted a letter campaign
at those who could switch to direct debit payments. This included adding the
option for people to set up a direct debit by phone in their call centre. They
used the evidence they had to identify areas where rats were likely to breed,
based on the locations of fast food outlets and drainage sites, and then
baited those areas with traps.
25
26. Understanding young
case study
people’s attitudes
to alcohol
The Department of Children, Schools and Families carried out large scale
quantitative research about the attitudes of people to their children (and
children to them) and how to bring them up to create customer segments
covering parents and parenting. These were then used to develop policy
action plans, including one on young people and drinking. They carried out
further qualitative research with a group of 380 young people and their
parents into their attitudes to alcohol. As well as innovative focus group
work using artwork to stimulate discussion, they observed how young
people behaved when they were outside the home. Cross referencing
attitudes to drink to the segmentation helped develop a marketing plan
based on which information, messages and media would work with different
groups.
sara.jones@dcsf.gsi.gov.uk
case study
Designing the route of a
mobile healthy food store
NHS Great Yarmouth and Waveney used information about their population
to identify where the people most at risk of a heart attack or stroke, or those
who had diabetes, lived. They mapped this data against MOSAIC customer
profiles to see which customer profiles were most likely to eat less than one
piece of fruit or vegetables per day, and then used this information to design
the route of a mobile food store that offered fruit and vegetables; recipes
and cooking lessons; and links to other services like stopping smoking,
weight management, and food co-operatives.
sarah.barnes@nhs.net
26
27. case study Identifying young
people who are likely
to be in debt
Colchester Council used MOSAIC profiles to identify young people who
were likely to be in debt. Information in the MOSAIC profile showed they
would rather support came to them rather than go to Council Offices, so
a mobile information service was set up which supported more than 500
residents with on the spot advice. The routes taken by the mobile service
were designed using information from the customer profiling work.
www.colchester.gov.uk/survivethecrunch
chris.reed@colchester.gov.uk
27
29. Data Collection
Even if you do not currently have good sources of data, you can take
steps to collect it for the future so that you will be able to do better
customer profiling work. This will also help with general management
information about the way you deliver services.
There are a number of elements you have to think about:
● Data standards and formats – collect the same information in
the same way – use a common way of writing the answers to the
same questions such as name, address, age, etc.
● Data quality – provide training and instructions and guidance for
staff who are collecting data so they understand the importance
of your data standards and make sure records are complete and
filled in as early in the contact chain as possible.
● Data use – make sure you understand the range of things you
may use customer data for in the future and ask people when
you collect data if it can be used for those purposes in the
future. By asking permission for future re-use of data you can
address privacy and data protection concerns. Remember data
can be anonymized or aggregated in ways that do not identify
individuals, and data access restricted to a small number of
authorised people.
Wherever possible you try to tackle these issues with partners and try
and use common standards so that it is easier to compare data from
different sources to enrich the view you all have of the people you serve.
information
Guidance about these is available at
www.audit-commission.gov.uk/SiteCollectionDocuments/Downloads/
ImprovingInformationToSupportDecisionMaking.pdf,
www.idea.gov.uk/idk/aio/9048091 and
www.everychildmatters.gov.uk/resources-and-practice/IG00340/
29
30. The limits of data
It is important to remember that customer profiling links customer data,
addresses (etc.) with statistical profiles of areas. This technique will tell
you how probable it is that individuals will belong to particular groups and
display particular types of behaviours: however there is no guarantee that
this will definitely apply to any particular individual. A 60% likelihood that a
young person who regularly misses school will leave with poor qualifications
(for example) means that 40% of young people who regularly miss school
will not leave with poor qualifications.
Collecting data
case study
about customers
of municipal services
In 2009, Leiedal sent a survey to around 1,600 registered users of the
municipal websites in the Kortrijk region. This survey explored Internet use
and was then compared with web statistics.
The survey demonstrated that most of the registered visitors used municipal
websites for news, contact information and opening hours. This confirmed
the original decision to give news and contact information a central place
on these websites. As a result, service opening hours were made more
prominent in the website menu structure.
When asked to designate priorities for new web/internet service
developments, respondents asked for the following:
● to receive e-mails when road works are being carried out
● to be able to report problems to the local authorities
● to receive e-mail notifications of the collection of bulky waste
● to book tickets for performances and events
● to receive an e-mail when the lending period of a library book expires
30
31. A survey was also sent to citizens who had accessed Kortrijk’s services
case study (cont)
online. The survey indicated high levels of user satisfaction and that the
main motivation for using the online service point was to do transactions at
home without having to travel to municipal offices.
In early 2010 the municipalities of Waregem, Harelbeke, Wevelgem, Zwevegem,
Kortrijk and the Intercommunale Leiedal commissioned MEMORI (Mechelen
University College) to survey more than 3,000 residents of their municipalities.
The survey explored the use of different channels for information and service
provision and examined satisfaction with municipal services.
It found:
● The digital divide still needs to be addressed
● Local authorities need a channel strategy
● Local authorities need to focus on online transactions
● The need to optimise telephone systems and online contact systems
● A need to market service provision.
bart.noels@leiedal.be
31
32. What data is available?
Once you have identified all the potential data sources you should create a
table listing:
● data description (what it tells you)
● data source (where it comes from)
● geospatial level (what is the smallest area covered)
● data quality assessment (how accurate is it)
● whether it is personal or anonymous data
● any restrictions on use
This will then enable you to decide which data sets to use, the level at
which you can carry out the analysis, and what cross tabulation you
want to achieve (for example what percentage of our customers also use
another key service).
Strategic use of
case study
customer information
Birmingham has embedded customer insight into the way it is transforming
the city. A Customer Knowledge Manager has been appointed together with
a team of dedicated analysts to support services. A set of tools – including
a customer database – are in place to manage customer information
strategically. Birmingham sees this as a way to deliver outcome based
planning in service plans.
plan.community@birmingham.gov.uk
32
33. case study Understanding the
preferences and needs
of minority groups
In Herefordshire 11 community volunteers from ethnic and other minority
communities have been recruited to carry out survey work within these
communities, as there are small numbers of minorities in the county and
Herefordshire’s Citizen’s Panel does not represent their views. Despite
difficulties in recruiting researchers from the gay community, they have
found useful information on these communities via quantitative surveys and
focus groups. This includes the services they found most difficult to access,
and the top three things in need of improvement.
In Norfolk, more conventional survey techniques were used to boost the
sample of views from minority groups as part of the national place survey.
The company who managed the survey in Norfolk carried out face to face
interviews with 100 people from EU accession countries, 98 people from
Black and Minority Ethnic groups and 103 Portuguese speakers who have
a significant community in the county. This showed that people from these
groups were generally more satisfied with council services than the “settled”
population and their perception that the county is a place where people
from different backgrounds get on well together.
diversity@herefordshire.gov.uk
33
34. Developing a central
case study
customer intelligence hub
Sandwell’s partners developed a central customer intelligence hub that
covered both the council and the local strategic partnership. This looked at
customer feedback, consultations, customer data, the media and opinion
polls to get a rounded view of customer needs and views. A key element
was identifying the skills the team would need, and making sure any gaps
were filled in areas like change management, customer journey aping and
data analysis. Improvements coming from the team’s work include better
feedback from young people and BME communities, improving the way
children in care are supported when they move or change care placements,
better accessibility for council tax and benefits customers, and a review of
the way customer information is used.
pauline_harris@sandwell.gov.uk
Care teams learn about
case study
patients’ experiences
Luton and Dunstable Health Trust carried out in depth interviews with
patients and staff about their experiences of receiving and delivering care
and asked patients to make films to share their stories. These films were
then used with the care teams designing services to make 43 different
improvements to efficiency, safety and patient experience.
elaine.hide@ldh.nhs.uk
34
35. case study Working with clients with
learning disabilities
Cheshire and Wirral Health Trust did similar work with clients with learning
disabilities to gather feedback on how they could improve service.
kate.traves@cwp.nhs.uk
Using mystery shoppers
and customer inspectors
to improve services
Rotherham Council’s Neighbourhoods & Adult Services Directorate wanted
to see their service through the eyes of their customers. A Customer
Inspection Service made up of 25 real customers meet twice a month to
carry out a range of mystery shopping, reality checking and customer-2-
customer satisfaction testing activities. Mystery Shopping uses people who
pretend to be customers wanting to access a service, and who then describe
the service they get via different channels in terms of not only whether
they got what they needed, but how well they were treated by staff. The
Customer Inspectors award ratings of bronze, silver, gold or platinum to each
customer-facing team, and actions plans are developed to drive forward
improvements. Example outcomes include improved information and
signage in buildings, better information packs, website improvements and
changes in the out of hours service for noise complaints.
jasmine.speight@rotherham.gov.uk
35
36. Local mystery shoppers
case study
test services
Walsall did similar work on mystery shopping by recruiting and training 53
out of the 200 volunteers they received as mystery shoppers. They did this
as partnership between Walsall Council, the Health Service and a housing
group. They then carried out 421 mystery shops at a far lower cost than if
they had employed a market research company. In addition to providing
high quality management information for council services and partners,
the pilot project used local residents (real customers) and staff as mystery
shoppers, fostering greater involvement in service provision and standards
of service delivery. At the same time, this helped increase the confidence,
knowledge and skills of individuals taking part in the research. Whilst the
information gathered via the mystery shopping project has been used to
monitor how services are performing and to make improvements, the
project has also provided valuable insights into how other organisations
deliver services.
sansomanna@walsall.gov.uk
Exploring attitudes
case study
to school absenteeism
Leeds City Council carried out interviews, questionnaires and focus groups
with children, young people, parents and carers to see what their attitudes
to school absenteeism were and how the partnership could help tackle
them. A key finding was that families whose children don’t attend school
often have a range of other issues to deal with, and a redesign of services
is looking at how those additional issues are supported as well as school
absenteeism.
jenny.marshall@educationleeds.co.uk
jon.hannah@dh.gsi.gov.uk
36
38. A good technique for creating a customer persona is to start by imagining an
individual who ‘represents’ or is typical of this group of customers. This can
done either as a pen portrait, a customer journey or both. Once you have
created this persona, you can then enrich it by adding customer information
you have from other sources.
information
Some examples from the commercial sector of this approach are,
www.mediumblue.com/newsletters/customer-personas.html and
www.boxesandarrows.com/view/customer_storytelling_at_the_heart_of_
business_success
For Norfolk’s Digital Challenge we created seven user journeys for the key
examples
groups we wanted to support, plus the general public and intermediaries
working with these groups. The starting point was a workshop where we got
together representatives of those groups and people who worked with them
and discussed what a “typical” person would look like. We gave them a name
and invented a personal history for them that set out how they got to where
they are. We could not, of course, cover all circumstances for all the people in
that group, but it gave us a story which felt real and on which we could ‘hang’
what we knew about the client group. The power of a story is very important
in both getting under the skin of the needs of a group, and in persuading
others of the need for action.
We then did some work on identifying what the journey of John, Brian, Laura
or the others would be. What services would they need? How would they
get access to them now? What would their experience be in accessing these
services? What would we like that experience to be like in future?
We then converted this into seven cartoons which showed what the future
would look like. This enabled us to identify what we would need to do to make
that future real in the full Digital Challenge bid. To make it even more real,
we filmed a video showing what life was like currently, but framing this with
a vision of the future. As well as using people’s views from the workshop, we
also tested the vision with single issue focus groups from our target groups to
make sure what they told us was incorporated in the personas.
information
The seven journeys: www.my.norfolk.gov.uk/mynorfolk/user-journeys.htm The long
version of the personas are at http://eoe.xarg.co.uk/mynorfolk/files/view/research-
documents/My_norfolk_15_user_journeys.doc
The full Digital Challenge bid http://www.my.norfolk.gov.uk/mynorfolk/our-bid.htm
and video www.my.norfolk.gov.uk/mynorfolk/video.htm and the research
38 www.my.norfolk.gov.uk/mynorfolk/research.htm
39. case study National Archives use
personas to understand
their customers
The UK’s National Archives used interviews with customers and stakeholders,
field research and customer diaries to gain a better understanding of the
needs, behaviours and motivations of their existing customers. This was then
used to develop customer personas such as “the rambler” “the explorer” and
“the tracker” to develop a set of services that were tailored to each group.
gemma.richardson@nationalarchives.gov.uk
Understanding peoples’
case study
attitude to climate change
The Department for Environment and Rural Affairs pulled together a wide
range of quantitative and qualitative market research about peoples’
attitude to the environment and climate change to develop customer
profiles that were segmented along shared values and beliefs. These were
then tested and developed with surveys and were matched with marketing
information about different groups to design social marketing campaigns.
www.defra.gov.uk/evidence/social/behaviour/index.htm.
kirsten.reeves@defra.gsi.gov.uk
39
40. Customer
Journey Mapping
It is also useful to look at customer journeys. Customer journey mapping is
the process of tracking and describing all the experiences that customers
have as they encounter a service or set of services, taking into account not
only what happens to them, but also their responses to their experiences.
Used well, it can reveal opportunities for improvement and innovation in
that experience, acting as a strategic tool to ensure every interaction with
the customer is as positive as it can be.
information
Information on customer journey mapping can be found at,
www.westmidlandsiep.gov.uk/download.php?did=2107 and
www.cabinetoffice.gov.uk/public_service_reform/innovation/customer_
journey_mapping.aspx Information on the ‘circle of need’ approach can
be found at www.chorley.gov.uk/circlesofneed
I’m a customer,
get me out of here… case study
Home Truths is the reality TV method used by Rotherham Council’s
Neighbourhoods & Adult Services Directorate to test the quality of their
services through the eyes of customers, using video and hand written
diaries to record their experiences. Home Truths is their most innovative
and effective method of seeing services from start to finish, and has allowed
some of their most vulnerable customers to tell them how they really feel.
Lessons from a Home Truths video diary created during a customer’s
journey through the social care annual review process led to improved
service accessibility through a single first point of contact ‘assessment
direct’ number, the development of information packs, a process for review
questions to be sent to customer prior to the visit, and improved on-line
services. A hand written diary was used by an older person to record their
experience of the RotherCare community alarm scheme. The customer said
that they would have liked a specific appointment time for the installation
of equipment: to improve the service for new customers they introduced an
appointments diary and a dedicated installations assistant.
jasmine.Speight@rotherham.gov.uk
40
41. case study Moving from
work to retirement
The Department of Work and Pensions (DWP) used interviews with
customers and workshops with staff and stakeholders to do customer
journey mapping for people who move from receiving work related benefits
to retirement pension related benefits. As one customer said: “this is your
change not mine – I’m just a day older”. The journey mapping enabled
them to change the system so that people got better information on how
things would change, and improvements in how different parts of the DWP
exchanged information meant customers didn’t have to repeatedly provide
the same information, which also saved the Department money. As well
as getting customer views on their existing system, the DWP tested the
proposed changes with customers before implementing them.
andrew.parker@dwp.gsi.gov.uk
Improving planning
case study
and licensing services
Colchester Council did customer journey mapping on its planning and
licensing functions to identify the points where customer satisfaction fell.
They used this to streamline correspondence and use a visual approach
using images to explain their processes more effectively.
mandy.jones@colchester.gov.uk
41
42. Accessing
case study
council services
Winchester Council got frontline staff to do their own customer journey
mapping – after some training – exploring how accessing their own council
services compared to accessing services from banks, building societies and
the Post Office.
paulwood24@msn.com
Heartbeat monitors
case study
and services
Haringey Council have also used customer journey mapping based on
meetings with three groups – people who have just moved into the borough,
families with children at different schools and people who use care services.
During the process they used heartbeat monitors to find out their positive
and negative responses to parts of the process or to engaging with the
council. This mapping has been used to join up services so people only have
to make one visit, and to improve information provision.
carla.segel@haringey.gov.uk
42
44. It is important that you test any improvement ideas with both staff and
customers. Staff will know how the process really works (rather than the of-
ficial version) and may be able to suggest problems with your improvements
and improvements of their own. Customers are the people who can tell
you whether proposed changes would really be an improvement. This does
not mean you have to always take what customers they say at face value,
but you need to consider their opinions when making your plans – possibly
building in training or modifying your message.
Co-design work should happen at all stages of the process: from the start,
to find out what customers would want you to improve, through business
process re-engineering, to testing suggested improvements, to marketing
to make sure that the messages you send are ones which the target group
will understand and positively respond to. Co-design should also be used in
measurement and evaluation to make sure what you have done has met the
needs you identified at the start of your improvement or delivery process.
information
There are some useful pointers to co-design at,
www.serviceuser.org/and www.england-legislation.hmso.gov.uk/.../
power-of-information-review.pdf
44
45. case study Using focus groups
to help with
website development
The City of Edinburgh is developing a new website. At the start of the
project the city first made a SWOT analysis of their existing website, which
was followed by an analysis of web usage statistics. This was the basis
for a participation process. Nine focus groups were established with 70
participants and 47 individual interviews were conducted. In addition,
there were also interviews with stakeholders, such as the health services,
city council members and networks.
The study mapped the expectations people had for the website and probed
reactions to a number of test web designs. The participants also had to
determine priorities for a new website.
Some conclusions:
● the method of offering task-oriented instead of supply-oriented
information on the website was positively received. People wanted
a good alternative for the questions they normally had to ask by
telephone or e-mail.
● users are also prepared to register on the website provided this serves a
useful purpose and security is guaranteed.
● there is previously untapped potential to participate in the decision-
making process
● people are interested in contributing to online participation and
decision-making processes, but they must be well announced.
● Edinburgh needs to promote its website better as a communication and
transaction platform to reach more people. One of the suggestions was
the use of an electronic newsletter as well as the use of social media.
The participants’ main priorities were:
● my Services: Presentation of relevant services depending on the postal
code: local city council members, waste collection dates
● GIS: Presentation of nearby locations on an interactive map, such as
nearby schools
● user registration: Users want to register on the website and select
preferences for information updates
● eConsultation: Users want to voice comments, register for alerts and
follow up decisions
45
46. Citizens and businesses
case study
contribute to new web
portal
The city of Osterholz-Scharmbeck is developing a citizen-oriented internet
presence which will re-shape the city’s current, very static website. The city’s
internet portal will contain basic information on relevant e-services for all
citizens and visitors, and will provide an interactive tool for the citizens, local
enterprises and all important interest and user groups in the city. Osterholz-
Scharmbeck has already conducted a survey of citizens and businesses to
identify which services are needed and wanted by different target groups.
The survey identified that citizens wanted a wide range of e-services,
including applications for passports, federal ID-cards, building permits,
marriage applications, and citizen registrations. These will be made available
online in a user-friendly way. Where possible, services that usually require a
personal visit to the city administration will be automated and e-services will
be made available.
46
48. Having established what services the group you are working with need, and
started a process to improve those services to meet needs more closely, you
can also start to personalise service delivery.
At its most developed, this can mean giving people the tools to customise
services, or information about them, to reflect the circumstances of each
individual.
Norfolk County Council gives adults with additional needs a budget to
examples
meet these needs, so they can buy the services themselves rather than the
council buying them on their behalf. This includes choosing the care home
or the home support services for older people and people with disabilities,
or the aids and adaptations they need to have in their home to help them
live independently. Norfolk County Council provides a menu of approved
services to help them choose, but they can decide to find alternatives that
are not on the list.
For most services personalisation will not go this far but will involve
pulling together lists of the range of services groups of people in shared
circumstances may want.
An example is Norfolk’s Children and Families service directory which groups
services against headings like Childcare and Out of School Services, parenting
and family support, schools and education or special needs and disabilities.
information
http://search3.openobjects.com/kbroker/ncc/fsd/start.jsp
Another example is a website like Brighter Lives in Norfolk which brings
together information for migrant workers and others moving to the county.
information
www.brighterlivesinnorfolk.org.uk
If you start to carry out more customer profiling and use the same set of
profile groups consistently you will build up a richer and richer picture of
that group and therefore be able to target services more effectively.
48
49. case study Co-designing services
with disabled groups
Norfolk County Council has actively tried to involve customers in co-design
of services by:
● getting members of the Norfolk Coalition of Disabled Groups to develop
the specification for commissioning services for their members
● having older people in care homes monitoring and reporting on
standards of service so the council enforce contracts, and getting people
with disabilities involved in reviewing their disability equality policy and
actions to make sure they met their needs
● getting young people who have left local authority care to work with
those still in care to review how the council supports them and how
services are delivered
www.youtube.com/user/NorfolkCountyCouncil#p/u/36/iXmAv2buVxc
anne.tansleythomas@norfolk.gov.uk
Neighbourhood helpers
case study
Southwark Council encouraged more than 200 older people and their
families to help them identify the range of issues facing older people –
including health issues and their reluctance to ask for help because of their
attitude to being “a burden” on family and the state. One key finding was
that there were many people who wanted to be “neighbourhood helpers” in
local communities and the Southwark Circle organisation was set up to link
these people together to support older people in their area.
claire.webb@southwark.gov.uk
49
50. Dignity map
case study case study
The Department of Health carried out similar work in developing its “dignity
map” using real stories from older people in care homes to challenge
organisations providing care on whether they are doing this in a way that
supports older people
Use of social networks
Barnet Council and Norfolk County Council have used social networking
media to identify resident’s issues before they become major problems.
Barnet used Google Alerts to identify when local bloggers complained about
services in the borough and then contact those involved to tackle the issues.
Norfolk has set up the HomePage service which uses web services to
pull together information about local communities from a range of web
sites, blogs and social networking tools so that the community can have
a conversation about issues. It also subscribes to a web “cuttings” service
similar to traditional print and broadcast cutting services to see what is
being said about it. It can then take that information into its “you said, we
did” process of making sure issues are actioned and people told what has
happened.
dominic.campbell@futuregovconsultancy.com
tim.anderson@norfolk.gov.uk
50
52. Where are your
customers?
There are a number of reasons for knowing where your customers are:
● to target limited resources to the areas where there are the greatest
number of customers or where customers have the greatest need
● to target information to the areas where there are the greatest number
of customers or where customers have the greatest need
● to identify areas where there are significant numbers of potential
customers but low take up of services
● to identify areas where there is high take up of services and to find out
why this is the case
● to build up a clearer understanding of particular communities
This last point – Community Mapping - is important if you want to serve
geographic communities effectively as well as communities of interest
such as customer groups. Building up a picture of the levels of current
and potential services in each of your communities will enable you to
allocate resources to match that pattern of need. It will also enable you
to think about how you deliver the range of services a community needs
across departmental and organisational boundaries, via one stop shops,
localisation, using intermediaries as gateways etc..
information
An example of how communities can be mapped using data is at
www.norfolkdata.net they can also be mapped in a dynamic way
www.diss.norfolkhomepage.org.uk
The size of community depends on the service and your own ways of
organising services. If the geographical areas are large, it is useful to show
how they are built up from smaller geographical units based on the smallest
level at which your customer information is held. This will enable you to (a)
standardise across the range of customer profiling work you do and (b) slice
and dice information more easily.
As an example, you may initially want to know how childcare is accessed
according to your social services areas, but you may later want to know how
they are being accessed in a particular town or compare levels of childcare
access in an area with the use of bus services in that area which people
could use to get to the childcare.
52
53. An example of community mapping can be seen on the Norfolk Insight data
observatory. A series of different geographies - based on the different ways
in which local councils deliver services, and standard geographical building
blocks such as council electoral divisions or census Output Areas - are
used to display data, including customer profiles. This tool allows users to
automatically generate pictures of each area when they are deciding how to
provide services there.
You do not have to have a complex GIS system to do this – agreeing
what the core geographical areas are and then consistently collecting
or analysing information on the basis of those areas will give you a pen
portrait of each place.
information
www.norfolkdata.net
What Are Your services?
To carry out effective improvements in the way you serve the needs of
customers and communities you need to know what you are currently
delivering. The customer records you have will provide you with the volume
of services you are delivering to current customers and to different areas of
your municipality. You should know the total value of the service (remember
to add a share of overhead costs such as management, building costs, ICT
etc.) so you can work out the unit cost by dividing the total cost by the
number of customers.
If you know the numbers of users who access your services via different
channels you can do more sophisticated analysis of the costs per channel.
The esd toolkit has developed a standard way of assigning unit costs to
transactions through different channels. Alternatively, there are general
average costs which have been worked out where the ratio is: web = 1;
phone = 4; face to face and post = 12.
If you have an area based structure it will be valuable to use the same
approach to work out the different costs per customer for each office as
it will help you deciding whether you need to switch resources between
offices. If possible, try and use the same building blocks you are collecting
information about customers on so you can compare the community and the
services you deliver.
information
A general guide to service mapping and design is at,
53
www.innovationintopractice.org.uk
54. Mapping services
against needs
Now you have details of the volumes of customers in each area and the unit
cost, you can map how much you spend in each part of your area. You also
have the profile of the type of people who are most likely to need or want
the service. You can now look at where people who have that profile are in
each area, which will show you the potential demand for the service.
For example you may know that on average, 30% of people over 65 use a
particular service such as a free bus pass. Your population data shows you
the areas where they live. Your customer data shows you where they are
using the service. It is likely there will be some areas where more than 30%
are using it and some areas where less than 30% are – what we call hot
spots and not spots.
It is valuable to talk to staff to find out why there are the differences – is it
marketed better in one area than another? Are there people or organisations
like community groups who are promoting it in one area by word of mouth?
Are there other differences in the people in one area to another - perhaps
they travel into a town which has a service centre more often to shop or do
business? This will help you design your marketing campaign.
It will also enable you to identify potential demand/need. The highest level
of access of the group could be the level all of the group will need or want if
you market effectively in the areas where take up is low. This will help plan
the total resources needed for the service and how much you need in each
area. It will also tell you where you need to market to increase demand.
information
It is also valuable to understand customer satisfaction and
www.cabinetoffice.gov.uk/public_service_reform/innovation/satisfaction.aspx
is a useful guide to this.
54
55. case study Identifying related services
for older people
Chorley Council used information about services and customers from esd
toolkit to set up their Circles of Need which try and serve the full needs older
people may have at the first point of contact. Customers making contact for
one service will be asked if they also want other services people like them
are likely to use in the way Amazon recommends books.
donna.hall@chorley.gov.uk
case study
Care Connect Contact
Centre
Council and health organisations in North Somerset used customer
segmentation data from the different organisations to identify which groups
of services were used by particular customer groups and then used that to
design their joint Care Connect Contact Centre to improve customer service
and save £250,000 across the partnership.
james.foster@n-somerset.gov.uk
case study
Collect once, use
numerous times
Stratford on Avon Council is developing six locality profiles based on
statistical data and customer feedback. They are basing their work on the
COUNT principle – collect once, use numerous times.
karin.stanley@stratford-dc.gov.uk
55
56. Outcome measures
case study
important to customers
Warwick have developed a Customer Insight model to identify customers,
clarify why services are important from a customer point of view, understand
current volumes, resources and pressures, and develop outcome measures
which are important to customers. Testing this on housing repairs and
housing benefits systems has helped refine it for wider use.
dave.barber@warwickdc.gov.uk
case study
A clear view of
customers needs
Worcester Council combined two customer data sets – the register of
Electors and their Citizen’s Panel contacts (after carrying out a data cleansing
operation) to create a single customer view. This was then matched against
their address database – the local land and property gazetteer – so they
could use Mosaic or Acorn profiling to get a clear view of customers and
their views and needs. This is now being developed by agreeing a Data
Sharing Protocol with services so more customer data sets can be matched
and added to enrich the view.
pbutler@worcester.gov.uk
56
58. What is your current
service delivery process?
It is essential that you understand not only how you are delivering
your services, but how people are accessing these services, so that you
can compare delivery and service use with what you know about your
customers. Understanding delivery, customers and usage provides you with
a context you can use to plan how you can revise your services to make
customer service improvements or efficiency savings.
Regeldruk-
vermindering
verminder
Figure 5
Elements of a business process model
It is essential that your process mapping starts with the customer and their
first point of contact with your service – or even earlier if you are looking at
the full customer journey from first awareness of the service. At each stage
of service delivery you need to map:
● who is involved – the customer, officers, intermediaries such as friends, other
professionals or councillors
● what is being communicated – requesting information, providing information
● what is the channel being used – phone, face to face, email or online form,
paper document
● what ICT/e-government systems involved for data to be entered or accessed
● are there permissions being granted or eligibility criteria being applied and if
so what is the process for this - what questions are being asked, and how you
respond to different information/answers
This last point highlights the feedback loops that exist in your systems
– for example if you need to go back to the customer and ask for more
information – as well as how you process requests for data or verification
from/with outside agencies.
58
59. It is also important for you to look at what feedback customers get during
their use of your service – have you told them if the service has been
delivered, given them a status update, or asked if what they got was what
they needed?
information
A guide to process mapping from the Smart Cities project is at,
www.smartcities.info/files/Smart_Cities_Research_Brief_Process_Modelling_0.pdf
And another guide is at,
www.institute.nhs.uk/option.com/joomcart/Itemid,26/main page,document
product info/products id,295.html
What can be improved
There are a number of things you can do to improve customer services
or service efficiency using customer and community profiling techniques,
including:
● encouraging greater take up of services through the use of targeted
marketing
● encouraging customers to use cheaper service delivery channels through
targeted marketing (and making sure those channels deliver what they
want) via a process of channel shift
● improving your delivery processes by reducing complexity or by
automating parts of the process
● improving access to services by delivering a more joined up “one
stop” service across the local authority or partnerships through all
channels (generally based on ensuring information and service requests
are online and information is grouped around the needs of specific
customer groups)
● encouraging customers to change their behaviour so they need fewer or
less costly services (by using social marketing to promote channel shift,
or by providing more information and services online)
If you use these techniques to identify and describe your ideal/preferred
method for customers to access your services, you can then map that
against the actual customer journey/process map to see how it differs.
Remember to keep focused on your business question, although you may
get ideas for other improvements which you can either add to the project or
develop as a further project.
59
60. Creation of a Service
case study
Center leads to better
knowledge management
The Oldenburg ServiceCenter in north-west Germany was set up to handle
all the questions their 160,000 citizens had for the local authority. The call
centre was established because many citizens complained about the lack
of information and services available over the telephone, while staff who
were receiving telephone calls complained that they were disruptive. A
project plan was drawn up that covered measurements, objectives, building
requirements, staff requirements, technology, knowledge building and
marketing.
● Two-thirds of the people calling were helped in 2 to 3 minutes. The
majority of callers look for general information such as opening hours,
contact information and frequently used services. Only in one out of
three cases takes longer than 3 minutes.
● The employees get more than 80% of their information from the
municipal website. They also point out errors and gaps to the editors
of the services that provide information to the website. This feedback
means the website is very accurate and up to date. 10% of the
information required is retrieved from the municipal guide, and the
other 10% from the municipal intranet. The employees have access to
frequently used applications such as permit registers and the population
database.
● The accessibility is astonishing: 83% of all phone calls are answered
within 20 seconds, the call centre is open from Monday to Friday from 7
am to 6 pm and 81% of all phone calls immediately yield results without
the need for any further contact.
● Most of the employees are mothers working half-time. They receive
six weeks of training before being able to work independently. Three
knowledge managers are responsible for keeping all information up to
date and for briefing the employees.
60
61. case study A Product catalogue
makes an organisation
transparent
The municipality of Wevelgem in Flanders wanted to have a better overview
of the products offered by the municipality and by the public centre for
social welfare. A product catalogue would provide an accurate picture
of what services were offered, and could be used to facilitate better
cooperation between the different departments. Wevelgem set to work with
a website developed by Leiedal which used an online process to describe
municipal services.
A municipal quality coordinator supported staff members by visiting every
municipal department, explaining the project and assisting with the product
descriptions. The coordinator also ensured that service descriptions were
consistent. It took a couple of months to describe the first set of services.
The municipality made a conscious decision that employees would describe
the products and services that were being offered, based on their own
expertise. This approach has also been used by the other municipalities
in the Kortrijk region: different departments describe their of services,
although some municipalities also quality check submissions.
It was then decided to publish these internal product descriptions on the
various municipal websites, as it was felt that the product descriptions
contained important information for website users. As a result the
descriptions of a large number of products were revised before publication.
The municipality of Wevelgem currently has 300 products and services
described online.
Building the business case
Once you have decided what it is you want to achieve you should build a
business case – even if this is at a very summary level for those projects
involving small groups and small amounts of money.
information
Information: A template is attached as Appendix 2.
Remember the benefits you identified in the Balanced Scorecard and make
sure you refer to these in the Business case. You may not be able to quantify
all of those benefits but try and do as many as possible as this will help sell
the project to key stakeholders. 61
62. chapter 11
Service
access and
channel
strategy
62
63. What channels do
customers use?
A key question is how customers currently access your services. There was
considerable research done in the UK in the e-Citizen project, including an
analysis of the “hooks” which would make people use online access. While
the percentages of citizens using each channel will now be out of date, the
key messages are unlikely to have changed.
www.emeraldinsight.com/journals.htm?articleid=1573067&show=pdf
There are also regular surveys carried out at national, European and world
levels on Internet access and e-government take up which are readily
accessible on the web. Many commercial customer profiling packages will
include Internet access details for each profile type. The availability of
this data is however no substitute for actually asking people not only how
they access services but how they would like to access services - co-design
approaches using focus groups are a good way of exploring this.
Internet access and broadband connection in households
0
60%
Belgium*
56%
75%
Germany
55%
86%
The Netherlands
74%
84%
Norway
73%
84%
Sweden
71%
71%
United Kingdom
62%
Figure 6
Key: Percentage of households with internet access
Percentage of households with broadband internet access
Internet access and type of connection in households. * 2008 data for Belgium was not available - data is from 2007
(Source: Eurostat)
information
Guides to help to develop a channel strategy from the Smart Cities project include
www.smartcities.info/files/Smart_Cities_Research_Brief_Transformation_of_City_
Portals.pdf and
www.smartcities.info/files/Smart_Cities_Research_Brief_Measuring_levels_of_supply_
and_demand_for_eservices_and_egov_0.pdf
There is also a useful guidance at www.cabinetoffice.gov.uk/public_service_reform/
innovation/multi_channel.aspx
63