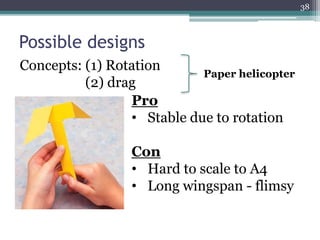
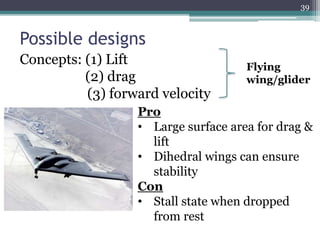
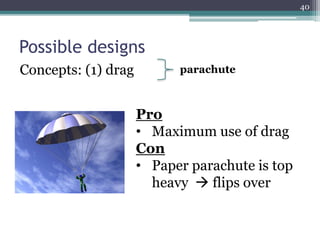
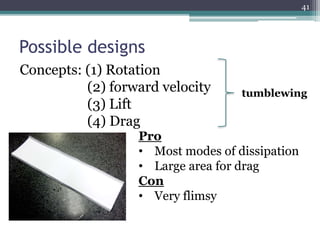
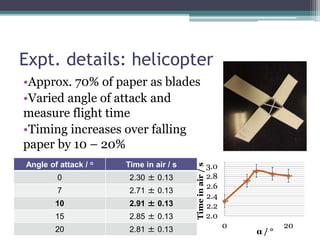
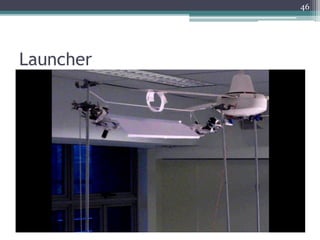
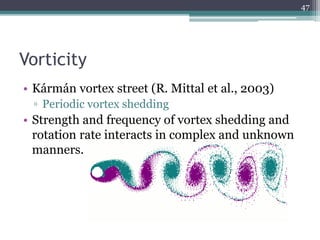
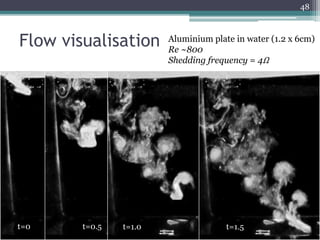
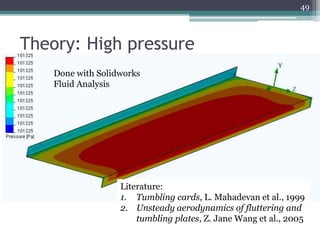
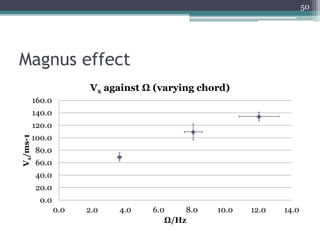
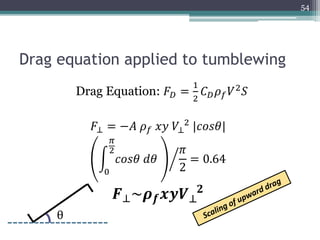
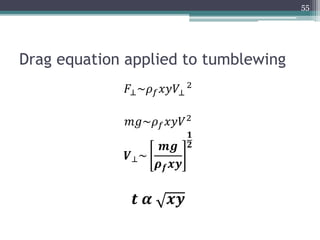
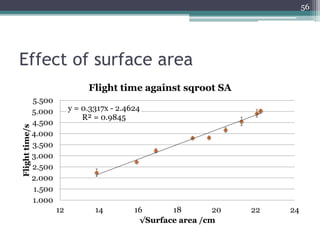
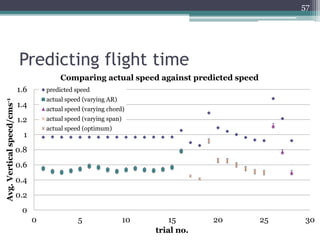
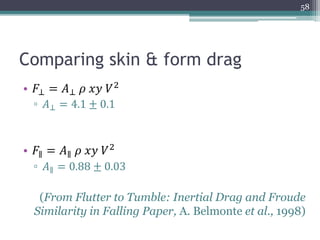
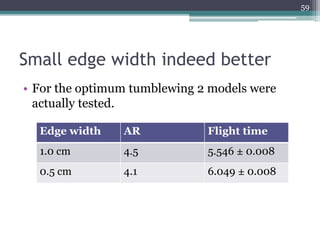
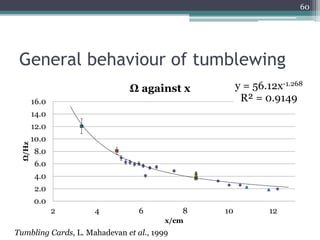
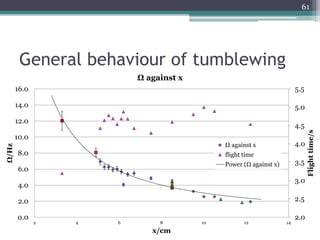
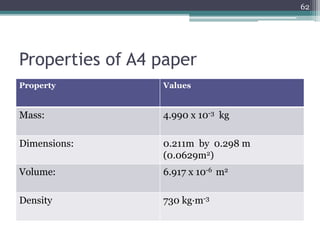
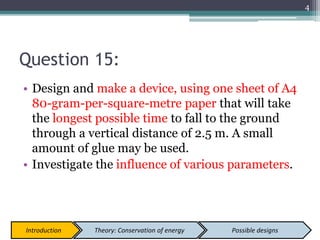
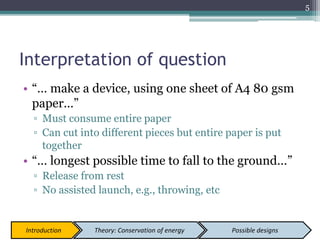
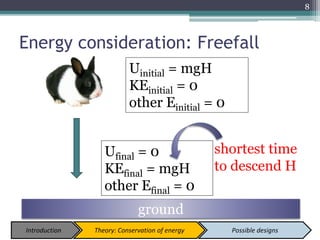
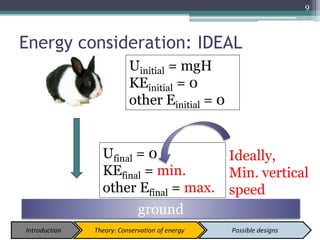
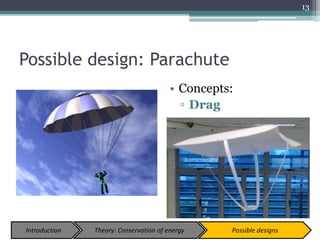
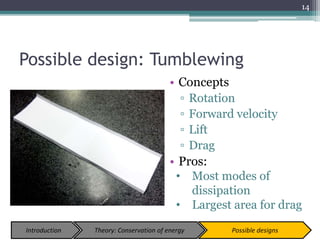
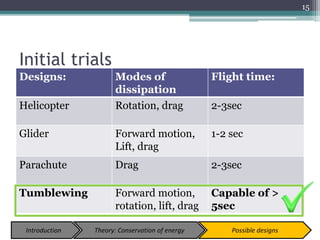
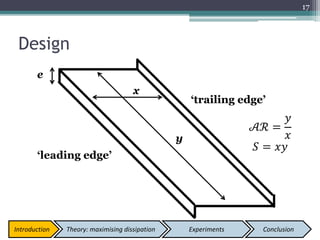
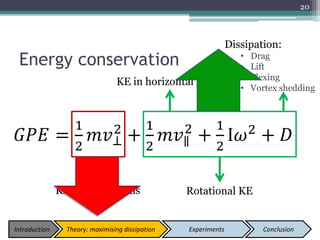
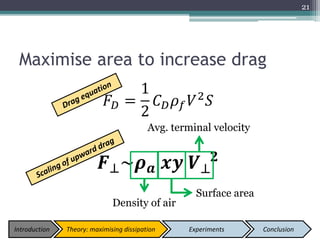
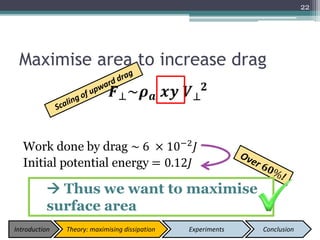
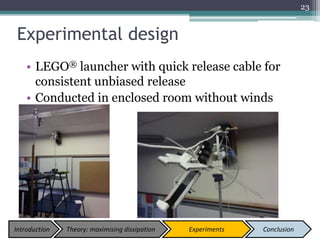
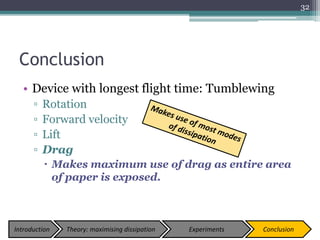
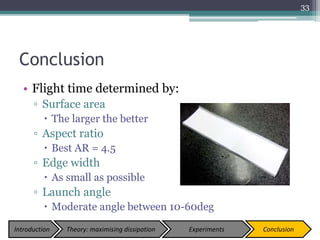
Q15. SLOW DESCENT
International Young Physicists’
Tournament 2011
Republic of Singapore
Zhang Nuda
Overview
2
Introduction
• Interpretation of question
• Preliminary data
Theory
• Conservation of energy
• Possible designs
Content: Chosen design
Theory
• How it works
• Energy dissipation model
Experiments
• Factors affecting flight time
• Making the best device
Conclusions
• Characteristics of optimum device
3
Question 15:
• Design and make a device, using one sheet of A4
80-gram-per-square-metre paper that will take
the longest possible time to fall to the ground
through a vertical distance of 2.5 m. A small
amount of glue may be used.
• Investigate the influence of various parameters.
4
Introduction Theory: Conservation of energy Possible designs
Interpretation of question
• “… make a device, using one sheet of A4 80 gsm
paper…”
▫ Must consume entire paper
▫ Can cut into different pieces but entire paper is put
together
• “… longest possible time to fall to the ground…”
▫ Release from rest
▫ No assisted launch, e.g., throwing, etc
5
Introduction Theory: Conservation of energy Possible designs
Preliminary data
• Plain 80gsm A4 paper allow to fall
▫ Time to drop 2.5 m approx. 2.4±0.4 s
 A successful device must fall
slower than a piece of paper
6
Introduction Theory: Conservation of energy Possible designs
Falling paper
• Back and forth & from side-
to-side
▫ i.e. fluttering
• Rotates end over end
▫ i.e. tumbling
• Chaotic behavior
(A. Belmonte et al., 1998)
7
Introduction Theory: Conservation of energy Possible designs
flutter tumble
Energy consideration: Freefall
shortest time
to descend H
Uinitial = mgH
KEinitial = 0
other Einitial = 0
Ufinal = 0
KEfinal = mgH
other Efinal = 0
8
ground
Introduction Theory: Conservation of energy Possible designs
ground
Energy consideration: IDEAL
Uinitial = mgH
KEinitial = 0
other Einitial = 0
Ufinal = 0
KEfinal = min.
other Efinal = max.
Ideally,
Min. vertical
speed
9
Introduction Theory: Conservation of energy Possible designs
Energy considerations
• Possibly convert energy to:
▫ Rotational KE
▫ Horizontal motion
▫ Heat
• Introduction of upward forces
▫ Lift
▫ Drag
10
Introduction Theory: Conservation of energy Possible designs
Possible design: Paper helicopter
• Concepts:
▫ Rotation
▫ Drag
11
Introduction Theory: Conservation of energy Possible designs
Possible design: Flying wing/glider
• Concepts:
▫ Lift
▫ Drag
▫ Forward velocity
12
Introduction Theory: Conservation of energy Possible designs
Possible design: Parachute
• Concepts:
▫ Drag
13
Introduction Theory: Conservation of energy Possible designs
Possible design: Tumblewing
• Concepts
▫ Rotation
▫ Forward velocity
▫ Lift
▫ Drag
• Pros:
• Most modes of
dissipation
• Largest area for drag
14
Introduction Theory: Conservation of energy Possible designs
Designs: Modes of
dissipation
Flight time:
Helicopter Rotation, drag 2-3sec
Glider Forward motion,
Lift, drag
1-2 sec
Parachute Drag 2-3sec
Tumblewing Forward motion,
rotation, lift, drag
Capable of >
5sec
15
Initial trials
16
Optimising flight time
Introduction Theory: maximising dissipation Experiments Conclusion
y
x
e
Design
17
𝒜ℛ =
𝑦
𝑥
𝑆 = 𝑥𝑦
‘leading edge’
‘trailing edge’
Introduction Theory: maximising dissipation Experiments Conclusion
Flight
18
Theory: The Magnus Effect
19
Lift
Rotation
Translational
velocity
Traps air;
high pressure
o
Energy conservation
20
𝐺𝑃𝐸 =
1
2
𝑚𝑣⊥
2
+
1
2
𝑚𝑣∥
2
+
1
2
I𝜔2
+ 𝐷
KE in vertical axis
KE in horizontal plane
Rotational KE
Dissipation:
• Drag
• Lift
• Flexing
• Vortex shedding
Introduction Theory: maximising dissipation Experiments Conclusion
Maximise area to increase drag
𝐹 𝐷 =
1
2
𝐶 𝐷 𝜌 𝑓 𝑉2
𝑆
𝑭⊥~𝝆 𝒂 𝒙𝒚 𝑽⊥
𝟐
21
Avg. terminal velocity
Density of air
Surface area
Introduction Theory: maximising dissipation Experiments Conclusion
Maximise area to increase drag
𝑭⊥~𝝆 𝒂 𝒙𝒚 𝑽⊥
𝟐
Work done by drag ~ 6 × 10⁻²
𝐽
Initial potential energy = 0.12𝐽
22
 Thus we want to maximise
surface area
Introduction Theory: maximising dissipation Experiments Conclusion
Experimental design
• LEGO® launcher with quick release cable for
consistent unbiased release
• Conducted in enclosed room without winds
23
Introduction Theory: maximising dissipation Experiments Conclusion
[1] Effect of aspect ratio
• Independent variable: Aspect ratio y/x
• Dependent variable
▫ Flight time
• Constants:
▫ Area, xy (450±3)cm2
▫ Edge width (1.00±0.05)cm
▫ Mass (4.990±0.005)g
▫ Launch angle (45.0±0. 5)deg
24
x
y
3.0 4.1 4.5 5.0 6.2 8.0 10.0
11.0 11.7 12.1 12.9 13.9 14.9 16.0 17.2
Introduction Theory: maximising dissipation Experiments Conclusion
[1] Effect of aspect ratio
25
4.00
4.20
4.40
4.60
4.80
5.00
5.20
1.0 6.0 11.0 16.0
Flighttime/s
Aspect ratio
Flight time against AR
Introduction Theory: maximising dissipation Experiments Conclusion
• Variable: edge width, e
▫ 0.3 0.6 0.9 1.0 1.2 1.5 1.8 2.1cm
• Constants:
▫ Span, y (45.00±0.05)cm
▫ Chord, x (10.00±0.05)cm
▫ Launch angle (45.0±0. 5)deg
• Assumption:
▫ Change in mass will not affect
flight time
[2] Effect of edge width
26
e
x
y
Introduction Theory: maximising dissipation Experiments Conclusion
[2] Effect of edge width
27
3.00
3.50
4.00
4.50
5.00
5.50
6.00
0.0 0.5 1.0 1.5 2.0 2.5
Flighttime/s
Edge width /cm
Flight time against edge width
Introduction Theory: maximising dissipation Experiments Conclusion
[3] Effect of launch angle
• Variable: Launch angle θ
▫ 0 – 120deg, at 10deg intervals
• Dependent variable:
▫ time
• Constants:
▫ Span, y (45.00±0.05)cm
▫ Chord, x (10.00±0.05)cm
▫ Edge width (1.00±0.05)cm
28
θ
Direction of flight
Introduction Theory: maximising dissipation Experiments Conclusion
[3] Effect of launch angle
29
Introduction Theory: maximising dissipation Experiments Conclusion
“Dead
Zone”
2.0
2.5
3.0
3.5
4.0
4.5
5.0
5.5
6.0
0.0 20.0 40.0 60.0 80.0
Flighttime/s
θ/deg
Flight time against launch angle
[4] The best tumblewing
• Characteristics:
▫ AR of 4.5
▫ Maximum surface area
▫ Small edge width
▫ Moderate launch angle
• Optimum model:
30
Span/cm Chord/cm AR SA/cm2 Edge/cm
48.6 11.8 4.1 573.5 0.5
Introduction Theory: maximising dissipation Experiments Conclusion
[4] The best tumblewing
31
2.00
2.50
3.00
3.50
4.00
4.50
5.00
5.50
6.00
6.50
1 2 3 4 5 6 7 8 9 10 11 12 13 14 15
Flighttime/s
Wing no.
Comparing flight times optimum
varying aspect ratio
varying chord
varying span
Introduction Theory: maximising dissipation Experiments Conclusion
Conclusion
• Device with longest flight time: Tumblewing
▫ Rotation
▫ Forward velocity
▫ Lift
▫ Drag
 Makes maximum use of drag as entire area
of paper is exposed.
32
Introduction Theory: maximising dissipation Experiments Conclusion
Conclusion
• Flight time determined by:
▫ Surface area
 The larger the better
▫ Aspect ratio
 Best AR = 4.5
▫ Edge width
 As small as possible
▫ Launch angle
 Moderate angle between 10-60deg
33
Introduction Theory: maximising dissipation Experiments Conclusion
Thank you
34
[blank]
35
[blank]
36
[blank]
37
Possible designs
Concepts: (1) Rotation
(2) drag
Pro
• Stable due to rotation
Con
• Hard to scale to A4
• Long wingspan - flimsy
Paper helicopter
38
Possible designs
Concepts: (1) Lift
(2) drag
(3) forward velocity
Pro
• Large surface area for drag &
lift
• Dihedral wings can ensure
stability
Con
• Stall state when dropped
from rest
Flying
wing/glider
39
Possible designs
Concepts: (1) drag
Pro
• Maximum use of drag
Con
• Paper parachute is top
heavy  flips over
parachute
40
Concepts: (1) Rotation
(2) forward velocity
(3) Lift
(4) Drag
Possible designs
Pro
• Most modes of dissipation
• Large area for drag
Con
• Very flimsy
tumblewing
41
Expt. details: helicopter
•Approx. 70% of paper as blades
•Varied angle of attack and
measure flight time
•Timing increases over falling
paper by 10 – 20%
Angle of attack / o Time in air / s
0 2.30 ± 0.13
7 2.71 ± 0.13
10 2.91 ± 0.13
15 2.85 ± 0.13
20 2.81 ± 0.13
2.0
2.2
2.4
2.6
2.8
3.0
0 20
Timeinair/s
α / °
Expt. details: glider
• 15 models of paper gliders with initial launching
angles 0̊, 20̊, 40̊, 60̊ and 80̊.
• Bank and pitch corrections made via ailerons
and elevators.
43
 Flight times barely
exceed 2sec
Expt. details: parachute
44
Parachute Avg time: 2.28s
Blunt head Avg time: 2.58s
Measurements & calculations
• Flight time
• Tumbling frequency, Ω
• Horizontal velocity, 𝑉∥
• Vertical velocity, 𝑉⊥
• Energy lost via dissipation = 𝑀𝑔ℎ −
1
2
𝐼𝜔2
−
1
2
𝑀𝑉∥
2
−
1
2
𝑀𝑉⊥
2
• Reynolds number =
𝜌 𝑓Ω𝑥2
𝜇
(Mahadevan et al., 1999)
▫ Re ranged between 1000 -2000
45
Introduction Theory: maximising dissipation Experiments Conclusion
Launcher
46
Vorticity
• Kármán vortex street (R. Mittal et al., 2003)
▫ Periodic vortex shedding
• Strength and frequency of vortex shedding and
rotation rate interacts in complex and unknown
manners.
47
Flow visualisation
48
Aluminium plate in water (1.2 x 6cm)
Re ~800
Shedding frequency = 4Ω
t=0 t=0.5 t=1.0 t=1.5
Theory: High pressure
49
Done with Solidworks
Fluid Analysis
Literature:
1. Tumbling cards, L. Mahadevan et al., 1999
2. Unsteady aerodynamics of fluttering and
tumbling plates, Z. Jane Wang et al., 2005
Magnus effect
50
0.0
20.0
40.0
60.0
80.0
100.0
120.0
140.0
160.0
0.0 2.0 4.0 6.0 8.0 10.0 12.0 14.0
Vx/ms-1
Ω/Hz
Vx against Ω (varying chord)
Magnus effect
51
0.0
20.0
40.0
60.0
80.0
100.0
120.0
140.0
3.5 3.7 3.9 4.1 4.3 4.5 4.7
Vx/cms-1
Ω/Hz
Vx against Ω (varying span)
Magnus effect
52
70.0
75.0
80.0
85.0
90.0
95.0
100.0
1.0 2.0 3.0 4.0 5.0 6.0 7.0 8.0
Vx/cms-1
Ω/Hz
Vx against Ω (fixed surface area)
Magnus effect (theory)
• 𝐹 𝑀 = 𝑆(𝜔 × 𝑣)
• Bernoulli’s equation
▫ 𝑝 +
1
2
𝜌𝑉2
+ 𝜌𝑔ℎ = 𝑐𝑜𝑛𝑠𝑡.
53
Drag equation applied to tumblewing
Drag Equation: 𝐹 𝐷 =
1
2
𝐶 𝐷 𝜌 𝑓 𝑉2 𝑆
𝐹⊥ = −𝐴 𝜌 𝑓 𝑥𝑦 𝑉⊥
2
|𝑐𝑜𝑠𝜃|
0
𝜋
2
𝑐𝑜𝑠𝜃 𝑑𝜃
𝜋
2
= 0.64
𝑭⊥~𝝆 𝒇 𝒙𝒚𝑽⊥
𝟐
54
θ
Drag equation applied to tumblewing
𝐹⊥~𝜌 𝑓 𝑥𝑦𝑉⊥
2
𝑚𝑔~𝜌 𝑓 𝑥𝑦𝑉2
𝑽⊥~
𝒎𝒈
𝝆 𝒇 𝒙𝒚
𝟏
𝟐
𝒕 𝜶 𝒙𝒚
55
Effect of surface area
56
y = 0.3317x - 2.4624
R² = 0.9845
1.000
1.500
2.000
2.500
3.000
3.500
4.000
4.500
5.000
5.500
12 14 16 18 20 22 24
Flighttime/s
√Surface area /cm
Flight time against sqroot SA
Predicting flight time
57
0
0.2
0.4
0.6
0.8
1
1.2
1.4
1.6
0 5 10 15 20 25 30
Avg.Verticalspeed/cms-1
trial no.
Comparing actual speed against predicted speed
predicted speed
actual speed (varying AR)
actual speed (varying chord)
actual speed (varying span)
actual speed (optimum)
Comparing skin & form drag
• 𝐹⊥ = 𝐴⊥ 𝜌 𝑥𝑦 𝑉2
▫ 𝐴⊥ = 4.1 ± 0.1
• 𝐹∥ = 𝐴∥ 𝜌 𝑥𝑦 𝑉2
▫ 𝐴∥ = 0.88 ± 0.03
(From Flutter to Tumble: Inertial Drag and Froude
Similarity in Falling Paper, A. Belmonte et al., 1998)
58
Small edge width indeed better
• For the optimum tumblewing 2 models were
actually tested.
59
Edge width AR Flight time
1.0 cm 4.5 5.546 ± 0.008
0.5 cm 4.1 6.049 ± 0.008
General behaviour of tumblewing
60
y = 56.12x-1.268
R² = 0.9149
0.0
2.0
4.0
6.0
8.0
10.0
12.0
14.0
16.0
2 4 6 8 10 12
Ω/Hz
x/cm
Ω against x
Tumbling Cards, L. Mahadevan et al., 1999
61
General behaviour of tumblewing
2.0
2.5
3.0
3.5
4.0
4.5
5.0
5.5
0.0
2.0
4.0
6.0
8.0
10.0
12.0
14.0
16.0
2 4 6 8 10 12 14
Flighttime/s
Ω/Hz
x/cm
Ω against x
Ω against x
flight time
Power (Ω against x)
Properties of A4 paper
Property Values
Mass: 4.990 x 10⁻³ kg
Dimensions: 0.211m by 0.298 m
(0.0629m2)
Volume: 6.917 x 10⁻⁶ m2
Density 730 kg·m-3
62
Data sheet
rho_air (kg m-3) 1.1644
mu_air (kg m-1 s-1) 1.98E-05
mass of paper (kg) =
0.00499
initial mgh 0.12238
mgh error 0.000367
thickness 0.00011
MOI (kg m2) 10−6
63

Slow descent v3_IYPT

  • 1.
    Q15. SLOW DESCENT InternationalYoung Physicists’ Tournament 2011 Republic of Singapore Zhang Nuda
  • 2.
    Overview 2 Introduction • Interpretation ofquestion • Preliminary data Theory • Conservation of energy • Possible designs
  • 3.
    Content: Chosen design Theory •How it works • Energy dissipation model Experiments • Factors affecting flight time • Making the best device Conclusions • Characteristics of optimum device 3
  • 4.
    Question 15: • Designand make a device, using one sheet of A4 80-gram-per-square-metre paper that will take the longest possible time to fall to the ground through a vertical distance of 2.5 m. A small amount of glue may be used. • Investigate the influence of various parameters. 4 Introduction Theory: Conservation of energy Possible designs
  • 5.
    Interpretation of question •“… make a device, using one sheet of A4 80 gsm paper…” ▫ Must consume entire paper ▫ Can cut into different pieces but entire paper is put together • “… longest possible time to fall to the ground…” ▫ Release from rest ▫ No assisted launch, e.g., throwing, etc 5 Introduction Theory: Conservation of energy Possible designs
  • 6.
    Preliminary data • Plain80gsm A4 paper allow to fall ▫ Time to drop 2.5 m approx. 2.4±0.4 s  A successful device must fall slower than a piece of paper 6 Introduction Theory: Conservation of energy Possible designs
  • 7.
    Falling paper • Backand forth & from side- to-side ▫ i.e. fluttering • Rotates end over end ▫ i.e. tumbling • Chaotic behavior (A. Belmonte et al., 1998) 7 Introduction Theory: Conservation of energy Possible designs flutter tumble
  • 8.
    Energy consideration: Freefall shortesttime to descend H Uinitial = mgH KEinitial = 0 other Einitial = 0 Ufinal = 0 KEfinal = mgH other Efinal = 0 8 ground Introduction Theory: Conservation of energy Possible designs
  • 9.
    ground Energy consideration: IDEAL Uinitial= mgH KEinitial = 0 other Einitial = 0 Ufinal = 0 KEfinal = min. other Efinal = max. Ideally, Min. vertical speed 9 Introduction Theory: Conservation of energy Possible designs
  • 10.
    Energy considerations • Possiblyconvert energy to: ▫ Rotational KE ▫ Horizontal motion ▫ Heat • Introduction of upward forces ▫ Lift ▫ Drag 10 Introduction Theory: Conservation of energy Possible designs
  • 11.
    Possible design: Paperhelicopter • Concepts: ▫ Rotation ▫ Drag 11 Introduction Theory: Conservation of energy Possible designs
  • 12.
    Possible design: Flyingwing/glider • Concepts: ▫ Lift ▫ Drag ▫ Forward velocity 12 Introduction Theory: Conservation of energy Possible designs
  • 13.
    Possible design: Parachute •Concepts: ▫ Drag 13 Introduction Theory: Conservation of energy Possible designs
  • 14.
    Possible design: Tumblewing •Concepts ▫ Rotation ▫ Forward velocity ▫ Lift ▫ Drag • Pros: • Most modes of dissipation • Largest area for drag 14 Introduction Theory: Conservation of energy Possible designs
  • 15.
    Introduction Theory: Conservationof energy Possible designs Designs: Modes of dissipation Flight time: Helicopter Rotation, drag 2-3sec Glider Forward motion, Lift, drag 1-2 sec Parachute Drag 2-3sec Tumblewing Forward motion, rotation, lift, drag Capable of > 5sec 15 Initial trials
  • 16.
    16 Optimising flight time IntroductionTheory: maximising dissipation Experiments Conclusion
  • 17.
    y x e Design 17 𝒜ℛ = 𝑦 𝑥 𝑆 =𝑥𝑦 ‘leading edge’ ‘trailing edge’ Introduction Theory: maximising dissipation Experiments Conclusion
  • 18.
  • 19.
    Theory: The MagnusEffect 19 Lift Rotation Translational velocity Traps air; high pressure o
  • 20.
    Energy conservation 20 𝐺𝑃𝐸 = 1 2 𝑚𝑣⊥ 2 + 1 2 𝑚𝑣∥ 2 + 1 2 I𝜔2 +𝐷 KE in vertical axis KE in horizontal plane Rotational KE Dissipation: • Drag • Lift • Flexing • Vortex shedding Introduction Theory: maximising dissipation Experiments Conclusion
  • 21.
    Maximise area toincrease drag 𝐹 𝐷 = 1 2 𝐶 𝐷 𝜌 𝑓 𝑉2 𝑆 𝑭⊥~𝝆 𝒂 𝒙𝒚 𝑽⊥ 𝟐 21 Avg. terminal velocity Density of air Surface area Introduction Theory: maximising dissipation Experiments Conclusion
  • 22.
    Maximise area toincrease drag 𝑭⊥~𝝆 𝒂 𝒙𝒚 𝑽⊥ 𝟐 Work done by drag ~ 6 × 10⁻² 𝐽 Initial potential energy = 0.12𝐽 22  Thus we want to maximise surface area Introduction Theory: maximising dissipation Experiments Conclusion
  • 23.
    Experimental design • LEGO®launcher with quick release cable for consistent unbiased release • Conducted in enclosed room without winds 23 Introduction Theory: maximising dissipation Experiments Conclusion
  • 24.
    [1] Effect ofaspect ratio • Independent variable: Aspect ratio y/x • Dependent variable ▫ Flight time • Constants: ▫ Area, xy (450±3)cm2 ▫ Edge width (1.00±0.05)cm ▫ Mass (4.990±0.005)g ▫ Launch angle (45.0±0. 5)deg 24 x y 3.0 4.1 4.5 5.0 6.2 8.0 10.0 11.0 11.7 12.1 12.9 13.9 14.9 16.0 17.2 Introduction Theory: maximising dissipation Experiments Conclusion
  • 25.
    [1] Effect ofaspect ratio 25 4.00 4.20 4.40 4.60 4.80 5.00 5.20 1.0 6.0 11.0 16.0 Flighttime/s Aspect ratio Flight time against AR Introduction Theory: maximising dissipation Experiments Conclusion
  • 26.
    • Variable: edgewidth, e ▫ 0.3 0.6 0.9 1.0 1.2 1.5 1.8 2.1cm • Constants: ▫ Span, y (45.00±0.05)cm ▫ Chord, x (10.00±0.05)cm ▫ Launch angle (45.0±0. 5)deg • Assumption: ▫ Change in mass will not affect flight time [2] Effect of edge width 26 e x y Introduction Theory: maximising dissipation Experiments Conclusion
  • 27.
    [2] Effect ofedge width 27 3.00 3.50 4.00 4.50 5.00 5.50 6.00 0.0 0.5 1.0 1.5 2.0 2.5 Flighttime/s Edge width /cm Flight time against edge width Introduction Theory: maximising dissipation Experiments Conclusion
  • 28.
    [3] Effect oflaunch angle • Variable: Launch angle θ ▫ 0 – 120deg, at 10deg intervals • Dependent variable: ▫ time • Constants: ▫ Span, y (45.00±0.05)cm ▫ Chord, x (10.00±0.05)cm ▫ Edge width (1.00±0.05)cm 28 θ Direction of flight Introduction Theory: maximising dissipation Experiments Conclusion
  • 29.
    [3] Effect oflaunch angle 29 Introduction Theory: maximising dissipation Experiments Conclusion “Dead Zone” 2.0 2.5 3.0 3.5 4.0 4.5 5.0 5.5 6.0 0.0 20.0 40.0 60.0 80.0 Flighttime/s θ/deg Flight time against launch angle
  • 30.
    [4] The besttumblewing • Characteristics: ▫ AR of 4.5 ▫ Maximum surface area ▫ Small edge width ▫ Moderate launch angle • Optimum model: 30 Span/cm Chord/cm AR SA/cm2 Edge/cm 48.6 11.8 4.1 573.5 0.5 Introduction Theory: maximising dissipation Experiments Conclusion
  • 31.
    [4] The besttumblewing 31 2.00 2.50 3.00 3.50 4.00 4.50 5.00 5.50 6.00 6.50 1 2 3 4 5 6 7 8 9 10 11 12 13 14 15 Flighttime/s Wing no. Comparing flight times optimum varying aspect ratio varying chord varying span Introduction Theory: maximising dissipation Experiments Conclusion
  • 32.
    Conclusion • Device withlongest flight time: Tumblewing ▫ Rotation ▫ Forward velocity ▫ Lift ▫ Drag  Makes maximum use of drag as entire area of paper is exposed. 32 Introduction Theory: maximising dissipation Experiments Conclusion
  • 33.
    Conclusion • Flight timedetermined by: ▫ Surface area  The larger the better ▫ Aspect ratio  Best AR = 4.5 ▫ Edge width  As small as possible ▫ Launch angle  Moderate angle between 10-60deg 33 Introduction Theory: maximising dissipation Experiments Conclusion
  • 34.
  • 35.
  • 36.
  • 37.
  • 38.
    Possible designs Concepts: (1)Rotation (2) drag Pro • Stable due to rotation Con • Hard to scale to A4 • Long wingspan - flimsy Paper helicopter 38
  • 39.
    Possible designs Concepts: (1)Lift (2) drag (3) forward velocity Pro • Large surface area for drag & lift • Dihedral wings can ensure stability Con • Stall state when dropped from rest Flying wing/glider 39
  • 40.
    Possible designs Concepts: (1)drag Pro • Maximum use of drag Con • Paper parachute is top heavy  flips over parachute 40
  • 41.
    Concepts: (1) Rotation (2)forward velocity (3) Lift (4) Drag Possible designs Pro • Most modes of dissipation • Large area for drag Con • Very flimsy tumblewing 41
  • 42.
    Expt. details: helicopter •Approx.70% of paper as blades •Varied angle of attack and measure flight time •Timing increases over falling paper by 10 – 20% Angle of attack / o Time in air / s 0 2.30 ± 0.13 7 2.71 ± 0.13 10 2.91 ± 0.13 15 2.85 ± 0.13 20 2.81 ± 0.13 2.0 2.2 2.4 2.6 2.8 3.0 0 20 Timeinair/s α / °
  • 43.
    Expt. details: glider •15 models of paper gliders with initial launching angles 0̊, 20̊, 40̊, 60̊ and 80̊. • Bank and pitch corrections made via ailerons and elevators. 43  Flight times barely exceed 2sec
  • 44.
    Expt. details: parachute 44 ParachuteAvg time: 2.28s Blunt head Avg time: 2.58s
  • 45.
    Measurements & calculations •Flight time • Tumbling frequency, Ω • Horizontal velocity, 𝑉∥ • Vertical velocity, 𝑉⊥ • Energy lost via dissipation = 𝑀𝑔ℎ − 1 2 𝐼𝜔2 − 1 2 𝑀𝑉∥ 2 − 1 2 𝑀𝑉⊥ 2 • Reynolds number = 𝜌 𝑓Ω𝑥2 𝜇 (Mahadevan et al., 1999) ▫ Re ranged between 1000 -2000 45 Introduction Theory: maximising dissipation Experiments Conclusion
  • 46.
  • 47.
    Vorticity • Kármán vortexstreet (R. Mittal et al., 2003) ▫ Periodic vortex shedding • Strength and frequency of vortex shedding and rotation rate interacts in complex and unknown manners. 47
  • 48.
    Flow visualisation 48 Aluminium platein water (1.2 x 6cm) Re ~800 Shedding frequency = 4Ω t=0 t=0.5 t=1.0 t=1.5
  • 49.
    Theory: High pressure 49 Donewith Solidworks Fluid Analysis Literature: 1. Tumbling cards, L. Mahadevan et al., 1999 2. Unsteady aerodynamics of fluttering and tumbling plates, Z. Jane Wang et al., 2005
  • 50.
    Magnus effect 50 0.0 20.0 40.0 60.0 80.0 100.0 120.0 140.0 160.0 0.0 2.04.0 6.0 8.0 10.0 12.0 14.0 Vx/ms-1 Ω/Hz Vx against Ω (varying chord)
  • 51.
    Magnus effect 51 0.0 20.0 40.0 60.0 80.0 100.0 120.0 140.0 3.5 3.73.9 4.1 4.3 4.5 4.7 Vx/cms-1 Ω/Hz Vx against Ω (varying span)
  • 52.
    Magnus effect 52 70.0 75.0 80.0 85.0 90.0 95.0 100.0 1.0 2.03.0 4.0 5.0 6.0 7.0 8.0 Vx/cms-1 Ω/Hz Vx against Ω (fixed surface area)
  • 53.
    Magnus effect (theory) •𝐹 𝑀 = 𝑆(𝜔 × 𝑣) • Bernoulli’s equation ▫ 𝑝 + 1 2 𝜌𝑉2 + 𝜌𝑔ℎ = 𝑐𝑜𝑛𝑠𝑡. 53
  • 54.
    Drag equation appliedto tumblewing Drag Equation: 𝐹 𝐷 = 1 2 𝐶 𝐷 𝜌 𝑓 𝑉2 𝑆 𝐹⊥ = −𝐴 𝜌 𝑓 𝑥𝑦 𝑉⊥ 2 |𝑐𝑜𝑠𝜃| 0 𝜋 2 𝑐𝑜𝑠𝜃 𝑑𝜃 𝜋 2 = 0.64 𝑭⊥~𝝆 𝒇 𝒙𝒚𝑽⊥ 𝟐 54 θ
  • 55.
    Drag equation appliedto tumblewing 𝐹⊥~𝜌 𝑓 𝑥𝑦𝑉⊥ 2 𝑚𝑔~𝜌 𝑓 𝑥𝑦𝑉2 𝑽⊥~ 𝒎𝒈 𝝆 𝒇 𝒙𝒚 𝟏 𝟐 𝒕 𝜶 𝒙𝒚 55
  • 56.
    Effect of surfacearea 56 y = 0.3317x - 2.4624 R² = 0.9845 1.000 1.500 2.000 2.500 3.000 3.500 4.000 4.500 5.000 5.500 12 14 16 18 20 22 24 Flighttime/s √Surface area /cm Flight time against sqroot SA
  • 57.
    Predicting flight time 57 0 0.2 0.4 0.6 0.8 1 1.2 1.4 1.6 05 10 15 20 25 30 Avg.Verticalspeed/cms-1 trial no. Comparing actual speed against predicted speed predicted speed actual speed (varying AR) actual speed (varying chord) actual speed (varying span) actual speed (optimum)
  • 58.
    Comparing skin &form drag • 𝐹⊥ = 𝐴⊥ 𝜌 𝑥𝑦 𝑉2 ▫ 𝐴⊥ = 4.1 ± 0.1 • 𝐹∥ = 𝐴∥ 𝜌 𝑥𝑦 𝑉2 ▫ 𝐴∥ = 0.88 ± 0.03 (From Flutter to Tumble: Inertial Drag and Froude Similarity in Falling Paper, A. Belmonte et al., 1998) 58
  • 59.
    Small edge widthindeed better • For the optimum tumblewing 2 models were actually tested. 59 Edge width AR Flight time 1.0 cm 4.5 5.546 ± 0.008 0.5 cm 4.1 6.049 ± 0.008
  • 60.
    General behaviour oftumblewing 60 y = 56.12x-1.268 R² = 0.9149 0.0 2.0 4.0 6.0 8.0 10.0 12.0 14.0 16.0 2 4 6 8 10 12 Ω/Hz x/cm Ω against x Tumbling Cards, L. Mahadevan et al., 1999
  • 61.
    61 General behaviour oftumblewing 2.0 2.5 3.0 3.5 4.0 4.5 5.0 5.5 0.0 2.0 4.0 6.0 8.0 10.0 12.0 14.0 16.0 2 4 6 8 10 12 14 Flighttime/s Ω/Hz x/cm Ω against x Ω against x flight time Power (Ω against x)
  • 62.
    Properties of A4paper Property Values Mass: 4.990 x 10⁻³ kg Dimensions: 0.211m by 0.298 m (0.0629m2) Volume: 6.917 x 10⁻⁶ m2 Density 730 kg·m-3 62
  • 63.
    Data sheet rho_air (kgm-3) 1.1644 mu_air (kg m-1 s-1) 1.98E-05 mass of paper (kg) = 0.00499 initial mgh 0.12238 mgh error 0.000367 thickness 0.00011 MOI (kg m2) 10−6 63

Editor's Notes

  • #3 … From the possible designs, we will pick a best design.
  • #4 That brings us to the 2nd part of my presentation, where I will focus on optimising the chosen design. I will begin with the theory…
  • #6 Released from rest at translational and rotational equilibrium.  no net force or torque input.
  • #9 We approach this question using the law of energy conservation.
  • #17 Now I shall move to the second part of my presentation, where we will focus on optimising the flight time of the tumblewing. A flat piece of paper of any size, when dropped, will either flutter or tumble. Tumbling, occurs when certain conditions of dimensions and orientation are satisfied.(* do demo with card). We can see that when tumbling occurs, the flight time is significantly lengthened. Thus we base our device on the principles of autorotation.
  • #18 The tumblewing consists of a rectangular sheet of paper. The device has a wingspan y and a chord length x. Aspect ratio AR is defined as y/x, and surface area will be xy. The forward and back ends are folded downwards and upwards respectively to aid in rotation. For simplicity, part folded down will be defined as the leading edge and the part folded up will be defined as the trailing edge (although technically incorrect). (Q & A: Now you may ask what’s the point of the edges. Previously, when the card was flat, it did not tumble when placed flat. By adding the edges, it will tumble when placed at any angle. We are in a sense forcing rotation to occur. And rotation occurs faster with the edges.)
  • #19 I don’t know how to increase play rate. However if I don’t have enough time I can cut off the end and put the full video into hidden slides.
  • #20 As the tumblewing is released, the leading edge traps air, creating a high pressure region below the leading edge. The resulting torque rotates the card counterclockwise, as it begins to move broadside-on. If inertial forces are large enough, the wing continues past the broadside-on position and the cycle repeats itself. The rotation traps a cylinder of air that rotates with the wing. The wing then moves forward and generates lift through the Magnus effect. Based on the Magnus effect, there will be a driving force that pushes the tumble wing forward. As the wing moves to the left, there is relative airflow to the right. Again, based on the Magnus effect, there will be lift generated.
  • #21 Thus we model the modes of energy dissipation of the tumblewing as such. Energy conversion from potential energy is categorised into the following forms: Kinetic energy in vertical axis, Translational KE in horizontal plane, rotational energy and dissipation through the 4 modes of lift, drag, vortex shedding and flexing. To prolong the descent we want to maximise the modes in green. Now we shall examine which mode of dissipation plays a more significant role.
  • #22 Let us first look at drag. Based on the drag equation, we propose a simple scaling law to estimate the upward drag force on the tumblewing. After the wing reaches steady state, its average terminal velocity becomes a constant, reflecting a balance between gravity and drag. Thus, we can model drag force as such. (Wont surface area change when tumblewing rotates? We can approximate rotation to a cosine function, on average it becomes a constant  in hidden slides)
  • #23 Using the values of velocity and surface area of the tumblewings used in our preliminary trials, we found that work done by drag is on the order of 10-2. Comparing the values with the initial potential energy, we found that drag can constitute over 60% of energy dissipated. Thus, from here we can conclude that the optimum wing must make full use of surface area. This assertion is backed up by experimental results (show in hidden slides) Knowing that we want to make full use of surface area, we now have to find out what shape would give us the maximum flight time for a fixed maximum surface area. Thus, we shall move on to our experimental section, where we will investigate this parameter.
  • #24 We built a LEGO launcher with a quick release mechanism to eliminate any possible human error from launching by hand. The launcher allowed us to vary the launch angle of the wing. The experiment was conducted in an enclosed environment to eliminate wind. All descents are captured on high speed camera for video analysis. Only data in which the wing had reached steady state was analysed.
  • #25 In our first experiment, to find the optimum aspect ratio for a fixed surface area, we built 15 tumblewings with AR varying from 3.0 – 17.2. A surface area of 450 was chosen because it was close to the maximum surface area of the paper and it allowed for easy variation of wing dimensions. We also fixed the edge width at 1cm and the launch angle was fixed at 45. If they say the flight time some high some low is because your surface area is +-3, say that we measured the surface area for each wing and that those with shortest flight time were not the ones with the least surface area. Thus such a small variation in SA had little influence on experimental results.
  • #26 Here is a graph of flight time against aspect ratio. We can see that there is no clear trend between flight time and aspect ratio due to multiple modes of dissipation present and complex interactions of the wing with air. However, we can see that optimum flight time is achieved with a wing of AR 4.5. Thus we have determined the optimum aspect ratio for a fixed surface area.
  • #27 Next, we thought that edge width might affect flight time as well. Thus, for experiment 2, using the best wing from the previous experiment, we varied the edge width, with launch angle fixed again at 45deg.
  • #28 Here we can see that flight time decreases with increasing edge width. Thus we can conclude that we want to have as narrow an edge width as possible.
  • #29 Next, we thought that launch angle could have an effect on descent time as it can influence how long it take for the wing to transition into rotation. Thus in our last experiment we varied the launch angle θ, where θ the angle from vertical. We used the same wing from previous experiments, with AR 4.5 and edge width 1cm.
  • #30 In the graph of flight time against launch angle, we found that launch angle only affects flight at 0 or past 70deg. Within this range, launch angle will not affect flight time. At 90deg, fluttering occurs at launching. Past 90deg, is the dead zone, where the wing slips backwards, and the motion becomes chaotic. Here we conclude that we want a moderate launch angle.
  • #31 In conclusion, we found that the best tumblewing must have the following characteristics. With this knowledge, we designed our optimum model.
  • #32 Comparing the flight time of our optimum tumblewing, shown by the orange bar, it clearly has a much longer flight time than all other tumblewings tested.
  • #40 12. A glider needs to be given an initial forward velocity to generate the lift to fly. If dropped from rest, it is initially in a state of stall, and has to dive to gain enough airflow over the wings for lift. This initial dive sacrifices too much flight time for a glider to be effective.
  • #51 32. This shows that as rotation rate increases, horizontal velocity increases, proving that the Magnus effect exists.
  • #57 36. Combining the results of the previous 2 experiments, we can see that it is surface area, and not shape, that has the most significant effect on descent time.