The study investigates the efficiency of airplane winglets in reducing drag and increasing lift compared to traditional wing designs at cruising speed using computational fluid dynamics simulations. Results demonstrate that winglets led to a 26.0% increase in lift and a 74.6% decrease in drag, thereby enhancing overall wing performance and fuel efficiency. The findings suggest that winglets improve stability and aerodynamics of aircraft wings, supporting further research into their design and implementation.

![(a) An Eagle (b) Airbus 320 Neo
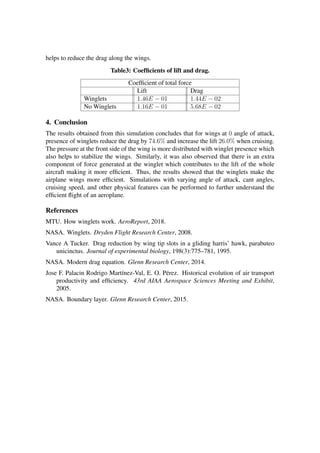
Figure 1. Bio-inspired winglet similarities between an eagle and A320 Neo.
where Cd is the total drag coefficient, Cdo is the base drag which occurs at zero
lift, and Cdi is the induced drag.
One of the strategies implemented in order to minimize the effect of drag in the
airplane wings is having winglets [MTU(2018)]. Winglets are the curved shape of the tip
of the airplane wings. The bent shape of the wings provides a forward lift which opposes
the drag produced by the vortices. Thus overall, winglets favor the forward motion of
the airplane which results in fuel efficiency. According to the flight test conducted in
NASA Dryden Flight Research Center, the fuel use of Boeing 707 airliners with winglets
resulted in a 6.5% reduction compared to the regular rectangular wingtip [NASA(2008)].
The design of winglets in airplanes is usually known to be bio-inspired mimicking the
gliding of eagles, hawks, or other birds of prey as shown in Figure 1 [Tucker(1995)].
This project intends to compare wings with regular tips to the wings with winglets
to analyze the lift and drag coefficients during a flight using Computational Fluid Dy-
namics (CFD). COMSOL Multiphysics was used to run the simulations. Here, wings at 0
angle of attack at cruising speed were modelled.
2. Method and Use of COMSOL Multiphysics R Software
2.1. Domain selection
The airplane wings both with and without winglets were designed using AutoDesk In-
ventor and converted into an .stl file which was then imported into COMSOL. These
designs represent simplified model of an average commercial aircraft wings. The wings
dimension was approximately 17.5m length, 6.8m maximum width, and maximum airfoil
thickness was 0.8m. The winglet adds an extra 1m in length and 2m in height. In this
simulation, the computation domain however, is the air surrounding the wings. Therefore,
the wings were placed inside a cuboid which represents the air domain of dimension 20m
x 10m x 5m. This volume was selected so that it is enough to capture the major changes
in the fluid flow at the structure/fluid boundary but small enough to have a relatively fast
model in terms of computation time and storage.
2.2. Governing Equation
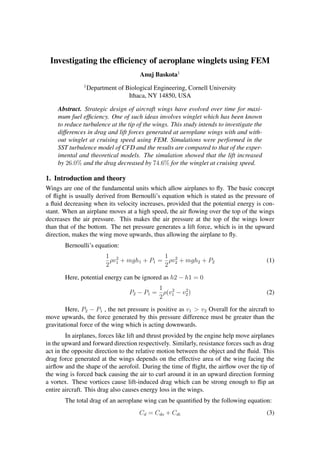
COMSOL’s built-in fluid module uses Navier-Stokes equations as shown in 4). The SST
model combines the near-wall capabilities of the kω model with the superior free-stream
behavior of the k model to enable accurate simulations of a wide variety of internal
and external flow problems. This model’s equation is based on k and ω , where ω is the
specific dissipation rate.](https://image.slidesharecdn.com/airplanewingsfem-201007233720/85/Airplane-wings-fem-2-320.jpg)
![∂(ρ−→u )
∂t
+
−→
· (ρ−→u ) = −
−→
p +
−→
· τ + ρ
−→
f (4)
where ρ is the density of air, u is the velocity, p is the pressure, τ is the tensile
stress, and f is the external force which in our case is gravity.
2.3. Boundary Conditions
The front side fluid domain was considered to be an inlet with the speed of
250m/s(560mph) which corresponds to a general cruising velocity of airplanes. The
back side was set to be the outlet with 0Pa pressure. The remaining 4 sides were as-
signed as symmetry boundary condition which represents the open boundaries.
2.4. Mesh Generation
Free tetrahedral mesh was generated with 260,530 domain elements in fluid domain as
shown in Figure 3. This was the predefined fine setting in COMSOL. The elements of this
mesh was calibrated for general physics. In addition, distributed mesh was used around
the winglet/fluid boundary in order to capture minor changes of velocity and pressure
around this region. The boundary element number was 18,324 where as the edge element
was 1884.
Figure 2. Mesh of the fluid domain and the winglets
2.5. Lift and Drag Force Derivation
For this particular simulation, the goal was to compare whether the airplane wing is more
efficient with a winglet. As mentioned in the introduction, the flight can be more effi-
cient with minimum resisting forces and maximum driving forces. Therefore, the force
components of drag and lift generated in the wings provide a better understanding on the
overall resistance of the aircraft. Coefficient of drag and lift were calculated to compare
the efficiency of the wings. The lift (L) and drag (D) forces are as follows [NASA(2014)]:
L =
1
2
CLρSu2
(5)](https://image.slidesharecdn.com/airplanewingsfem-201007233720/85/Airplane-wings-fem-3-320.jpg)
![D =
1
2
CDρAu2
(6)
where u is the velocity of fluid, ρ is the density, CL and CD are coefficients of lift and
drag respectively. The area that is considered while calculating lift and drag are different.
Here, A is the area of the wings which come in contact with the inlet fluid (parallel to the
drag) and S is the area of the wings (perpendicular to the lift) which is perpendicular to
the lift force.
In COMSOL, these forces were derived using specific expressions for fluid flow
without wall function. Table 1 shows the expressions that will be integrated in either x,y,
or z directions depending on the direction of the force.
Table1: Expressions used for components of drag and lift forces.
Force expressions
Drag Lift
Pressure Force spf.nxmesh ∗ p spf.nymesh ∗ p
Viscous Force −spf.Kstressx spf.nymesh ∗ p
Total Force −spf.Tstressx spf.nymesh ∗ p
2.6. Computation Details
The analysis was performed as a steady state fluid flow. The Iterative solver (GMRES)
was used to run the stationary simulations in COMSOL. The absolute tolerance was set
as 0.1. The average computation time for one simulation was approximately 40 minutes.
3. Results and Discussion
To analyze the effect of airflow on the wings, graphics of static pressure at the steady-state
was extracted. This is the 3-D pressure field plot of the wings. This allowed us to visu-
alize the pressure distribution throughout the wings and also compare the pressure values
between the winglet and no winglet configuration. The pressure experienced by the wings
is least at the center as observed in Figure 3 and Figure 4. We can also observe increasing
pressure at the edge of the wings where the air leaves the wings. In realistic scenarios, the
pressure at this edge would be less due to the curved airfoil. From Figure 3 and Figure
4, we see that the magnitude of pressure at the front-facing side of the wing is less with
winglet configuration. The pressure is distributed along the edge of the winglet which
helps the airplane wings to be more steady. Similarly, we observe increasing pressure
in the outer edge of the winglet which would also contribute to increasing lift along the
z-axis. This provides extra lateral stability of the wings as well as contribute to the overall
lift.
To compare the efficiency, drag and lift forces were calculated using the method pro-
vided above from COMSOL. Table 2 shows the force components of drag and lifts for the
winglet and no winglet configulations. The coefficient of lifts and drag were calculated
using the equations 5 and 6 and the values are provided in Table 3. Here, the winglet had
an increase in the lift force by 26.0% and decrease in the drag by 74.6%. The ratio of
lift to drag was 10.2 and 2.04 for the winglet and no winglet configurations. In realistic
cases, the Boeing 747-4 and the Airbus A330-300 have lift to drag ratio of 15.5 and 18.1
[Rodrigo Mart´ınez-Val(2005)].](https://image.slidesharecdn.com/airplanewingsfem-201007233720/85/Airplane-wings-fem-4-320.jpg)
![Figure 3. Static pressure observed at steady state for no winglet configuration.
Figure 4. Static pressure observed at steady state for winglet configuration.
Table2: Components of lift and drag forces generated.
Force components (N)
Force Pressure (-) Viscosity Total (-)
Winglets Lift 3.541e5 48.001 3.54e5
Drag 3.489e4 39.778 3.485e4
No Winglets Lift 2.8087e5 25.577 2.8085e5
Drag 2.925e4 41.589 2.922e4
Usually at high speed, the Reynolds number is very high. However, in the bound-
ary layer that is very close to the wall of the wings, the velocity is lower due to which the
viscous force has a higher effect [NASA(2015)]. In our case, the obtained viscous forces
are very small compared to the force due to the pressure. Viscous forces, although low in
magnitude, might cause severe drag in boundary layers where the velocity (inertia effect)
is minimum. In our simulation, we obtained lower viscous forces in both cases which](https://image.slidesharecdn.com/airplanewingsfem-201007233720/85/Airplane-wings-fem-5-320.jpg)