SESSION 9 - Maths - Fractions, Decimals and Percentages
•Download as PPTX, PDF•
1 like•827 views
1) The document discusses visualisation in mathematics teaching, specifically with fractions, decimals, and percentages. 2) It provides examples of visual models and activities that can be used to help students understand relationships between fractions, decimals, and percentages, such as using counting sticks, shapes, number lines, and equivalence charts. 3) Resources are suggested for teachers, including websites, books, and articles that provide additional information and strategies for visual teaching methods in math.
Report
Share
Report
Share

Recommended
How To Do KS2 Maths SATs Paper A Percentage Questions (Part 1)
This document provides guidance on calculating percentages for KS2 maths SATs exams. It explains that percentages questions will ask the reader to calculate a percentage of an amount. It then walks through examples of calculating 5%, 10%, 15% and other percentages of various amounts, including money amounts. The document emphasizes calculating the 10% first before calculating smaller percentages that are portions of 10%, like 5%. It concludes by providing some practice problems for the reader to try calculating percentages on their own.
How To Do KS2 Maths SATs Paper B Percentage Questions (Part 2)
This document provides instructions for calculating percentages from grids for KS2 maths SATs questions. It explains that you count the number of shaded or colored tiles, express it as a fraction of the total tiles, and convert that fraction to a percentage by changing the denominator to 100. Two examples are shown step-by-step: calculating that 6 out of 20 tiles shaded is 30% and 14 out of 50 tiles green is 28%. The document ends by providing three practice problems for the reader to solve.
Lesson 3 term, expression, equation and substituting
Here are a few things that went well in today's lesson, and some suggestions for how it could be even better:
What went well:
- Students practiced generating algebraic terms and expressions, which is an important skill. Generating examples is a good way to build understanding and fluency.
- The lesson included clear explanations of key vocabulary like variable, term, expression, etc. Defining important terms helps students follow along.
- Different levels of challenge questions allowed students to work at their own pace and be appropriately stretched. Scaffolding helps ensure success.
Even better if:
- After generating examples, students could explain the patterns they noticed or rules they were following. This helps solidify their thinking.
-
Year 5 Term 4 smartie maths
The document lists various math and statistics questions related to Smarties candy. Some examples of questions asked include how many Smarties will fit in one's mouth, the circumference and diameter of a Smartie, calculating costs of Smarties packets, measuring weights of Smarties, probabilities of drawing certain colored Smarties, dividing and sharing Smarties among groups, and representing Smartie data using graphs and percentages.
Fractions, Decimals and Percentages
Fractions, decimals, and percentages are different ways of representing parts of a whole. The document discusses the relationships between fractions and decimals, fractions and percentages, and decimals and percentages. It provides a high-level overview of how these concepts are related and can be converted between each other.
Maths multiplying by a percentage
Students will work in pairs to play a card game where they determine the monetary value of turned over cards and track their totals. The pair with the most money after all cards are played keeps both cards. As students master the skills, the difficulty of the cards will increase and higher performing pairs will earn house points.
Photolanguage australia toronto pres.
American Evaluation Association Presentation at annual conference in November 2009 by Rebecca White and Diane Sasser.
Percentages
This chapter discusses how to convert between percentages, fractions, decimals, and ratios. It provides examples of how percentages are used in various medical contexts like medications, burns, and intravenous solutions. It also outlines the key steps to convert between these representations of fractional values.
Fraction, Decimal, Percentage
This document contains several word problems involving fractions, percentages, and other calculations:
1) A student had 21 chocolate bars and gave 14 to a friend. They must calculate what fraction of the bars they kept and simplify the fraction.
2) Information is given about the percentages of students from different countries in a class, and they must calculate the percentage from a specific country.
3) Data is provided about students voting for different lessons, and they must calculate how many students were undecided and voted for specific lessons.
4) Another student collects cards and swaps and gives some away, and they must calculate the fractions and amounts of cards the student keeps and gives away.
Converting fractions and decimals to percents modifiied
The document discusses converting fractions and decimals to percents. It provides examples of moving the decimal point two places to the right for decimals to convert to percents, and examples of dividing the numerator by the denominator and multiplying by 100 for fractions to convert to percents. It also includes practice problems and spaces to fill in answers.
Converting Fractions, Decimals And Percentages
This document provides a list of fraction, decimal, and percentage conversions for practice. It includes converting 34%, 2%, 18%, 1%, 11%, 121%, 87%, and 3% to decimals, and converting .31, 0.87, 0.09, .08, .3, .7, 0.9, and .98 to percentages.
Converting fractions percentages
This document discusses how to convert fractions to decimals and percentages. It explains that to convert a fraction to a percentage, you first convert it to a decimal by dividing the top number by the bottom number. Then to get the percentage, you move the decimal point two places to the left and add the percentage sign. Some common fraction-decimal-percentage conversions are also provided.
fractions, decimals and percentages
The document discusses fractions, percentages, and decimals. It provides examples of how the three representations can be used to show the same quantity, such as 1/2, 0.5, and 50%. The document also discusses how fractions, percentages, and decimals are used in everyday contexts like dividing pizza and measuring child labor statistics around the world.
number system
The document provides an overview of the history and types of number systems. It discusses how ancient civilizations like the Egyptians, Babylonians, and Mayans developed different base number systems based on counting fingers and toes. It then explains the modern decimal number system and provides examples of different types of numbers like rational, irrational, integer, natural numbers. The document also briefly touches on concepts like terminating and recurring decimals as well as scientists who contributed to the study of number systems.
34 conversion between decimals, fractions and percentages
The document discusses the conversion between decimals, fractions, and percentages. It states that fractions, decimals, and percentages are different ways to express quantities. Fractions provide instructions to divide a whole into parts, while decimals standardize fractions to powers of 10 to make addition and subtraction easier. Percentages express a quantity as a ratio out of 100. The document then provides examples and steps for converting between these representations.
Student Response - Fractions decimals and percentages
This document provides an introduction to fractions, decimals, and percentages. It includes examples of equivalent fractions, finding 10% of quantities, and converting between fractions, decimals, and percentages. The learning objectives are to understand equivalent fractions, find 10% of quantities, and solve simple problems involving fractions, decimals, and percentages. Key concepts covered are equivalent fractions, decimals, and percentages.
Lesson plan survey and data generation
This maths lesson plan teaches students about fractions, decimals, percentages, and graphs. Students will design and conduct a survey to collect data on a topic of their choice. They will then convert the survey results into fractions, decimals, and percentages. Finally, students will represent the data visually using pie charts and bar graphs to develop their understanding of graphical representations. The lesson aims to further students' knowledge of key math concepts through a real-world data collection and analysis activity.
Percentages
This document provides an overview of ratios, proportions, and percentages. It defines a ratio as a comparison of numbers expressed as a fraction. Proportions are statements that two ratios are equal. To solve proportions, terms are cross multiplied. Percentages express a number out of 100. To convert between fractions, decimals, and percentages, the decimal is moved or the number is divided by 100. Percentages can be used to find a part of a whole number by calculating the percentage as a decimal and multiplying it by the whole number.
6 percentages, conversion between fractions, decimals and percentages
The document defines percentages as representing "how many out of 100" and can be written as a fraction with the percentage symbol or as a decimal. It provides examples of common percentages such as 1% = 1/100, 5% = 1/20, 10% = 1/10, 25% = 1/4, and 50% = 1/2. The document also works through examples of calculating percentages of a total amount, such as finding 3/4 of $100 and 45% of 60 pieces of candy. It concludes with a list of important simplified percentages related to coins.
Ideas for teaching chance, data and interpretation of data
These activities have been designed specifically for Year 3 students according to the Australian Curriculum guidelines. However, they can be adapted to meet other standards or year levels.
Fractions, percentages, decimals
This document discusses fractions, decimals, percentages, and their conversions. It provides examples of changing fractions to decimals and percentages, including mixed numbers and improper fractions. It then discusses applications of percentages, including problems involving finding percentages of numbers and original values given a percentage discount or increase. The document aims to teach learners how to work with fractions, decimals, and percentages through examples and exercises involving their conversions and applications.
Fractions, decimals, and percentages
This document provides an overview of fractions, decimals, and percentages. It explains how to convert between the different representations and compare their values. Key points covered include:
- Fractions represent a part over a whole
- To convert a fraction to a percentage, express it with a denominator of 100
- To convert a percentage to a fraction, write it as a fraction over 100
- To write a decimal as a percentage, multiply it by 100 and add the percent sign
- Fractions, decimals, and percentages can be compared by first converting them to the same representation (e.g. fractions over 100) and then comparing their values.
Long Division
Long division is explained using a family as an analogy to represent the steps. Dad represents dividing, Mom represents multiplying, Sister represents subtracting, Brother represents bringing down digits, and Rover represents repeating the process or getting the remainder. The document then walks through a long division problem step-by-step using this personification analogy to illustrate each part of the long division process.
Mathpresentation 170503073857 (1)
The document provides an agenda for a professional development session on using math manipulatives to help students develop mastery of common core math standards. The session will include exploring strategies for using manipulatives to teach numbers less than one, sharing resources for 21st century math teaching, and working with tools to develop conceptual understanding. Presenter Jacqueline Burns will discuss how manipulatives can help students progress from concrete to representational to abstract understanding of math concepts.
Math Presentation
The document provides an agenda for a professional development session on using math manipulatives to help students develop mastery of common core math standards. The session will include exploring tools and strategies to help students understand numbers less than one, as well as sharing high quality teaching resources. Participants will learn about the purpose and benefits of using manipulatives, work with tools to develop conceptual understanding, and broaden their awareness of math resources. The session aims to increase the effective use of manipulatives and support 21st century mathematics teaching and learning.
Maths Presentation (Bahrain 11.03.2017)
The document summarizes a math workshop presented by Jacqueline Burns on using manipulatives to help students develop Common Core math mastery. The workshop covered increasing awareness of using tools like counters and number lines to develop conceptual understanding of topics like fractions. It included sessions on specific math resources, exemplar tasks, and strategies for teaching topics like numbers less than one. The agenda also discussed developing math practices like reasoning abstractly and constructing arguments.
Math Toolkit Time
The document provides an agenda for a math workshop on using manipulatives to help students develop mastery of common core math standards. The workshop includes sessions on using specific math tools, teaching numbers less than one, and resources for 21st century teaching and learning. The objectives are to increase awareness of using manipulatives to develop conceptual understanding and provide strategies and resources to support math instruction.
MATHS: KS2 Geometry 23.04.15
This document discusses the importance of visualization in mathematics teaching and learning. It provides examples of visualization activities and resources that teachers can use, such as shape puzzles, pattern activities, and drawing representations. The document emphasizes that visualization is a critical skill and teachers should aim to understand how students visualize mathematical concepts. Practical experiences are important for developing visualization abilities, which can then progress to more abstract experiences.
Lesson 13; Teaching with Visual Symbols
This document discusses various visual symbols that can be used for teaching, including drawings, cartoons, strip drawings, diagrams, charts, graphs, and maps. It provides examples and explanations of different types of diagrams, charts, and maps that are useful teaching tools. Diagrams discussed include tree diagrams, fishbone diagrams, affinity diagrams, and process flow charts. Types of charts include pie charts, bar graphs, line graphs, organizational charts, Pareto charts, and Gantt charts. Maps can be physical, relief, political, economic, or show geographic grids. The document emphasizes that visual symbols can make abstract concepts more concrete and help summarize experiences to improve understanding for students.
Data visualization & Story Telling with Data
Storytelling with data using the appropriate visualization is a skill that is well sought-after for data-driven decision making and it spans many industries and roles (technical/non-technical).
In this presentation, we will briefly discuss the importance of understanding the context, selecting the right visuals, key points for effectively using those for storytelling, design dos, and don’ts, etc.
More Related Content
Viewers also liked
Fraction, Decimal, Percentage
This document contains several word problems involving fractions, percentages, and other calculations:
1) A student had 21 chocolate bars and gave 14 to a friend. They must calculate what fraction of the bars they kept and simplify the fraction.
2) Information is given about the percentages of students from different countries in a class, and they must calculate the percentage from a specific country.
3) Data is provided about students voting for different lessons, and they must calculate how many students were undecided and voted for specific lessons.
4) Another student collects cards and swaps and gives some away, and they must calculate the fractions and amounts of cards the student keeps and gives away.
Converting fractions and decimals to percents modifiied
The document discusses converting fractions and decimals to percents. It provides examples of moving the decimal point two places to the right for decimals to convert to percents, and examples of dividing the numerator by the denominator and multiplying by 100 for fractions to convert to percents. It also includes practice problems and spaces to fill in answers.
Converting Fractions, Decimals And Percentages
This document provides a list of fraction, decimal, and percentage conversions for practice. It includes converting 34%, 2%, 18%, 1%, 11%, 121%, 87%, and 3% to decimals, and converting .31, 0.87, 0.09, .08, .3, .7, 0.9, and .98 to percentages.
Converting fractions percentages
This document discusses how to convert fractions to decimals and percentages. It explains that to convert a fraction to a percentage, you first convert it to a decimal by dividing the top number by the bottom number. Then to get the percentage, you move the decimal point two places to the left and add the percentage sign. Some common fraction-decimal-percentage conversions are also provided.
fractions, decimals and percentages
The document discusses fractions, percentages, and decimals. It provides examples of how the three representations can be used to show the same quantity, such as 1/2, 0.5, and 50%. The document also discusses how fractions, percentages, and decimals are used in everyday contexts like dividing pizza and measuring child labor statistics around the world.
number system
The document provides an overview of the history and types of number systems. It discusses how ancient civilizations like the Egyptians, Babylonians, and Mayans developed different base number systems based on counting fingers and toes. It then explains the modern decimal number system and provides examples of different types of numbers like rational, irrational, integer, natural numbers. The document also briefly touches on concepts like terminating and recurring decimals as well as scientists who contributed to the study of number systems.
34 conversion between decimals, fractions and percentages
The document discusses the conversion between decimals, fractions, and percentages. It states that fractions, decimals, and percentages are different ways to express quantities. Fractions provide instructions to divide a whole into parts, while decimals standardize fractions to powers of 10 to make addition and subtraction easier. Percentages express a quantity as a ratio out of 100. The document then provides examples and steps for converting between these representations.
Student Response - Fractions decimals and percentages
This document provides an introduction to fractions, decimals, and percentages. It includes examples of equivalent fractions, finding 10% of quantities, and converting between fractions, decimals, and percentages. The learning objectives are to understand equivalent fractions, find 10% of quantities, and solve simple problems involving fractions, decimals, and percentages. Key concepts covered are equivalent fractions, decimals, and percentages.
Lesson plan survey and data generation
This maths lesson plan teaches students about fractions, decimals, percentages, and graphs. Students will design and conduct a survey to collect data on a topic of their choice. They will then convert the survey results into fractions, decimals, and percentages. Finally, students will represent the data visually using pie charts and bar graphs to develop their understanding of graphical representations. The lesson aims to further students' knowledge of key math concepts through a real-world data collection and analysis activity.
Percentages
This document provides an overview of ratios, proportions, and percentages. It defines a ratio as a comparison of numbers expressed as a fraction. Proportions are statements that two ratios are equal. To solve proportions, terms are cross multiplied. Percentages express a number out of 100. To convert between fractions, decimals, and percentages, the decimal is moved or the number is divided by 100. Percentages can be used to find a part of a whole number by calculating the percentage as a decimal and multiplying it by the whole number.
6 percentages, conversion between fractions, decimals and percentages
The document defines percentages as representing "how many out of 100" and can be written as a fraction with the percentage symbol or as a decimal. It provides examples of common percentages such as 1% = 1/100, 5% = 1/20, 10% = 1/10, 25% = 1/4, and 50% = 1/2. The document also works through examples of calculating percentages of a total amount, such as finding 3/4 of $100 and 45% of 60 pieces of candy. It concludes with a list of important simplified percentages related to coins.
Ideas for teaching chance, data and interpretation of data
These activities have been designed specifically for Year 3 students according to the Australian Curriculum guidelines. However, they can be adapted to meet other standards or year levels.
Fractions, percentages, decimals
This document discusses fractions, decimals, percentages, and their conversions. It provides examples of changing fractions to decimals and percentages, including mixed numbers and improper fractions. It then discusses applications of percentages, including problems involving finding percentages of numbers and original values given a percentage discount or increase. The document aims to teach learners how to work with fractions, decimals, and percentages through examples and exercises involving their conversions and applications.
Fractions, decimals, and percentages
This document provides an overview of fractions, decimals, and percentages. It explains how to convert between the different representations and compare their values. Key points covered include:
- Fractions represent a part over a whole
- To convert a fraction to a percentage, express it with a denominator of 100
- To convert a percentage to a fraction, write it as a fraction over 100
- To write a decimal as a percentage, multiply it by 100 and add the percent sign
- Fractions, decimals, and percentages can be compared by first converting them to the same representation (e.g. fractions over 100) and then comparing their values.
Long Division
Long division is explained using a family as an analogy to represent the steps. Dad represents dividing, Mom represents multiplying, Sister represents subtracting, Brother represents bringing down digits, and Rover represents repeating the process or getting the remainder. The document then walks through a long division problem step-by-step using this personification analogy to illustrate each part of the long division process.
Viewers also liked (15)
Converting fractions and decimals to percents modifiied
Converting fractions and decimals to percents modifiied
34 conversion between decimals, fractions and percentages
34 conversion between decimals, fractions and percentages
Student Response - Fractions decimals and percentages
Student Response - Fractions decimals and percentages
6 percentages, conversion between fractions, decimals and percentages
6 percentages, conversion between fractions, decimals and percentages
Ideas for teaching chance, data and interpretation of data
Ideas for teaching chance, data and interpretation of data
Similar to SESSION 9 - Maths - Fractions, Decimals and Percentages
Mathpresentation 170503073857 (1)
The document provides an agenda for a professional development session on using math manipulatives to help students develop mastery of common core math standards. The session will include exploring strategies for using manipulatives to teach numbers less than one, sharing resources for 21st century math teaching, and working with tools to develop conceptual understanding. Presenter Jacqueline Burns will discuss how manipulatives can help students progress from concrete to representational to abstract understanding of math concepts.
Math Presentation
The document provides an agenda for a professional development session on using math manipulatives to help students develop mastery of common core math standards. The session will include exploring tools and strategies to help students understand numbers less than one, as well as sharing high quality teaching resources. Participants will learn about the purpose and benefits of using manipulatives, work with tools to develop conceptual understanding, and broaden their awareness of math resources. The session aims to increase the effective use of manipulatives and support 21st century mathematics teaching and learning.
Maths Presentation (Bahrain 11.03.2017)
The document summarizes a math workshop presented by Jacqueline Burns on using manipulatives to help students develop Common Core math mastery. The workshop covered increasing awareness of using tools like counters and number lines to develop conceptual understanding of topics like fractions. It included sessions on specific math resources, exemplar tasks, and strategies for teaching topics like numbers less than one. The agenda also discussed developing math practices like reasoning abstractly and constructing arguments.
Math Toolkit Time
The document provides an agenda for a math workshop on using manipulatives to help students develop mastery of common core math standards. The workshop includes sessions on using specific math tools, teaching numbers less than one, and resources for 21st century teaching and learning. The objectives are to increase awareness of using manipulatives to develop conceptual understanding and provide strategies and resources to support math instruction.
MATHS: KS2 Geometry 23.04.15
This document discusses the importance of visualization in mathematics teaching and learning. It provides examples of visualization activities and resources that teachers can use, such as shape puzzles, pattern activities, and drawing representations. The document emphasizes that visualization is a critical skill and teachers should aim to understand how students visualize mathematical concepts. Practical experiences are important for developing visualization abilities, which can then progress to more abstract experiences.
Lesson 13; Teaching with Visual Symbols
This document discusses various visual symbols that can be used for teaching, including drawings, cartoons, strip drawings, diagrams, charts, graphs, and maps. It provides examples and explanations of different types of diagrams, charts, and maps that are useful teaching tools. Diagrams discussed include tree diagrams, fishbone diagrams, affinity diagrams, and process flow charts. Types of charts include pie charts, bar graphs, line graphs, organizational charts, Pareto charts, and Gantt charts. Maps can be physical, relief, political, economic, or show geographic grids. The document emphasizes that visual symbols can make abstract concepts more concrete and help summarize experiences to improve understanding for students.
Data visualization & Story Telling with Data
Storytelling with data using the appropriate visualization is a skill that is well sought-after for data-driven decision making and it spans many industries and roles (technical/non-technical).
In this presentation, we will briefly discuss the importance of understanding the context, selecting the right visuals, key points for effectively using those for storytelling, design dos, and don’ts, etc.
Developing conceptual understanding of probability
1) The document discusses the importance of teaching mathematics for conceptual understanding rather than just rote learning of procedures. It emphasizes building relationships between mathematical ideas.
2) Several realities in modern classrooms are discussed, such as students applying algorithms without understanding. The significance of problem solving for developing conceptual understanding is also covered.
3) Activities are presented to help teachers promote conceptual understanding, for example having students explore concepts like probability by analyzing real-world tasks and data. Discussion of how to assess conceptual learning is also included.
Nsw 2011 final amc
The document discusses the importance of developing conceptual understanding in mathematics teaching and learning. It provides examples of activities and problems that promote conceptual understanding over rote memorization of procedures. Teachers are encouraged to assess for conceptual understanding and recognize its presence or absence. Conceptual knowledge allows students to make connections and think flexibly rather than just follow recipes to solve problems.
Presentation Math Workshop#May 25th New Help our teachers understa...
This is presented by a Math teacher,in Army Burn Hall College For Girls ,Abbottabad.
The target group was the teachers of school section. There were certain activities also performed an demonstrated in order to introduce new teaching methodologies and to prepare our teachers to meet the need of the day.
Umber
Creating Clarity 3.0: How to Design Great Visual Communication
This document provides an overview of designing effective visual presentations. It discusses taking information and creating meaningful stories for audiences. The key principles of visual communication design discussed are simplicity, using empty space, contrast, alignment, flow, proximity, and hierarchy. Specific techniques are presented like using grids, the rule of thirds, and arranging elements to guide the audience's attention. Designing slides with these principles in mind can help audiences better understand the core message.
EDMA 262 Task 1 - Part 2 Week 7
Concept: The document discusses teaching algebra concepts to primary school students.
Skill: Students learn algebra through understanding patterns, relationships, and using concrete materials to represent abstract concepts.
Strategy: It is important for students to fully understand underlying concepts before moving to skills and strategies. Teachers should ensure students are confident in concepts through visual and hands-on learning before having them calculate abstract problems.
Math Anxiety
The document discusses strategies for overcoming math anxiety and promoting understanding of mathematical concepts. It recommends teaching for understanding rather than rote memorization. Some key strategies include using hands-on activities, relating concepts to real-world examples, addressing common misconceptions, and emphasizing that mistakes are part of the learning process.
goodparentingbrighterchildren lolololololo
This document provides information on mind maps and how to make them for kids. It begins with an overview of what mind maps are, which are diagrams that visually organize information with a central topic and related branches. It then lists 8 benefits of mind maps for kids, such as helping with circular thinking, problem-solving, goal-setting, and memorization. Specific tips are provided on how to create a mind map, including using keywords, colors, and images. Examples of mind maps are shown. The document concludes by providing step-by-step instructions to create a mind map on the topic of bullying with a child.
Best Practices for Killer Data Visualization
There’s something special about simple, powerful visualizations that tell a story. In fact, 65% of people are visual learners.
Join Qualtrics and Sasha Pasulka from Tableau as we illuminate the world of data visualization and give you clear takeaways to help you tell a better story with data. Getting executive buy-in or that seat at the table may come down to who can visualize data in a way that excites and enlightens the audience.
Ass 1 part 2 EDMA262
This document summarizes Evie's digital portfolio covering pre-number concepts and place value/mental computation from weeks 5-6. It includes:
1) Descriptions of the key concepts covered in each week such as sorting attributes, ordering, patterning for pre-number concepts and place value, numeration, mental computation for weeks 5-6.
2) Explanations of concepts, skills, and strategies for topics like sorting by attribute, number sense, numeration, mental computation, and place value.
3) Examples of teaching strategies and resources that could be used to teach topics such as patterning activities, assessing mental computation abilities, and using base 10 blocks/number lines for place value
Tony buzan mind maps and making notes
Here are key words for the first 5 paragraphs:
1. Cage: Small, cricket-sized, difficult to see
2. Cricket: Mosquito-sized, fine antennae, "Grass-Lark"
3. Value: 12 cents, more than weight in gold, eats eggplant
4. Awakens at sunset: Delicate, ghostly, electric bells, penetrating, weird
5. Song: Love, organic memory, generations ago, fields, amorous
Tony buzan mind maps and making notes
Here are key words for the first 5 paragraphs:
1. Cage: Small, cricket-sized, difficult to see
2. Cricket: Mosquito-sized, fine antennae, "Grass-Lark"
3. Value: 12 cents, more than weight in gold, eats eggplant
4. Clean: Troublesome, absurd to take pains for small creature
5. Music: Delicate, ghostly, silvery, electric bells, penetrating, weird
arithmetic-vs-geometric.pptx
This document provides information about differentiating arithmetic and geometric sequences. It begins with an introduction explaining the learning objectives are to identify sequences as arithmetic or geometric, differentiate between the two types of sequences, and provide examples of each. It then provides examples of arithmetic and geometric sequences with their common differences or ratios. The document features group and individual practice problems identifying sequences and their properties. It concludes with a two-column chart comparing the key differences between arithmetic and geometric sequences.
Ece141day8class
This document provides an overview of assignments and activities for a math and science course for young children. It includes details on assignments due for different classes, as well as descriptions of in-class activities focused on fractions, numbers and place value, geometry, and more. Students are asked to create an original activity integrating math and science concepts for children and present it to the class.
Similar to SESSION 9 - Maths - Fractions, Decimals and Percentages (20)
Developing conceptual understanding of probability
Developing conceptual understanding of probability
Presentation Math Workshop#May 25th New Help our teachers understa...
Presentation Math Workshop#May 25th New Help our teachers understa...
Creating Clarity 3.0: How to Design Great Visual Communication
Creating Clarity 3.0: How to Design Great Visual Communication
More from dringl01
3keys Conference Workshop Lesson Study
Workshop jointly deliver with Julie Jordan for Sheffield Hallam University on Lesson Study as a tool for effective CPD
Innovation Network Meetings 1 & 2
This document describes a teacher professional development network that focuses on collaborative learning and using evidence-based practices to address issues in classrooms. Last year's project looked at strategies to improve writing progress for low-attaining students. The process involves identifying issues, designing inquiries, implementing interventions, and analyzing impacts. Example inquiries looked at relationship building, adapting instruction to student needs, and making writing engaging. Findings suggested strategies like scaffolding, independent practice, and student voice. Upcoming sessions will help teachers develop new inquiries and analyze data to see effects on learning.
Inclusion and supporting learners with SEN
This document discusses strategies for supporting learners with special educational needs (SEN) in mainstream classrooms. It covers national policies on SEN, the graduated approach of assess-plan-do-review, involving specialists, requesting Education, Health and Care plans, the Disability Discrimination Act, and mental health issues in schools. Specific strategies are provided for difficulties with literacy, numeracy, autism spectrum disorder, ADHD, dyslexia, attachment issues, and complex learning needs. The importance of understanding individual learners, pupil-centered planning, and developing nurturing classroom environments is emphasized.
AfL Twilight
This document discusses Assessment for Learning (AfL) and formative assessment strategies that teachers can use to evaluate student understanding and guide instruction. It outlines the key principles of AfL, including sharing learning goals, using success criteria, and self and peer assessment. Formative assessment is described as an ongoing process to inform teaching through methods like observations, conversations, and student work samples. The document provides examples of formative assessment strategies teachers can implement, such as thumbs up voting, self-assessment checklists, and identifying next steps. Teachers are tasked to try using one of these strategies in their own classroom and reflect on how it impacted their planning and instruction.
Science Investigations 1
This document discusses practical investigations in science education. It provides guidance on developing investigations, including using killer questions to engage students, the main stages of investigations, and tools for planning investigations. Suggestions are made to differentiate planning tools for different ages and abilities. The document also addresses recording observations and data, as well as creative ways for students to share their findings. Teachers are instructed to carry out a gap task by conducting a simple investigation using a provided planning tool, differentiating the tool as needed.
Behaviour twilight 18.09.14
This document summarizes a training session on positive behavior management strategies for teachers. The session discussed how childhood stress and trauma can impact brain development and behavior. Various models of behavior were presented, including behavioral, humanistic, ecological, biological, systemic, social, and cognitive models. Teachers were given examples of strategies under each model and an activity to reflect on personal experiences with strong emotions and behavior. As homework, teachers were asked to analyze factors influencing behavior in two specific students using the theories covered.
Maths SLE twighlight 11.9.2014
Twilight for Barnsley TSA School Direct Trainees on Oral & Mental Maths delivered by Kate Ainley and Dave Taylor at Worsbrough Common.
Are you ready for circles
This document contains geometry problems asking about the perimeter and area of various shapes - a rectangle, triangle, and parallelogram. It also asks to identify the incorrect area formula. The options provided suggest the breadth of the rectangle with a 48m perimeter is 12m, the area of a 7cm by 11cm rectangle is 77cm^2, the area of a triangle with base 12cm and height 18cm is 216cm^2, the area of a parallelogram with length 19cm and base 4cm is 76cm^2, and the incorrect area formula is the one for a triangle with the formula Area = B x H.
More from dringl01 (8)
Recently uploaded
ISO/IEC 27001, ISO/IEC 42001, and GDPR: Best Practices for Implementation and...
Denis is a dynamic and results-driven Chief Information Officer (CIO) with a distinguished career spanning information systems analysis and technical project management. With a proven track record of spearheading the design and delivery of cutting-edge Information Management solutions, he has consistently elevated business operations, streamlined reporting functions, and maximized process efficiency.
Certified as an ISO/IEC 27001: Information Security Management Systems (ISMS) Lead Implementer, Data Protection Officer, and Cyber Risks Analyst, Denis brings a heightened focus on data security, privacy, and cyber resilience to every endeavor.
His expertise extends across a diverse spectrum of reporting, database, and web development applications, underpinned by an exceptional grasp of data storage and virtualization technologies. His proficiency in application testing, database administration, and data cleansing ensures seamless execution of complex projects.
What sets Denis apart is his comprehensive understanding of Business and Systems Analysis technologies, honed through involvement in all phases of the Software Development Lifecycle (SDLC). From meticulous requirements gathering to precise analysis, innovative design, rigorous development, thorough testing, and successful implementation, he has consistently delivered exceptional results.
Throughout his career, he has taken on multifaceted roles, from leading technical project management teams to owning solutions that drive operational excellence. His conscientious and proactive approach is unwavering, whether he is working independently or collaboratively within a team. His ability to connect with colleagues on a personal level underscores his commitment to fostering a harmonious and productive workplace environment.
Date: May 29, 2024
Tags: Information Security, ISO/IEC 27001, ISO/IEC 42001, Artificial Intelligence, GDPR
-------------------------------------------------------------------------------
Find out more about ISO training and certification services
Training: ISO/IEC 27001 Information Security Management System - EN | PECB
ISO/IEC 42001 Artificial Intelligence Management System - EN | PECB
General Data Protection Regulation (GDPR) - Training Courses - EN | PECB
Webinars: https://pecb.com/webinars
Article: https://pecb.com/article
-------------------------------------------------------------------------------
For more information about PECB:
Website: https://pecb.com/
LinkedIn: https://www.linkedin.com/company/pecb/
Facebook: https://www.facebook.com/PECBInternational/
Slideshare: http://www.slideshare.net/PECBCERTIFICATION
Digital Artifact 1 - 10VCD Environments Unit
Digital Artifact 1 - 10VCD Environments Unit - NGV Pavilion Concept Design
Main Java[All of the Base Concepts}.docx
This is part 1 of my Java Learning Journey. This Contains Custom methods, classes, constructors, packages, multithreading , try- catch block, finally block and more.
Pollock and Snow "DEIA in the Scholarly Landscape, Session One: Setting Expec...
Pollock and Snow "DEIA in the Scholarly Landscape, Session One: Setting Expec...National Information Standards Organization (NISO)
This presentation was provided by Steph Pollock of The American Psychological Association’s Journals Program, and Damita Snow, of The American Society of Civil Engineers (ASCE), for the initial session of NISO's 2024 Training Series "DEIA in the Scholarly Landscape." Session One: 'Setting Expectations: a DEIA Primer,' was held June 6, 2024.Advanced Java[Extra Concepts, Not Difficult].docx
This is part 2 of my Java Learning Journey. This contains Hashing, ArrayList, LinkedList, Date and Time Classes, Calendar Class and more.
The simplified electron and muon model, Oscillating Spacetime: The Foundation...
Discover the Simplified Electron and Muon Model: A New Wave-Based Approach to Understanding Particles delves into a groundbreaking theory that presents electrons and muons as rotating soliton waves within oscillating spacetime. Geared towards students, researchers, and science buffs, this book breaks down complex ideas into simple explanations. It covers topics such as electron waves, temporal dynamics, and the implications of this model on particle physics. With clear illustrations and easy-to-follow explanations, readers will gain a new outlook on the universe's fundamental nature.
Azure Interview Questions and Answers PDF By ScholarHat
Azure Interview Questions and Answers PDF By ScholarHat
The Diamonds of 2023-2024 in the IGRA collection
A review of the growth of the Israel Genealogy Research Association Database Collection for the last 12 months. Our collection is now passed the 3 million mark and still growing. See which archives have contributed the most. See the different types of records we have, and which years have had records added. You can also see what we have for the future.
Introduction to AI for Nonprofits with Tapp Network
Dive into the world of AI! Experts Jon Hill and Tareq Monaur will guide you through AI's role in enhancing nonprofit websites and basic marketing strategies, making it easy to understand and apply.
CACJapan - GROUP Presentation 1- Wk 4.pdf
Macroeconomics- Movie Location
This will be used as part of your Personal Professional Portfolio once graded.
Objective:
Prepare a presentation or a paper using research, basic comparative analysis, data organization and application of economic information. You will make an informed assessment of an economic climate outside of the United States to accomplish an entertainment industry objective.
How to Add Chatter in the odoo 17 ERP Module
In Odoo, the chatter is like a chat tool that helps you work together on records. You can leave notes and track things, making it easier to talk with your team and partners. Inside chatter, all communication history, activity, and changes will be displayed.
South African Journal of Science: Writing with integrity workshop (2024)
South African Journal of Science: Writing with integrity workshop (2024)Academy of Science of South Africa
A workshop hosted by the South African Journal of Science aimed at postgraduate students and early career researchers with little or no experience in writing and publishing journal articles.DRUGS AND ITS classification slide share
Any substance (other than food) that is used to prevent, diagnose, treat, or relieve symptoms of a
disease or abnormal condition
PCOS corelations and management through Ayurveda.
This presentation includes basic of PCOS their pathology and treatment and also Ayurveda correlation of PCOS and Ayurvedic line of treatment mentioned in classics.
RPMS TEMPLATE FOR SCHOOL YEAR 2023-2024 FOR TEACHER 1 TO TEACHER 3
RPMS Template 2023-2024 by: Irene S. Rueco
Recently uploaded (20)
ISO/IEC 27001, ISO/IEC 42001, and GDPR: Best Practices for Implementation and...
ISO/IEC 27001, ISO/IEC 42001, and GDPR: Best Practices for Implementation and...
Pollock and Snow "DEIA in the Scholarly Landscape, Session One: Setting Expec...
Pollock and Snow "DEIA in the Scholarly Landscape, Session One: Setting Expec...
The simplified electron and muon model, Oscillating Spacetime: The Foundation...
The simplified electron and muon model, Oscillating Spacetime: The Foundation...
Azure Interview Questions and Answers PDF By ScholarHat
Azure Interview Questions and Answers PDF By ScholarHat
Introduction to AI for Nonprofits with Tapp Network
Introduction to AI for Nonprofits with Tapp Network
South African Journal of Science: Writing with integrity workshop (2024)
South African Journal of Science: Writing with integrity workshop (2024)
RPMS TEMPLATE FOR SCHOOL YEAR 2023-2024 FOR TEACHER 1 TO TEACHER 3
RPMS TEMPLATE FOR SCHOOL YEAR 2023-2024 FOR TEACHER 1 TO TEACHER 3
SESSION 9 - Maths - Fractions, Decimals and Percentages
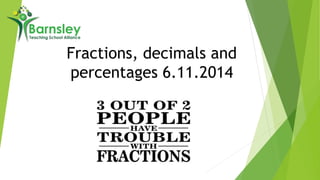
- 1. Fractions, decimals and percentages 6.11.2014
- 2. What does the National Curriculum say?
- 5. 1 3 2 4 1 3 6 10 15 21 A B C D E A memorable picture?
- 6. Fractions, Decimals and Percentage • In small groups come up with a statement defining visualisation in simple terms
- 7. A Powerful Force ‘Imagery is a powerful force for perception and understanding. Being able to “see” something mentally is a common metaphor for understanding it. An image may be of some geometrical shape, or of a graph or diagram, or it may be some set of symbols or some procedure.’ Open University What’s your current practise?
- 8. Activity
- 9. Answers Numbers – Eight, five, four, nine, one, seven, six, ten, three, two Months – April, August, December, February, January, July, June, March, May, November, October, September
- 10. Using a counting stick to Visualise… https://www.ncetm.org.uk/resources/43609
- 11. Fractions of shapes challenges . . .
- 13. The Two-Jars Puzzle Given a 5-litre and a 3-litre jar and an unlimited supply of water, how do you measure out 4 litres exactly?
- 14. Building a picture of equivalence 1 2 3 4 2/4, 1/4, 3/1 . . . .. ………
- 16. Introducing decimals through Gattegeno charts. . . http://www.numbergym.co.uk/hosting/NGS/NG_GatChartExpl.html Number lines http://www.taw.org.uk/lic/itp/dec_num_line.html
- 18. Would you rather… ½ of £750 10% of £3000 1/8 of £800 3/10 of £2700
- 21. Resources http://uk.pinterest.com/cece09/fractions-decimals-percents/ NNS Shape and Space booklet •Beam – ‘Eyes closed’ •Nunes (2006) Fractions: Difficult but crucial in mathematics learning •Anita Straker – ‘Talking Points in Mathematics’ •Maths Trails - Visualisation •Talk for maths – mind’s eye •Open University – Learning Space – ‘Using Visualisation in Mathematics Teaching’