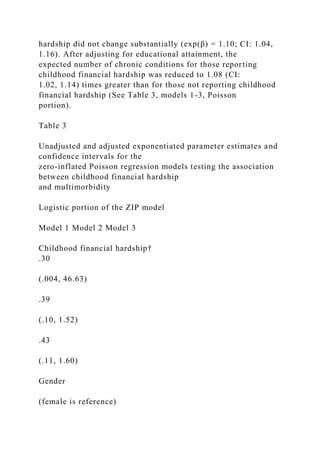
This study investigates the relationship between childhood financial hardship, lifetime earnings, and multimorbidity in older adults, using data from 7,305 participants aged 50 and older. Results indicate that childhood financial hardship is associated with an increased number of chronic conditions, while higher lifetime earnings are linked to fewer chronic conditions, with the latter modifying the relationship between hardship and multimorbidity. The findings highlight the need for further research into how socioeconomic factors throughout life influence health in older populations.
![Chronic conditions generally cluster and individuals with one
chronic condition are likely to have other conditions
as well. As such, many older adults now manage two or more
chronic conditions at the same time (i.e.
multimorbidity)[1, 2]; and evidence suggests that the presence
of multimorbidity is expected to continue to rise [3,
4, 5]. The influence of childhood material conditions and
lifetime earnings on multimorbidity has yet to be
investigated. Considering the impending shift in the US
population demographic as the baby-boomers reach age 65,
Lifecourse socioeconomic circumstances and multimorbidity
among olde...
http://bmcpublichealth.biomedcentral.com/articles/10.1186/147
1-2458-1...
2 of 25 10/18/2016 12:28 AM
which will yield an elderly population characterized by
declining death rates, increasing life expectancy, and
increasing health care costs,[6, 7] an understanding of the
correlates of multimorbidity in older adults is a crucial
issue for population health research [8, 9].
Lifecourse financial/economic conditions
A substantial literature exists documenting the positive
association between childhood SES and adult health[10];
specifically, low childhood socioeconomic status (e.g. parental
occupation, parental educational attainment) has
been linked to heart disease,[11] stroke [12], diabetes [13], and
some cancers [14] among adults. A few lifecourse
epidemiology studies have broadened the notion of childhood](https://image.slidesharecdn.com/skiptomaincontentmenusearchexplorejournalsget-221109035735-1d39245c/85/Skip-to-main-contentMenuSearchExplore-journalsGet-docx-4-320.jpg)
![socioeconomic status (SES) to include specific
financial hardships present in the socioeconomic environment
during childhood [15, 16, 17]. For example,
Lundberg (1997) found that respondents growing up in a family
that experienced economic difficulties had an
increased risk for circulatory illness in adulthood, even after
controlling for demographic and socioeconomic
characteristics and baseline health [17]. Additionally, Moody-
Ayers, et al (2007) showed an independent effect of
childhood financial hardship on functional limitations among
older adults over and above the influence of adult
SES and demographic characteristics [18].
Financial hardships in childhood can greatly influence
subsequent access to financial/economic resources,[19, 20]
which in turn affects the trajectory of health outcomes
throughout the lifecourse [21]. As such, SES over the
lifecourse has been shown to be more strongly associated with
adult disease outcomes than an assessment of SES
for a particular point in time [22, 23]. In particular, cumulative
disadvantage or low lifecourse SES has been shown
to be positively associated with morbidity and mortality [24, 25,
26, 27]. However, the relationship among
childhood financial hardship, earnings across adulthood, and
multimorbidity remains to be investigated; in
particular, to our knowledge no study has been conducted to
determine the association of these factors among older
adults.
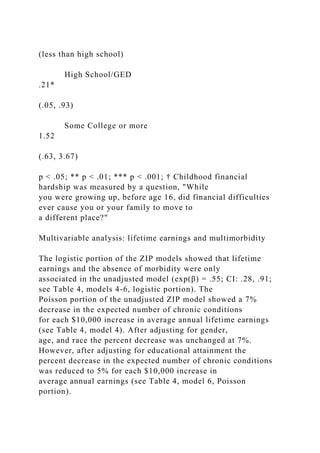
The aims for the present study were threefold. The first aim was
to determine the association between childhood
financial hardship and multimorbidity adjusting for
demographic and socioeconomic characteristics. The second
aim was to determine the association between lifetime earnings
and multimorbidity; and the third aim was to
determine if lifetime earnings act as an effect modifier in the](https://image.slidesharecdn.com/skiptomaincontentmenusearchexplorejournalsget-221109035735-1d39245c/85/Skip-to-main-contentMenuSearchExplore-journalsGet-docx-5-320.jpg)
![association between childhood financial hardship and
adult multimorbidity.
Data source
The Health and Retirement Study (HRS) is a national
longitudinal study of the economic, health, marital, family
status, and public/private support systems of older Americans
funded by the National Institute on Aging and the
Social Security Administration and conducted by the Institute
for Social Research Survey Research Center at the
University of Michigan [28]. The HRS uses a national
multistage area probability sample of households in the U.S.,
with oversamples of Blacks, Hispanics, and residents from the
state of Florida. Details of the HRS data collection
methods are described elsewhere [29]. We used respondents
from the 2004 wave of the HRS who signed consent
forms for their social security earnings records to be linked to
their HRS records (N = 7,792). To determine lifetime
earnings of the respondents, we linked the 2004 HRS public use
dataset to the 2004 Permissions: Summary
Earnings Information Restricted data set provided by the HRS.
The 2004 Permissions data set includes earnings
data for HRS respondents from 1951 to 2003. Subjects were
dropped from analyses if they were under age 50 (N =
369), if they were missing data on the childhood financial
hardship variable (N = 37), and if they were missing data
on the multimorbidity variable (N = 61) or the socioeconomic
variables (N = 20). The final sample used for
analysis was N = 7,305. The Institutional Review Board (IRB)
at the University of Michigan approved the Health
Lifecourse socioeconomic circumstances and multimorbidity
among olde...
http://bmcpublichealth.biomedcentral.com/articles/10.1186/147
1-2458-1...](https://image.slidesharecdn.com/skiptomaincontentmenusearchexplorejournalsget-221109035735-1d39245c/85/Skip-to-main-contentMenuSearchExplore-journalsGet-docx-6-320.jpg)
![who may temporarily leave the labor market (e.g.
respondents with child-rearing responsibilities) [30]. Earnings
were inflation-adjusted to 2003 US dollars using the
consumer price index for urban consumers (CPI-U 1951-2003)
[31]. For ease of interpretation, we divided average
annual earnings by $10,000 so that changes in the outcome
would be associated with a $10,000 change in average
annual earnings.
Covariates
Educational attainment was used as an indicator of adult SES
[32]. It was grouped into three categories: less than
high school, high school diploma/GED, and some college or
more.
Demographic characteristics such as gender, race (white/non-
white), ethnicity (Hispanic/non-Hispanic), and age
were assessed by self-report in the HRS. Tertiles were created
for the age variable: 50-59, 60-69, and 70 and older
for univariate and bivariate analysis.
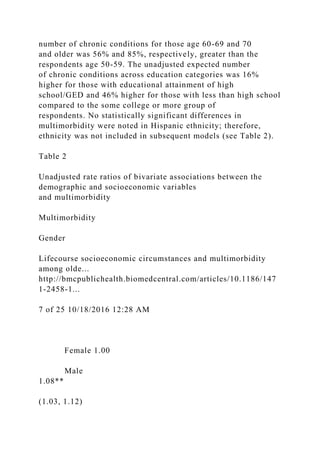
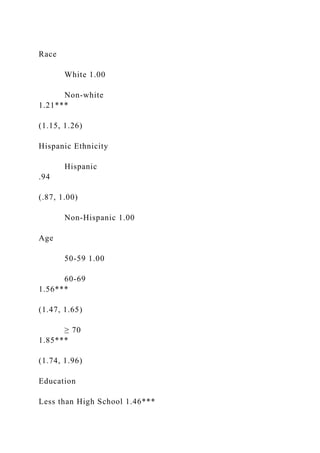
Statistical analysis
In order to test the association among childhood financial
hardship, average annual lifetime earnings, and
multimorbidity, bivariate and multivariable tests were
performed. Bivariate analyses using Wilcoxon-
Mann-Whitney tests were conducted to determine differences in
multimorbidity between demographic categories
and Kruskall-Wallis tests were conducted to determine
differences in multimorbidity across SES categories.
Additionally, unadjusted rate ratios were estimated with robust
standard errors to quantify differences across
demographic and SES categories in multimorbidity.](https://image.slidesharecdn.com/skiptomaincontentmenusearchexplorejournalsget-221109035735-1d39245c/85/Skip-to-main-contentMenuSearchExplore-journalsGet-docx-8-320.jpg)
![To take into consideration the count nature of the outcome
variable and the substantial number of respondents
reporting no chronic conditions (Y = 0), zero-inflated Poisson
(ZIP) regression was used [33] (30% of respondents
in this sample reported no chronic conditions). The ZIP model
assumes that the respondents potentially come from
two different distributions: one distribution that is indeed likely
to have a zero count (no disease), and another
distribution that follows the Poisson distribution (count of the
six chronic conditions measured in this study) [34].
Lifecourse socioeconomic circumstances and multimorbidity
among olde...
http://bmcpublichealth.biomedcentral.com/articles/10.1186/147
1-2458-1...
4 of 25 10/18/2016 12:28 AM
The ZIP model is a two-part model represented as: 1) P (y i |x i
) = p i + (1 - p i ) exp(-μ i ) when y i = 0 and; 2)
when y i ≥1 [35]. The first part represents a logistic model that
estimates the change in
the log-odds of reporting no chronic conditions (absence of
morbidity) for each one-unit change in the independent
variable, and the second part represents a Poisson model that
estimates the percentage change in the number of
chronic conditions for a one-unit change in the independent
variable. The justification for this approach is that the
factors associated with having one or more chronic conditions
might be differentially associated with the absence of
morbidity (reporting no chronic conditions).](https://image.slidesharecdn.com/skiptomaincontentmenusearchexplorejournalsget-221109035735-1d39245c/85/Skip-to-main-contentMenuSearchExplore-journalsGet-docx-9-320.jpg)
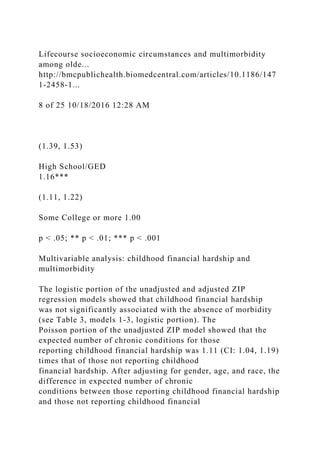
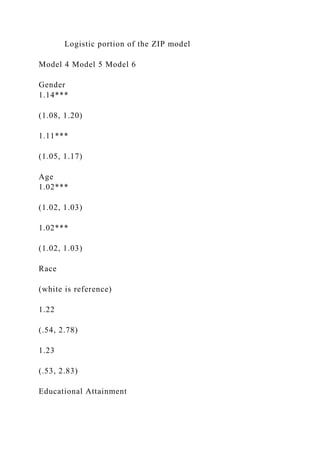
![SAS 9.2© was used for model building. Following bivariate
analysis, we developed unadjusted models to evaluate
the association between childhood financial hardship and
multimorbidity in 2004 (Model 1). Next, we adjusted for
demographic (Model 2) and socioeconomic characteristics
(Model 3). We then developed unadjusted models to
evaluate the association between lifetime earnings and
multimorbidity in 2004 (Model 4). Next, we adjusted this
model for demographic (Model 5) and socioeconomic
characteristics (Model 6). We then entered average annual
lifetime earnings into Model 3 to evaluate the influence of
lifetime earnings on the childhood financial hardship
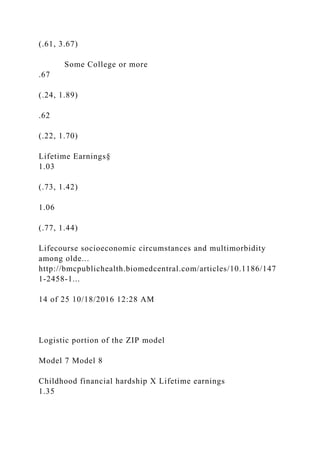
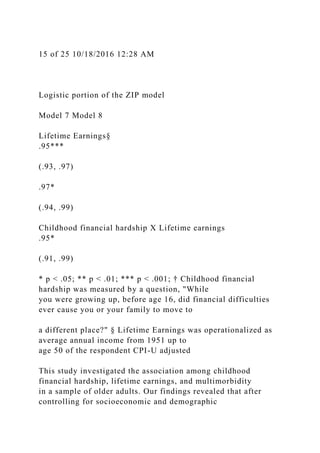
adjusted model (Model 7). To determine if the association
between childhood financial hardship and multimorbidity
was modified by lifetime earnings, we entered an interaction
term (lifetime earnings × childhood financial hardship)
into the model (Model 8) [36].
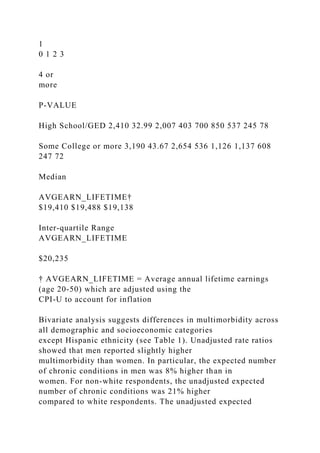
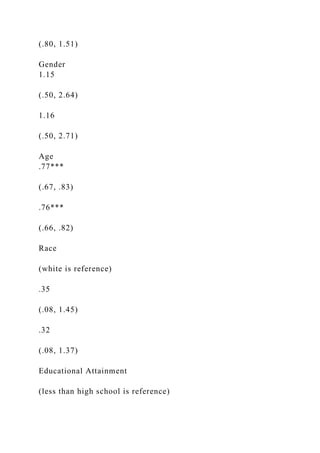
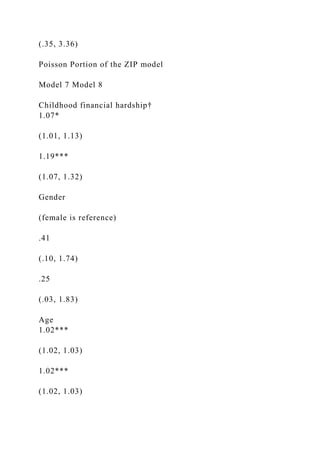
Table 1 lists the descriptive statistics. The average age for the
full sample was 65 years old. Nineteen percent of the
sample reported childhood financial hardship. The mean number
of chronic conditions was 1.24, with 30% (N =
2,193) reporting no chronic conditions. The mean number of
chronic conditions for those reporting childhood
financial hardship was 1.35 and the mean number of chronic
conditions for those reporting no childhood financial
hardship was 1.20. The median average annual lifetime earnings
up to age 50 (CPI-U adjusted) was $19,410 with
an inter-quartile range of $20,235 (see Table 1).
Table 1
Frequency distributions for childhood financial hardship (CFH)
and chronic conditions and bivariate
associations between demographic and socioeconomic
characteristics and multimorbidity](https://image.slidesharecdn.com/skiptomaincontentmenusearchexplorejournalsget-221109035735-1d39245c/85/Skip-to-main-contentMenuSearchExplore-journalsGet-docx-10-320.jpg)
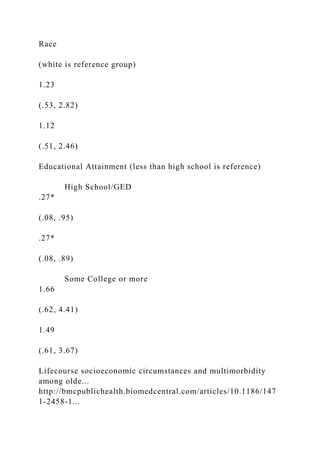
![compared to the less than high school group, only the high
school/GED category showed a protective association
with multimorbidity.
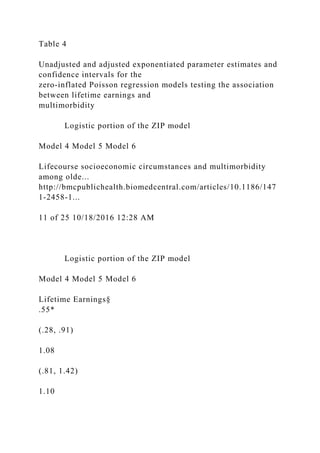
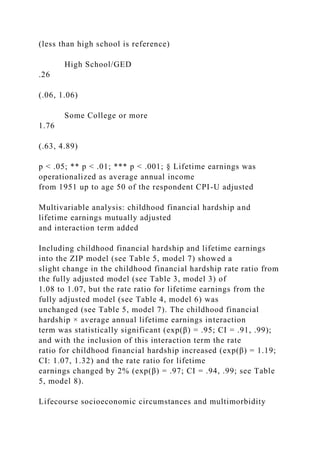
We evaluated our hypotheses using ZIP regression; and, the
benefit of a ZIP modeling approach is the simultaneous
estimation of factors associated with multimorbidity and the
absence of morbidity. In fully adjusted models,
Lifecourse socioeconomic circumstances and multimorbidity
among olde...
http://bmcpublichealth.biomedcentral.com/articles/10.1186/147
1-2458-1...
16 of 25 10/18/2016 12:28 AM
childhood financial hardship was not associated with the
absence of morbidity and lifetime earnings was only
associated with the absence of morbidity in unadjusted models.
Consistent with the literature, the logistic portion of
our ZIP models showed that age was strongly negatively
associated with the absence of morbidity [37]. Lastly, the
widest confidence intervals were noted in the logistic portion of
the childhood financial hardship ZIP models. This
may indicate poor model fit and suggests that the potential
socioeconomic and demographic factors associated with
determining the number of diseases (of those measured in this
study) might be substantively different from the
factors associated with determining the absence of morbidity.
The lack of an association between the several indicators of
socioeconomic circumstances in this study (i.e.
childhood financial hardship, lifetime earnings, and educational
attainment) and demographic characteristics (i.e.](https://image.slidesharecdn.com/skiptomaincontentmenusearchexplorejournalsget-221109035735-1d39245c/85/Skip-to-main-contentMenuSearchExplore-journalsGet-docx-35-320.jpg)
![race and gender) and the absence of morbidity was unexpected.
Research has shown a negative association between
socioeconomic status and morbidity[38, 39] and
multimorbidity[40, 41]; and studies on successful aging (where
one component is the absence or low risk of morbidity[42])
have shown that childhood and mid-life socioeconomic
circumstances[43], and the stability of financial resources[44]
were positively associated with the absence of
morbidity in older adults. However, the evidence on the
association between socioeconomic factors and successful
aging is equivocal[45, 46, 47]. It has also been suggested that
age effects on self-reported morbidity may
overshadow socioeconomic effects[48]. Not surprising, our
results show an independent association between the
absence of morbidity and age, even when childhood financial
hardship and lifetime earnings are included in the
model. Demographic characteristics[48] and psychosocial and
behavioral factors[49] across the lifecourse may
prove more important than socioeconomic factors in
determining the absence of morbidity; however, the influence
of lifecourse socioeconomic factors on the absence of morbidity
requires further exploration to fully elucidate their
role in successful aging in general and the absence of morbidity
in particular among older adults.
Childhood socioeconomic condition and adult health
Financial and economic circumstances occurring in childhood
and throughout the lifecourse have been shown to
affect adult health outcomes [50]. Research shows that
antecedents to the socioeconomic gradient in adult health
can be seen in the socioeconomic environment in childhood
[51]. As such, the childhood environment can, 'cast
long shadows forward' on future health outcomes [52]; that is,
the financial and economic circumstances occurring
and accumulating throughout the lifecourse can determine and](https://image.slidesharecdn.com/skiptomaincontentmenusearchexplorejournalsget-221109035735-1d39245c/85/Skip-to-main-contentMenuSearchExplore-journalsGet-docx-36-320.jpg)
![influence the health trajectory of the individual [53,
54].
Additionally, it has been suggested that many chronic diseases
share common risk factors [55]. In particular, current
low socioeconomic status and disadvantage accumulated across
the lifecourse have been shown to be significant
pathways to many chronic conditions [25, 56]; and, socio-
environmental factors experienced at various stages
throughout the lifecourse can differentially impact disease
etiology [57]. So, even though chronic diseases have
long latency periods, research has consistently shown that for
many chronic conditions adult and childhood
socioeconomic factors can have a considerable impact on health
outcomes [58, 59]. Our results are consistent with
these findings. In particular, our results show that an expanded
notion of SES that includes hardships during
childhood and earnings throughout adulthood may also uncover
possible associations between socioeconomic
conditions and adult health. Our findings also show that a
possible modifier of the relationship between childhood
financial conditions and the number of adult chronic conditions
that deserves further attention is earnings during
young and middle adulthood.
There are limitations to the present study. First, respondents in
the HRS were asked to recall childhood financial
hardship experiences; as a result, the measures of childhood
financial hardship may be subject to recall bias.
Second, our sample only included those individuals who
provided permission for their social security records to be
Lifecourse socioeconomic circumstances and multimorbidity
among olde...
http://bmcpublichealth.biomedcentral.com/articles/10.1186/147
1-2458-1...](https://image.slidesharecdn.com/skiptomaincontentmenusearchexplorejournalsget-221109035735-1d39245c/85/Skip-to-main-contentMenuSearchExplore-journalsGet-docx-37-320.jpg)
![17 of 25 10/18/2016 12:28 AM
linked to their HRS records potentially introducing sample
selection bias. However, it has been shown that the HRS
respondents who grant permission for their social security were
not very much different from those who did not
[60]. In addition, the social security data linked to the HRS is
capped at the taxable maximum for a given year and
only includes earnings subject to Social Security deduction.
Next, the literature remains inconsistent in defining
multimorbidity [61, 62]; for example, some studies define
multimorbidity as the count of two or more chronic
conditions,[40] others use a combination of specific diseases,
and still others use a simple count of chronic
conditions reported or obtained from medical records [63, 64].
As a result, little guidance is provided in selecting a
measure for multimorbidity and the specific diseases such a
measure should contain. However, the chronic diseases
selected for the present study are consistent with those of other
studies of multimorbidity among older adults [21,
65]. Lastly, our study is cross-sectional so causal inferences
cannot be definitively made regarding the associations
noted.
Multimorbidity has considerable implications for health-related
research, health care, and many government
systems (e.g. Medicare, Medicaid, and Veterans
Administration). Due to the single disease focus in research and
health care[66, 67], we know relatively little about the
correlates of multimorbidity [68, 69]. Yet, health care models
on the delivery of clinical services for the elderly with multiple
chronic conditions have recently been introduced
highlighting the impact the growing problem of multimorbidity](https://image.slidesharecdn.com/skiptomaincontentmenusearchexplorejournalsget-221109035735-1d39245c/85/Skip-to-main-contentMenuSearchExplore-journalsGet-docx-38-320.jpg)
![has on health care delivery [70, 71]. However, we
know little about the factors that are associated with the various
combinations of morbidity experienced by older
adults, and such knowledge could potentially improve care and
delay mortality for many managing multiple chronic
conditions [72]. Additional research focused on the specific
socioeconomic factors associated with multimorbidity
across the lifecourse can also be used to inform the
development of appropriate interventions that target
socioeconomic groups at greatest risk for multimorbidity before
they enter the health care system. In particular,
interventions that target specific socioeconomic pathways might
prove useful in helping reduce the burden of
multimorbidity; more specifically, interventions that focus on
material resources such as reducing hardships during
childhood and increasing earnings throughout young and middle
adulthood may have a substantial impact on
prevention efforts[73] with those at risk for various
combinations of chronic disease multimorbidity.
Acknowledgements
None
Competing interests
The authors declare that they have no competing interests.
Authors' contributions
RDT-S, YL, GS, and SVS conceived of the study; RDT-S and
YL developed the analysis plan and performed the
statistical analysis; RDT-S, YL, GS, and SVS interpreted the
results; RDT-S wrote the first draft of the manuscript.
RDT-S, YL, GS, and SVS edited the manuscript. All authors
read and approved the final manuscript.](https://image.slidesharecdn.com/skiptomaincontentmenusearchexplorejournalsget-221109035735-1d39245c/85/Skip-to-main-contentMenuSearchExplore-journalsGet-docx-39-320.jpg)
![delivery of clinical services for Medicaid populations.
[http://www.chcs.org/publications3960
/publications_show.htm?doc_id=1261201]
71.
Fortin M, Soubhi H, Hudon C, Bayliss EA, van den Akker M:
Multimorbidity's many challenges. BMJ. 2007,
334: 1016-1017. 10.1136/bmj.39201.463819.2C.
72.
Williams DR, Costa MV, Odunlami AO, Mohammed SA:
Moving upstream: How interventions that address
the social determinants of health can improve health and reduce
disparities. Journal of Public Health
Management Practice. 2008, 14 (Suppl): S8-S17.
73.
Pre-publication history
The pre-publication history for this paper can be accessed
here:http://www.biomedcentral.com
/1471-2458/11/313/prepub
1.
© Tucker-Seeley et al; licensee BioMed Central Ltd. 2011
This article is published under license to BioMed Central Ltd.
This is an Open Access article distributed under the
Lifecourse socioeconomic circumstances and multimorbidity
among olde...
http://bmcpublichealth.biomedcentral.com/articles/10.1186/147](https://image.slidesharecdn.com/skiptomaincontentmenusearchexplorejournalsget-221109035735-1d39245c/85/Skip-to-main-contentMenuSearchExplore-journalsGet-docx-55-320.jpg)

![BMC Public Health
ISSN: 1471-2458
Contact us
Editorial email: [email protected]
Support email: [email protected]
Explore journals
Get published
Lifecourse socioeconomic circumstances and multimorbidity
among olde...
http://bmcpublichealth.biomedcentral.com/articles/10.1186/147
1-2458-1...
24 of 25 10/18/2016 12:28 AM
About BioMed Central
By continuing to use this website, you agree to our Terms and
Conditions, Privacy statement and Cookies policy.
© 2016 BioMed Central Ltd unless otherwise stated. Part of
Springer Nature.
Lifecourse socioeconomic circumstances and multimorbidity
among olde...
http://bmcpublichealth.biomedcentral.com/articles/10.1186/147
1-2458-1...
25 of 25 10/18/2016 12:28 AM](https://image.slidesharecdn.com/skiptomaincontentmenusearchexplorejournalsget-221109035735-1d39245c/85/Skip-to-main-contentMenuSearchExplore-journalsGet-docx-58-320.jpg)