Downloaded 50 times

![Cheese Yield Evaluation Actual Yield Moisture & Salt Adjusted Yield (37 & 1.7%) Modified VanSlyke Formula 1 [(0.93 * % fat) + (% casein - 0.1)] *1.09 Yield = --------------------------------------------------- 1 - (% cheese moisture/100)](https://image.slidesharecdn.com/barbano3-1231885996276488-3/85/Skim-milk-microfiltration-Impact-on-cheese-composition-yield-and-aging-21-320.jpg)
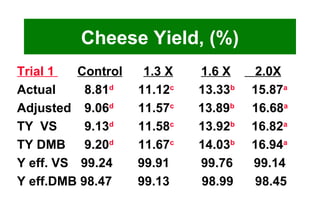


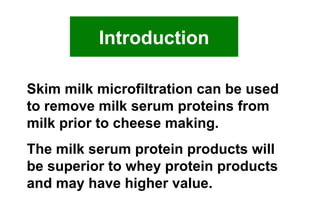
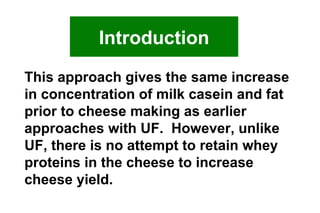
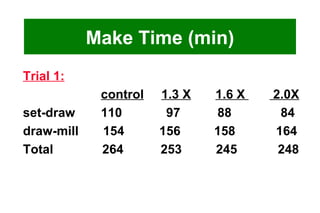
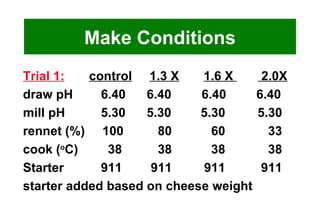
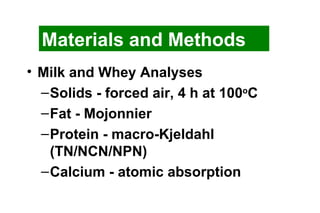
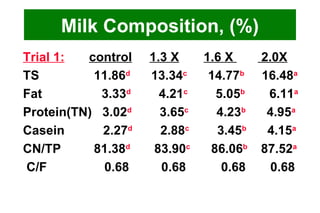
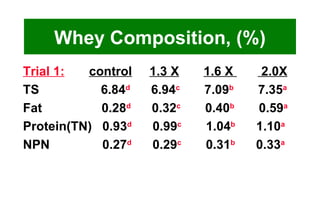
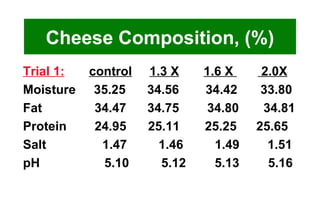
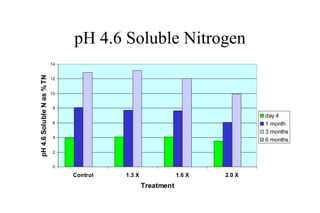
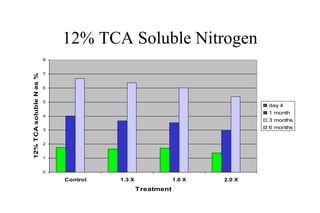
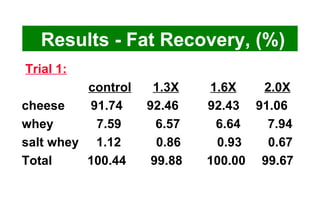
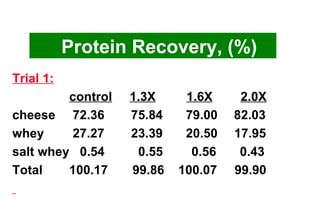
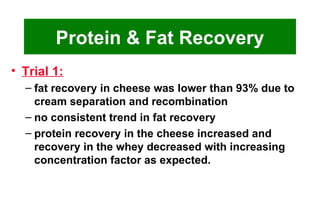
Skim milk microfiltration before cheese making can concentrate the milk without retaining whey proteins. This study examined the effects of microfiltration at concentration factors of 1.3, 1.6, and 2.0 on the composition, yield, and aging of Cheddar cheese compared to a control. The results showed that protein recovery in the cheese increased with higher concentration factors as expected, while fat recovery was lower than 93% due to cream separation issues. Cheese yields increased with concentration factor but yield efficiencies remained similar to the control, indicating the process performs as predicted. Composition, pH, and proteolysis during aging were generally unaffected by microfiltration concentration.


