Download as PDF, PPTX


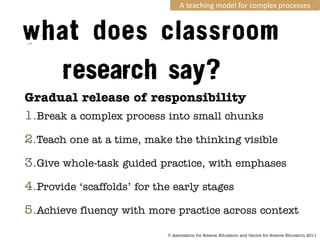
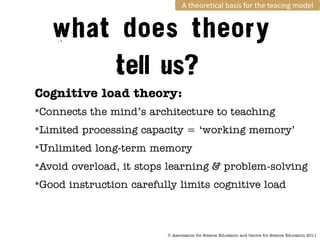


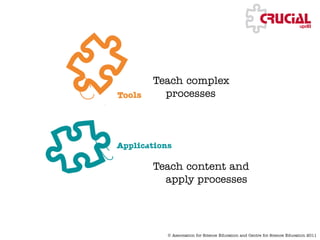


The document discusses a research-based teaching model designed for teaching complex processes related to GCSE assessments, emphasizing cognitive load theory and strategies for effective instruction. It provides practical examples of teaching methods, such as using graphical analysis and guided practice in scientific contexts. Additionally, it highlights various investigations into antibiotic resistance, showcasing experimental results and their implications for understanding bacterial behavior.


