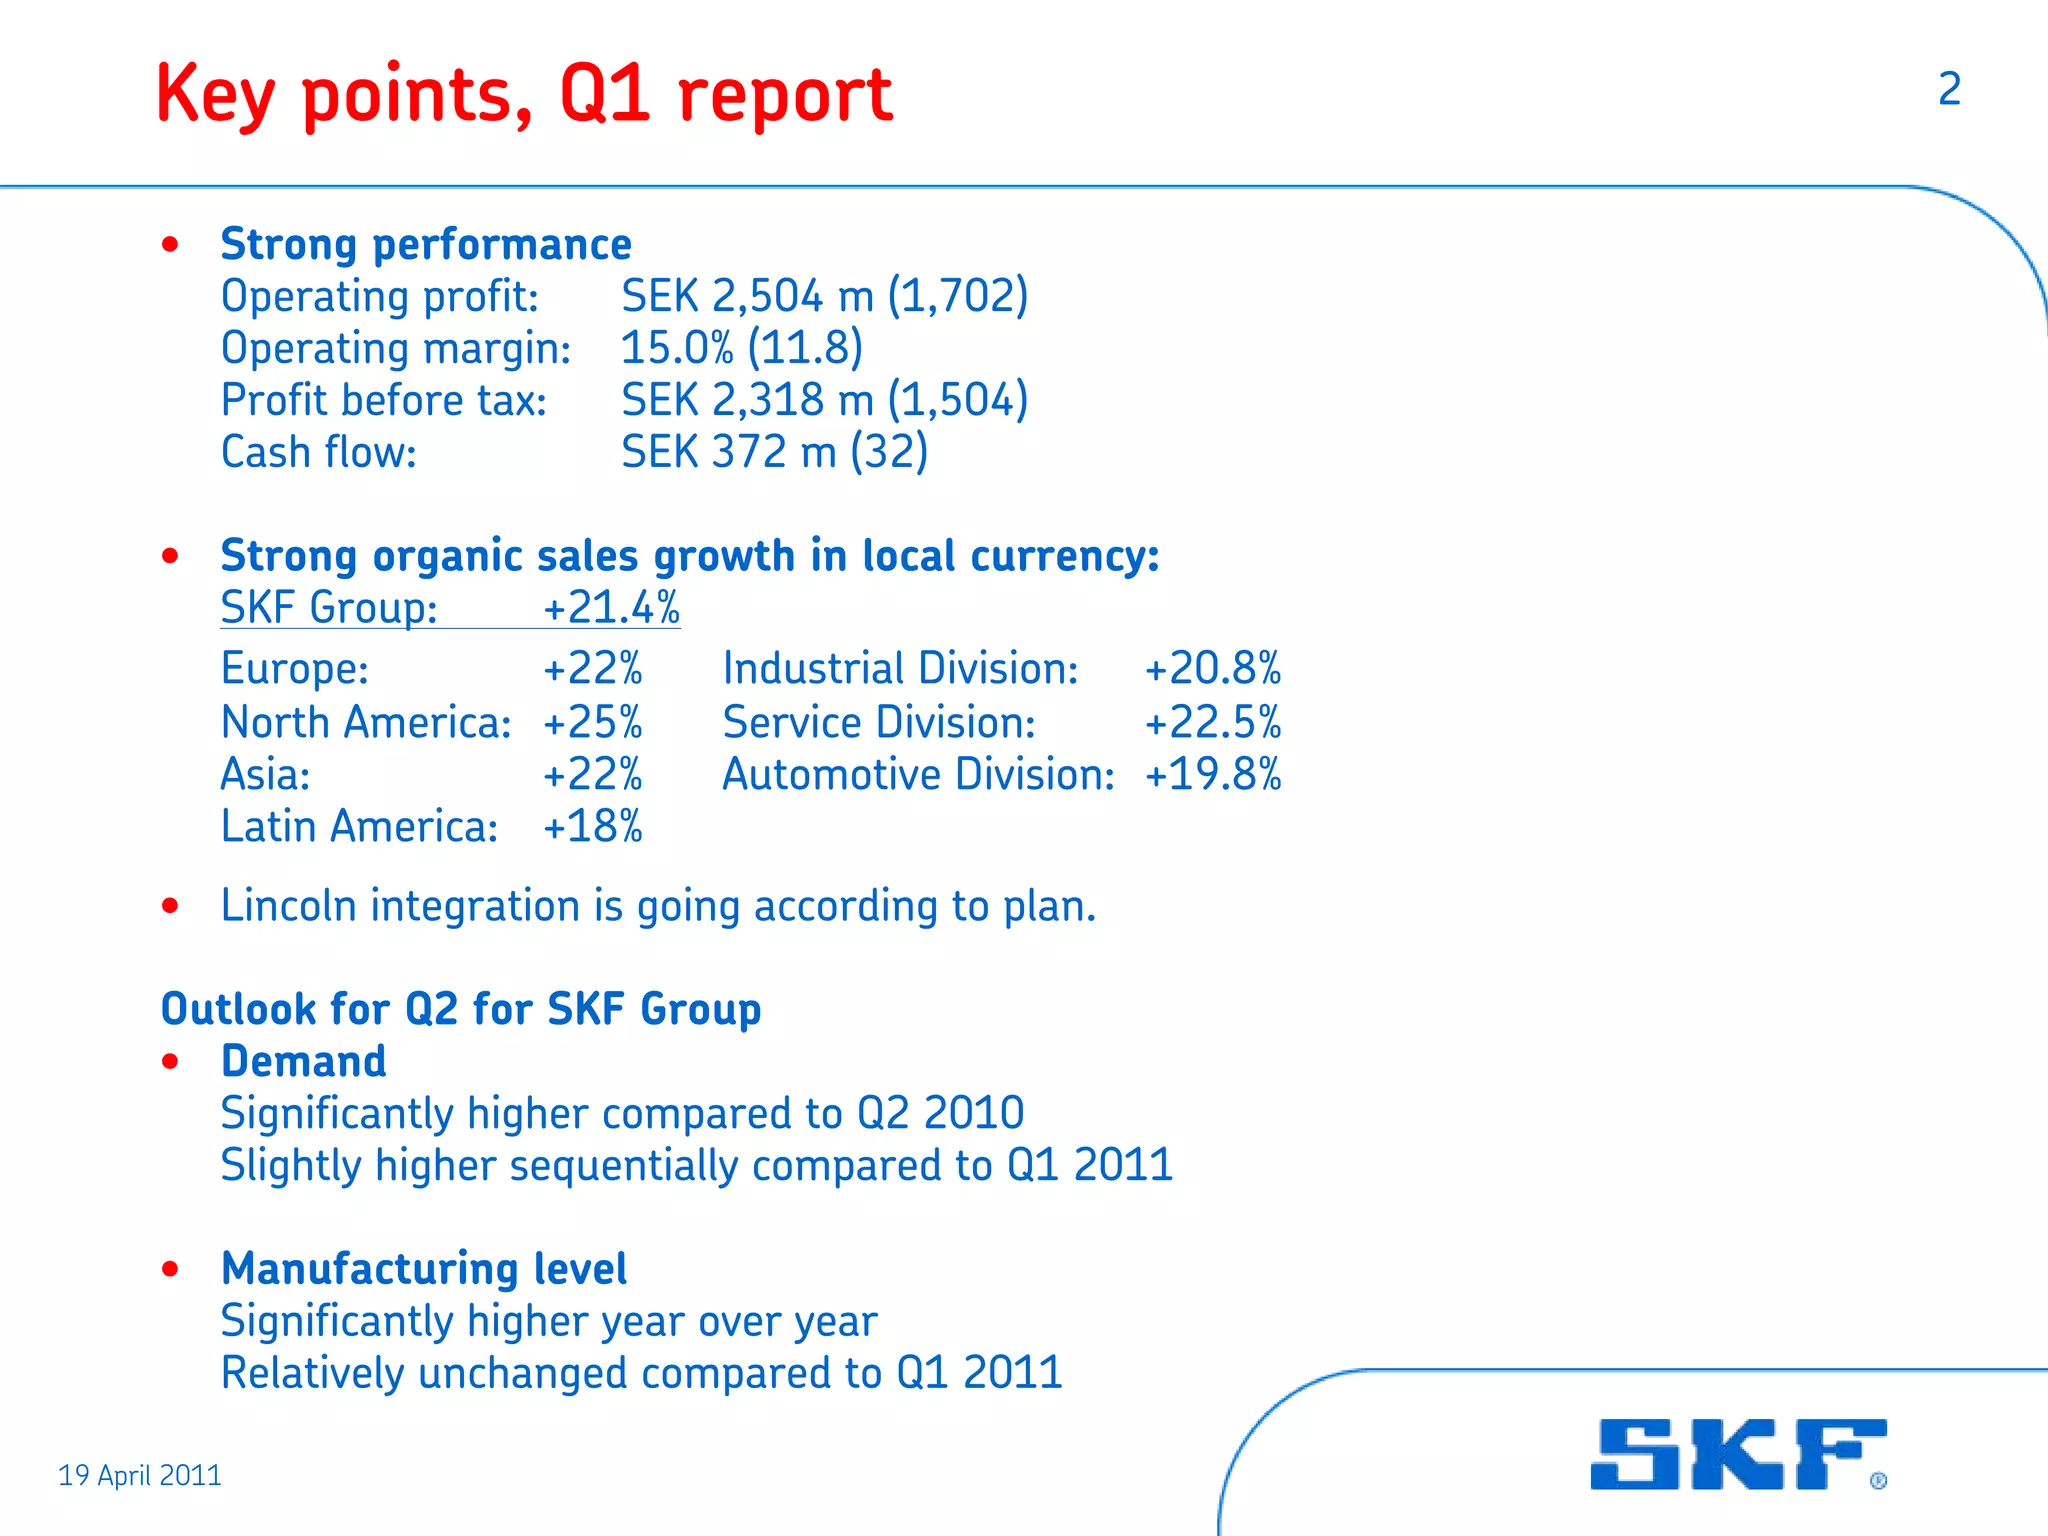
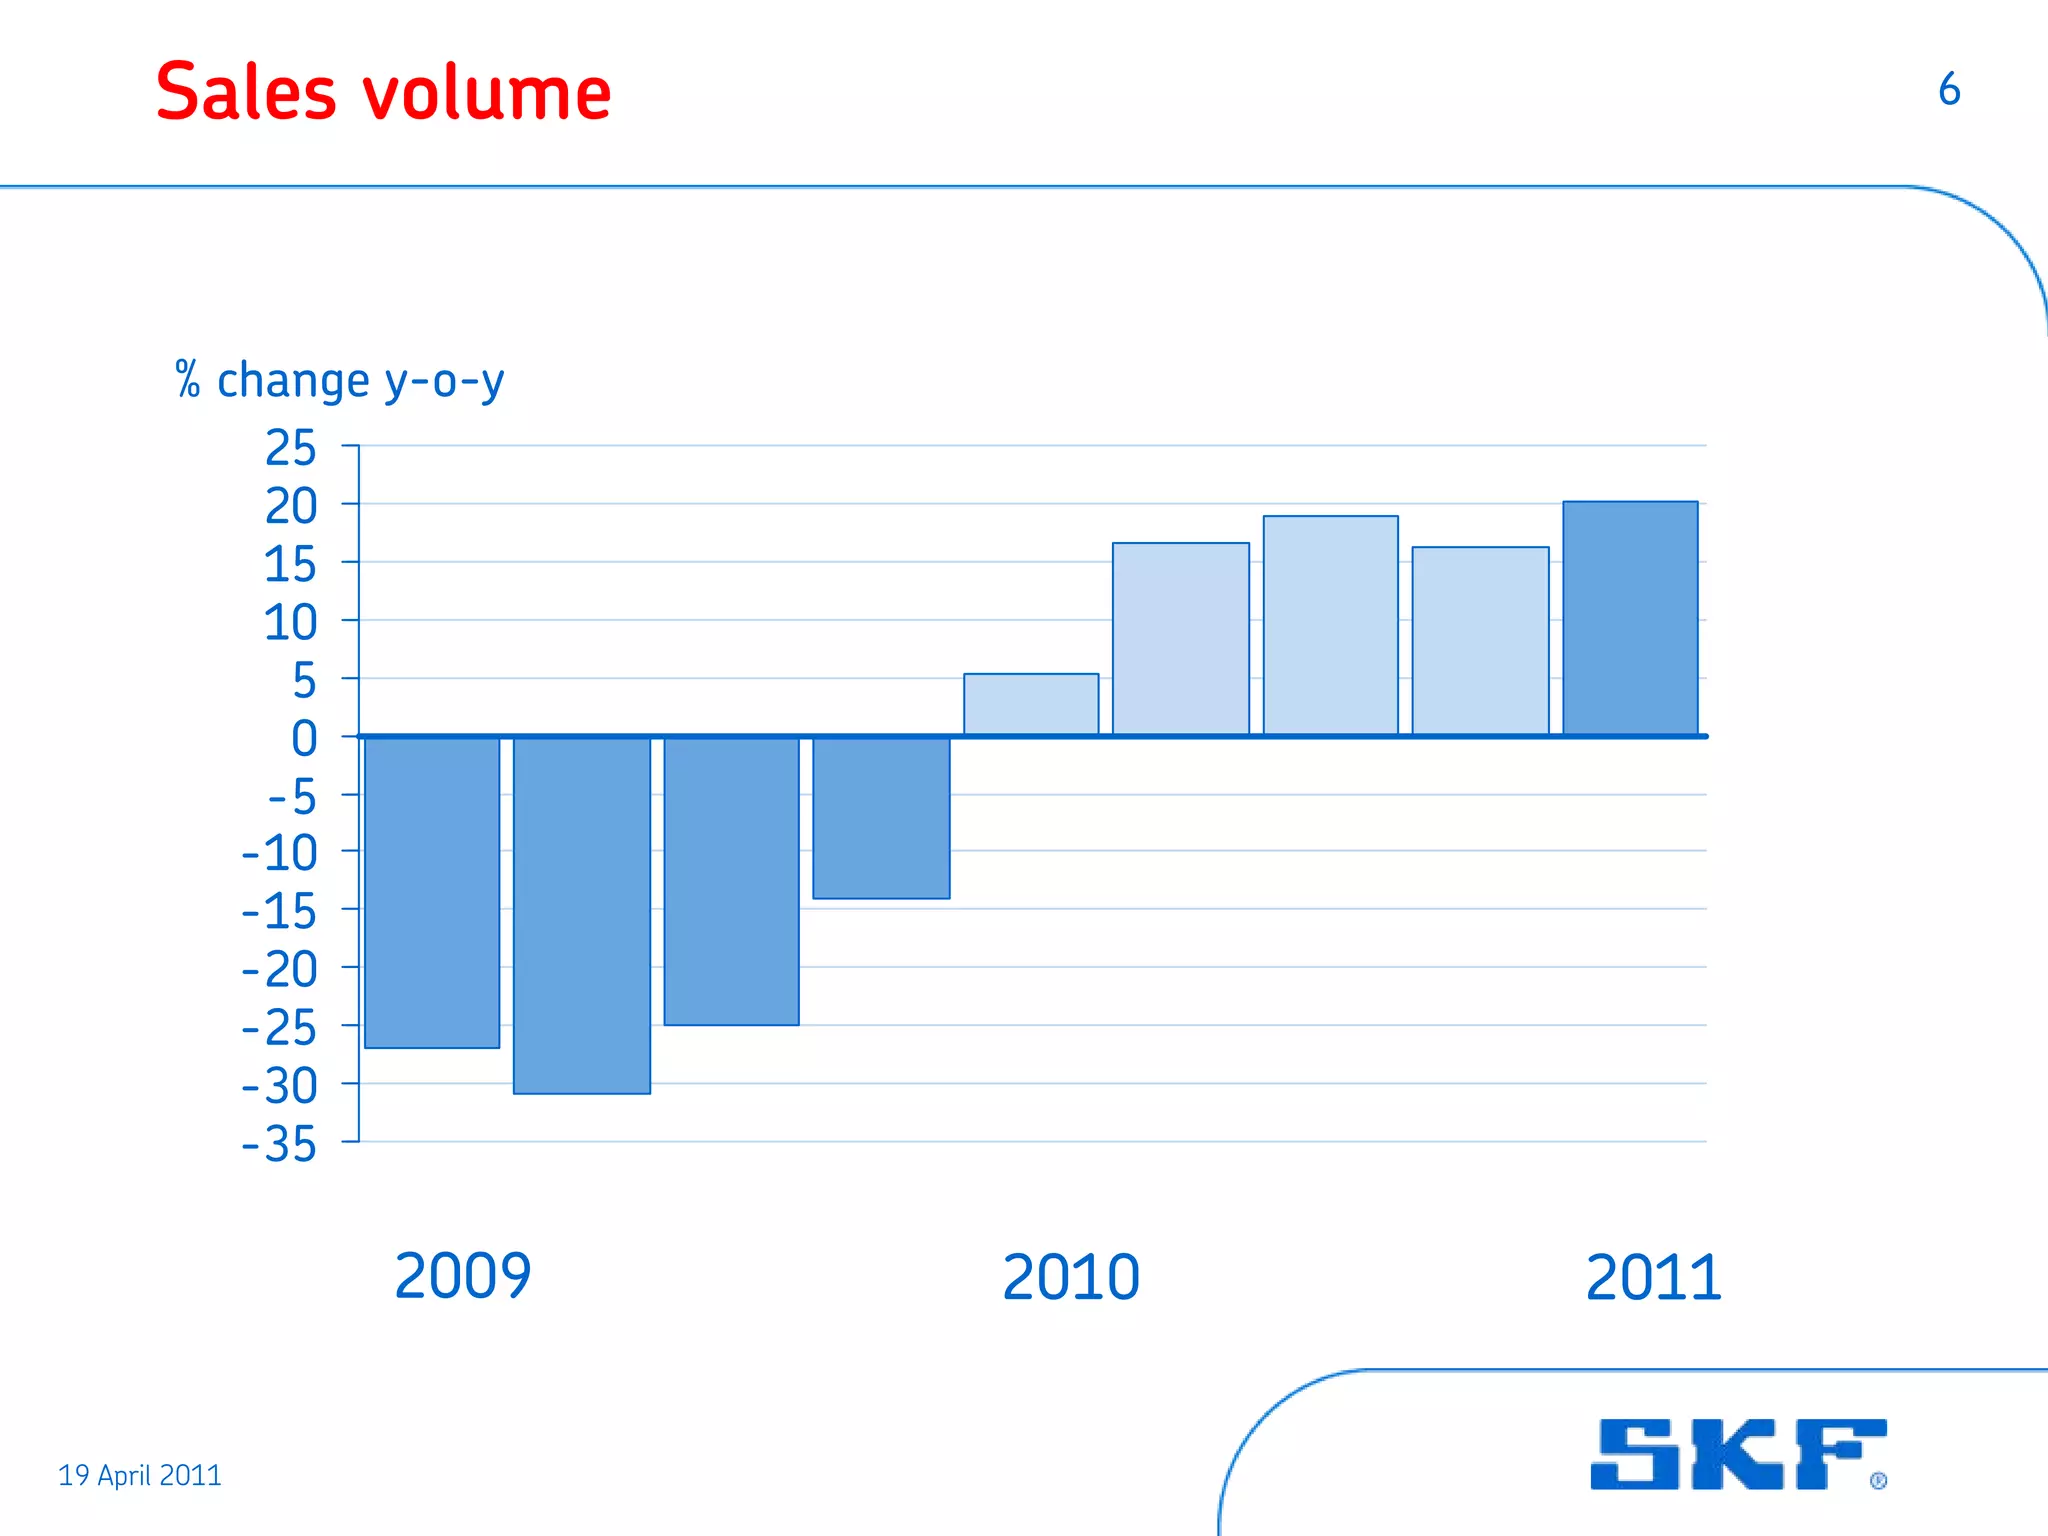
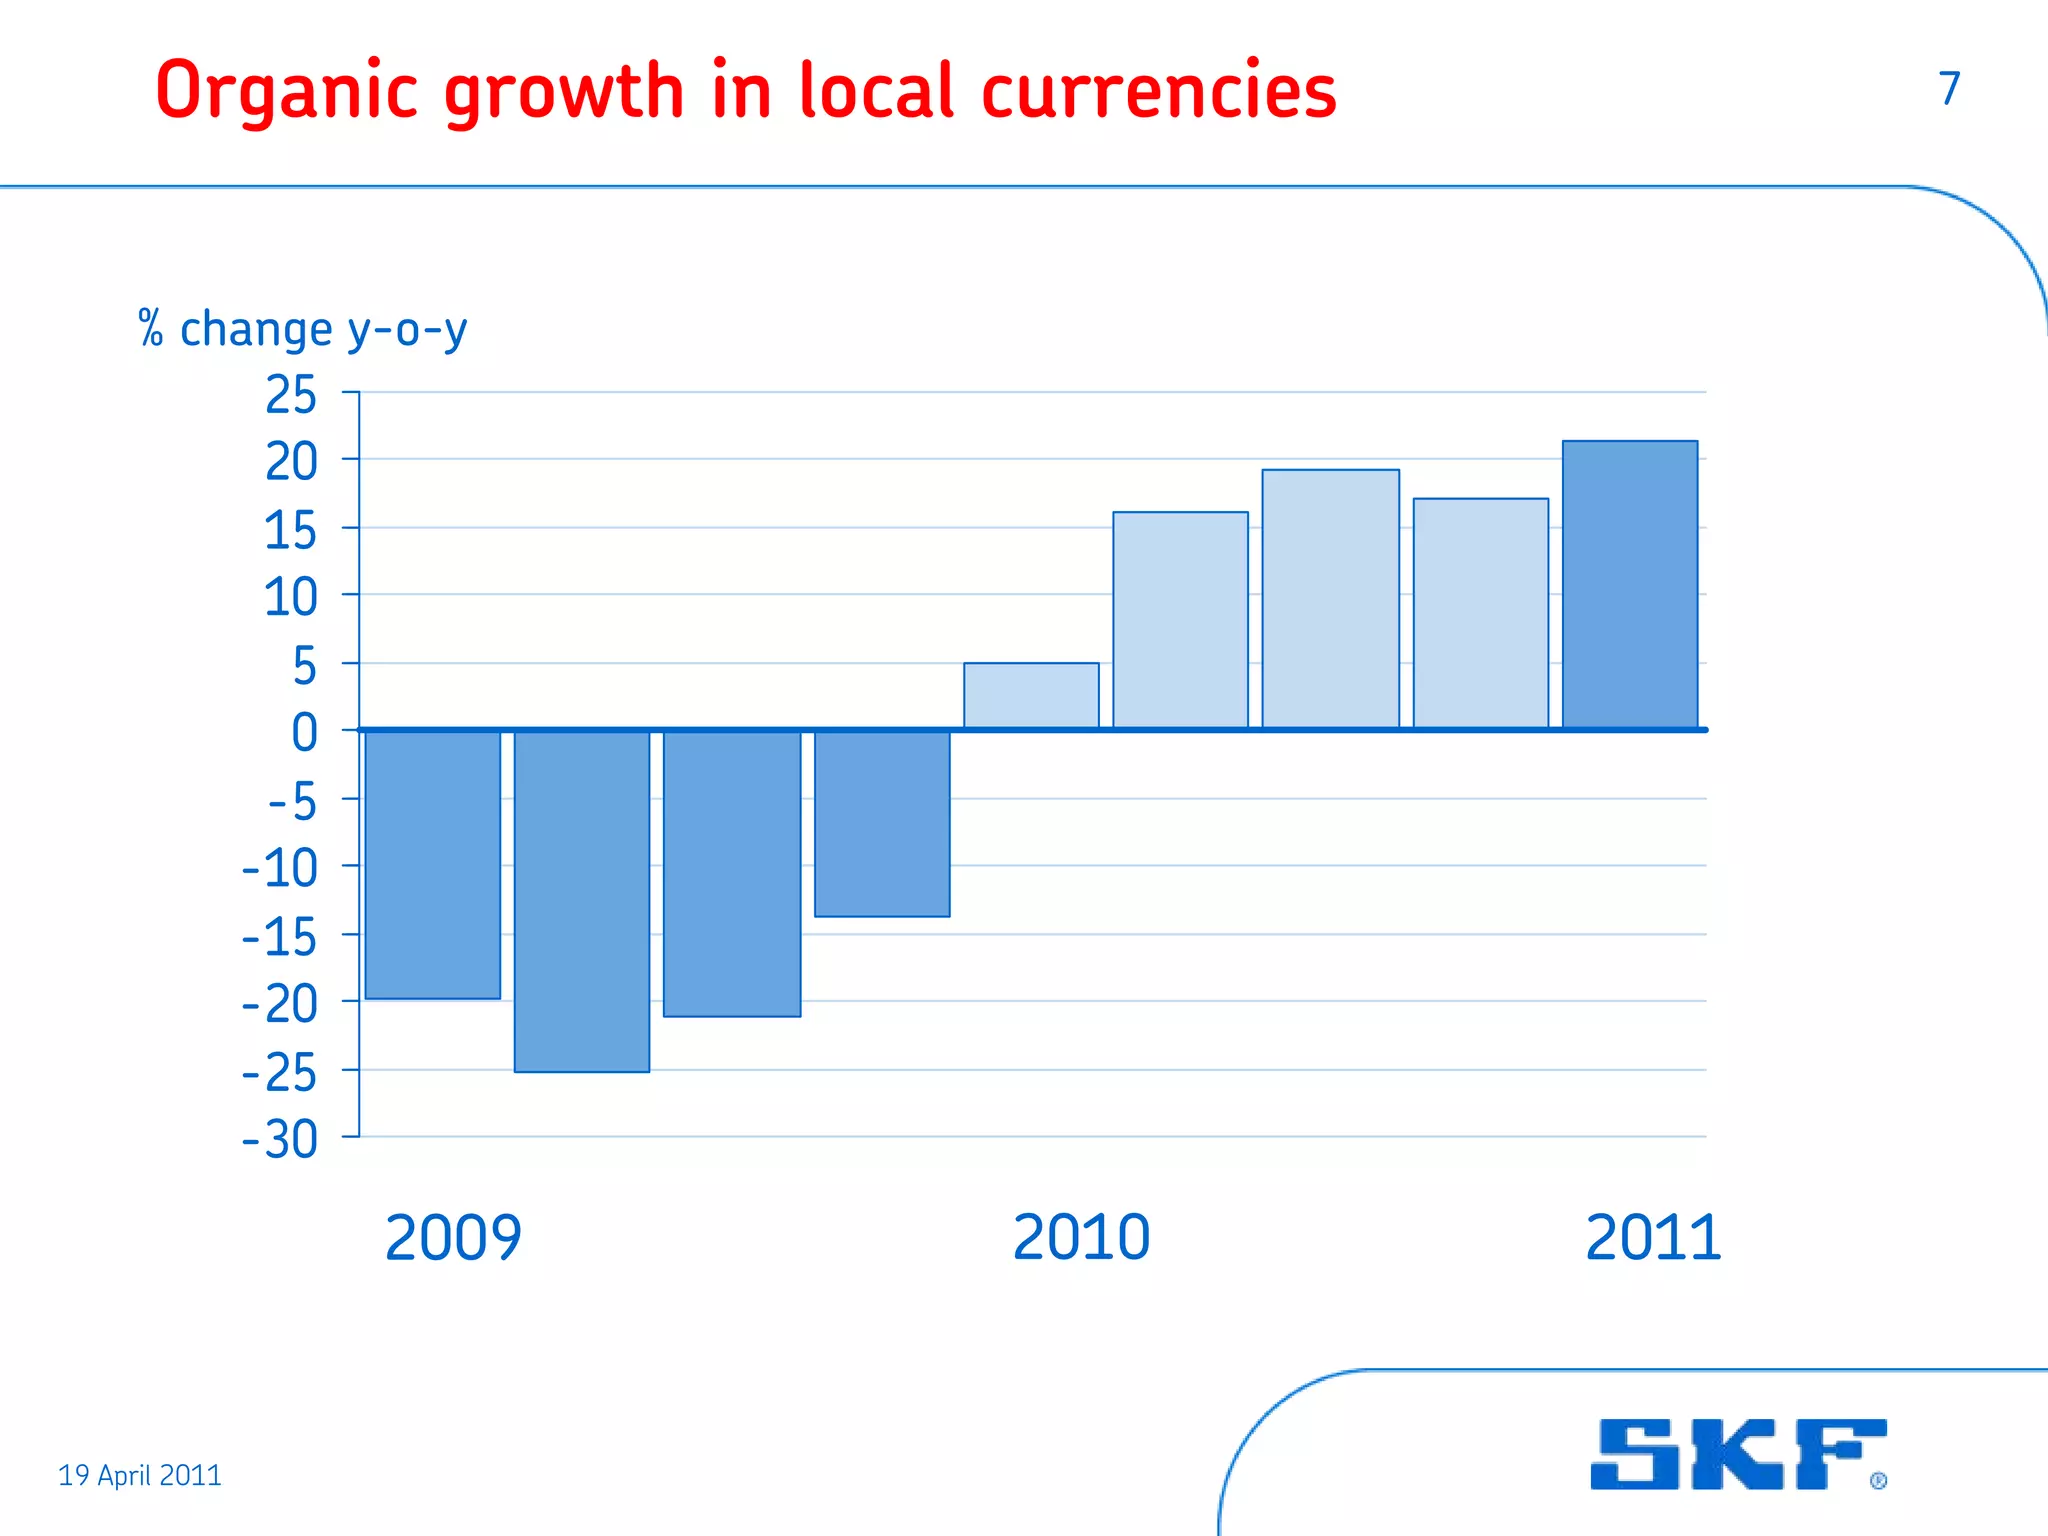
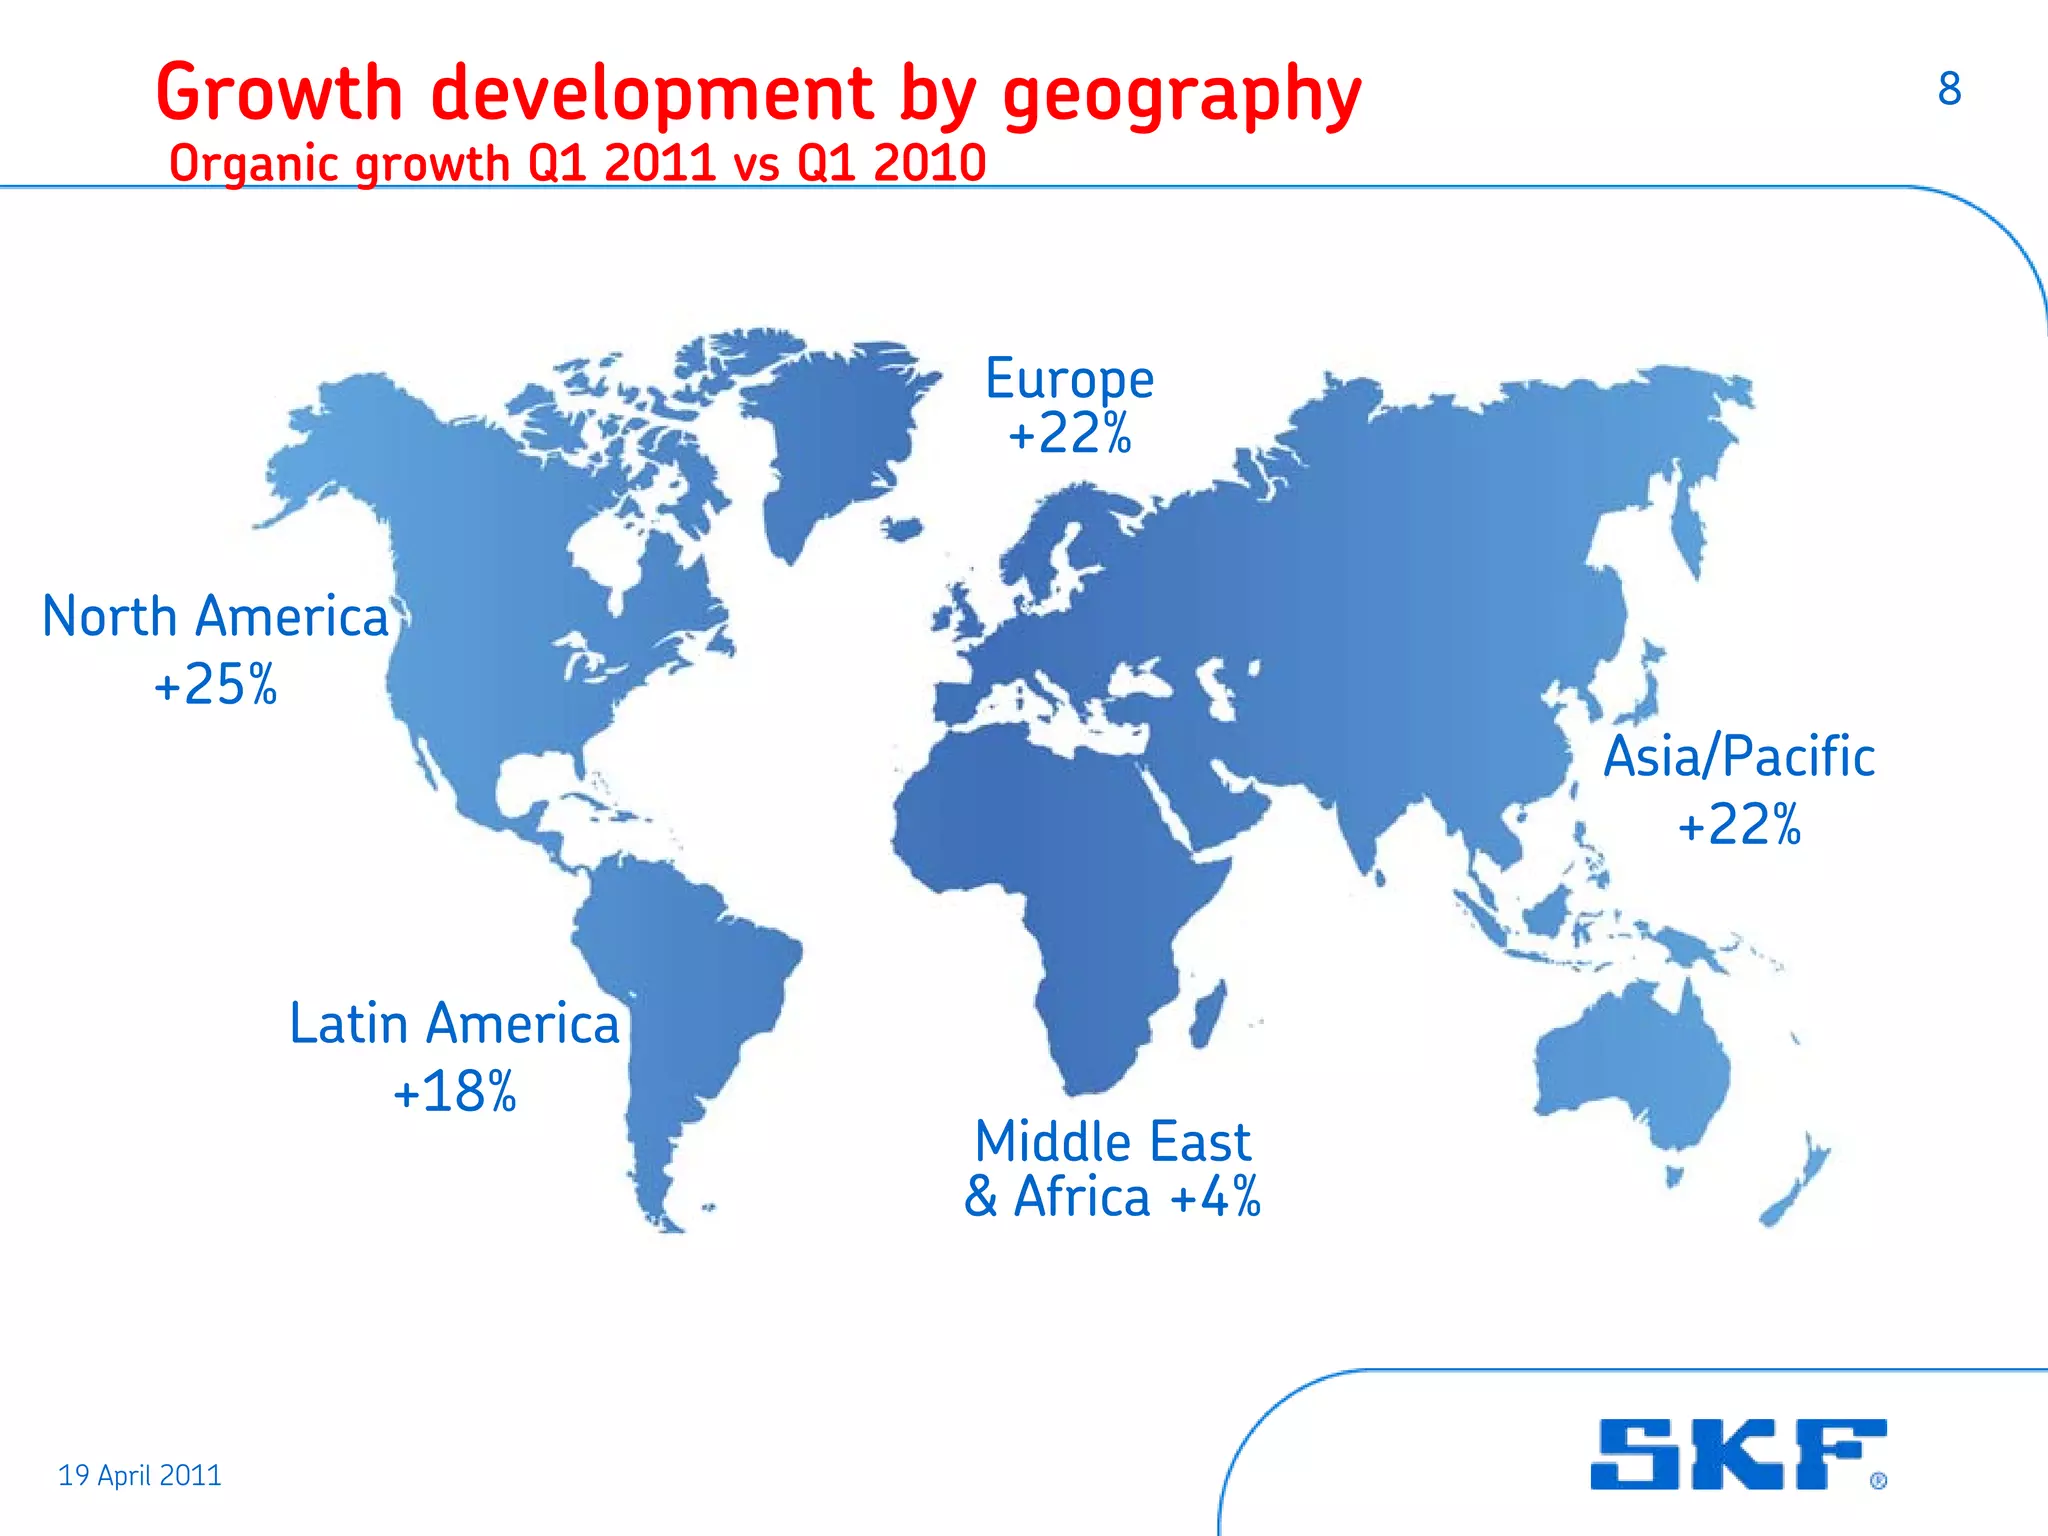
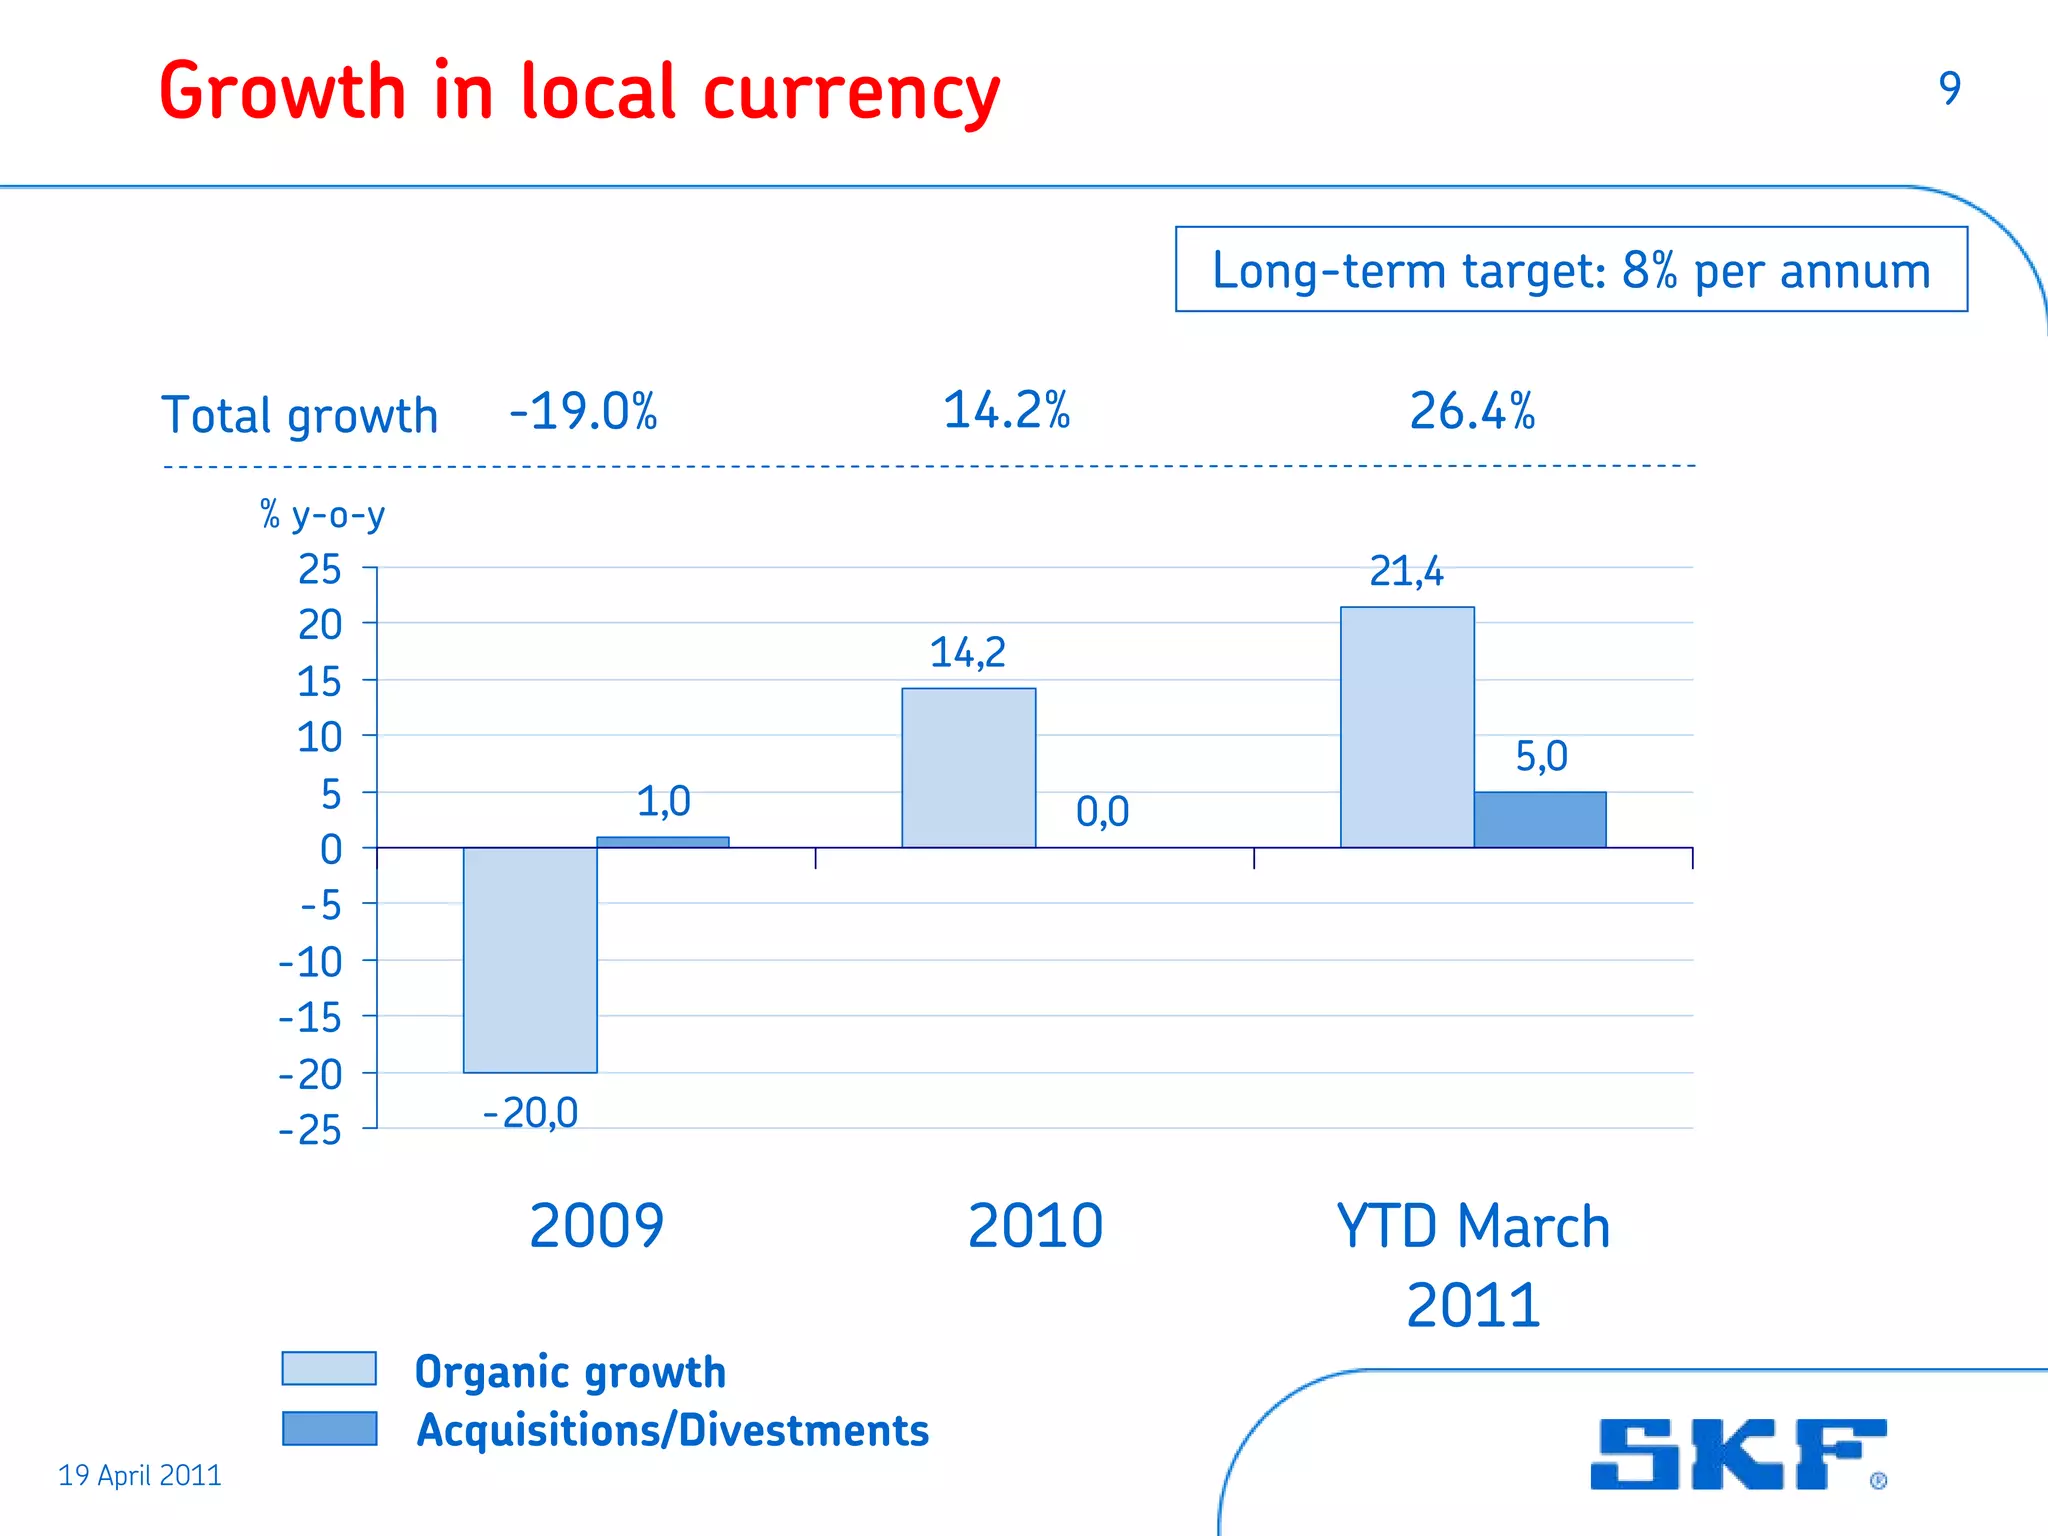
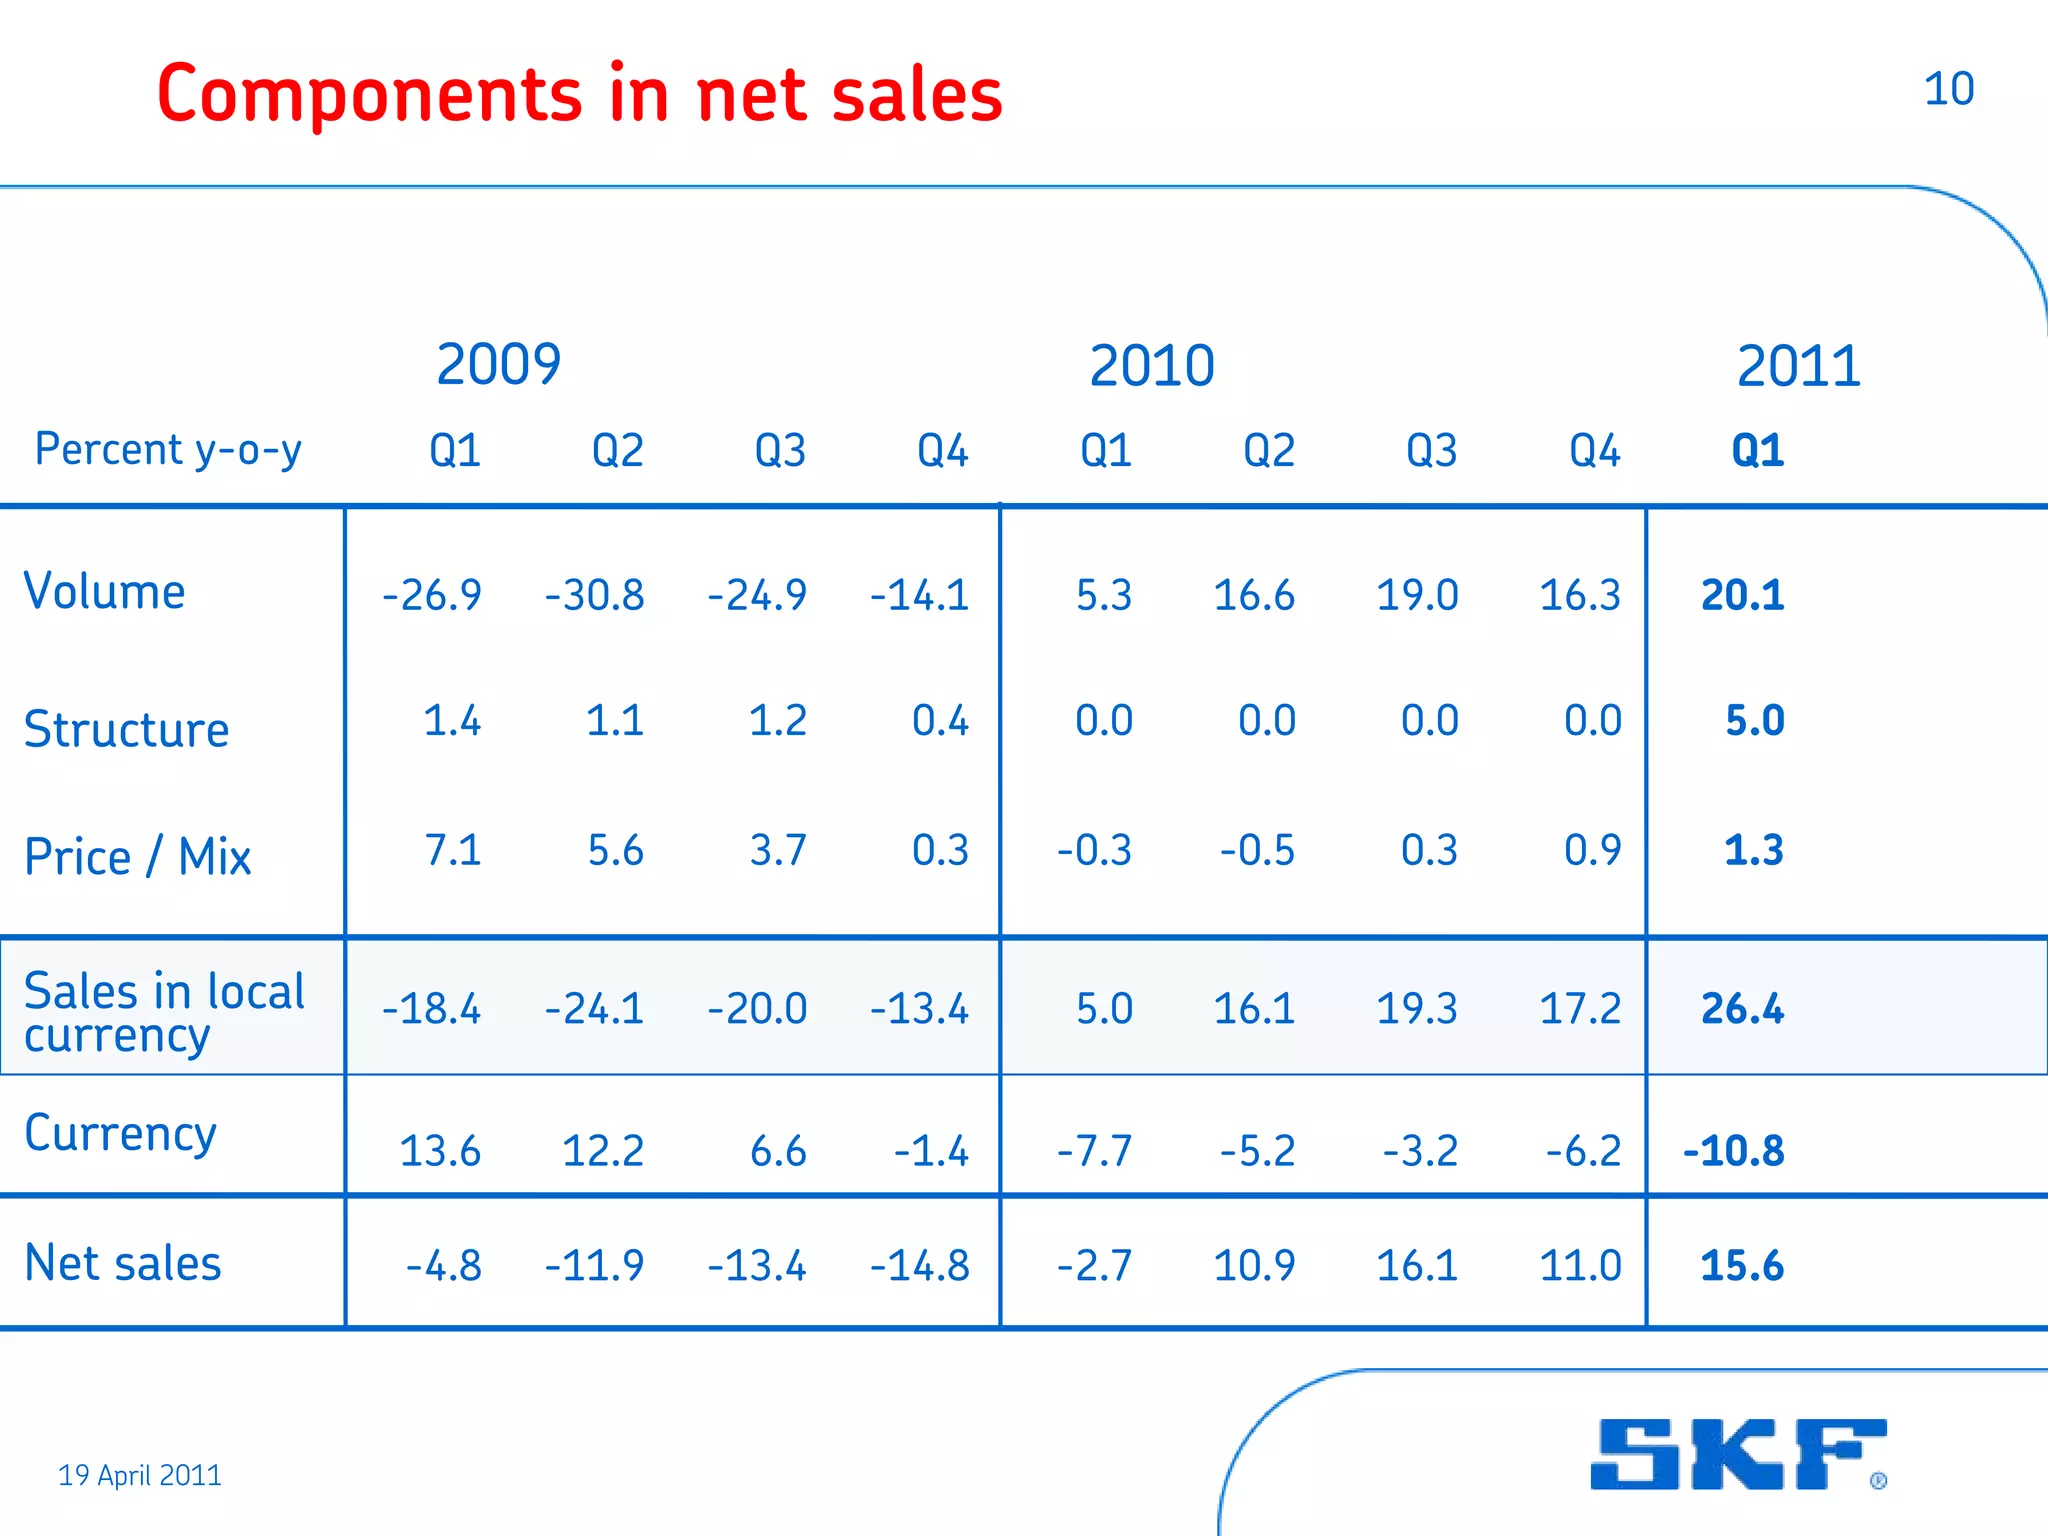
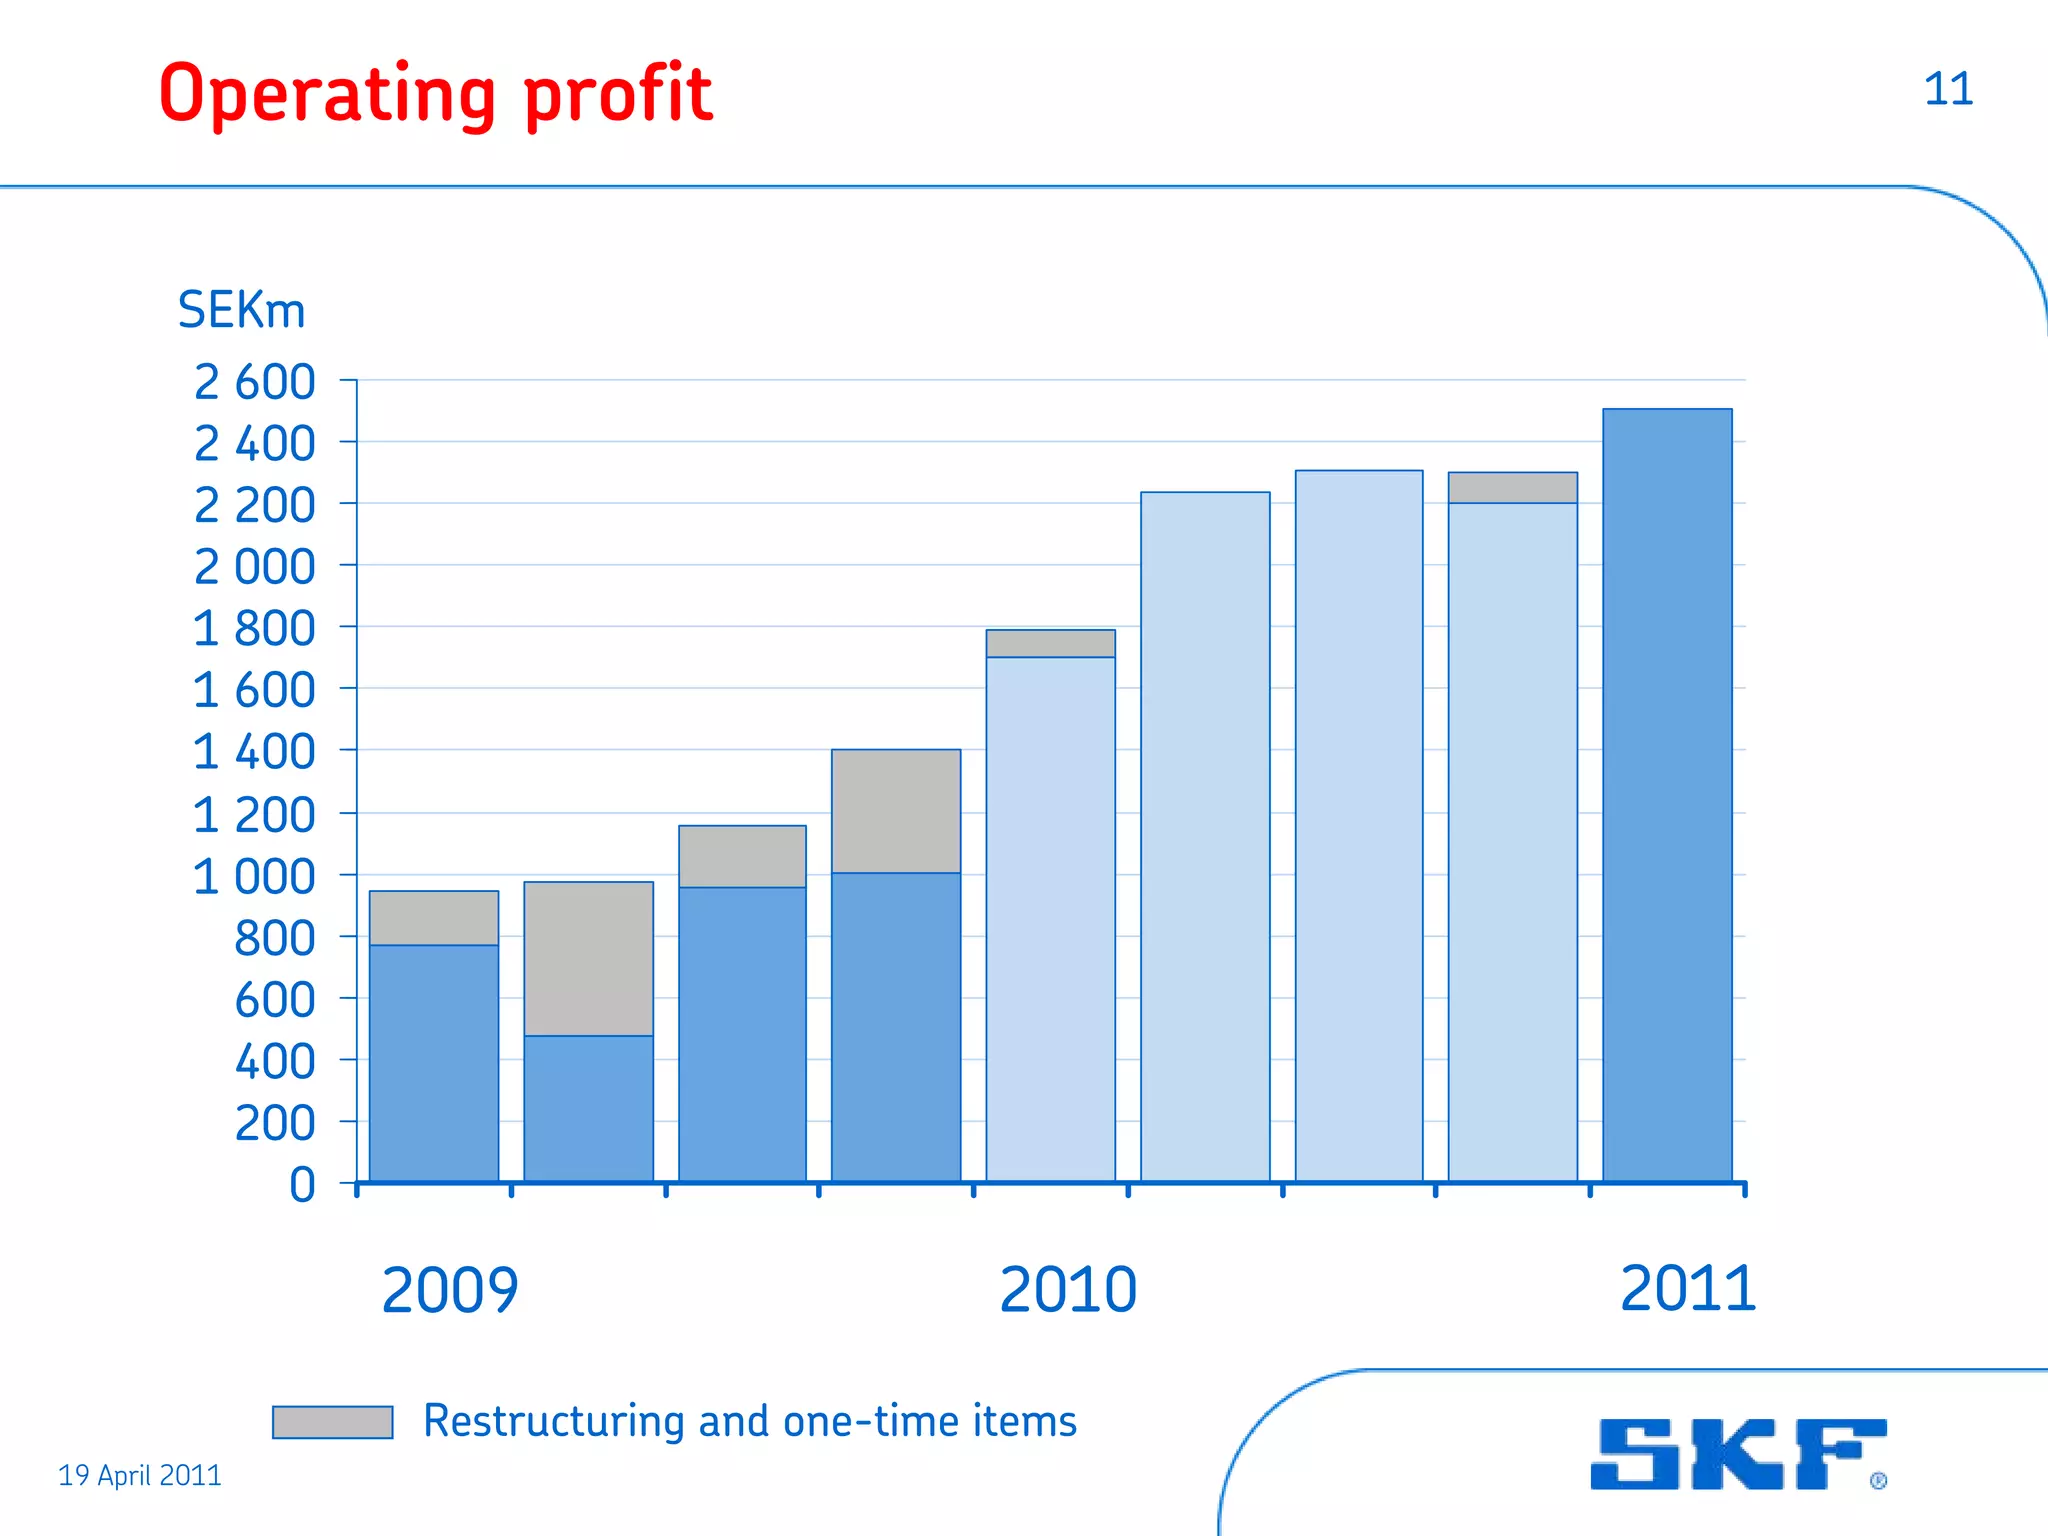
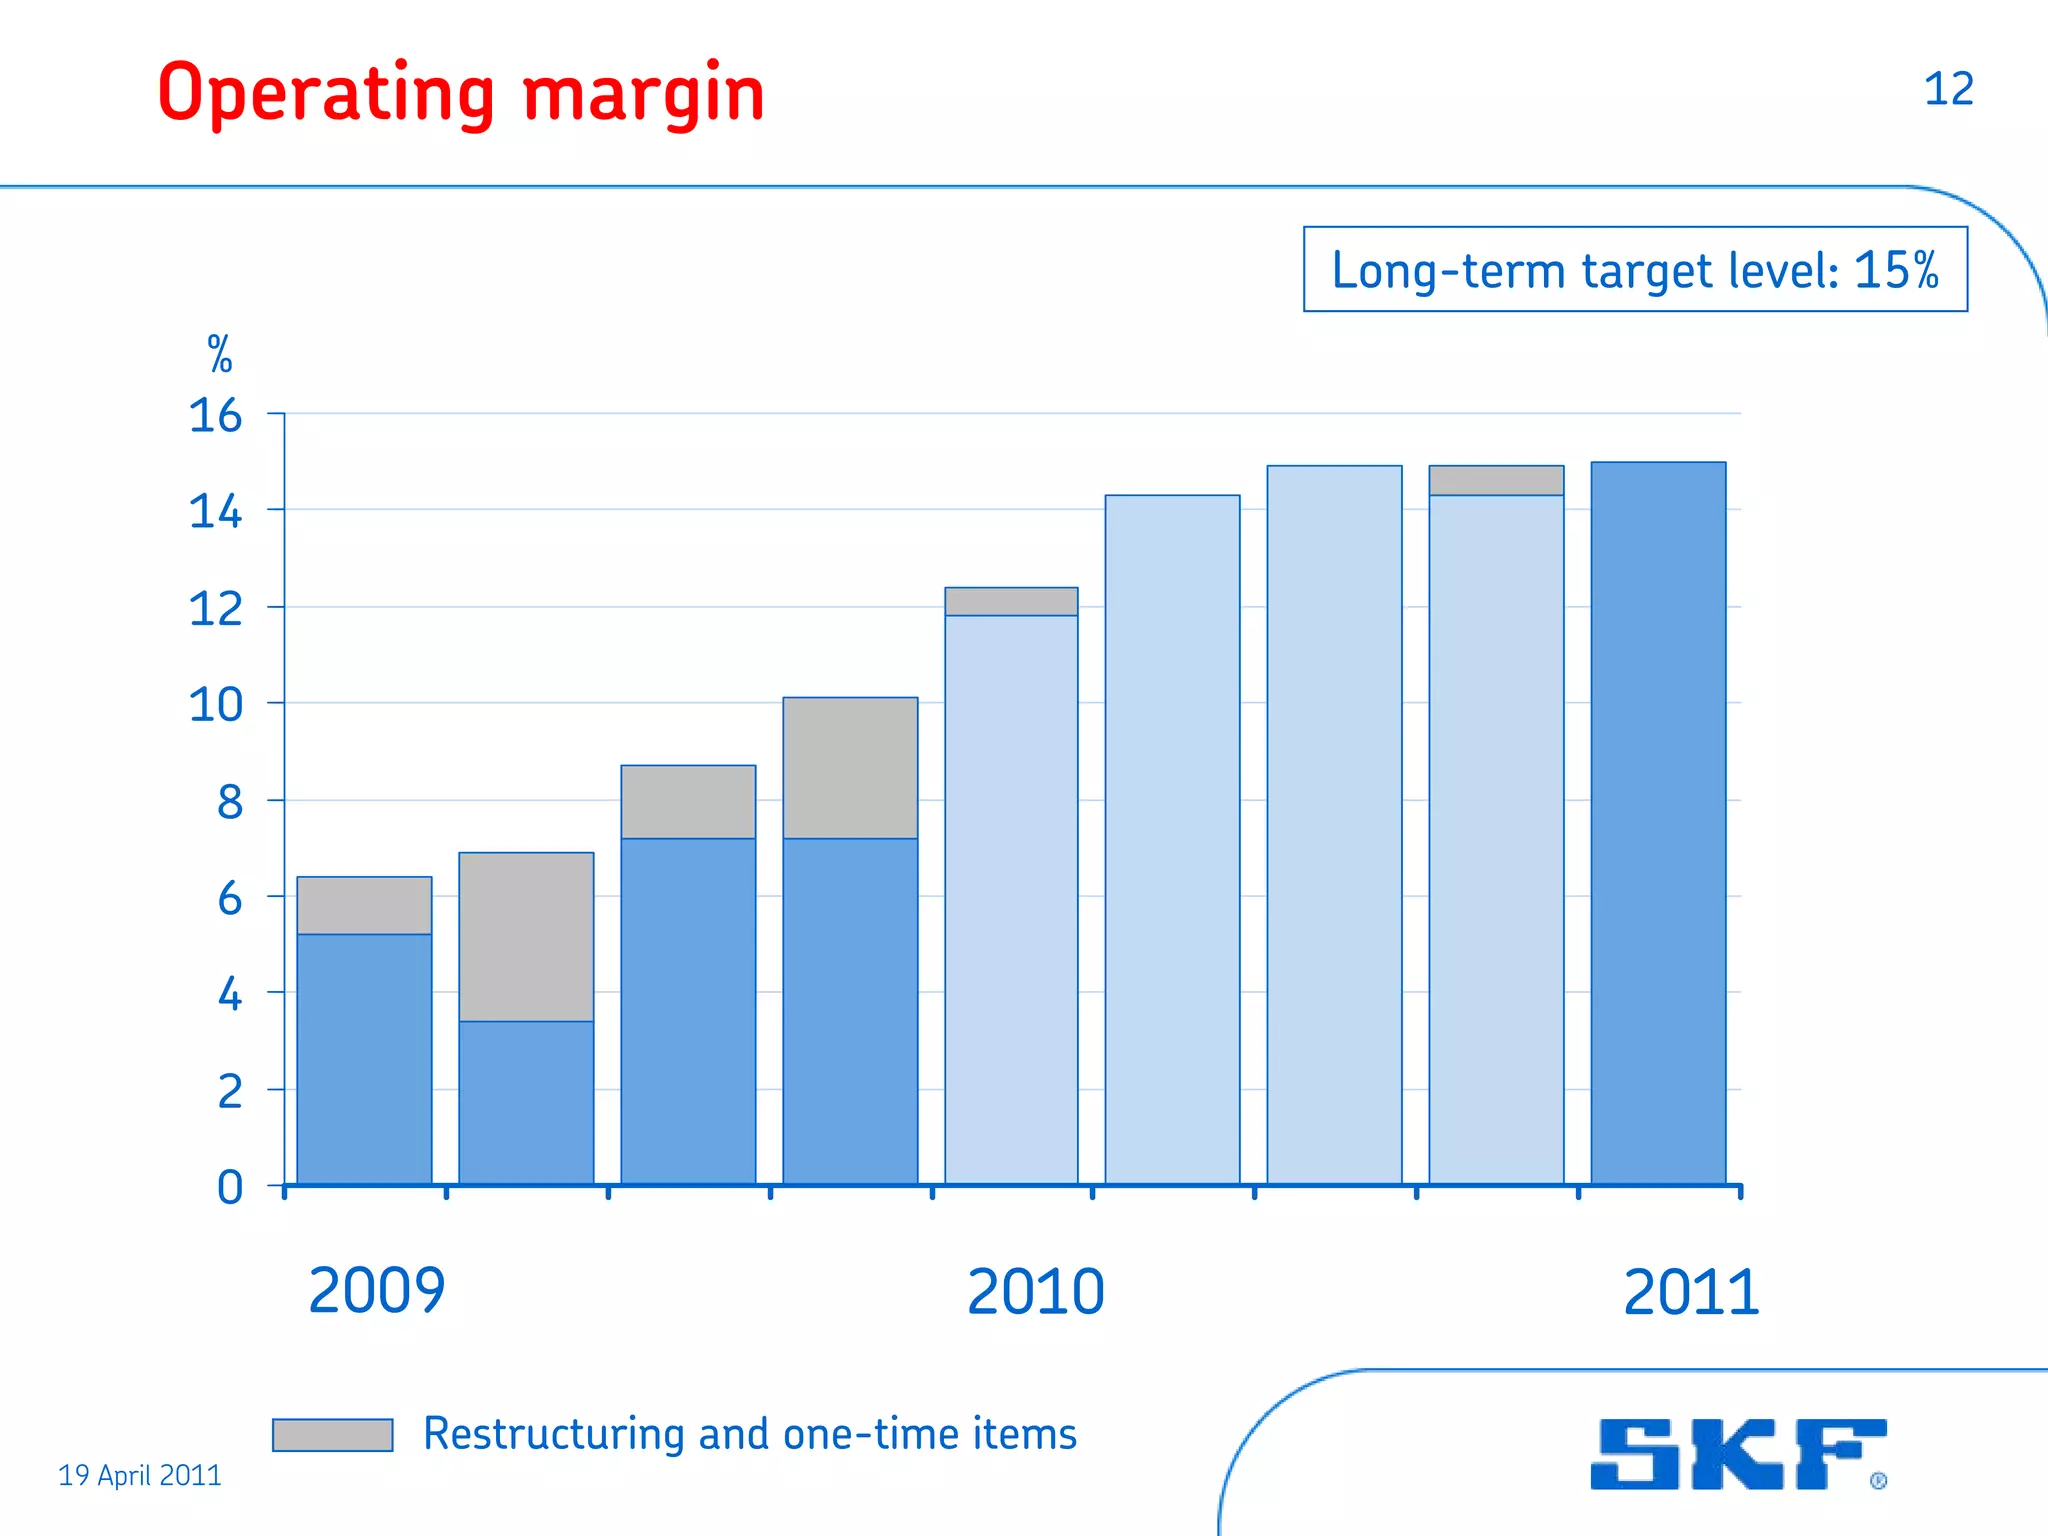
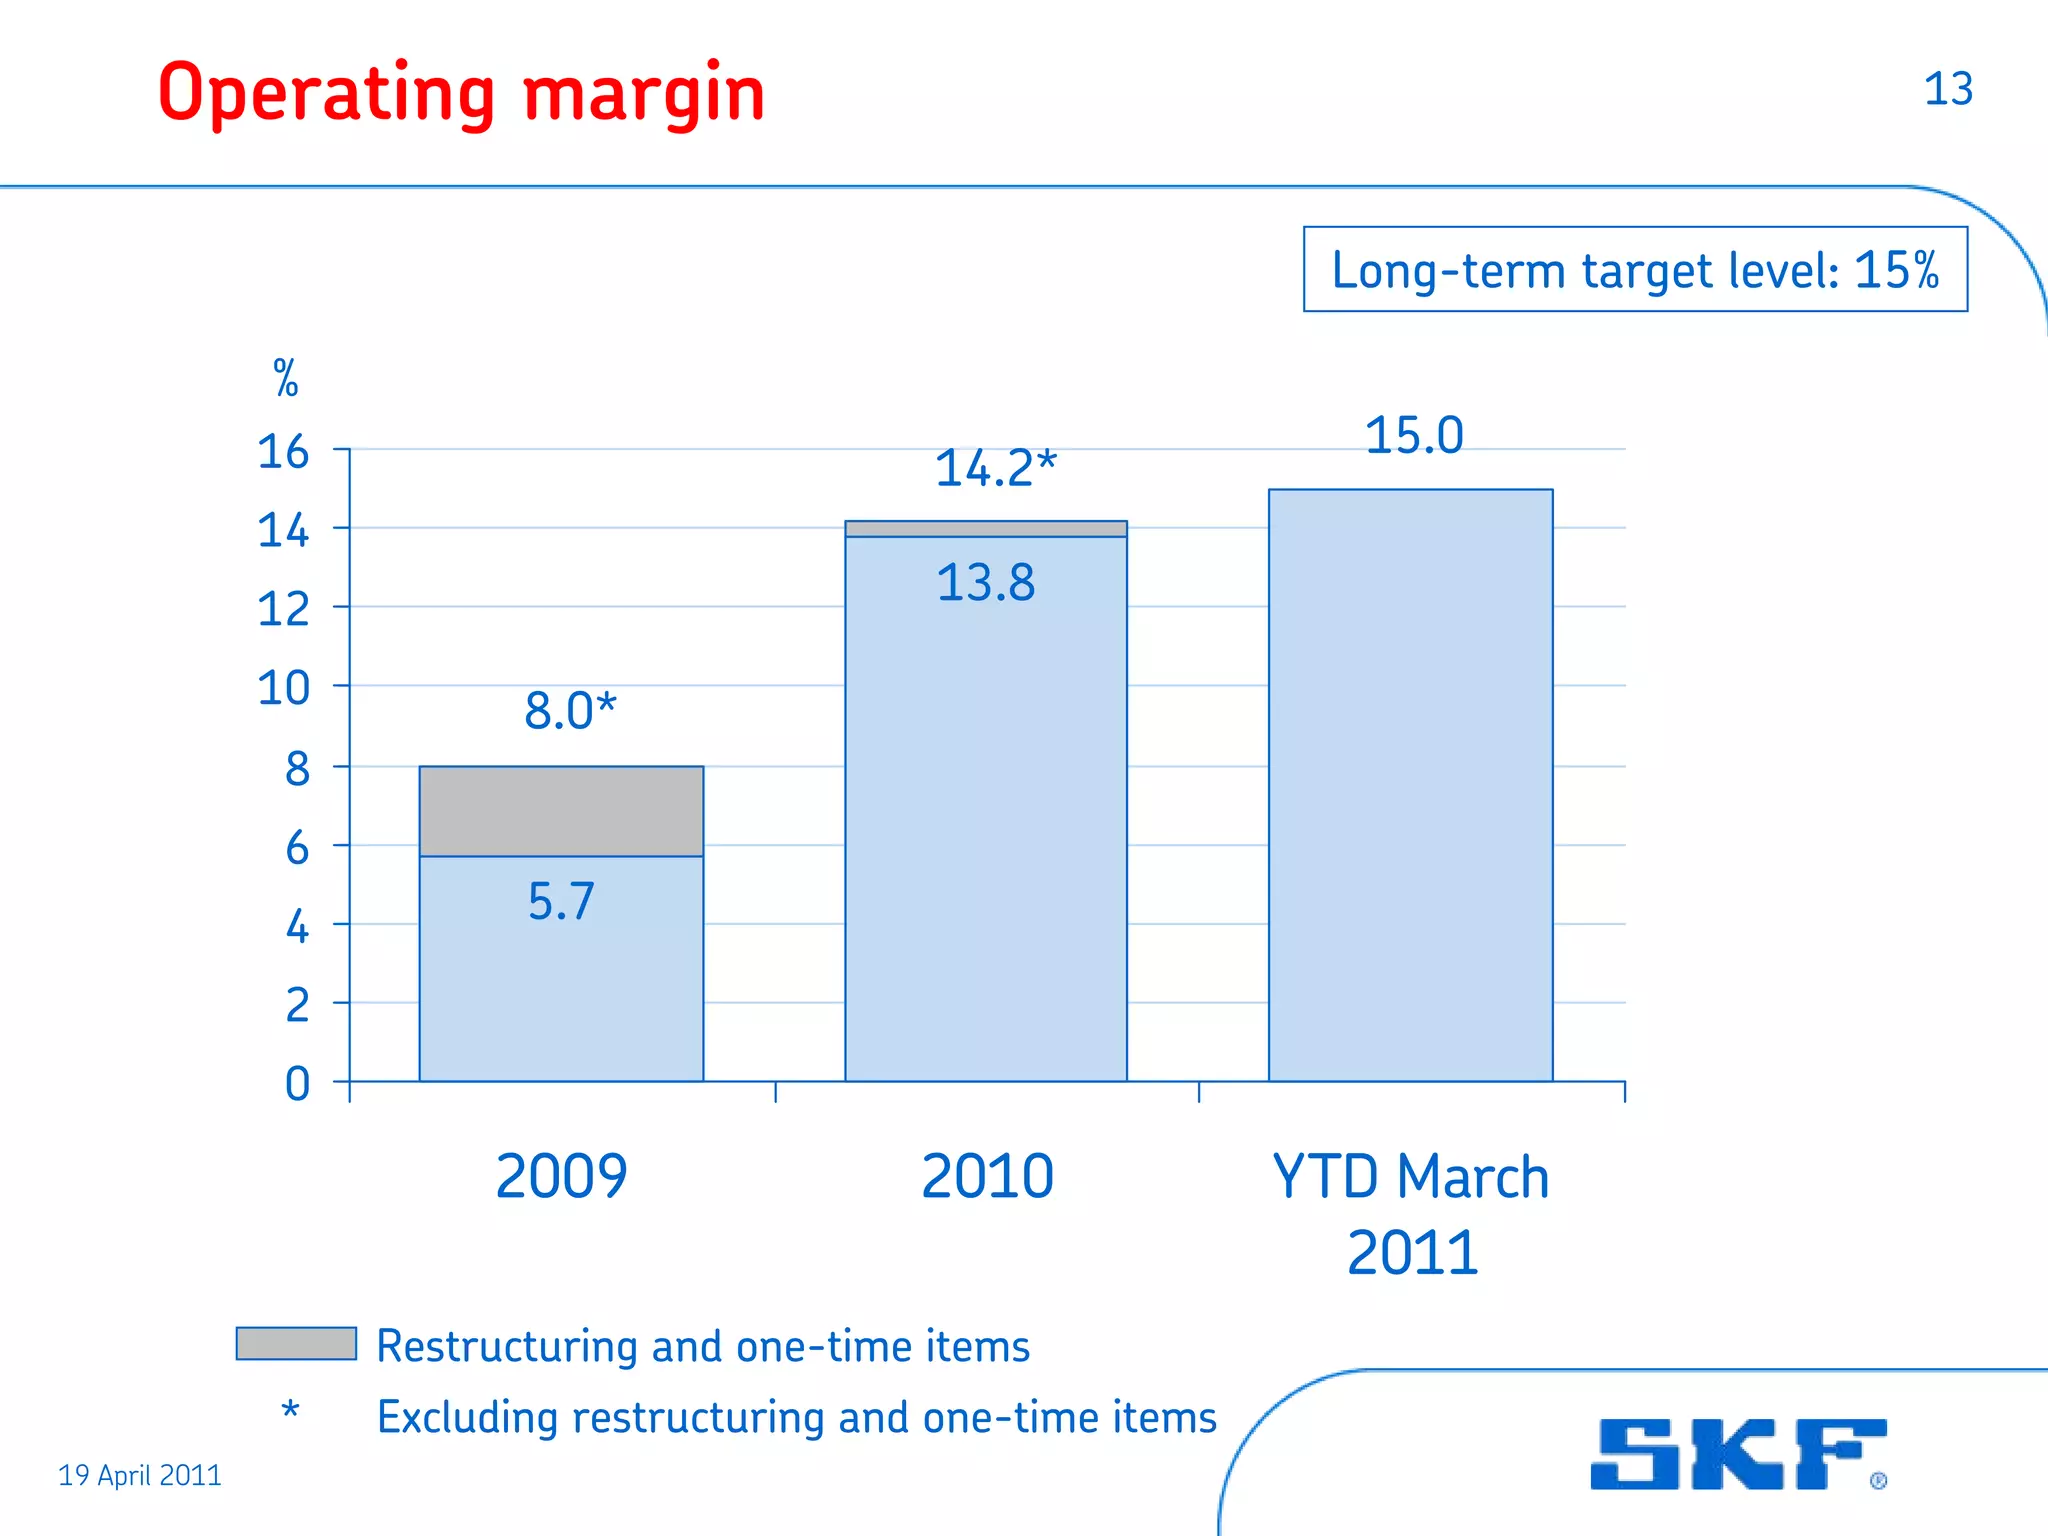
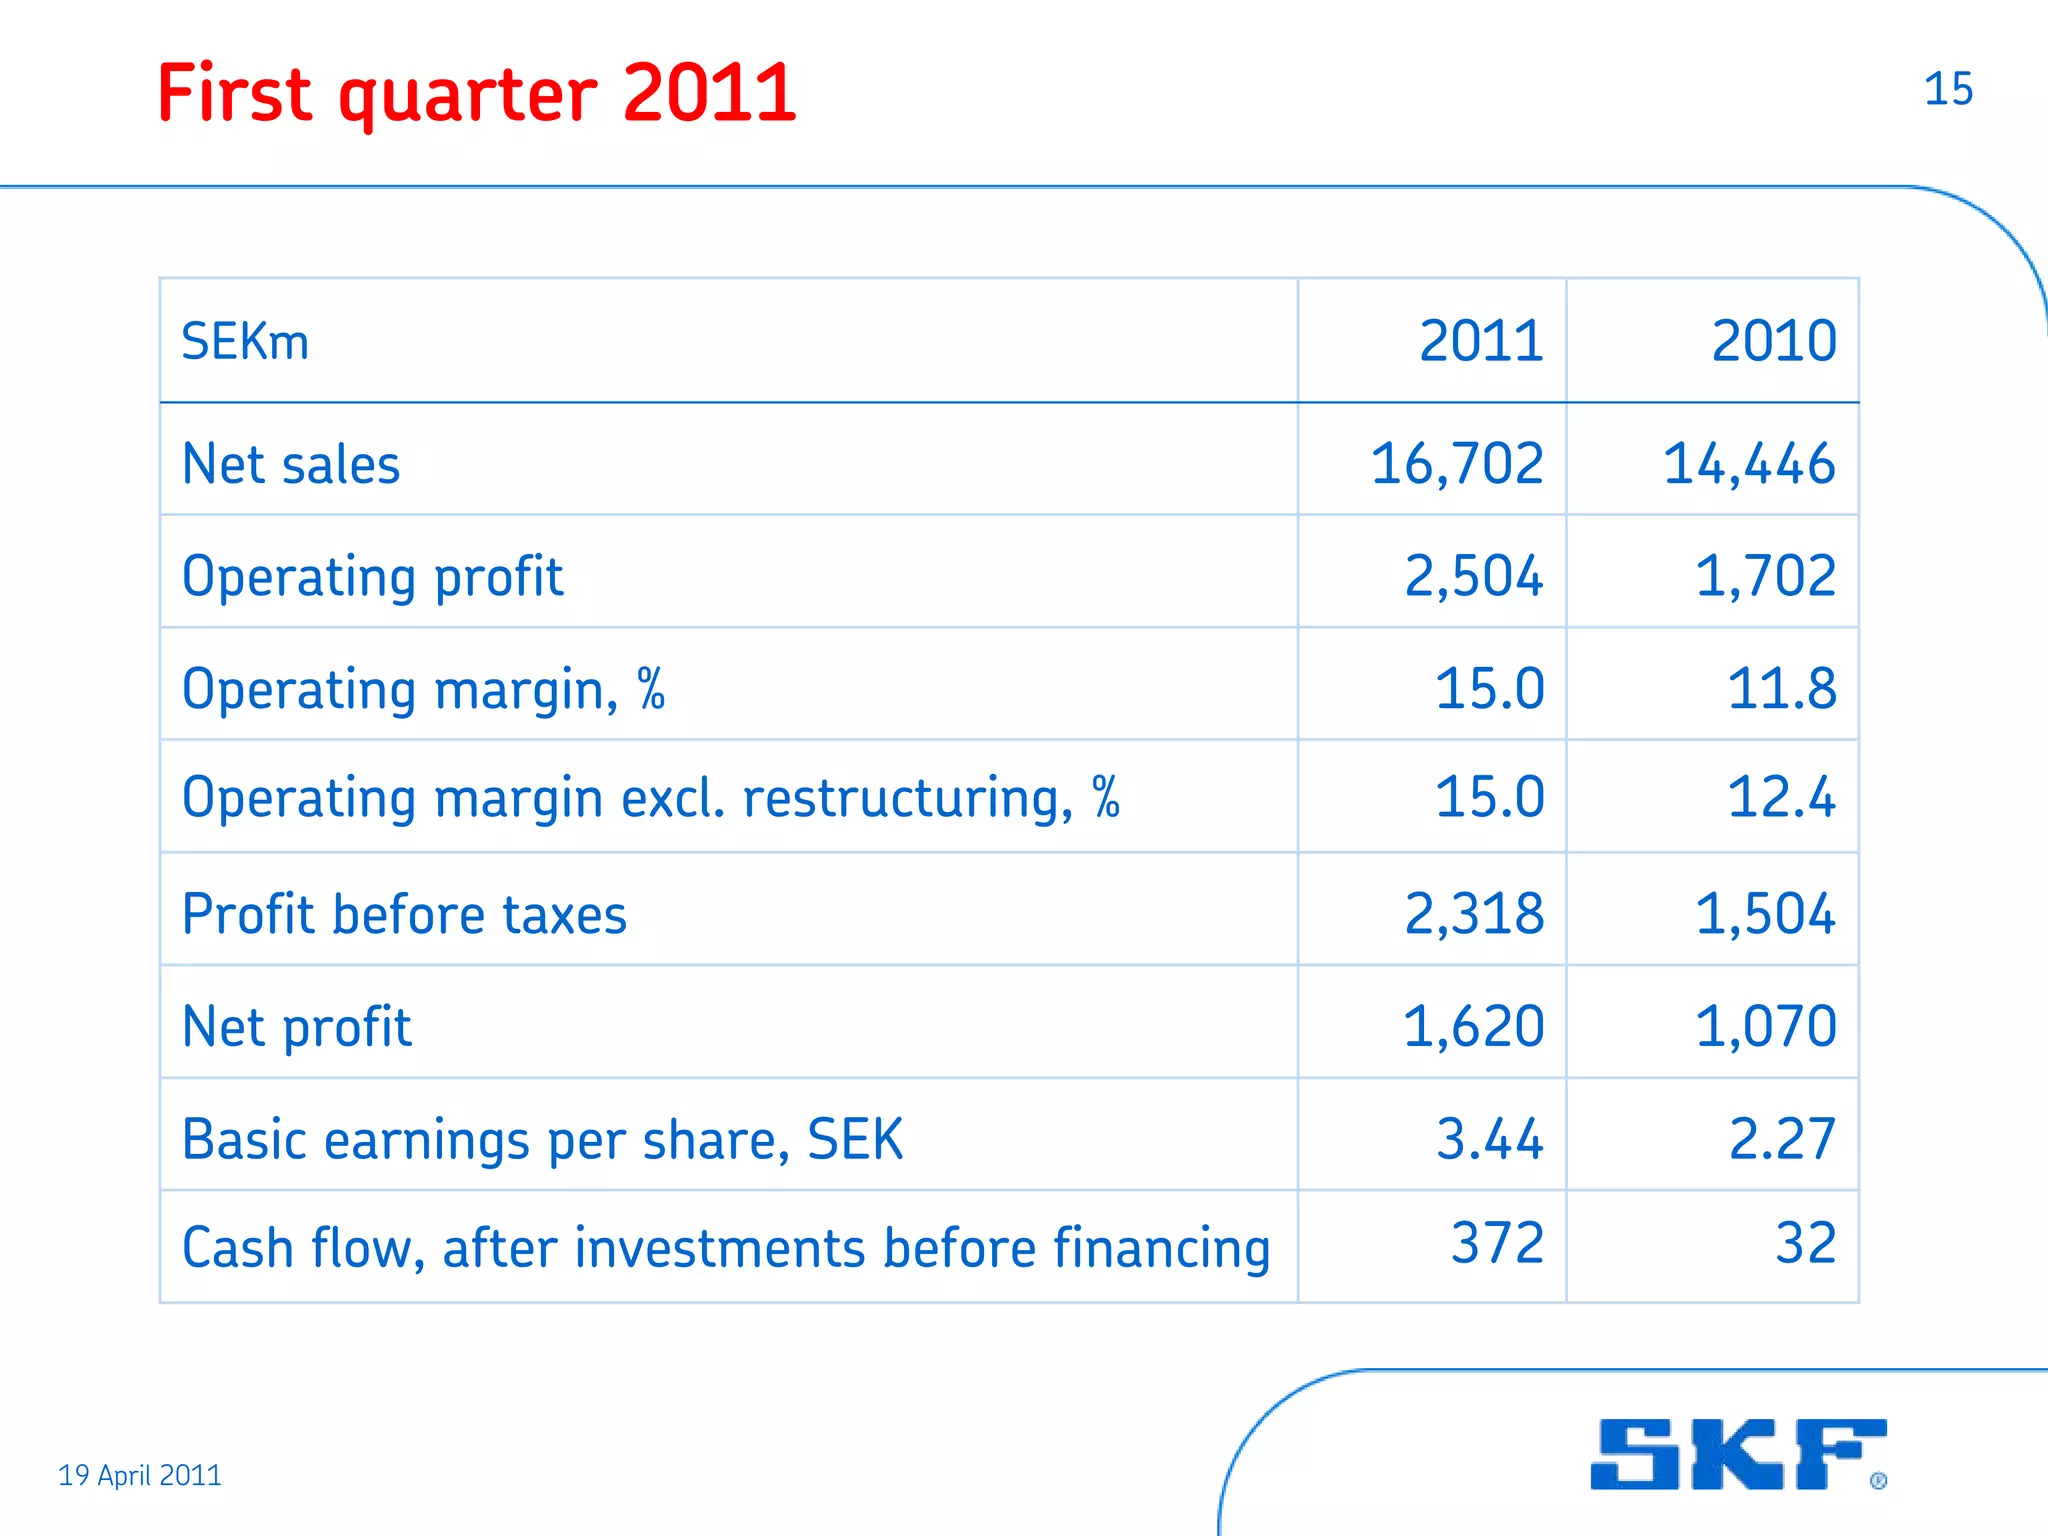
- SKF reported strong financial results in Q1 2011, with operating profit of SEK 2,504 million, up from SEK 1,702 million in Q1 2010. Organic sales growth was 21.4% in local currency.
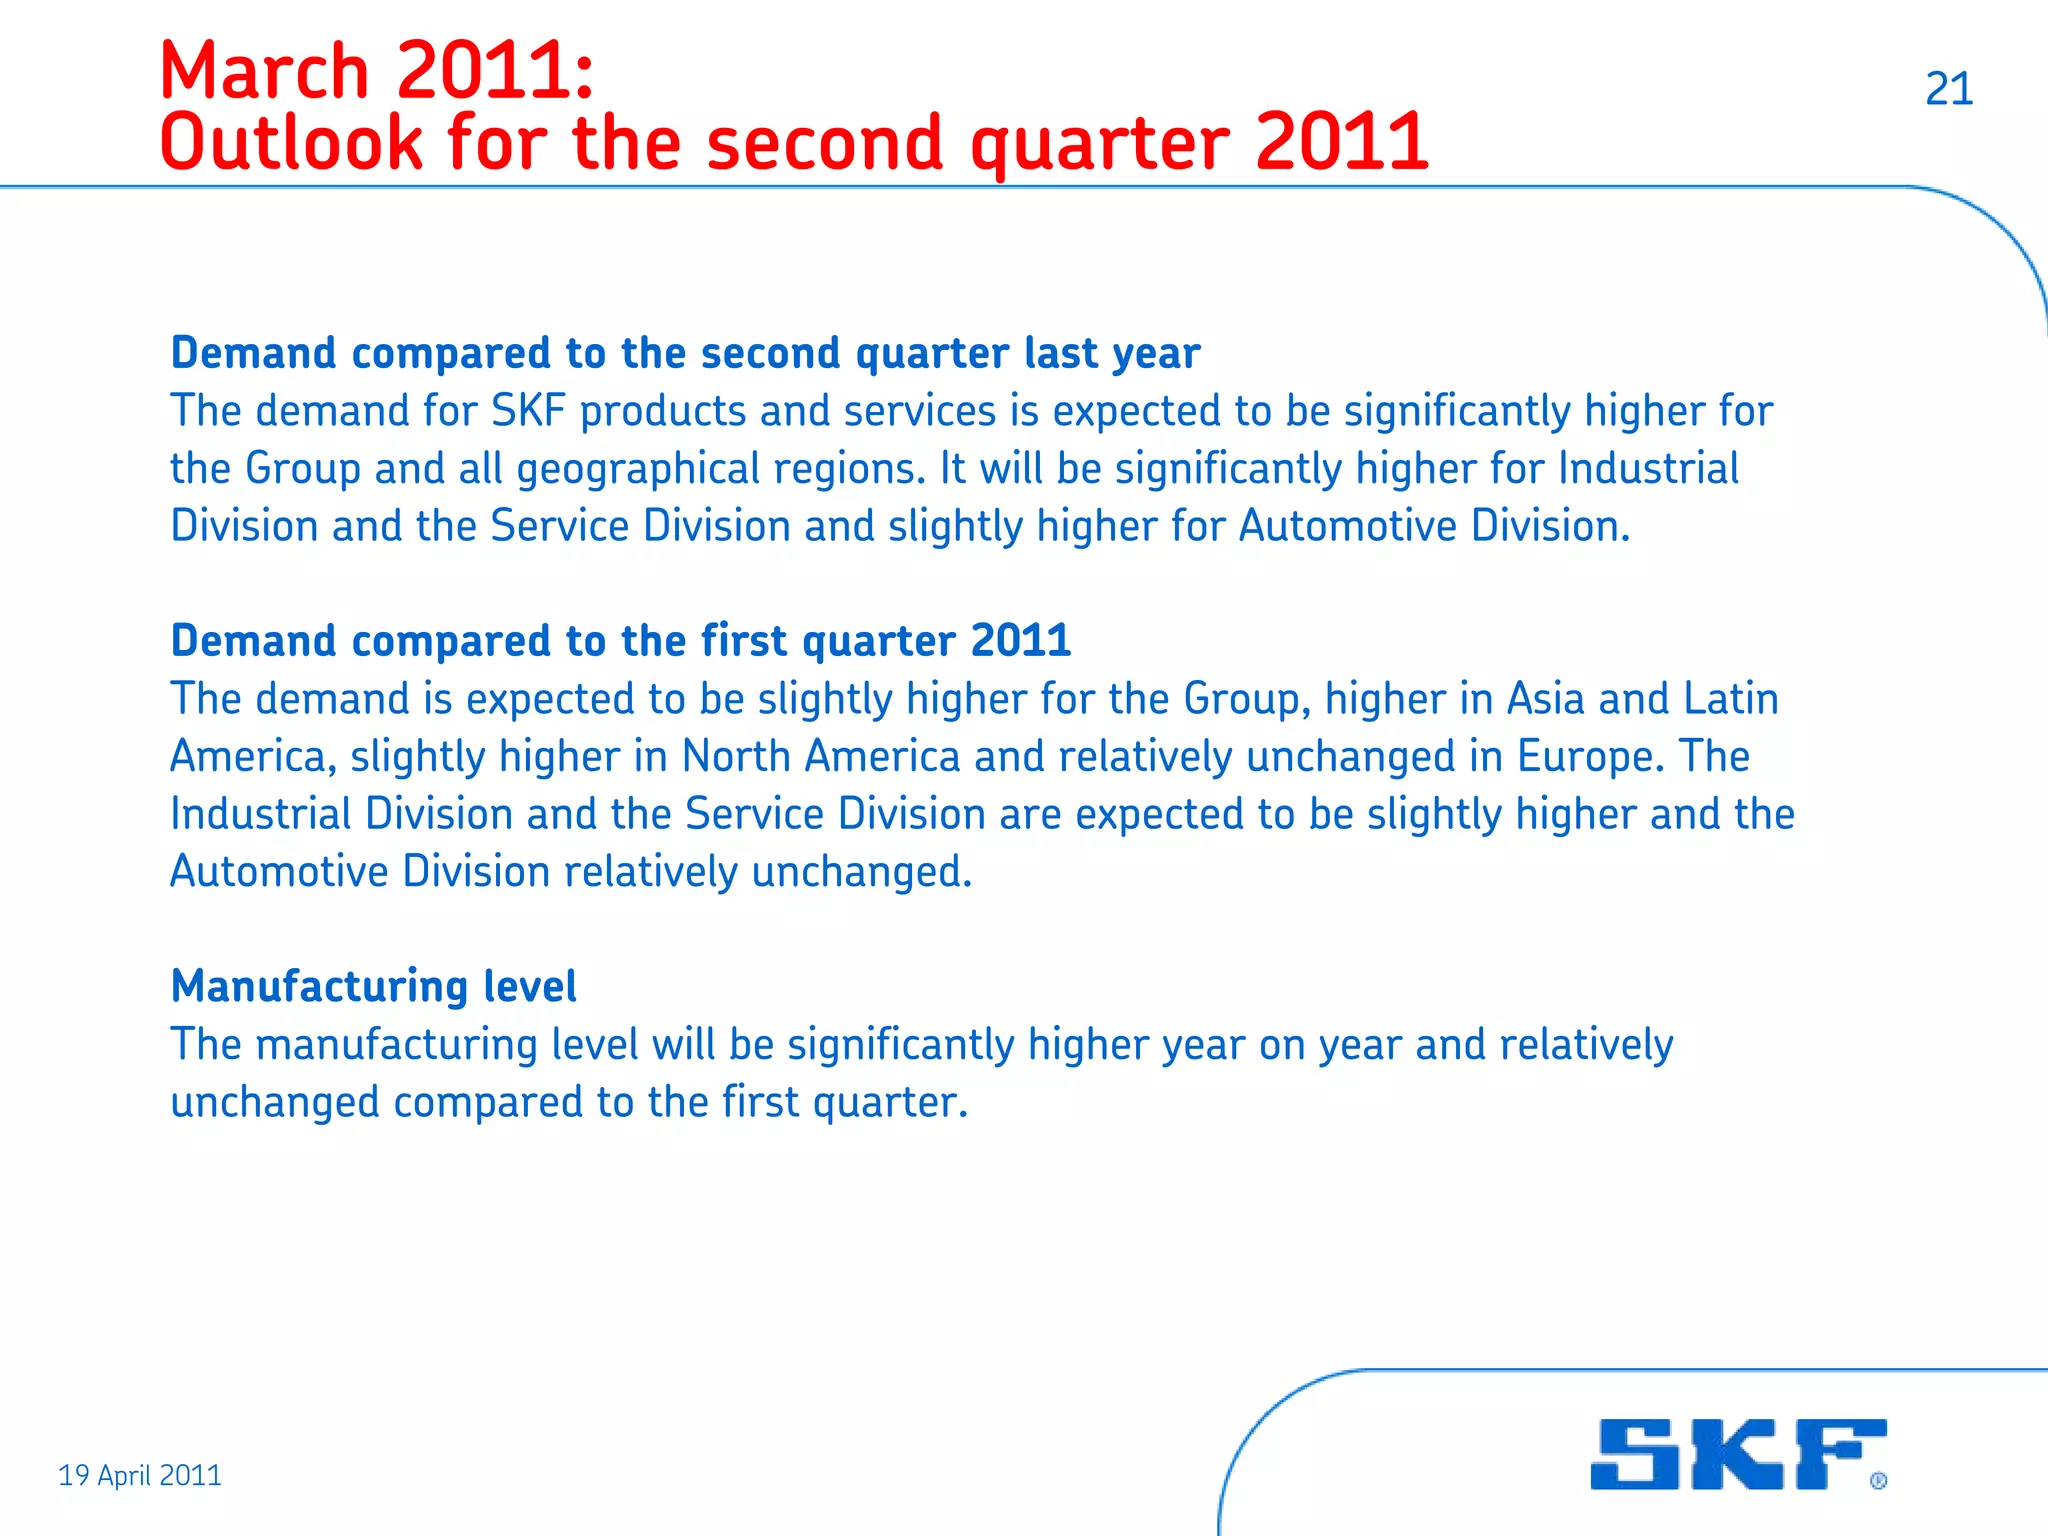
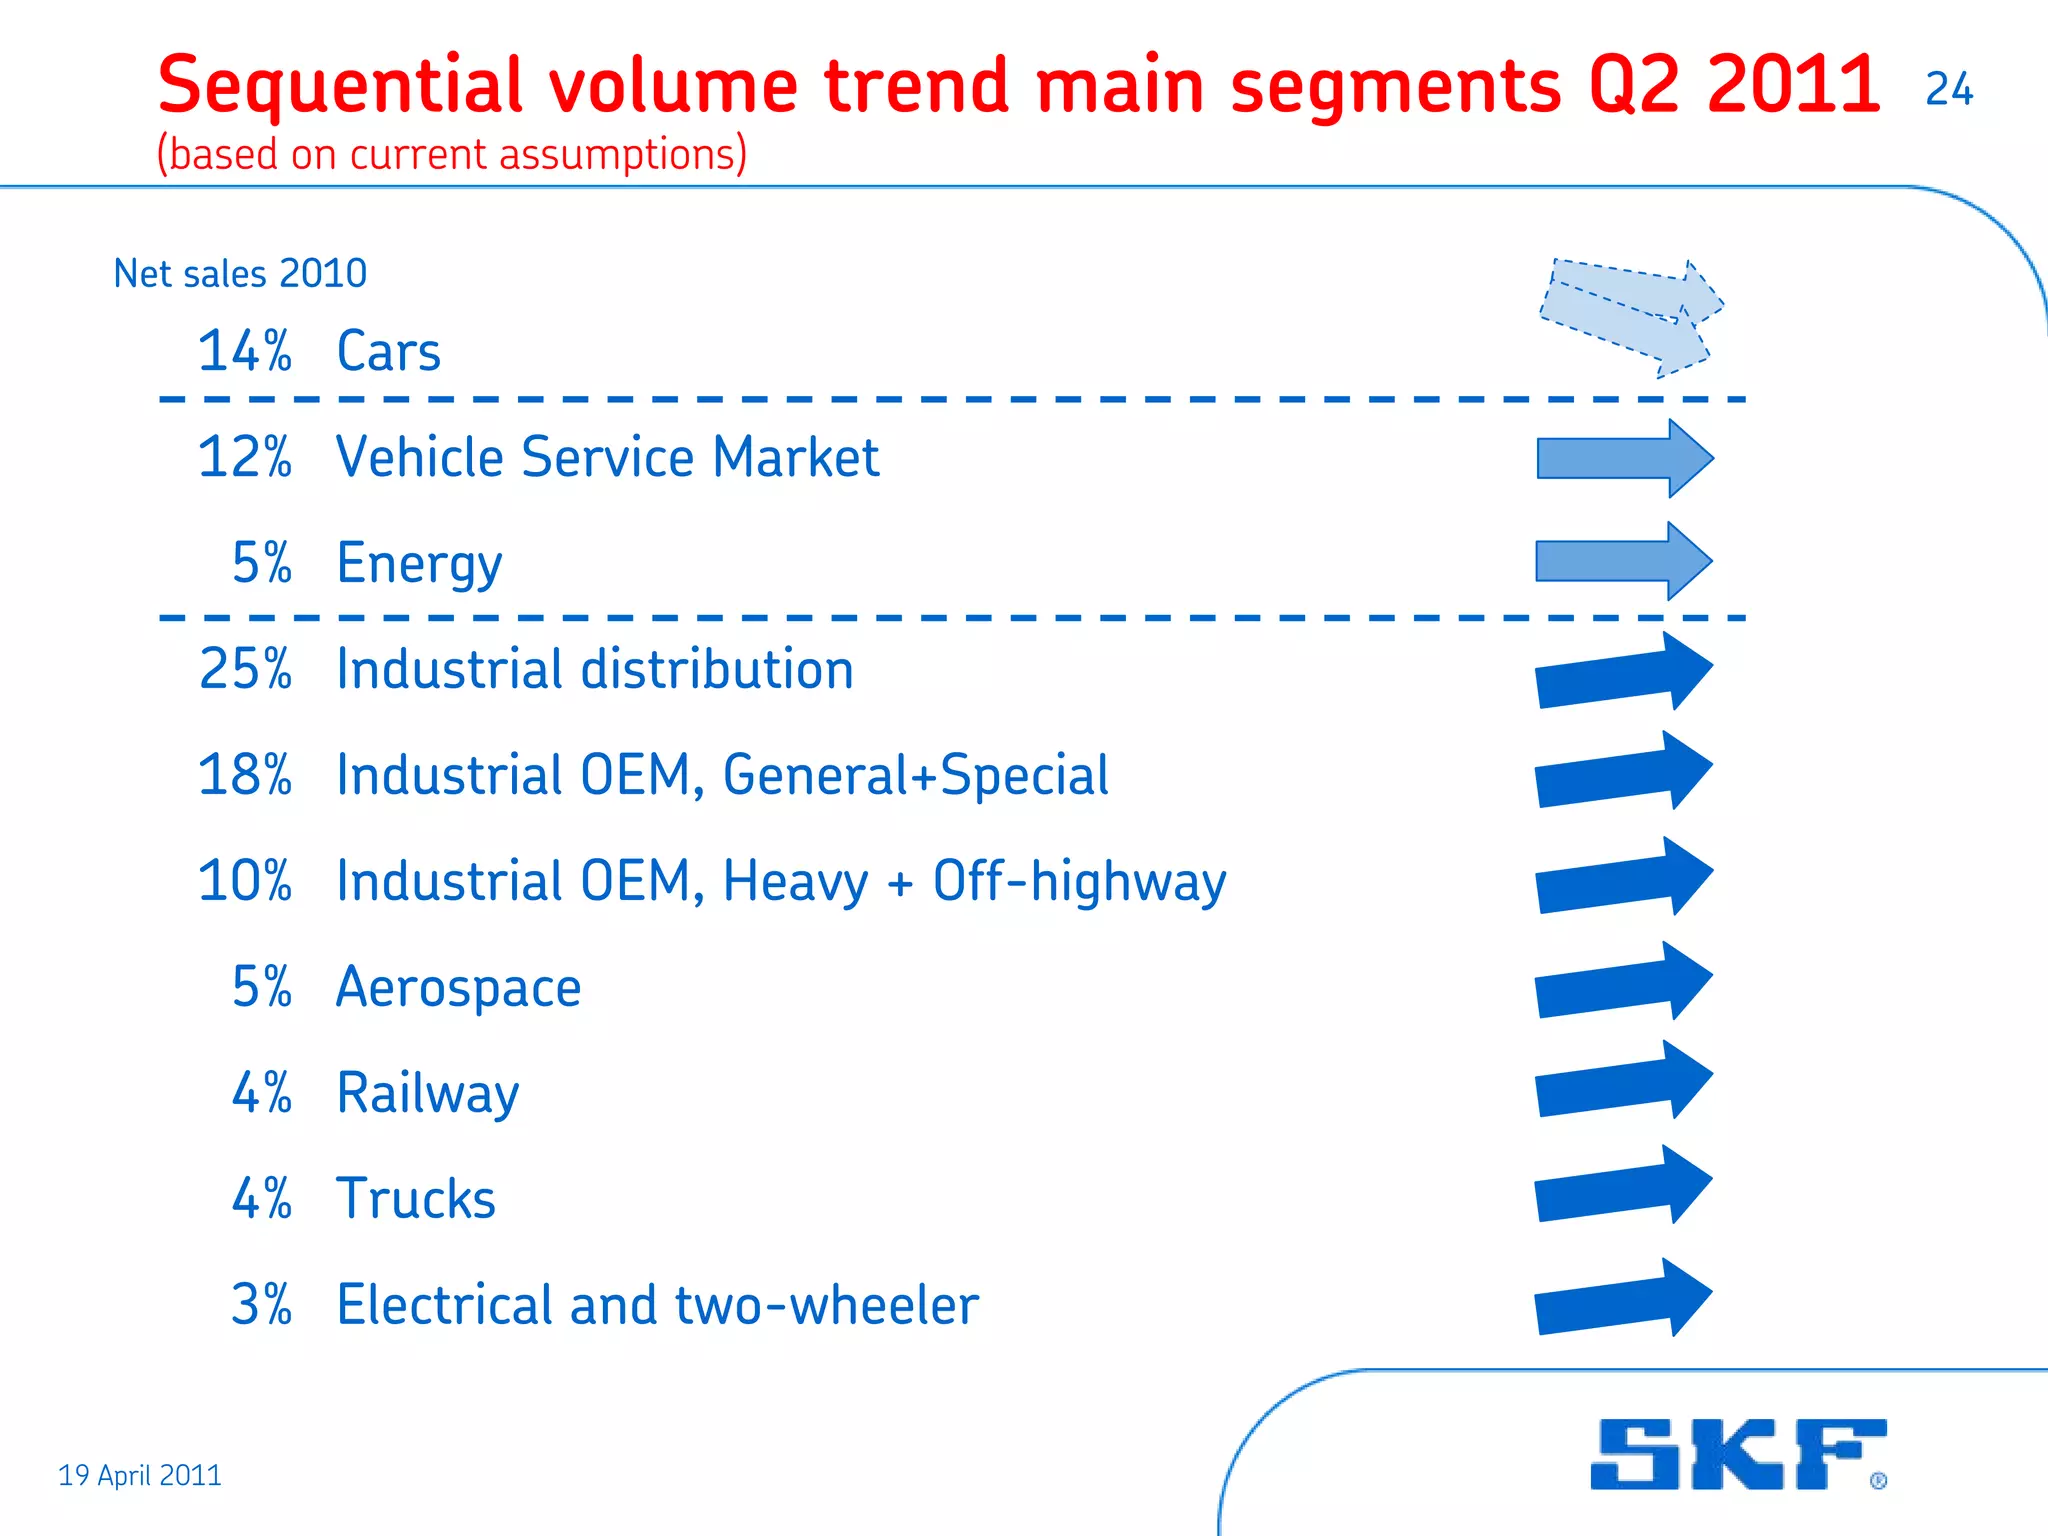
- Demand is expected to be significantly higher in Q2 2011 compared to Q2 2010, though manufacturing levels are expected to remain relatively unchanged from Q1 2011.
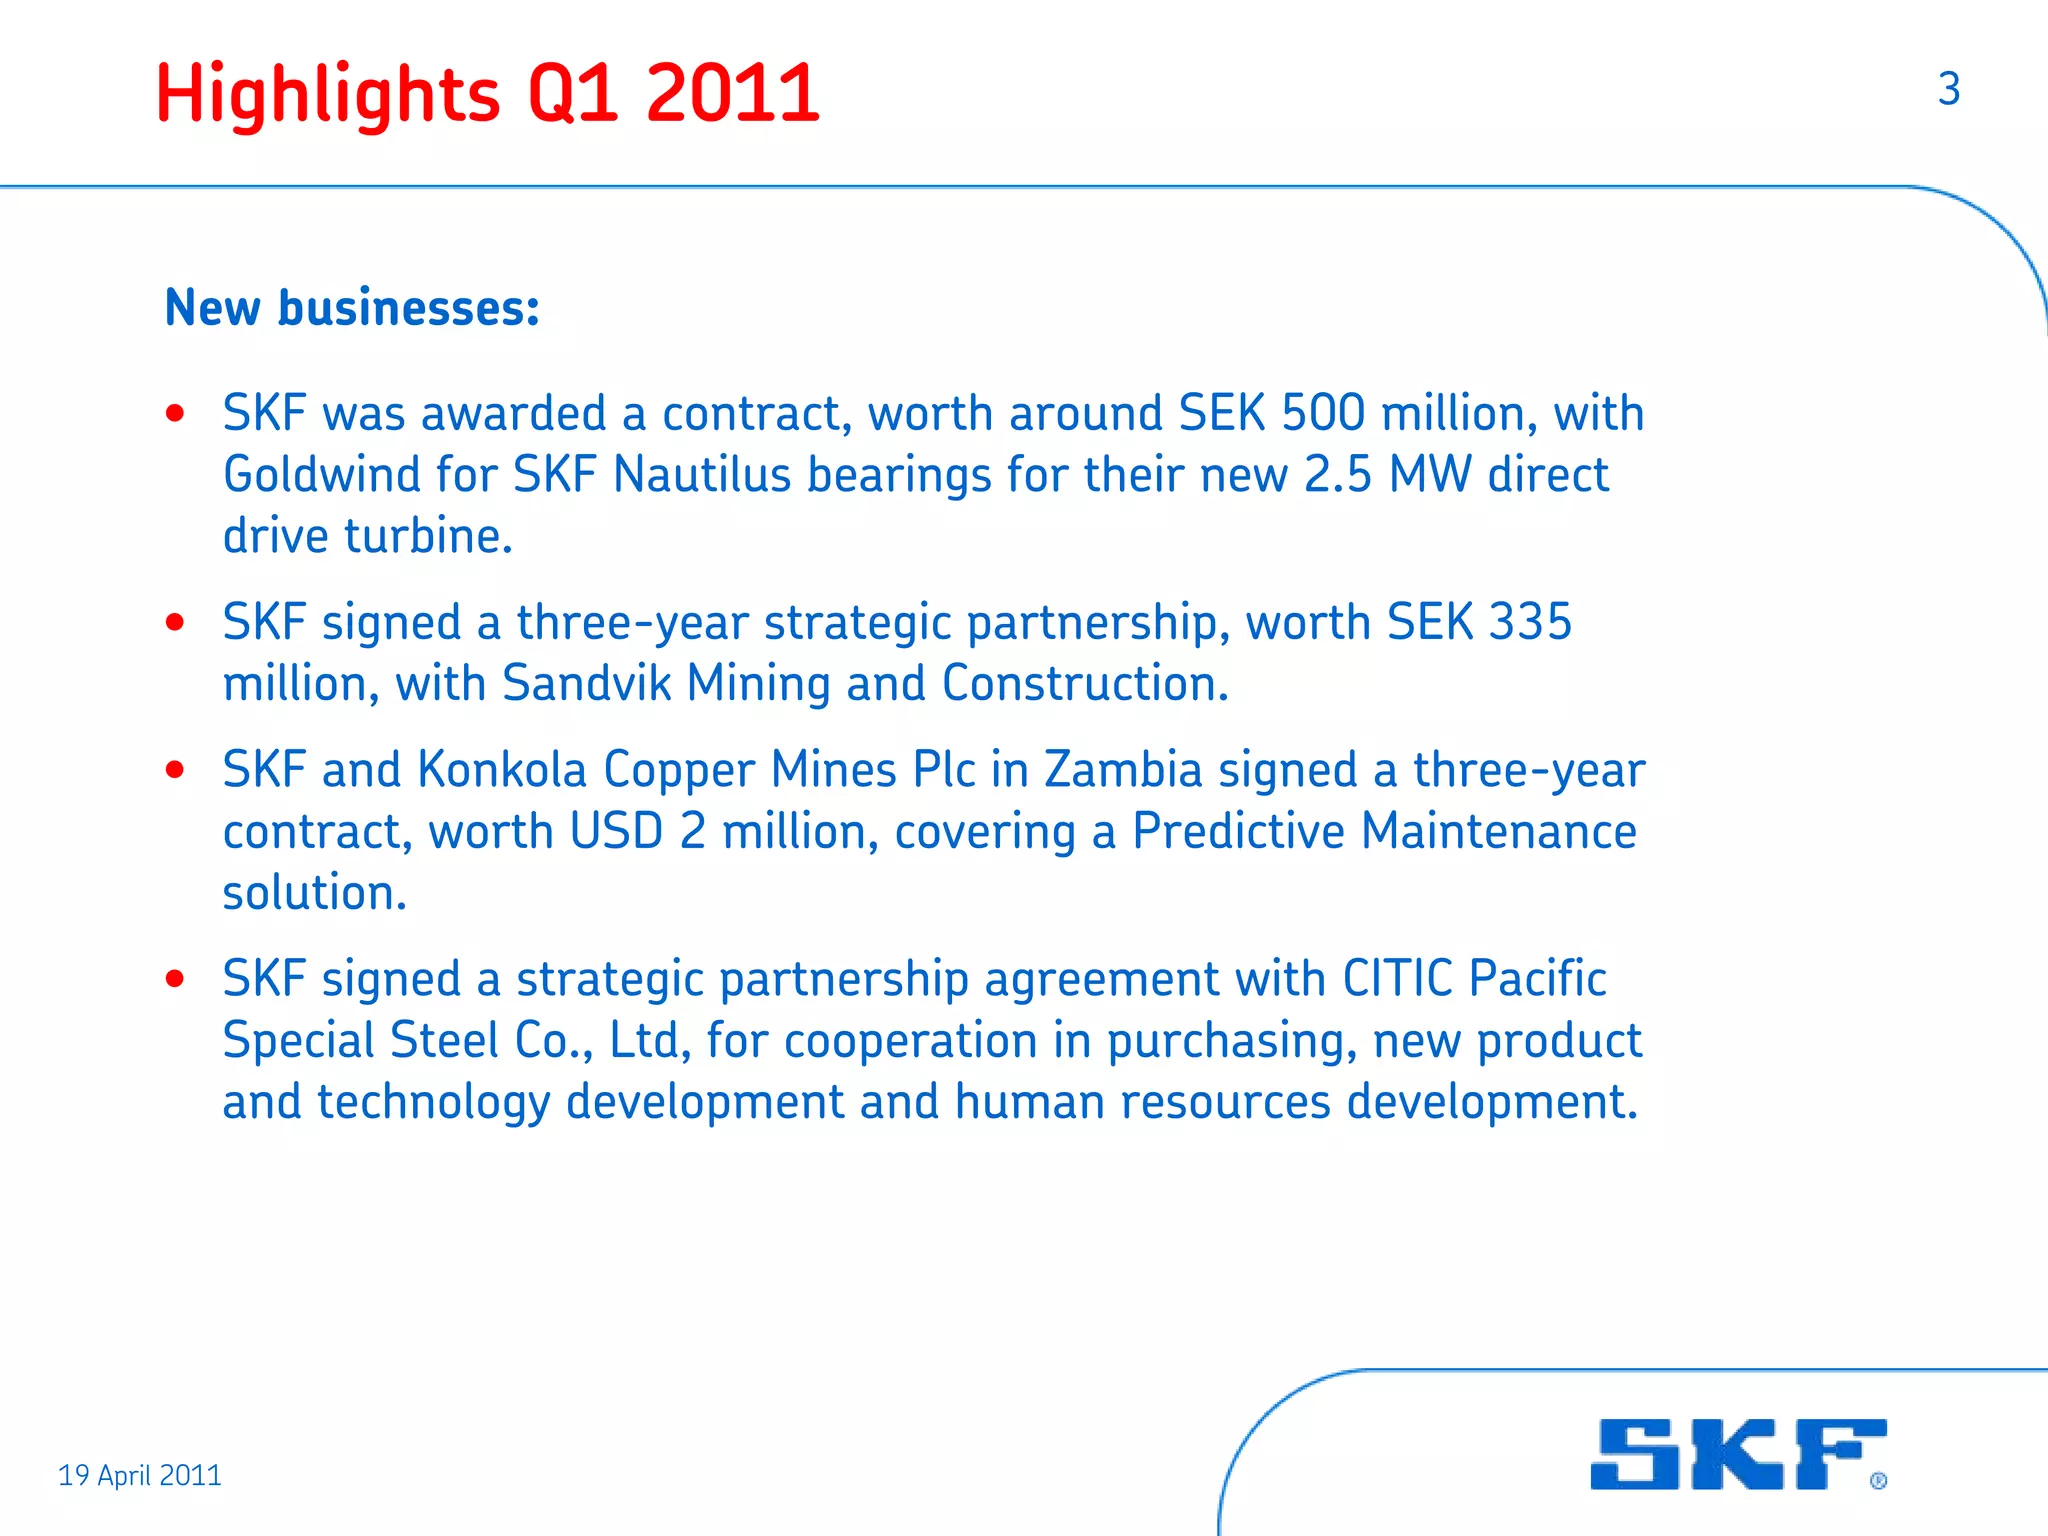
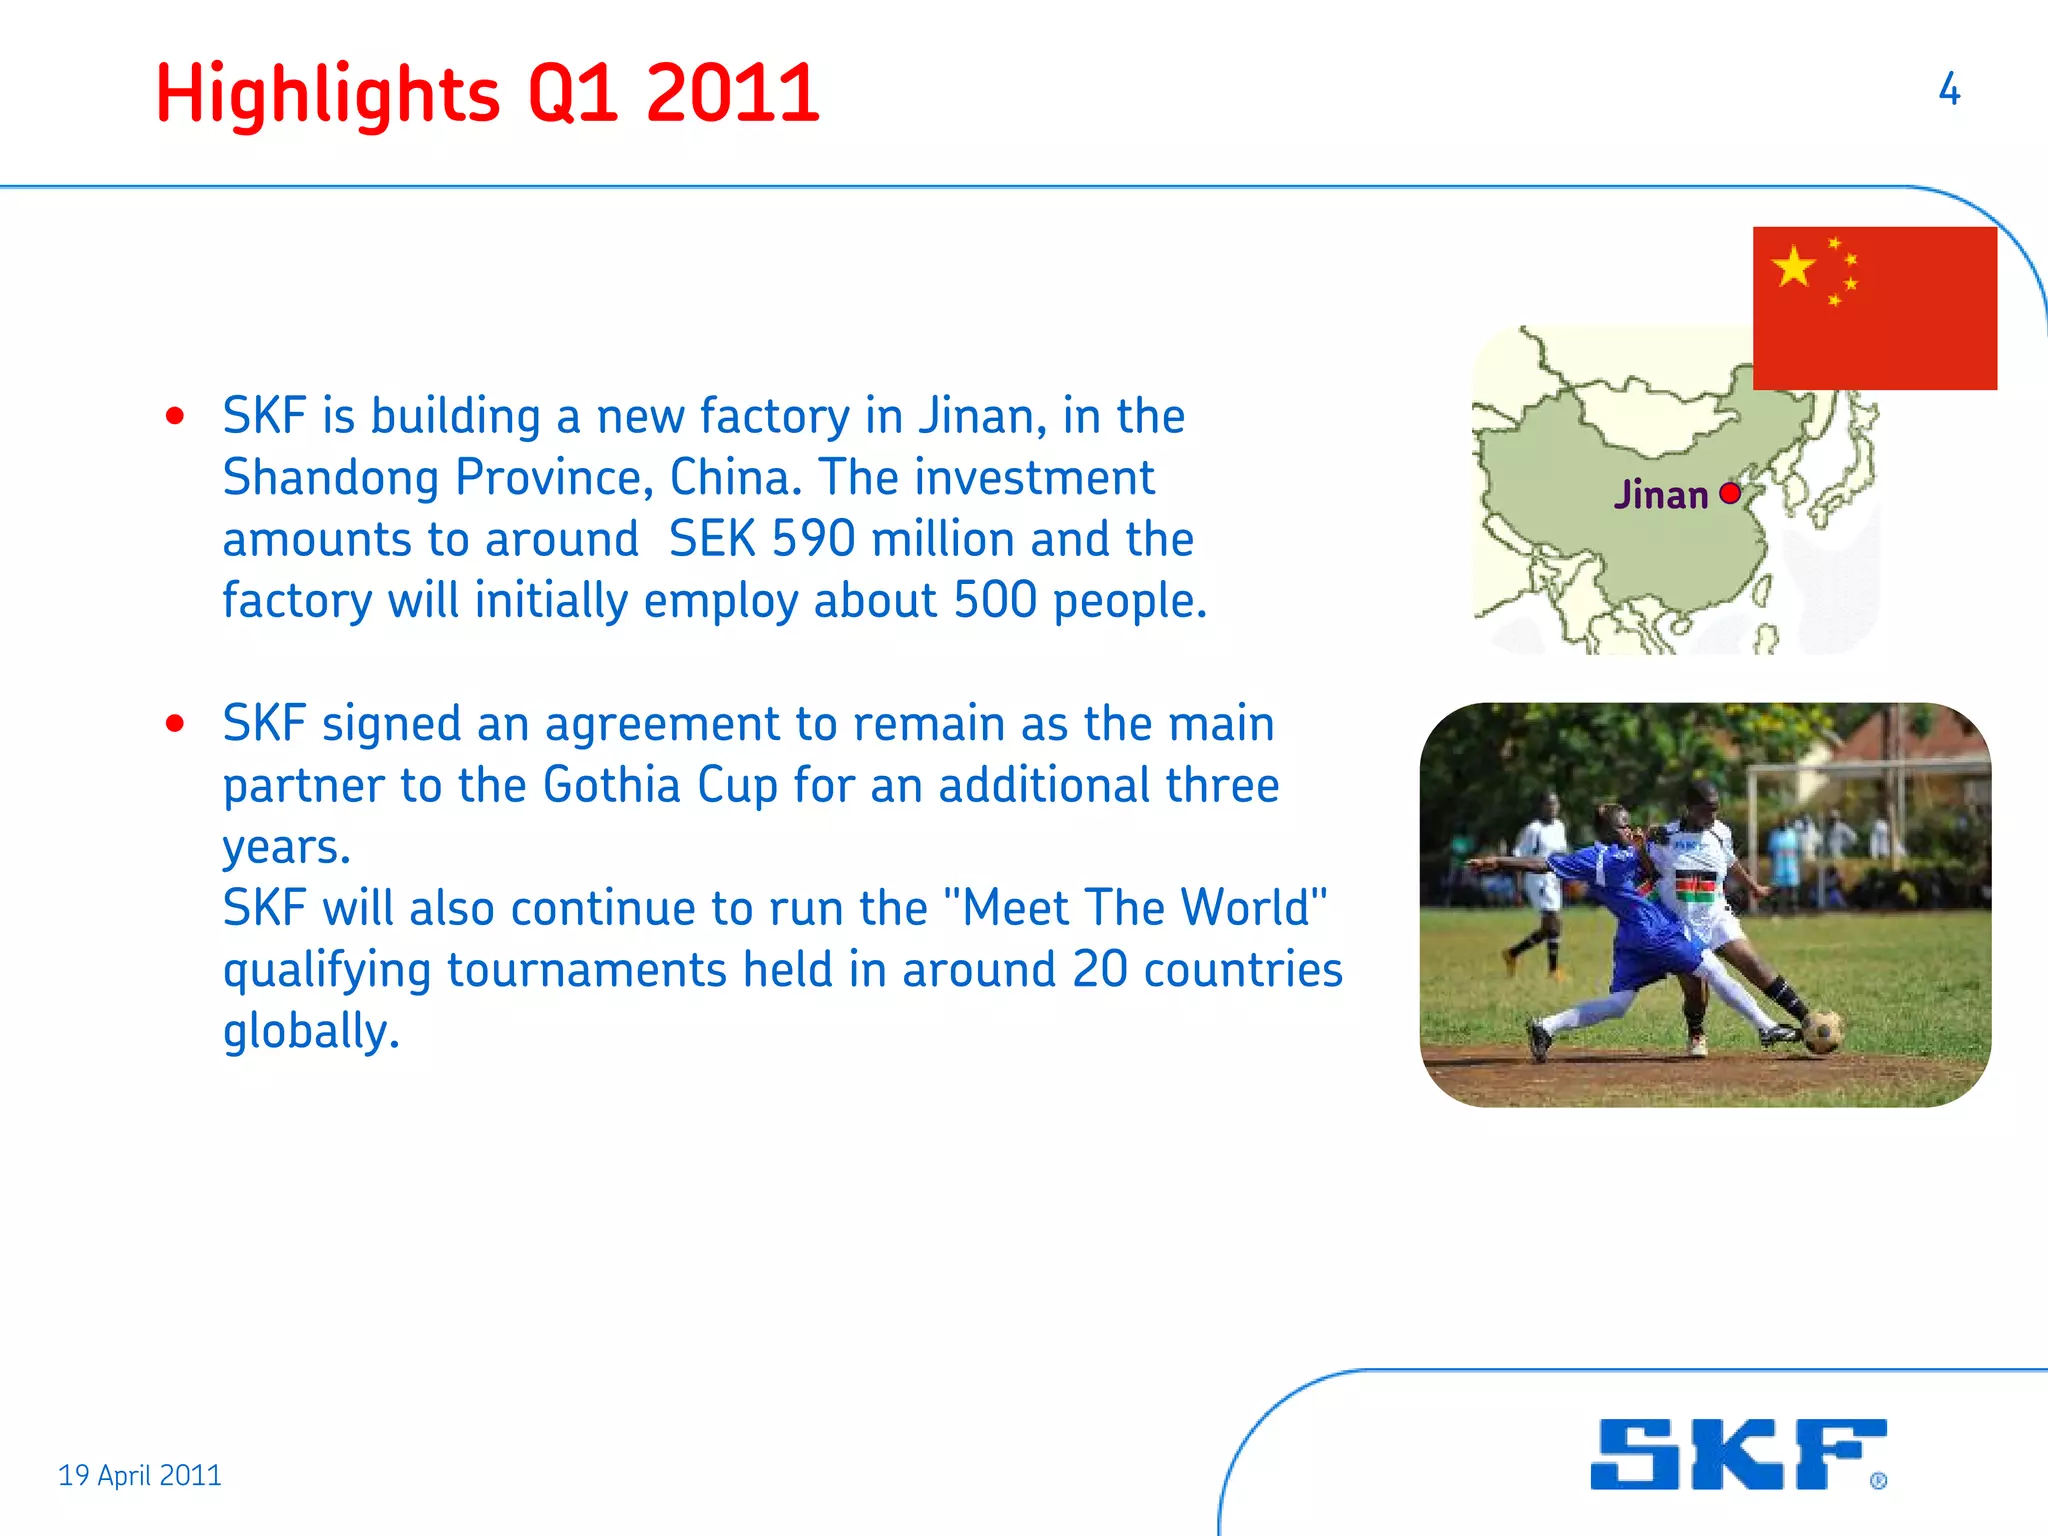
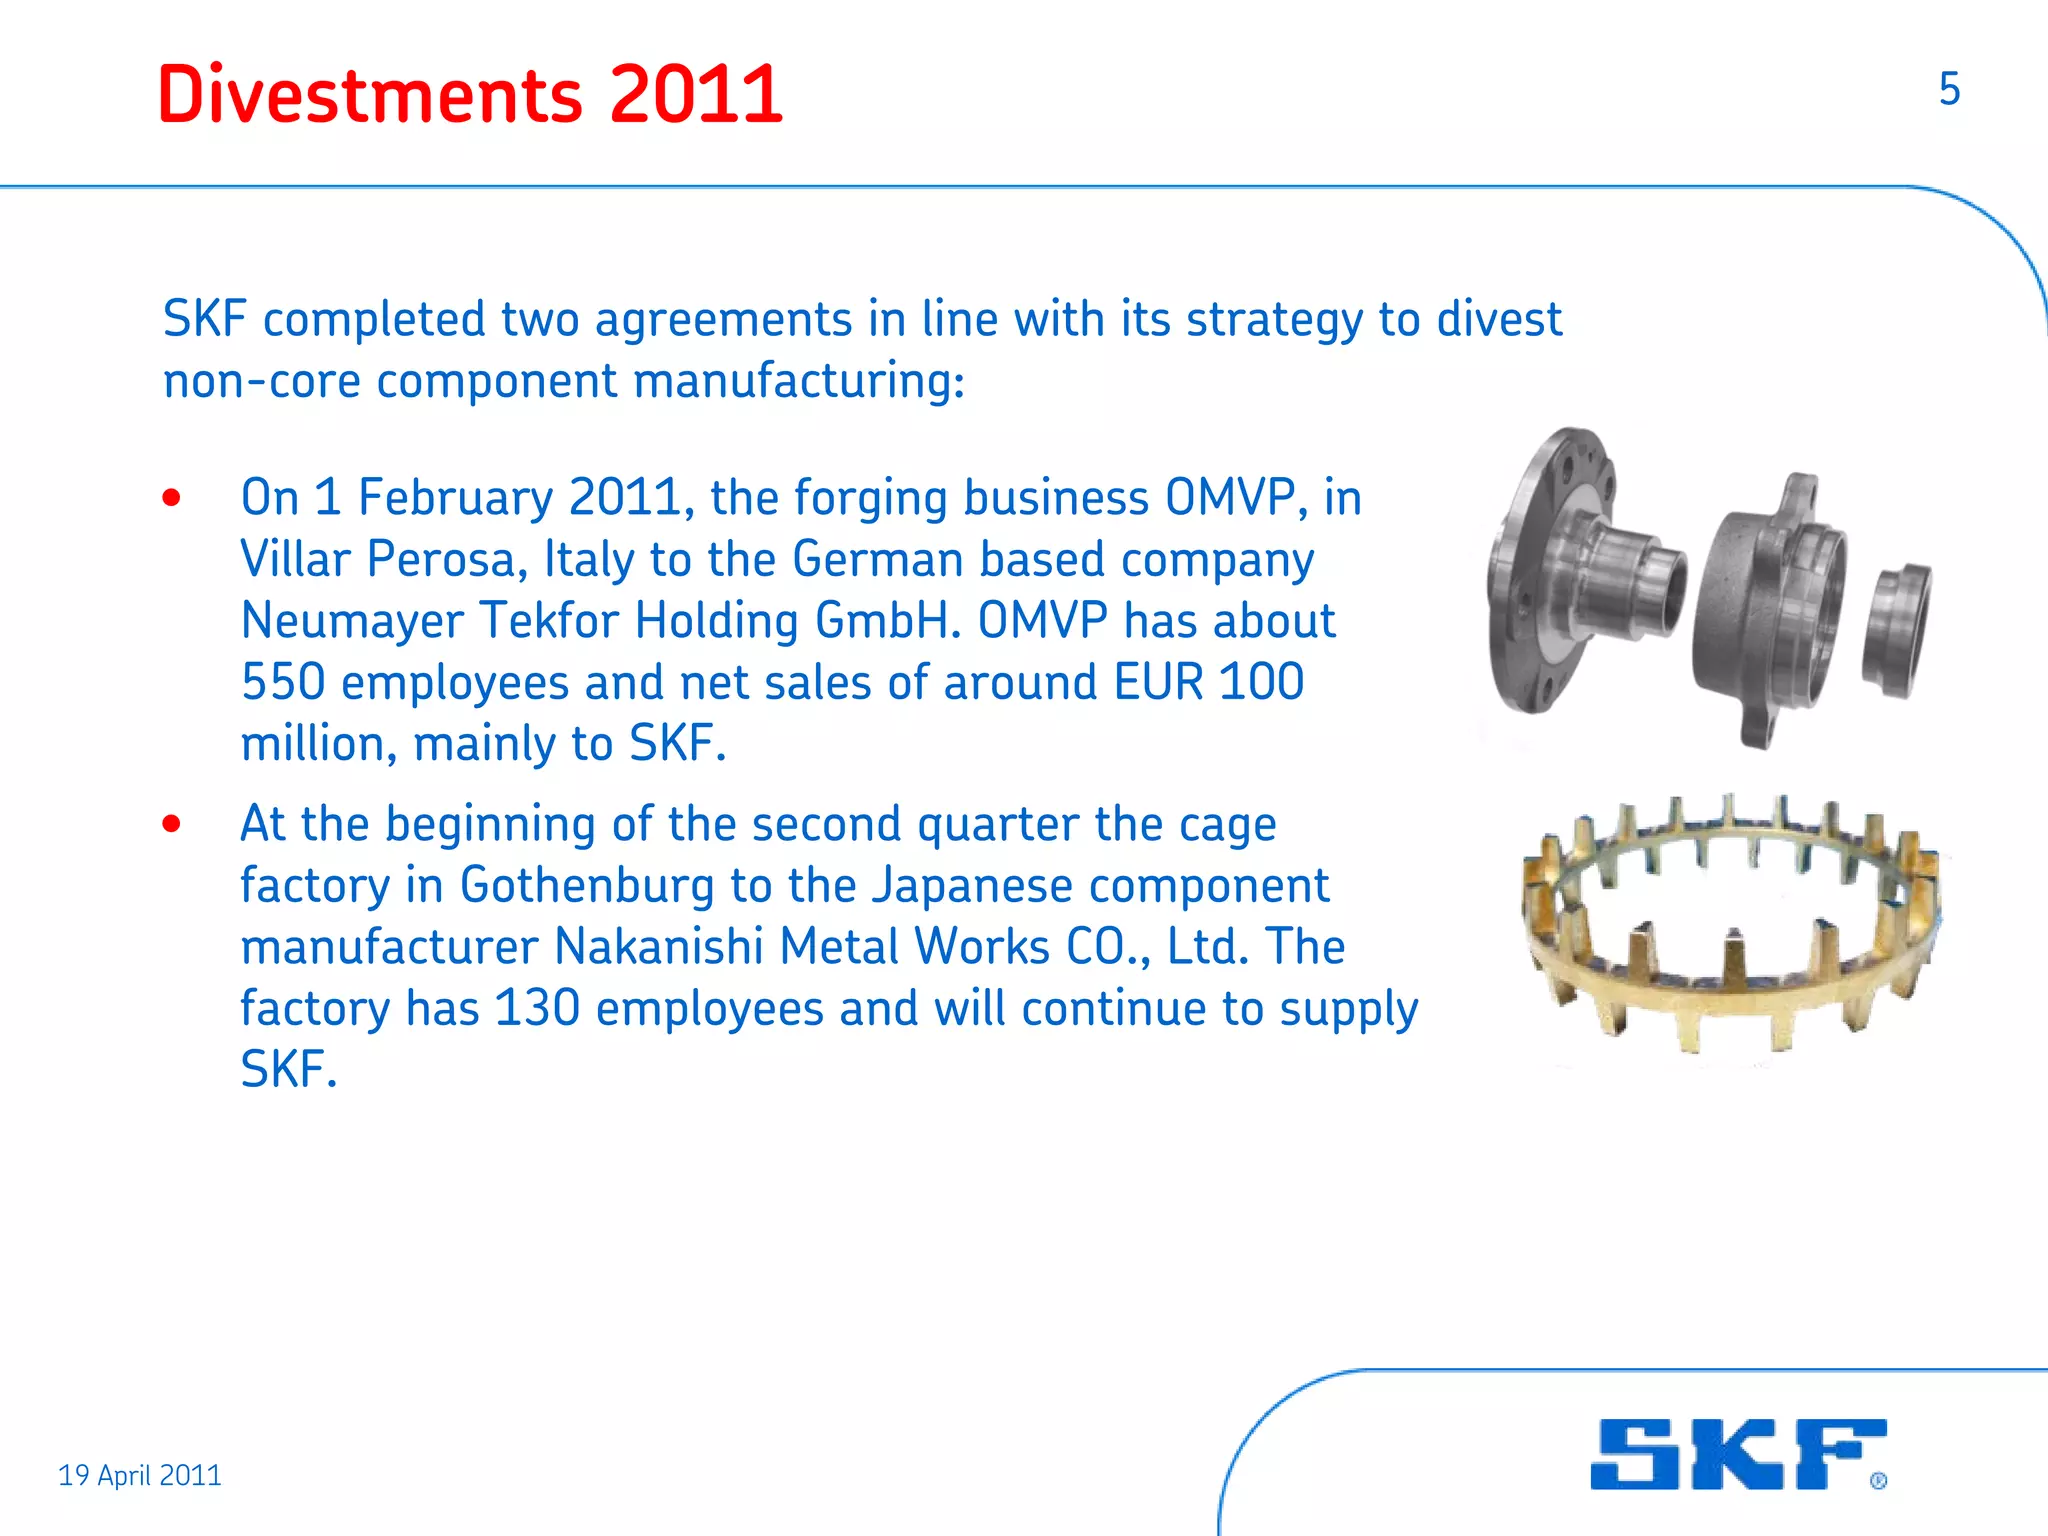
- SKF divested two non-core manufacturing businesses in line with its strategy and continues investing in new factories and partnerships.