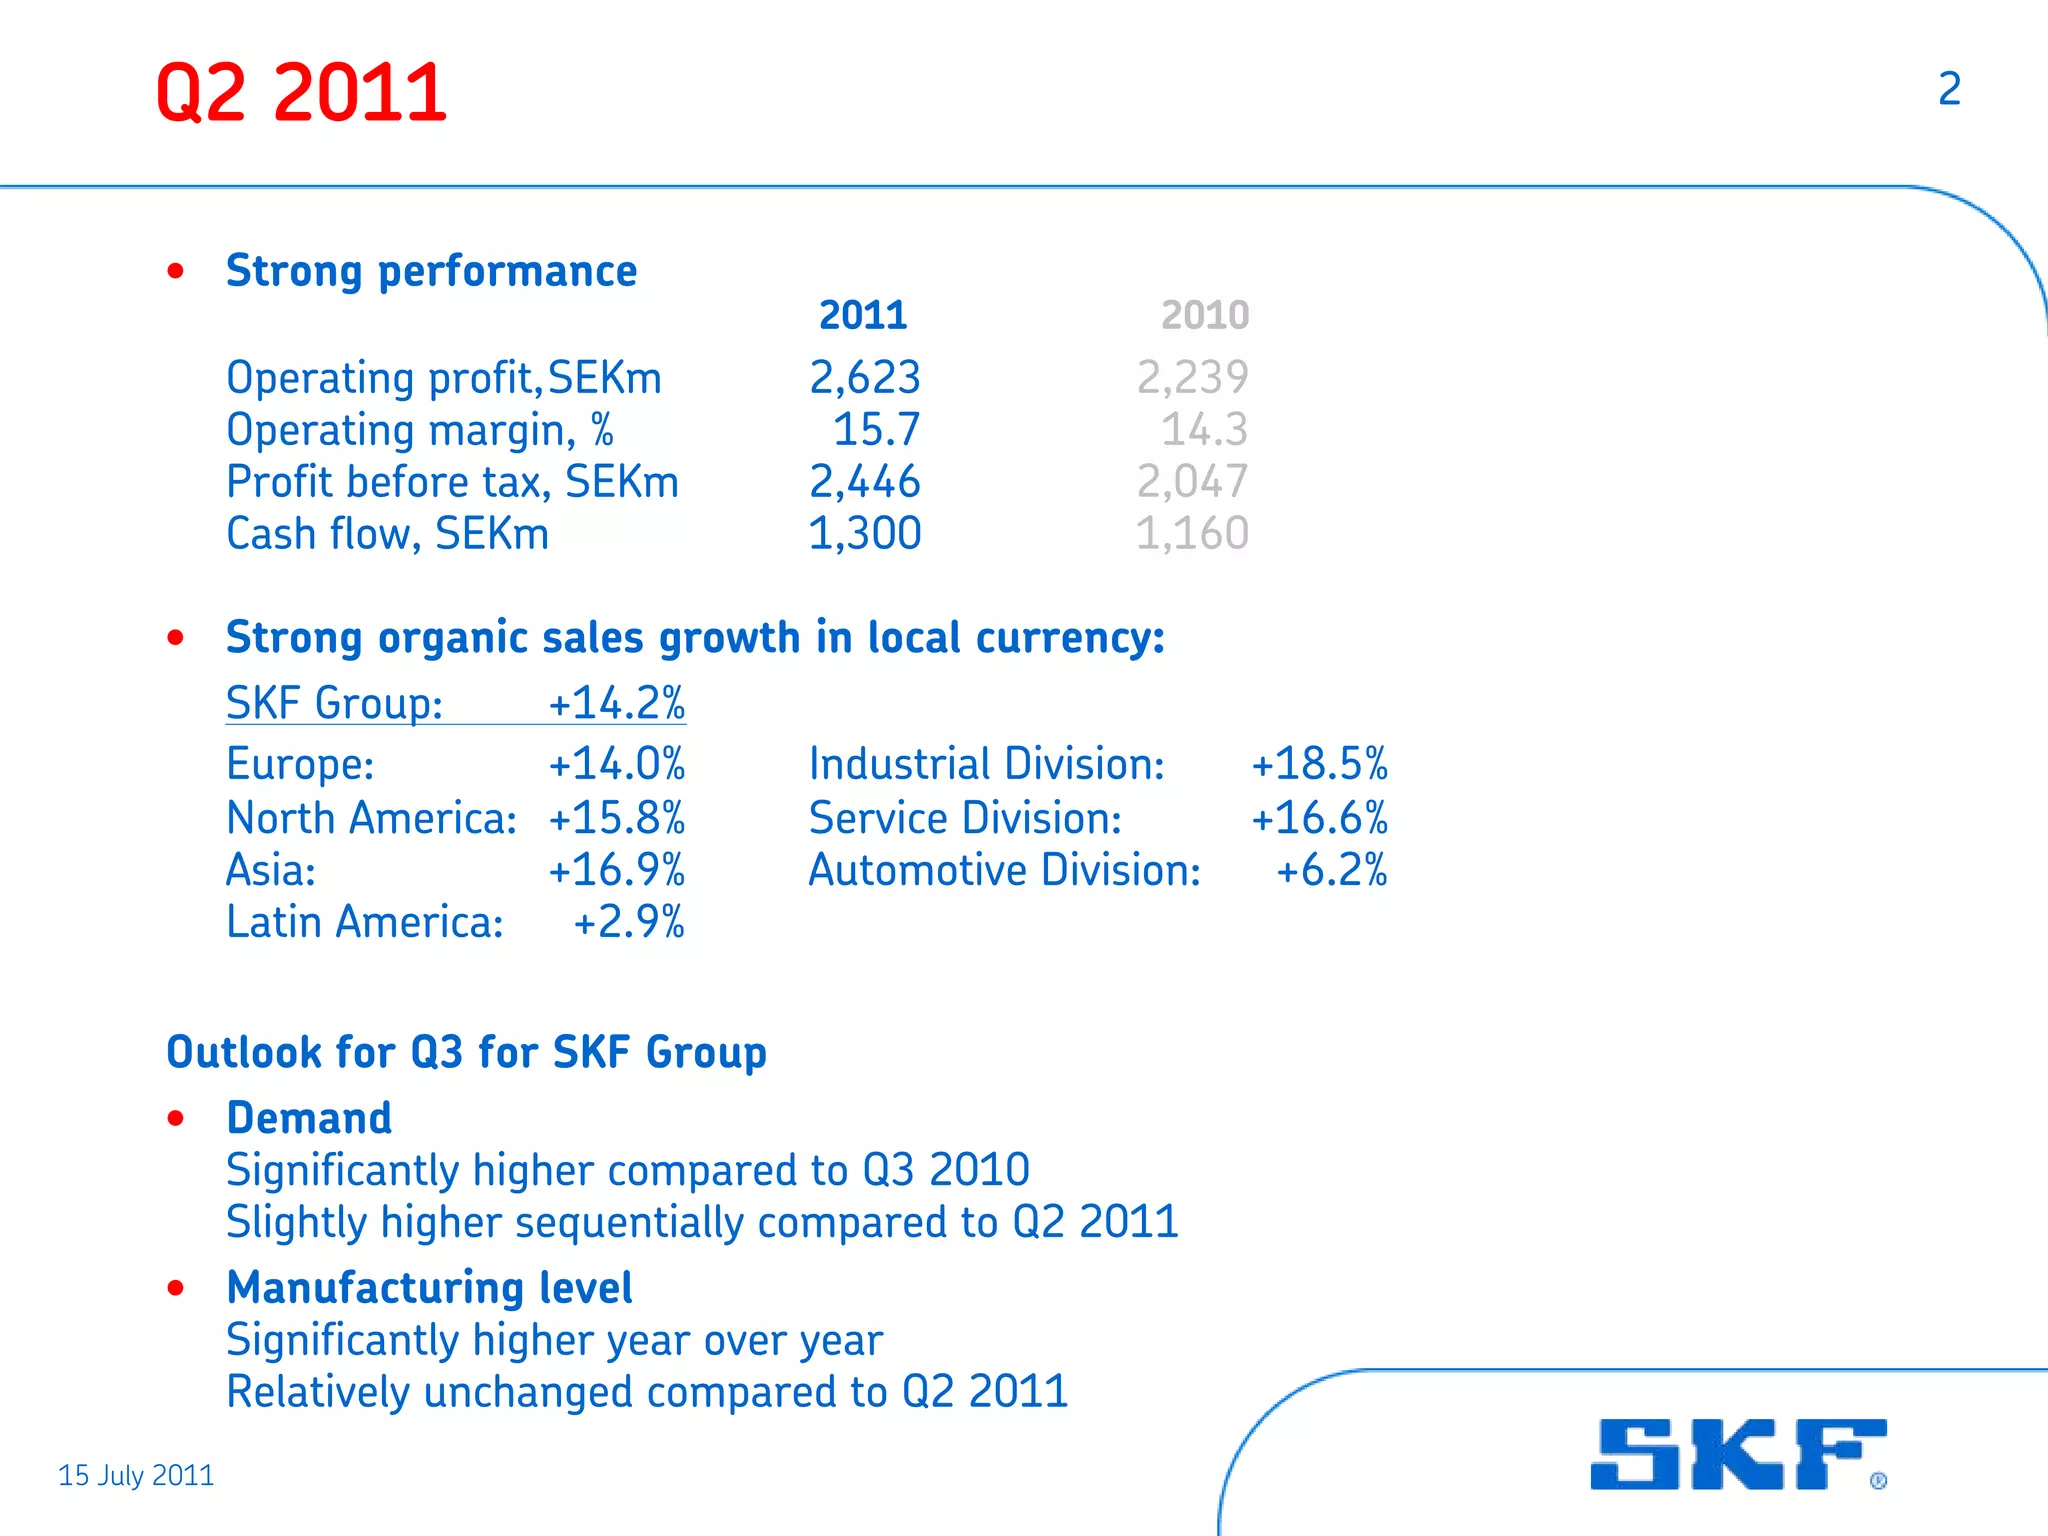
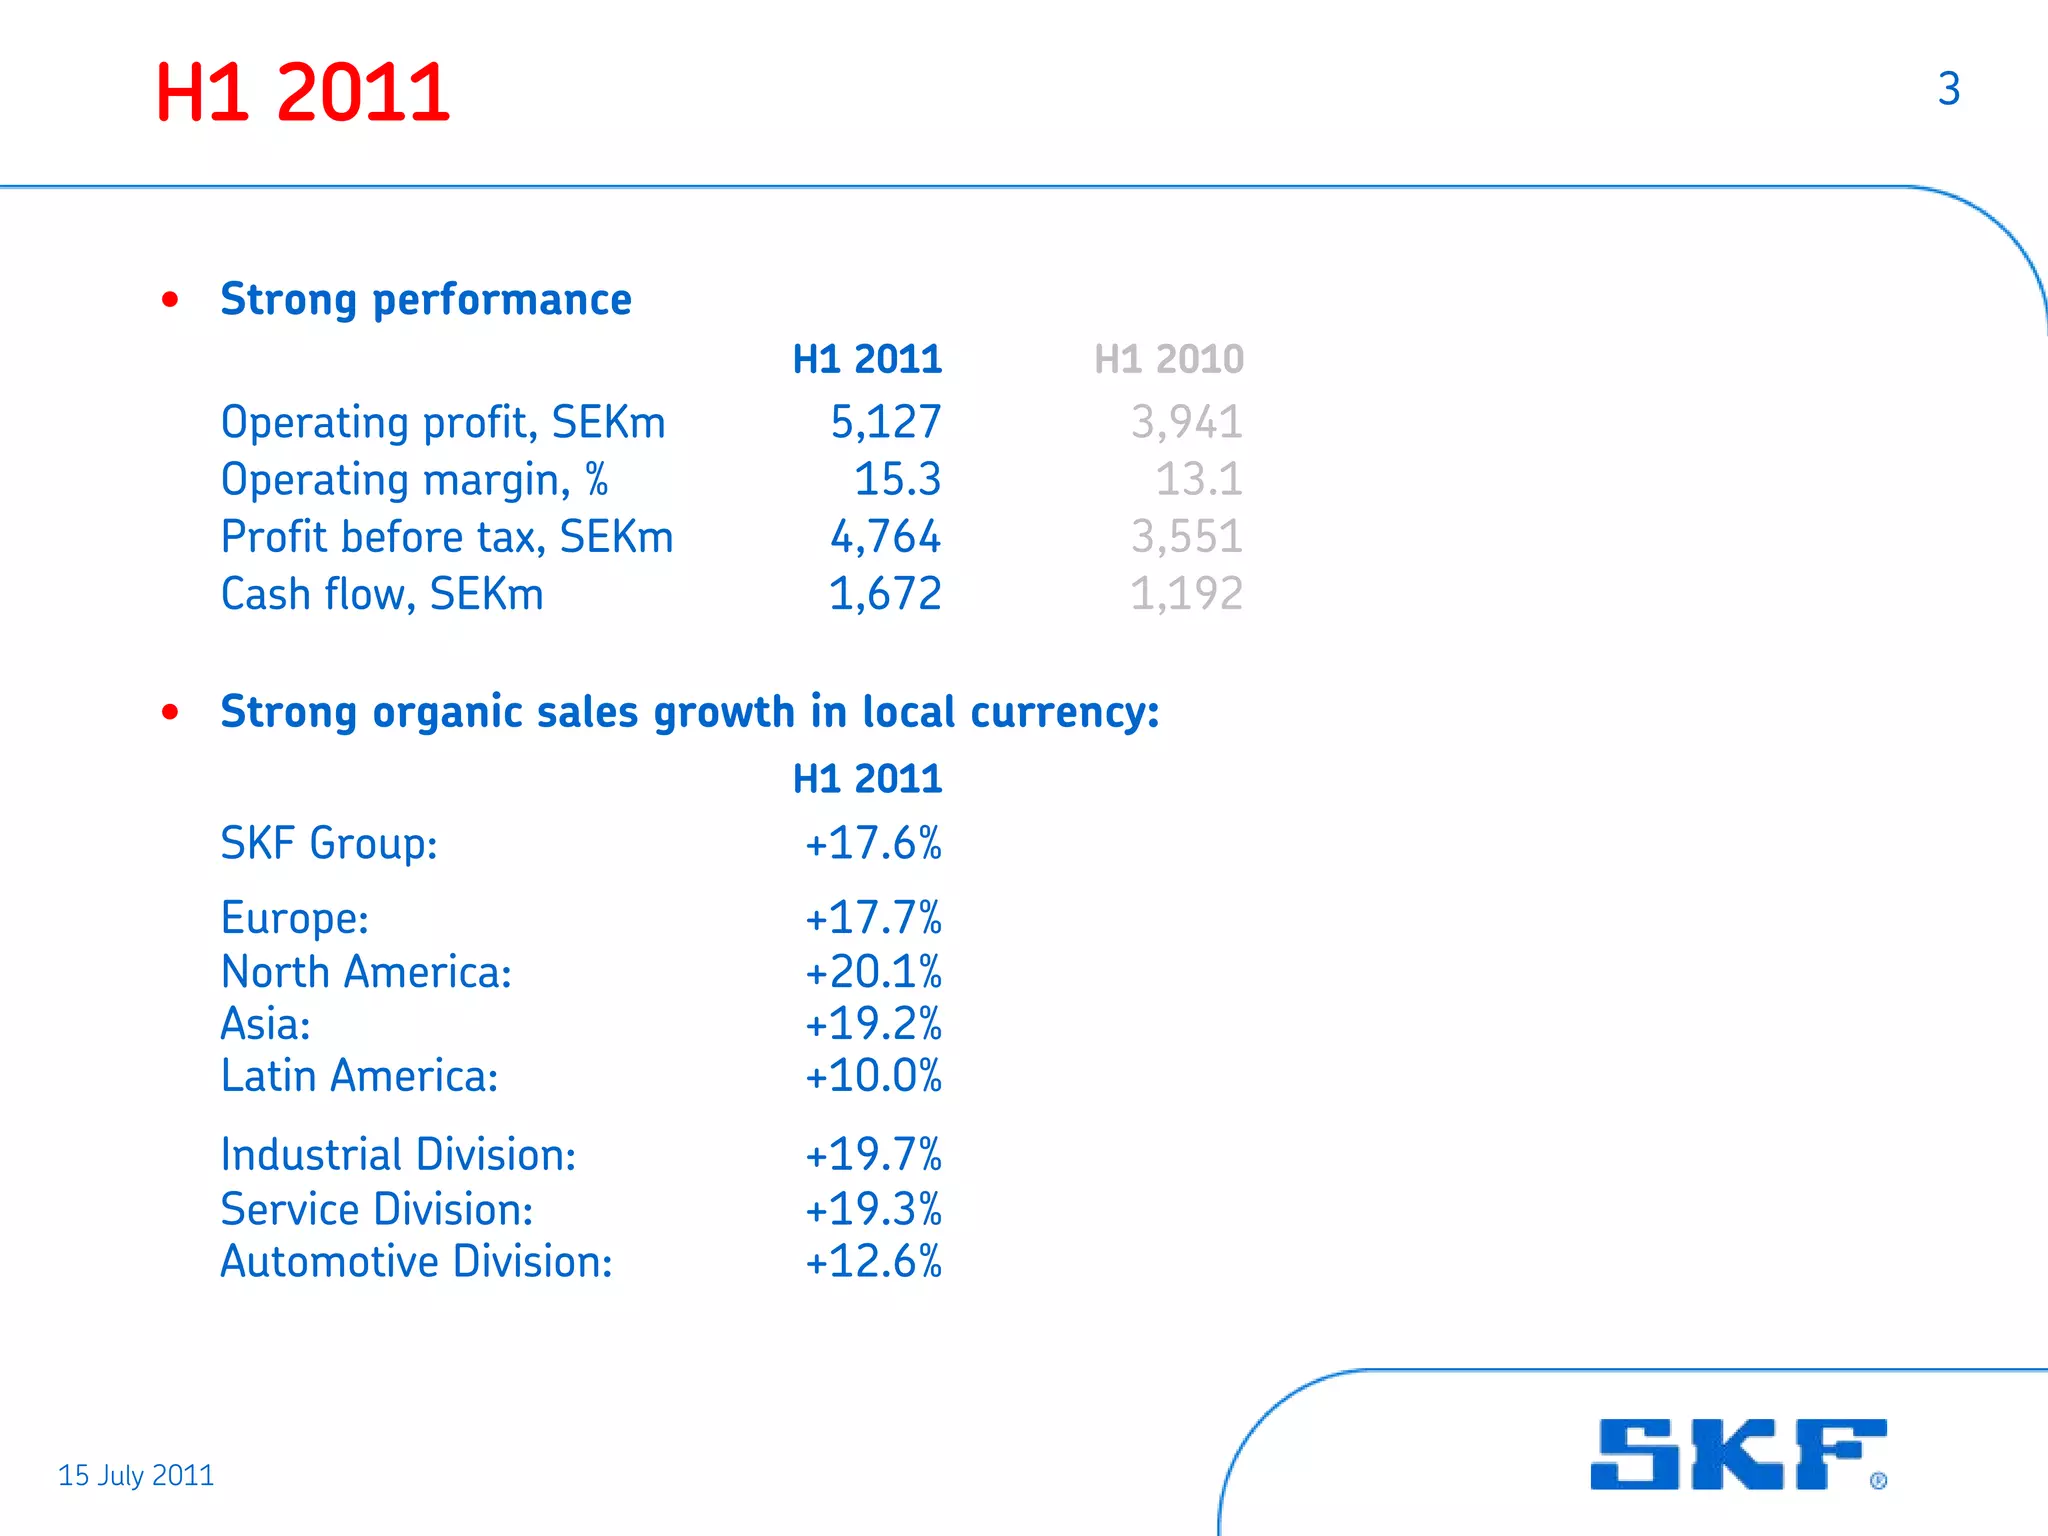
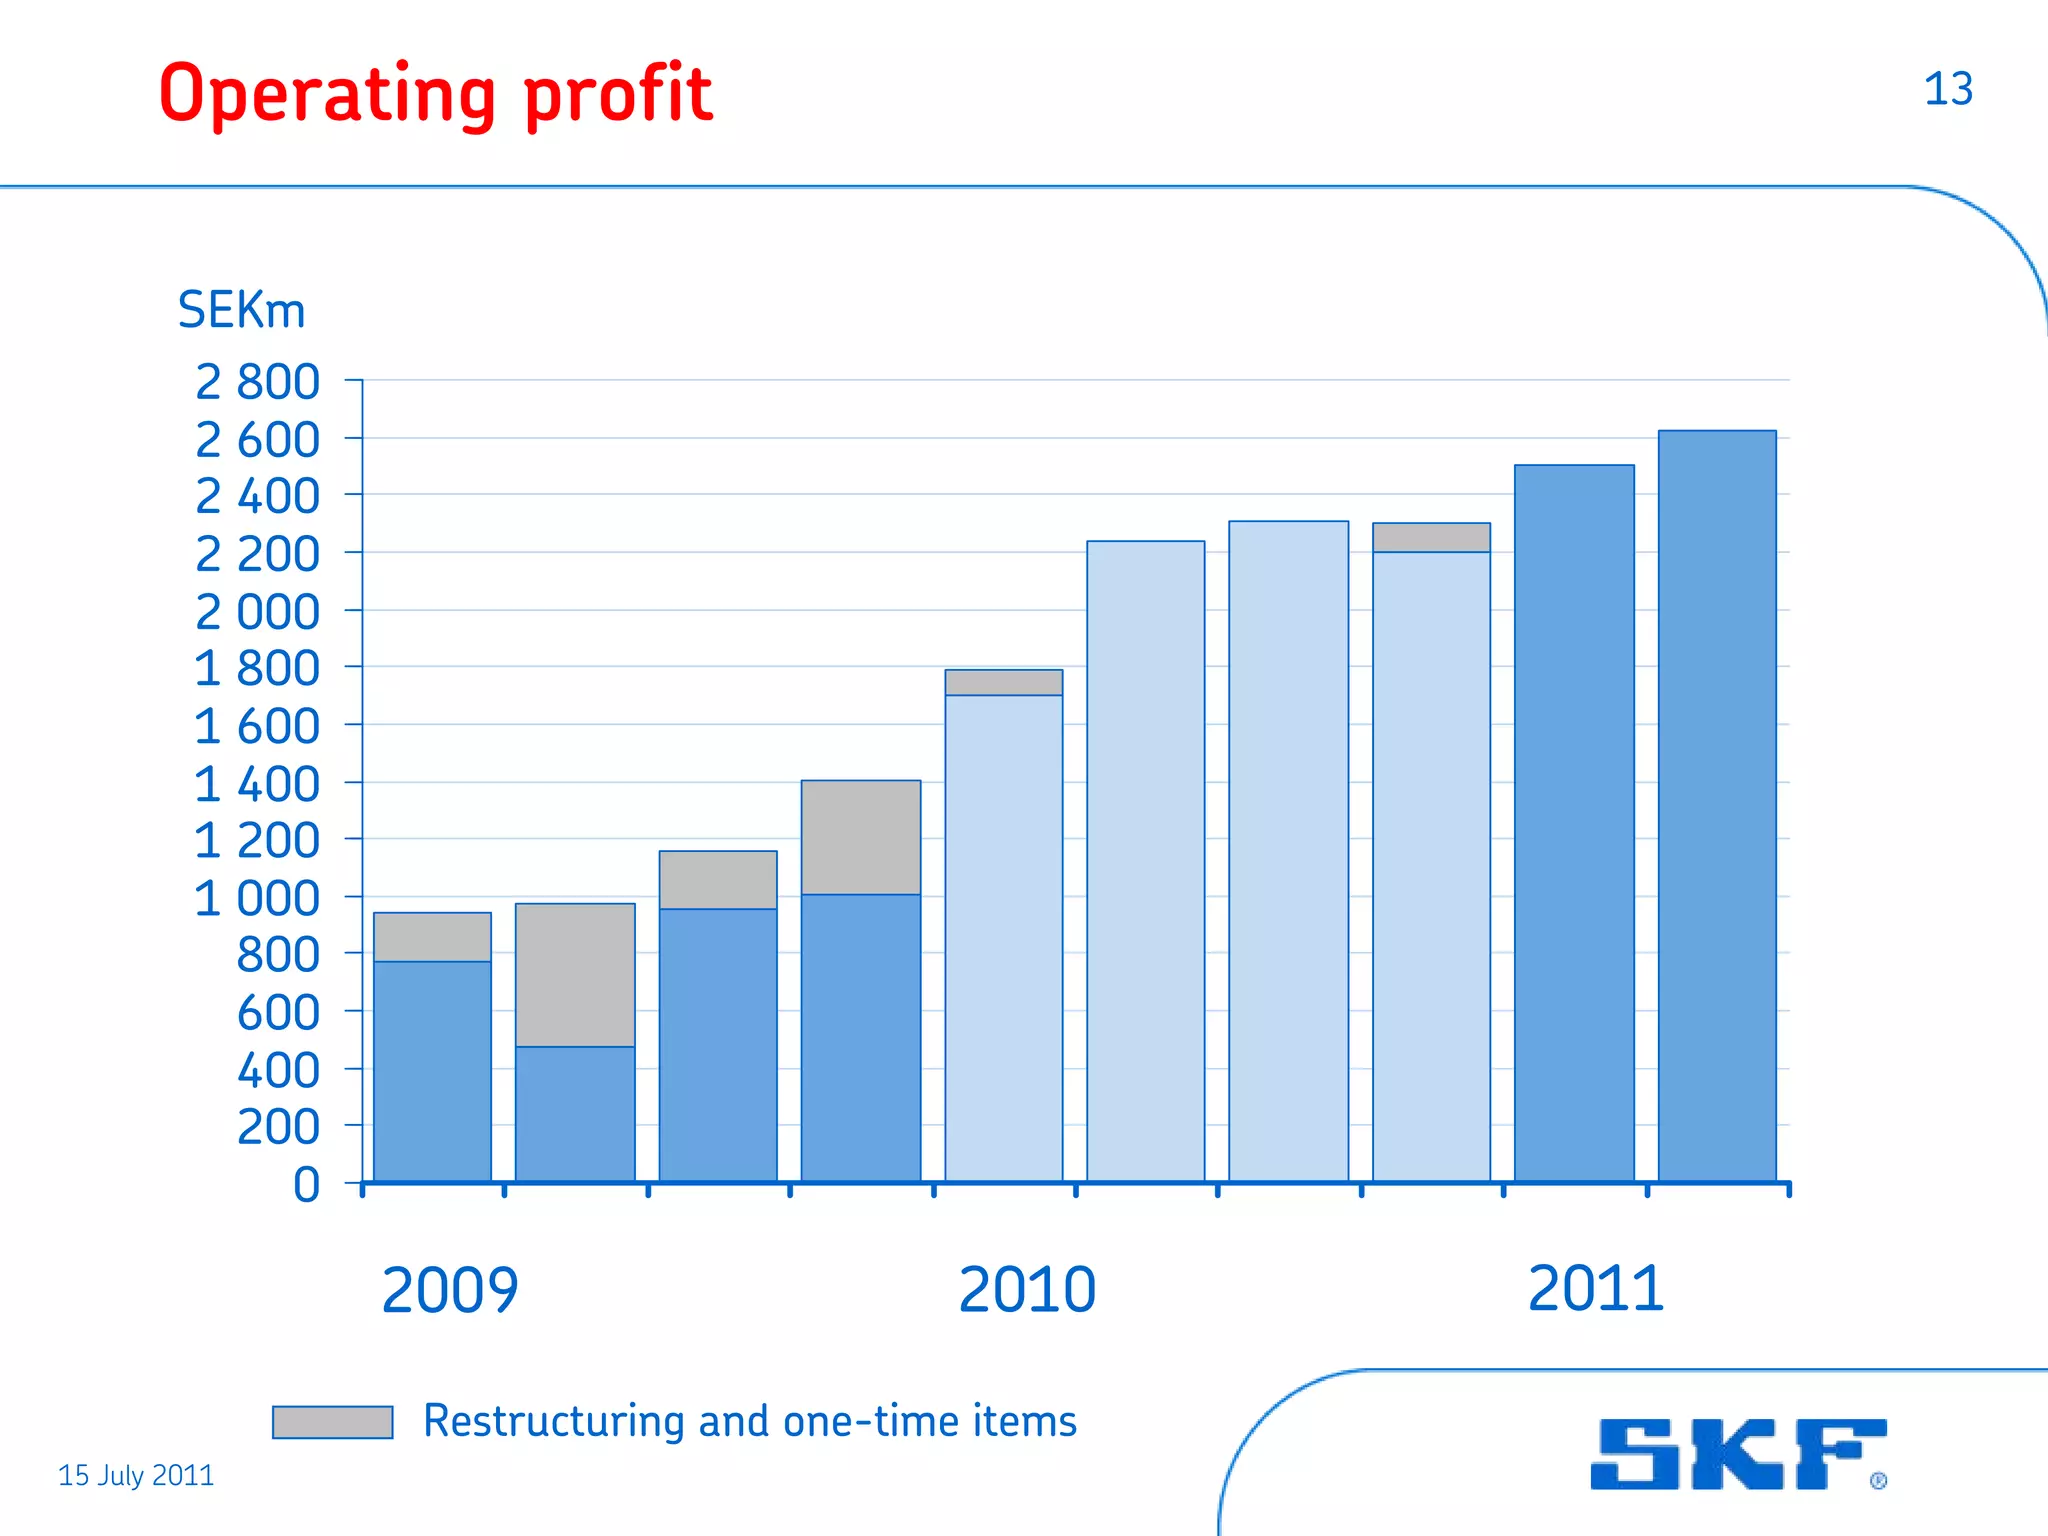
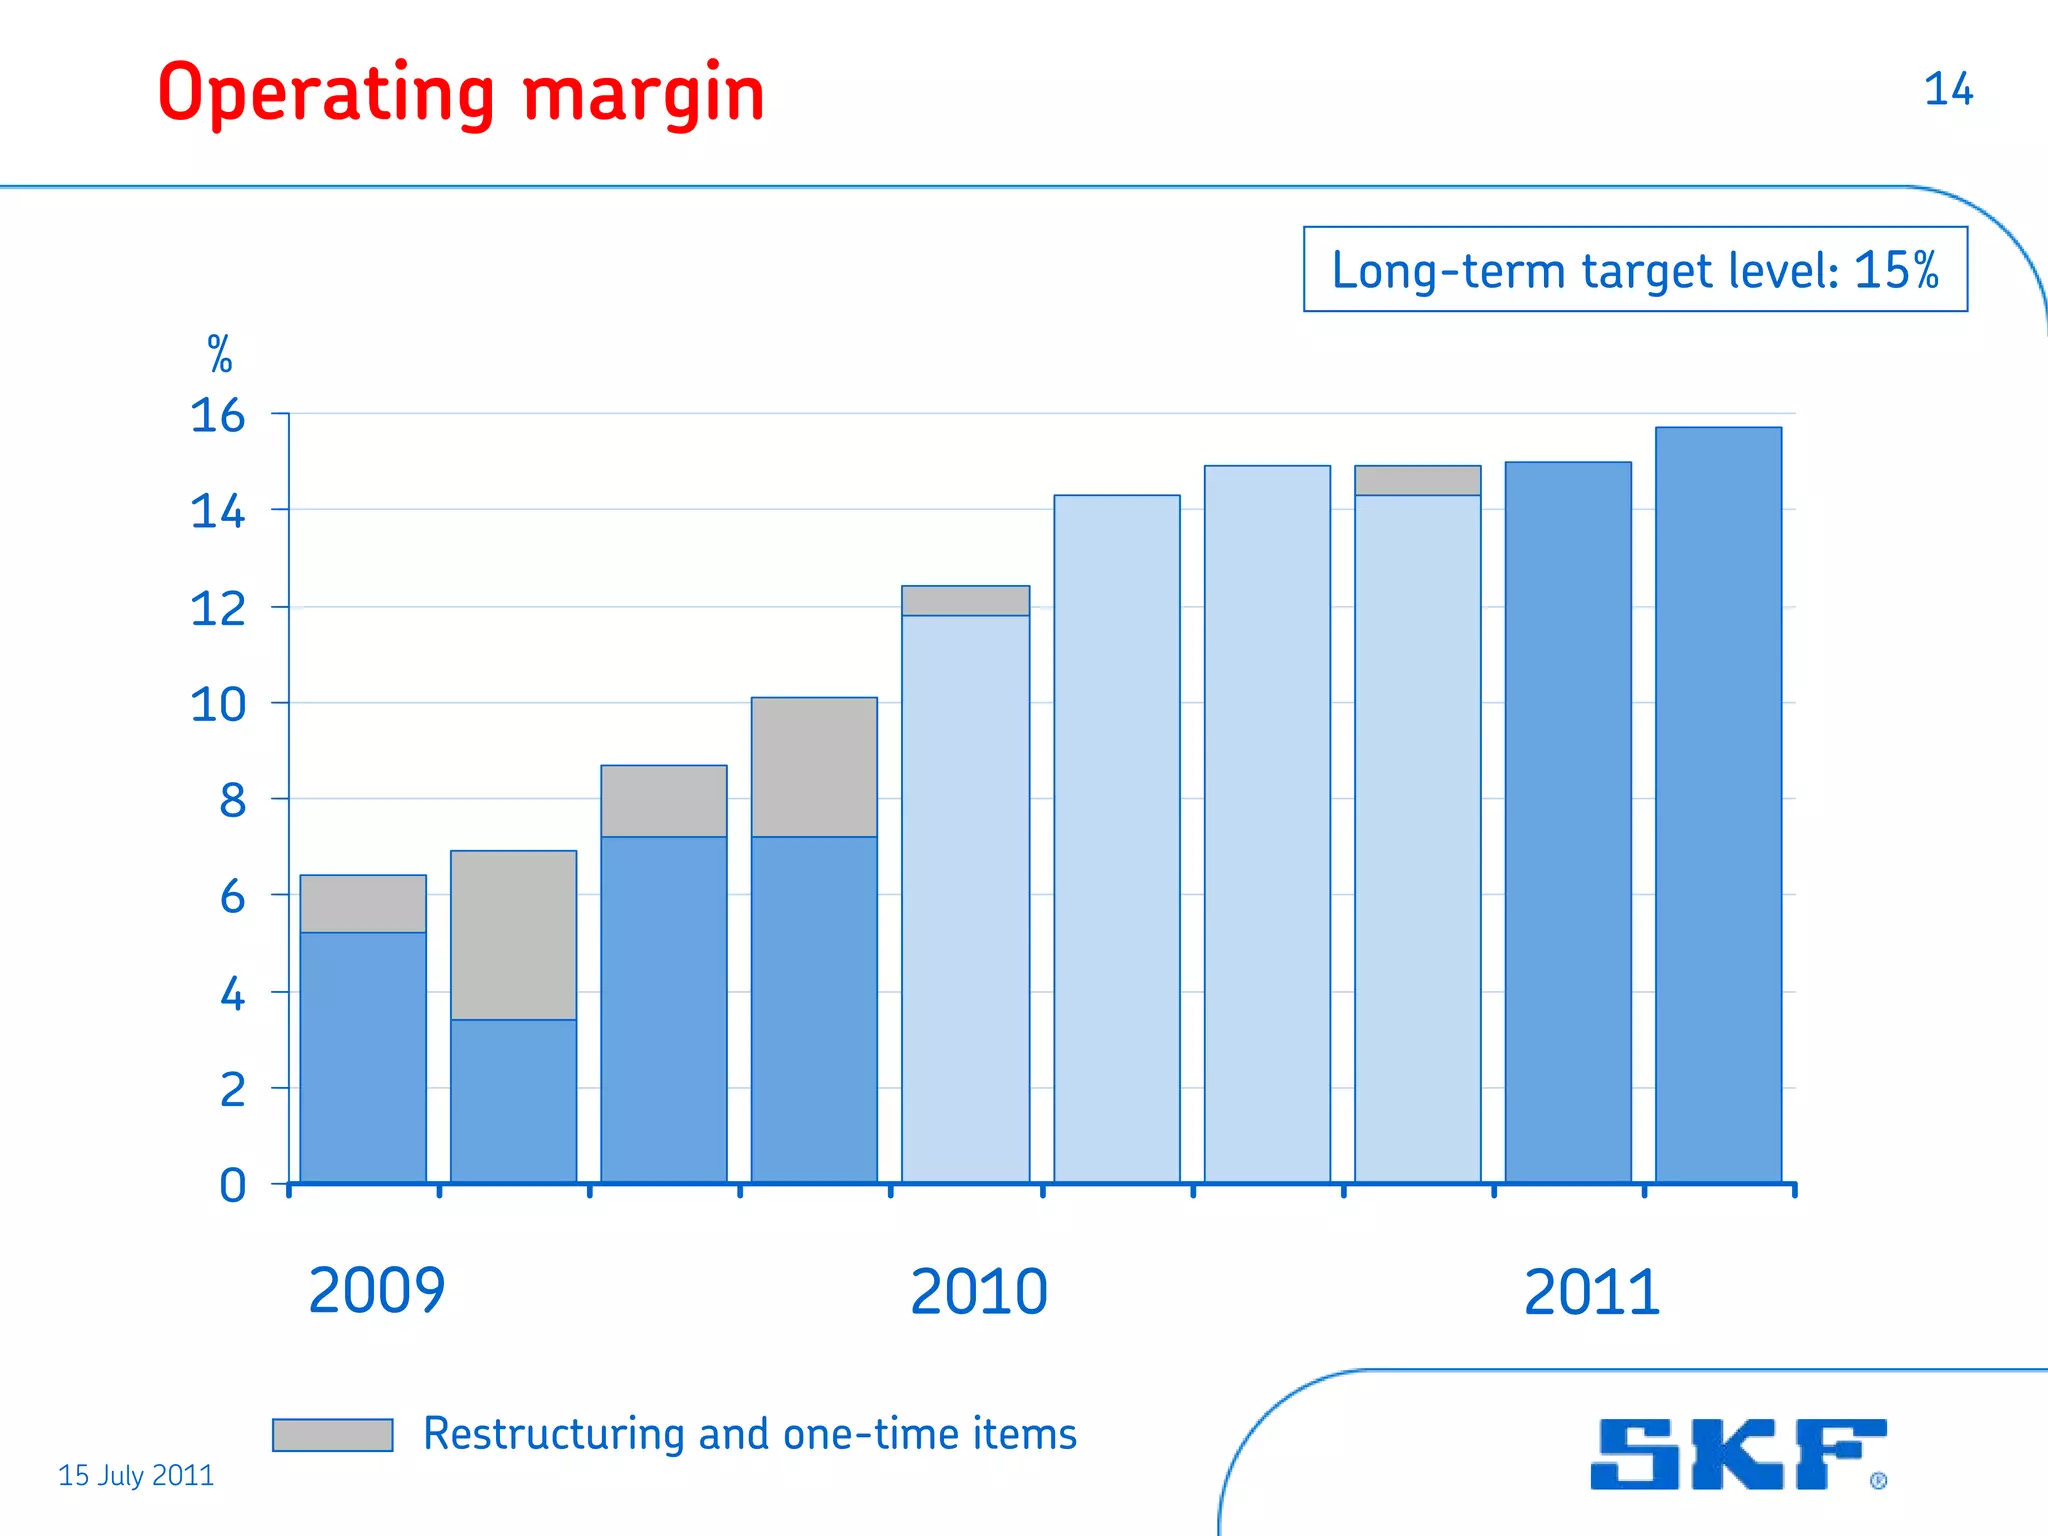
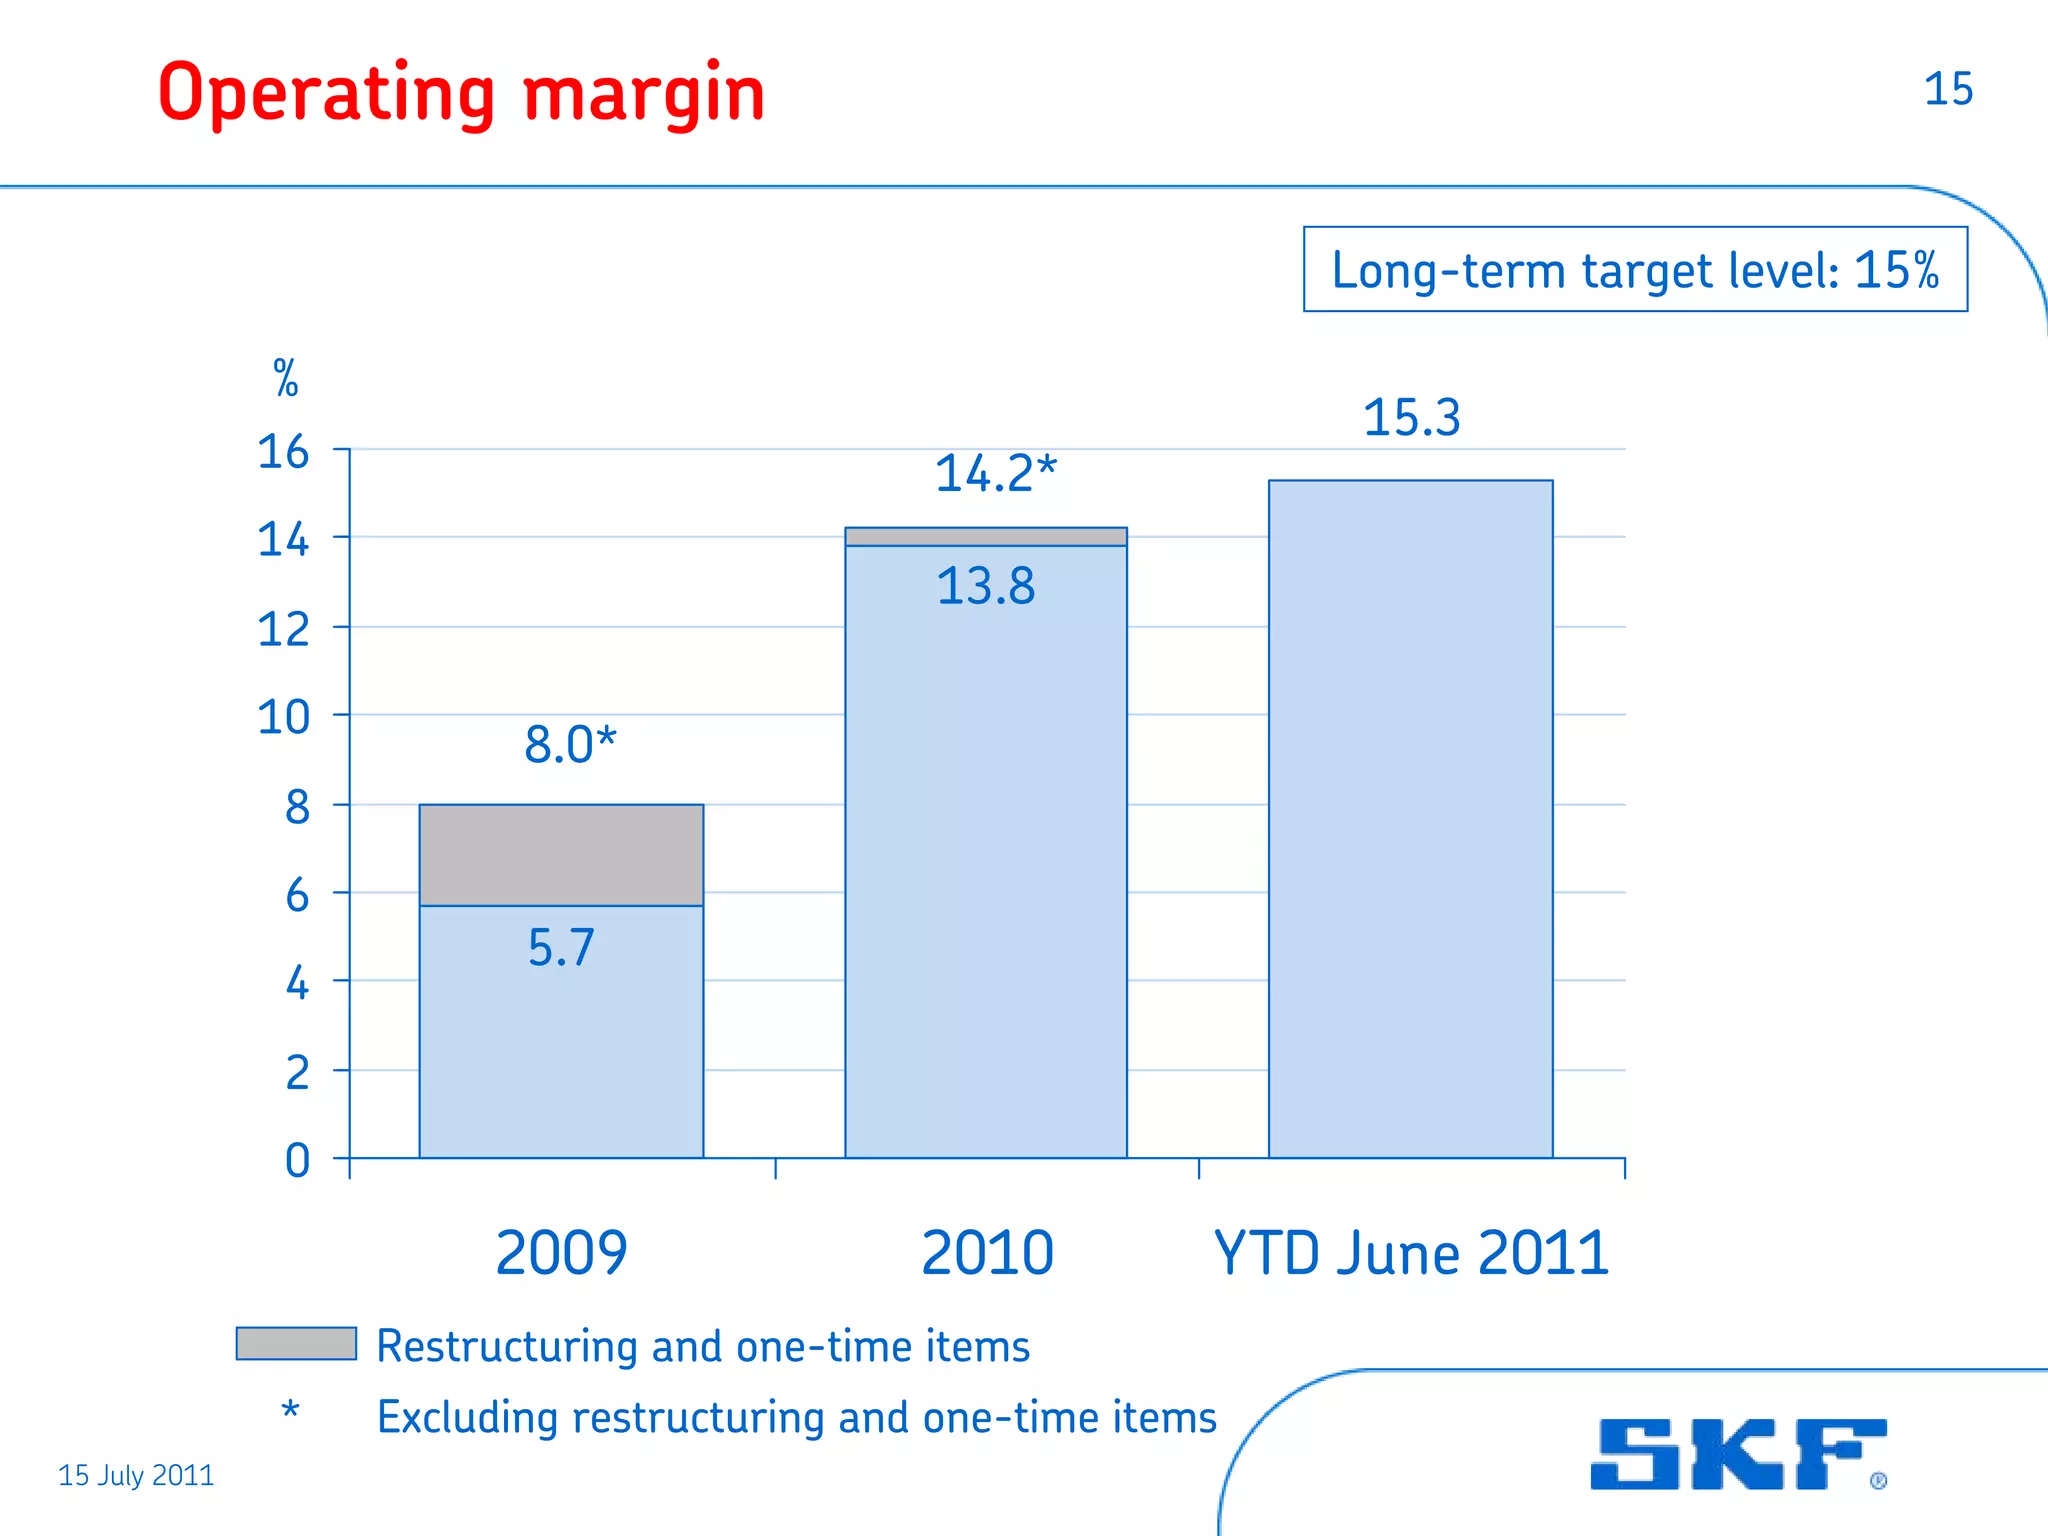
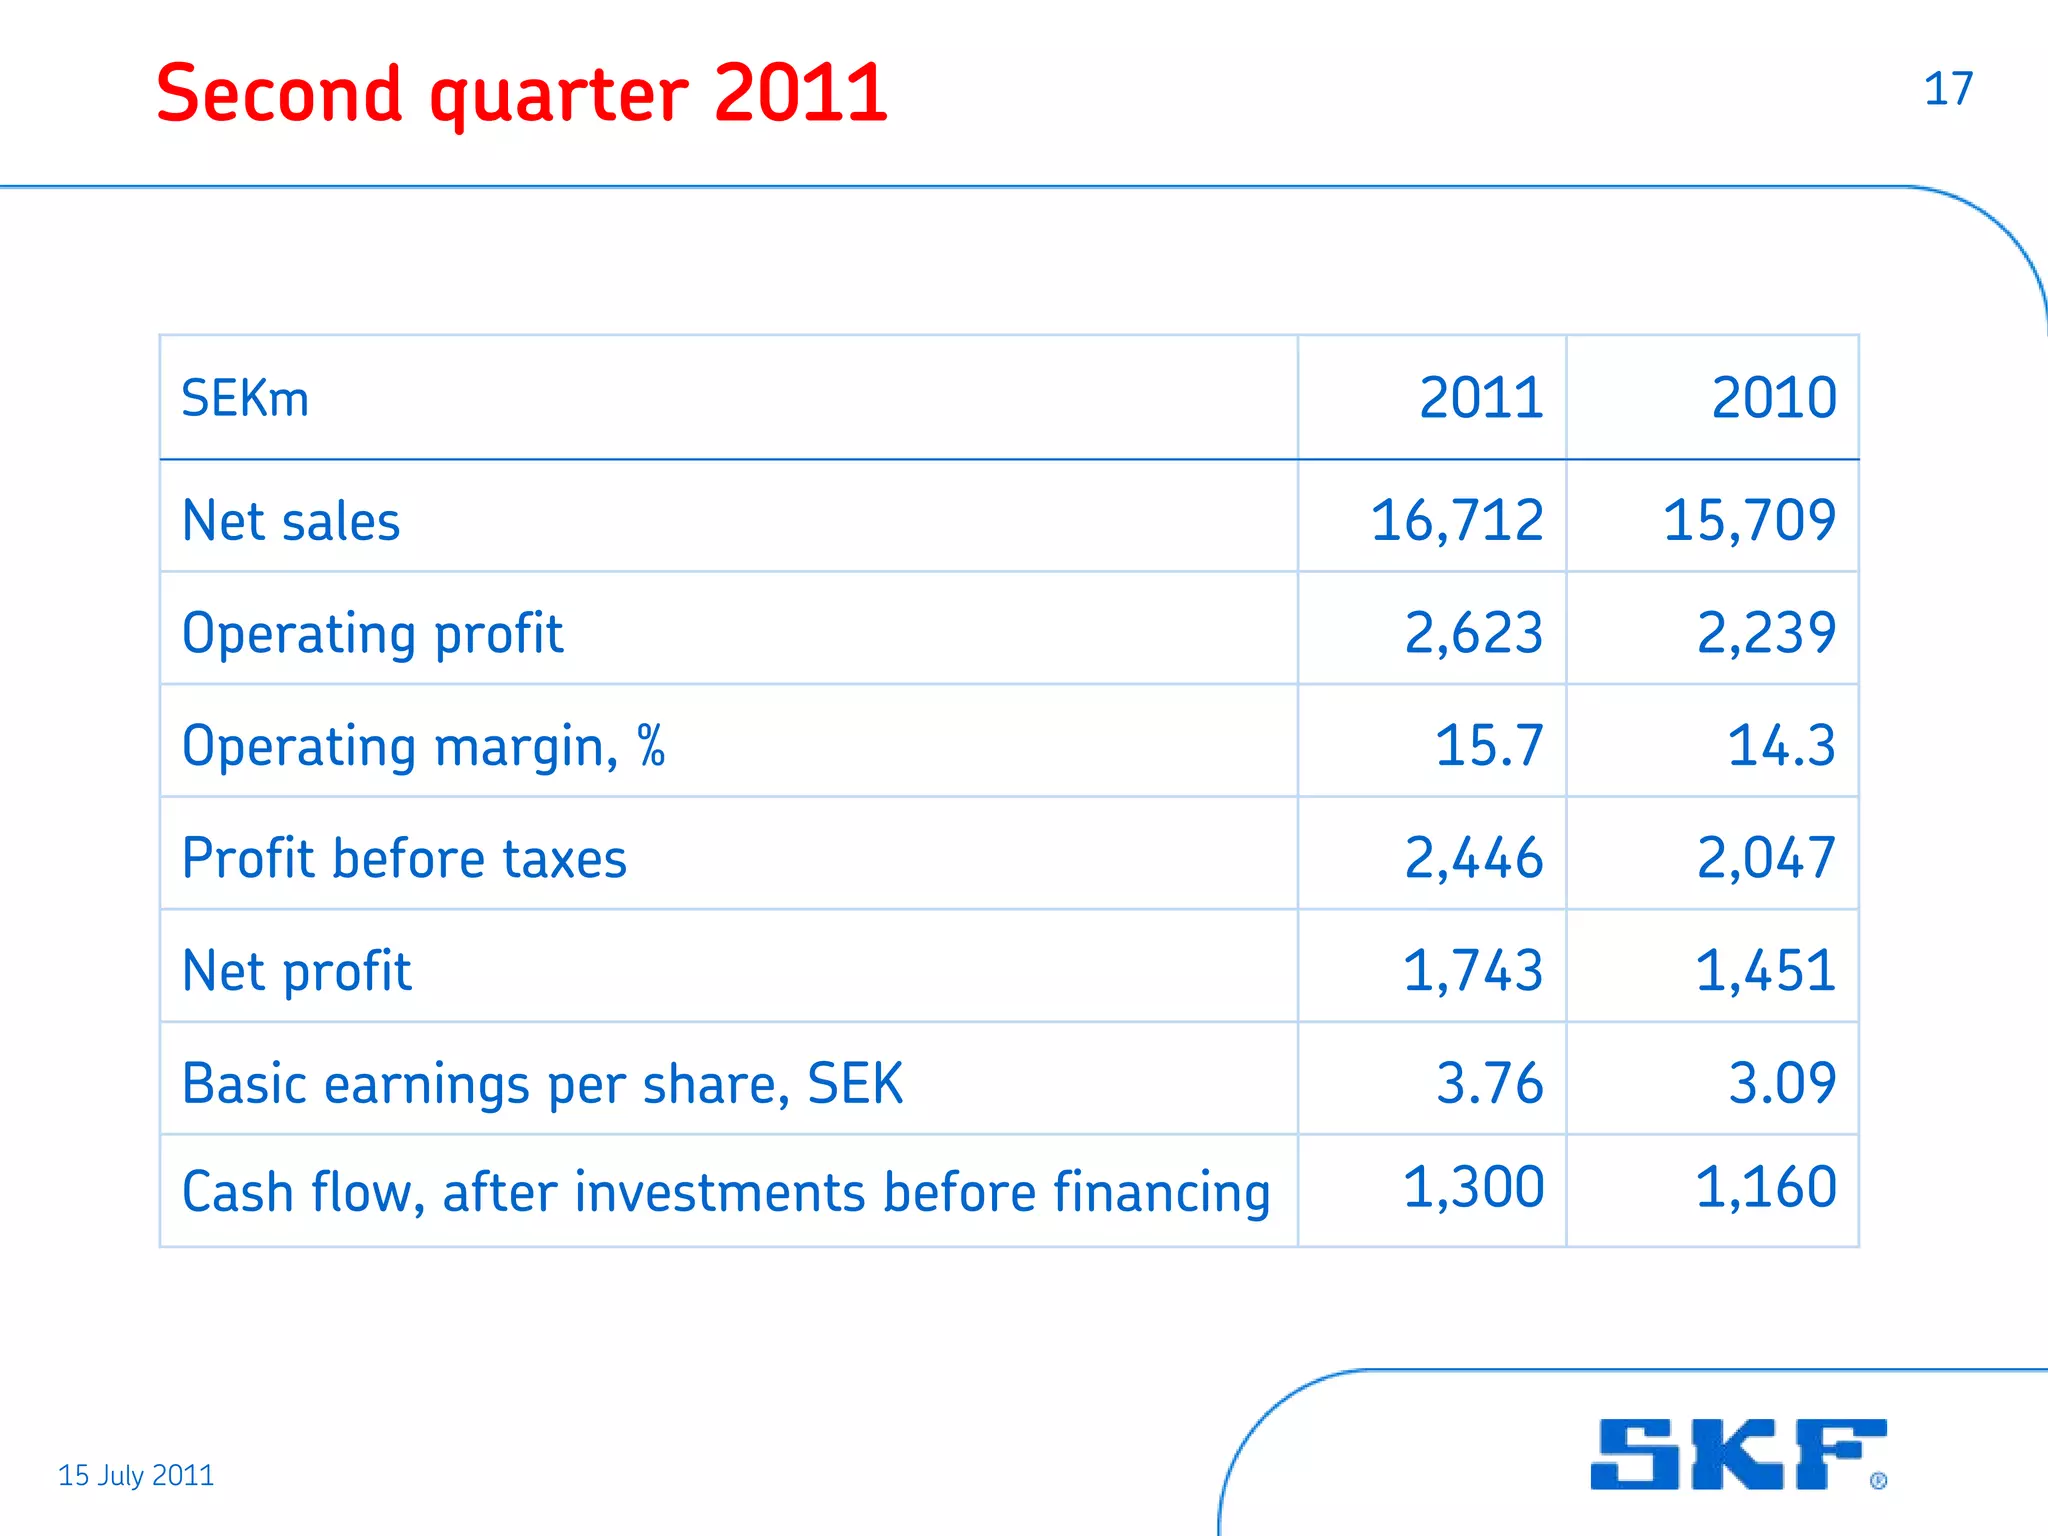
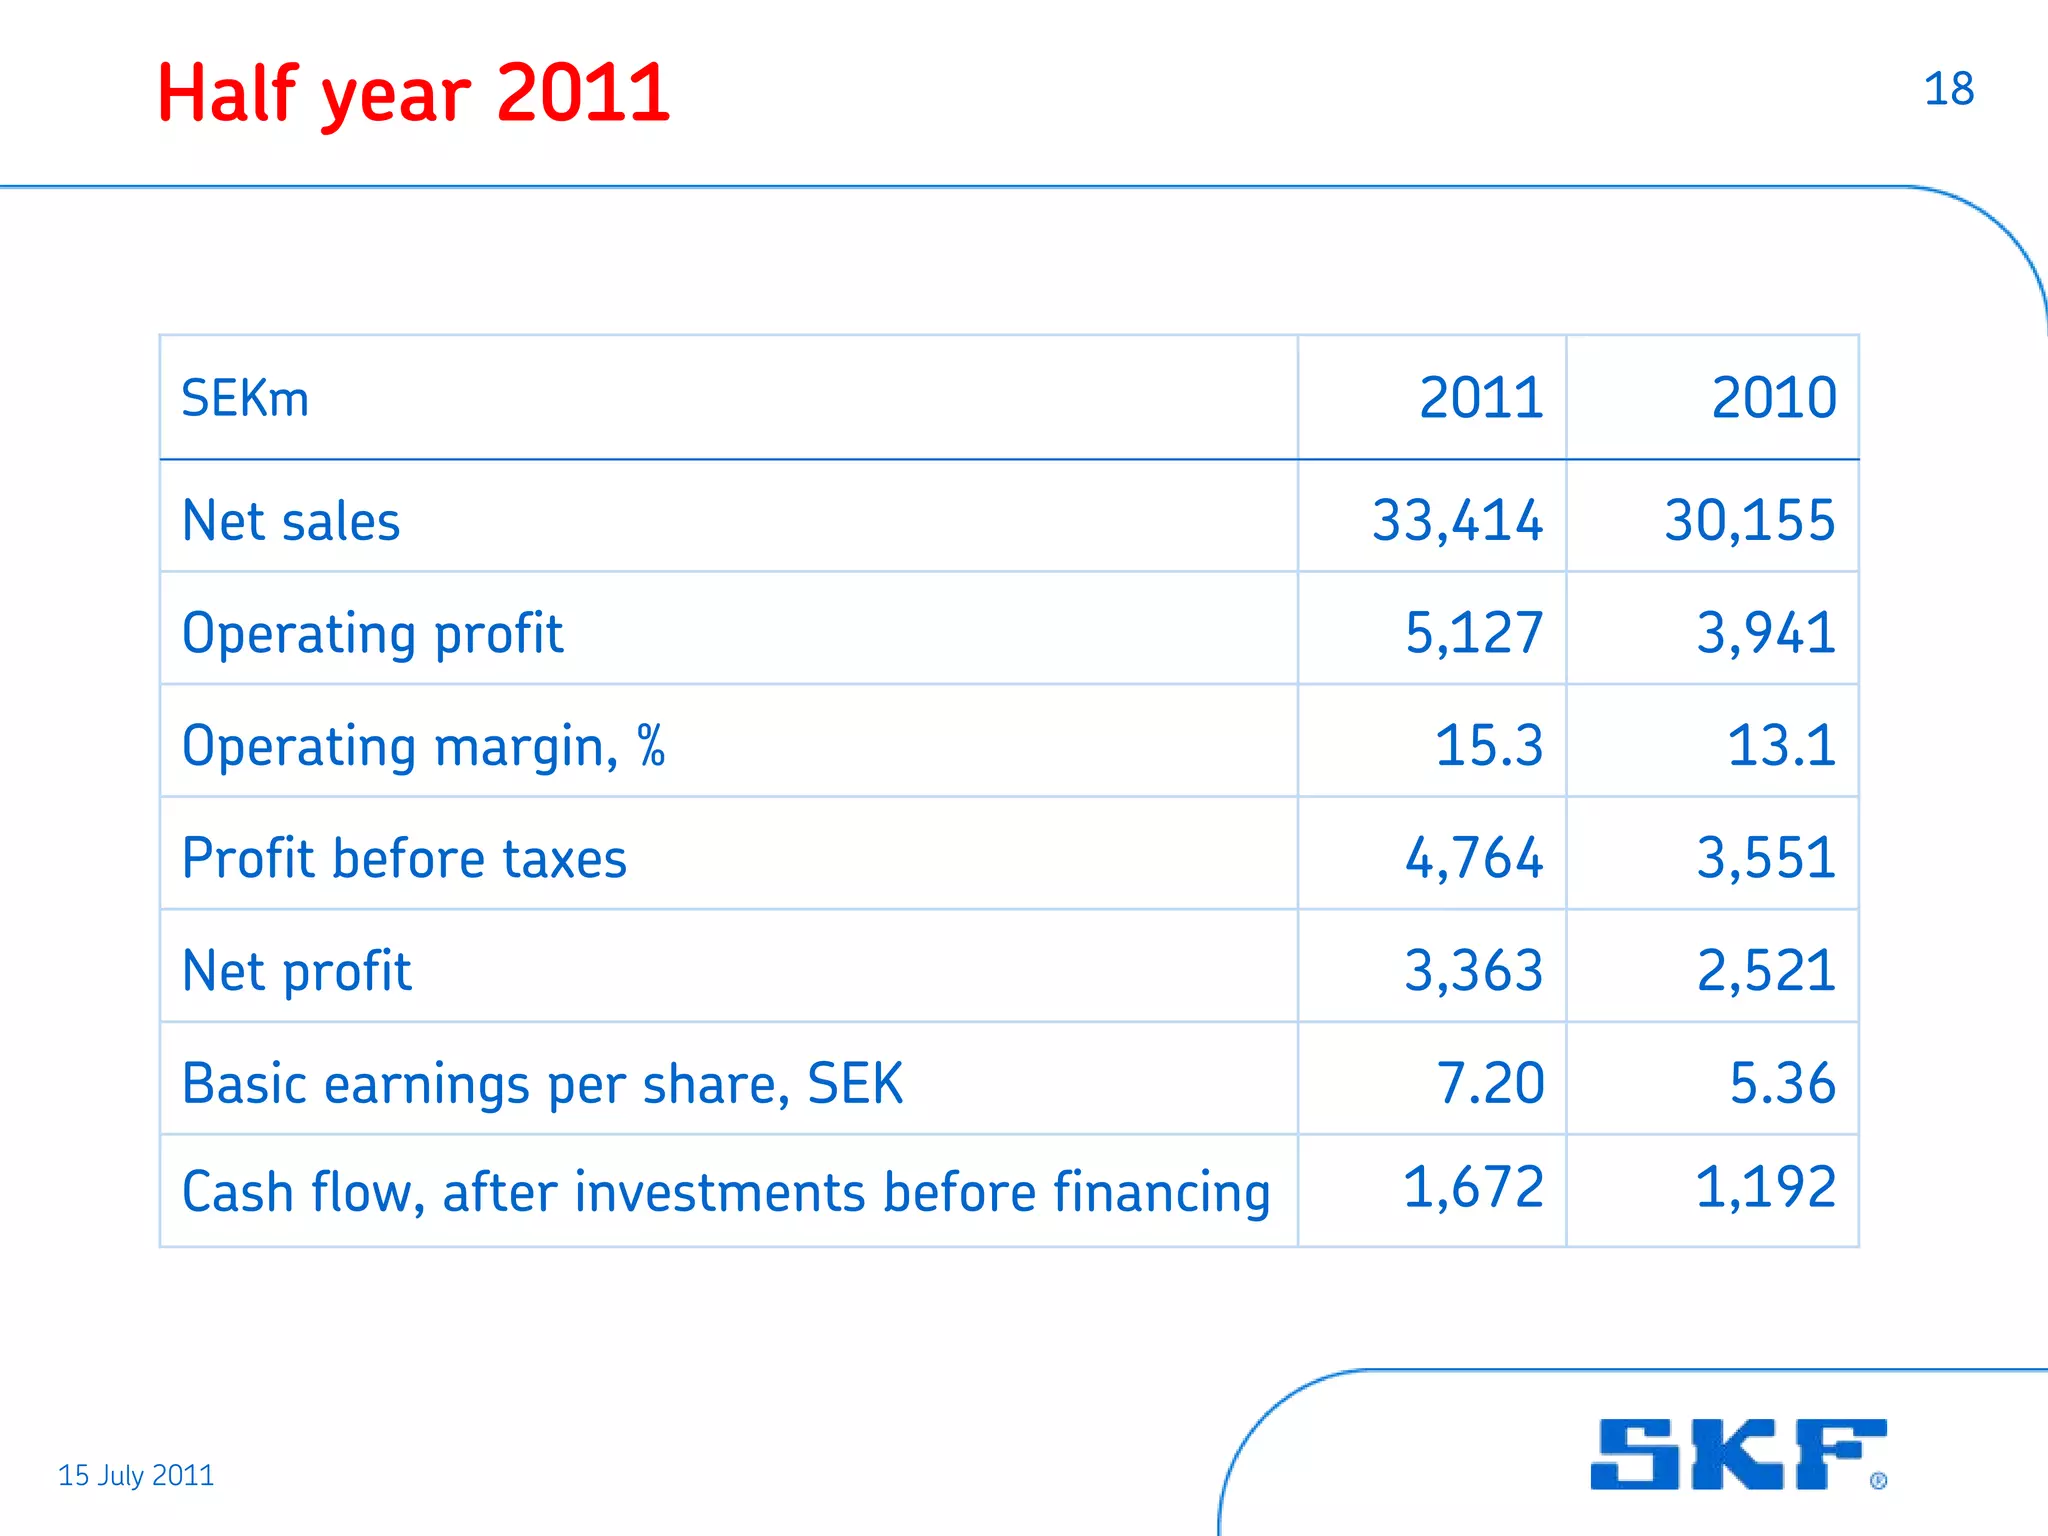
- SKF reported strong financial results in Q2 and H1 2011, with operating profit, margins, and sales all up significantly year-over-year.
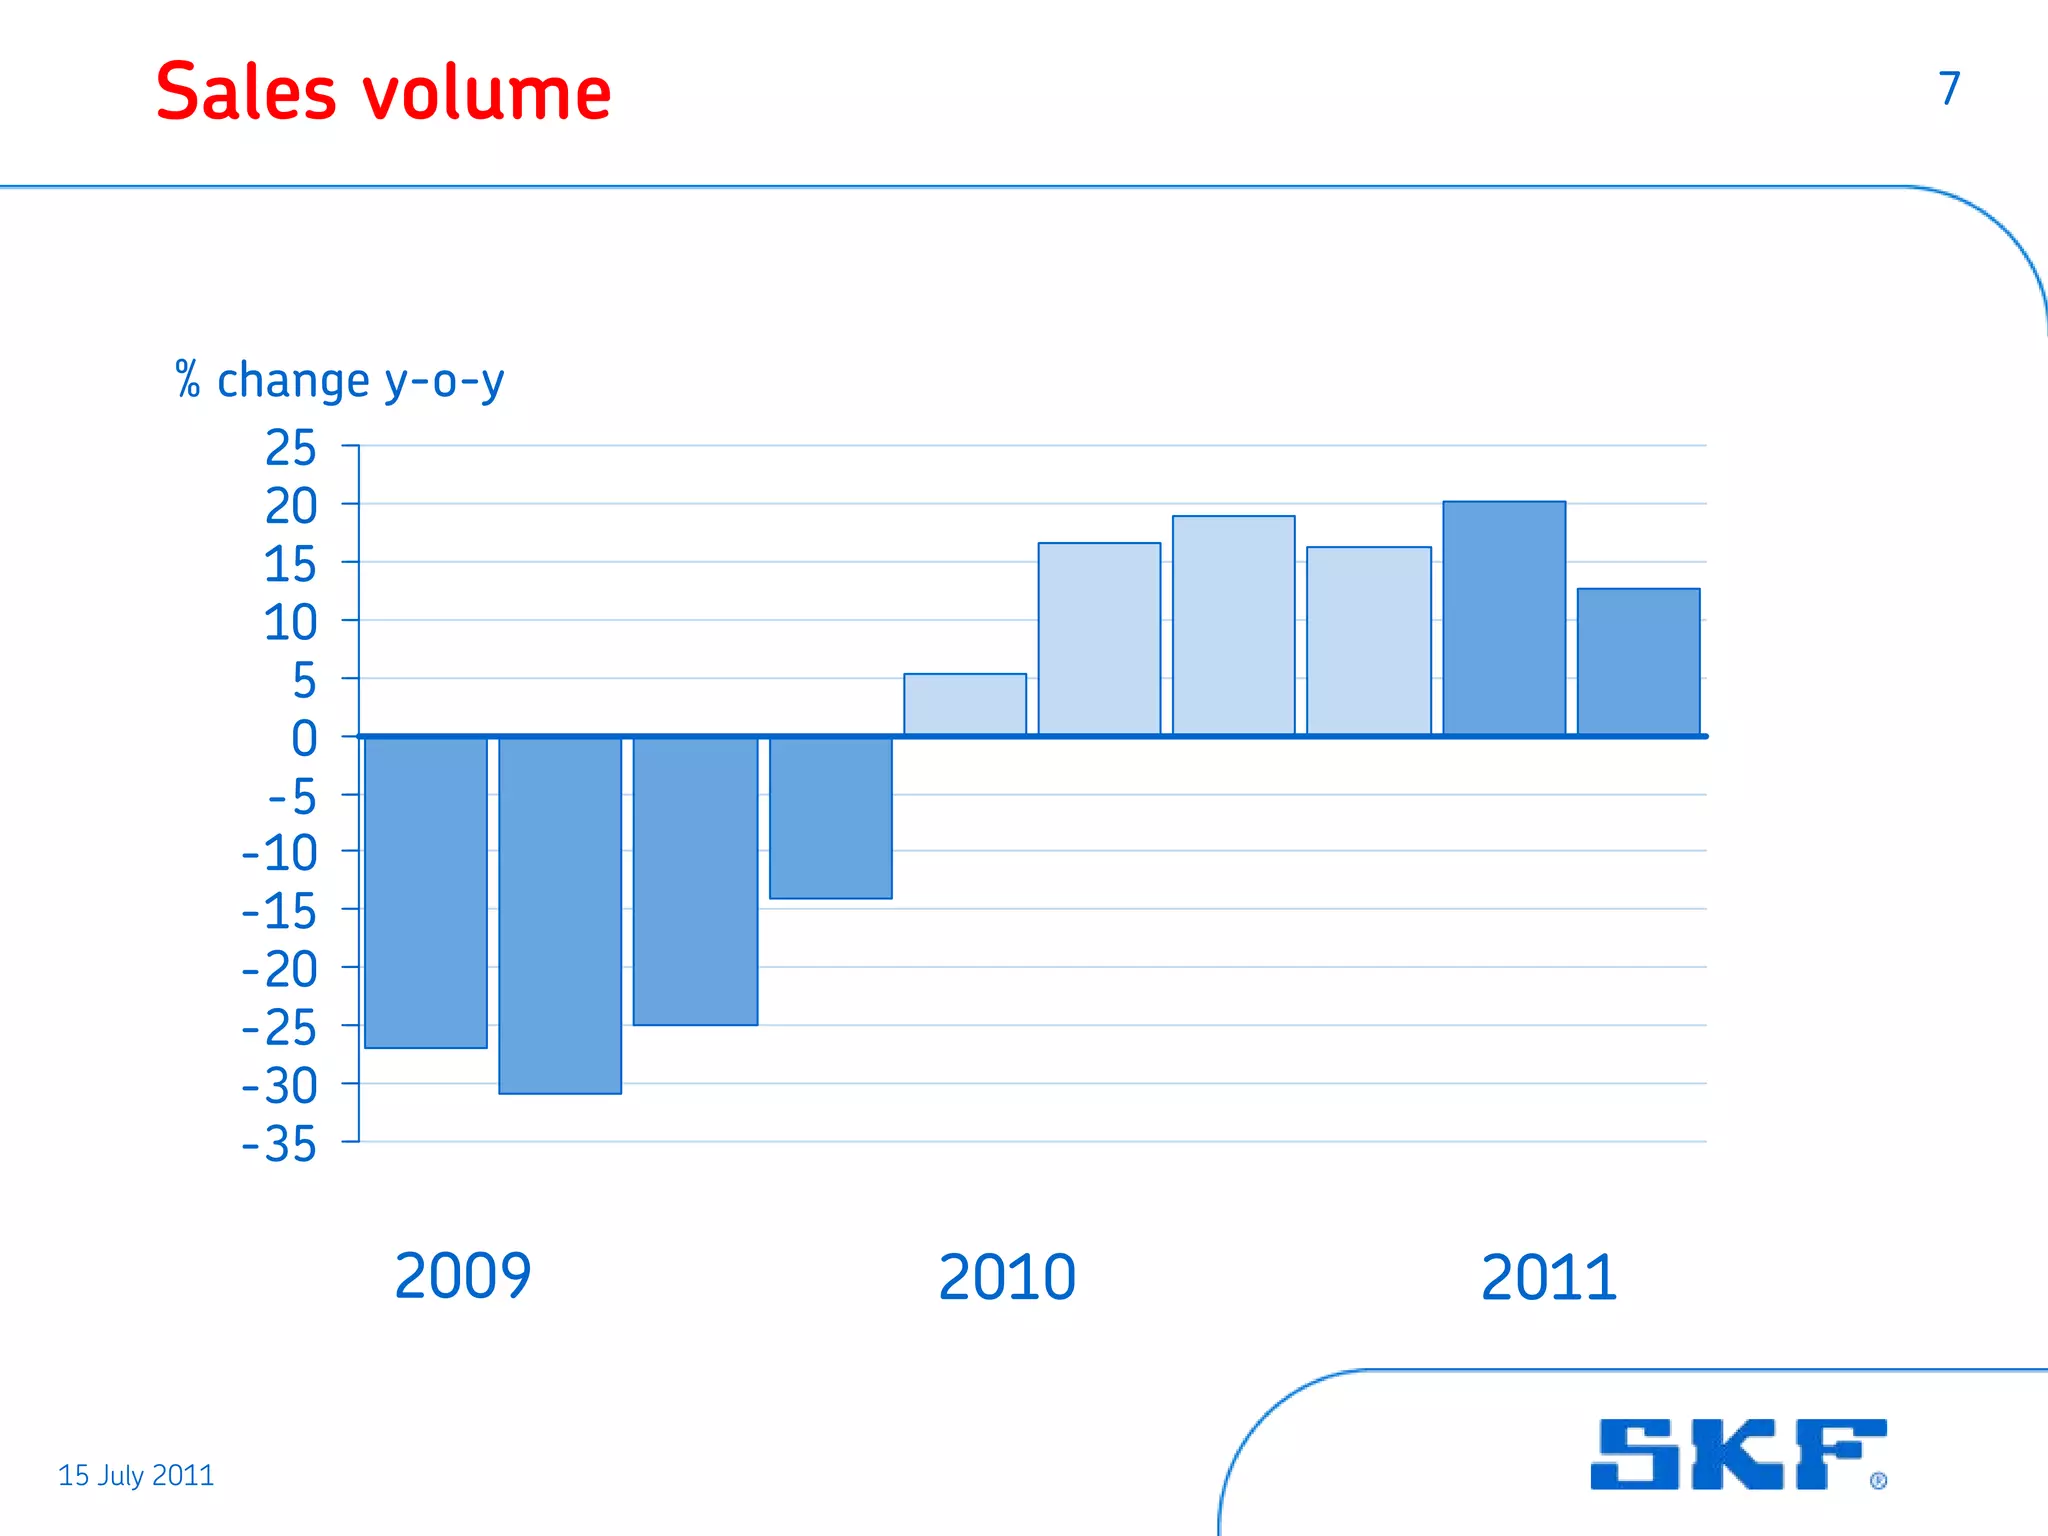
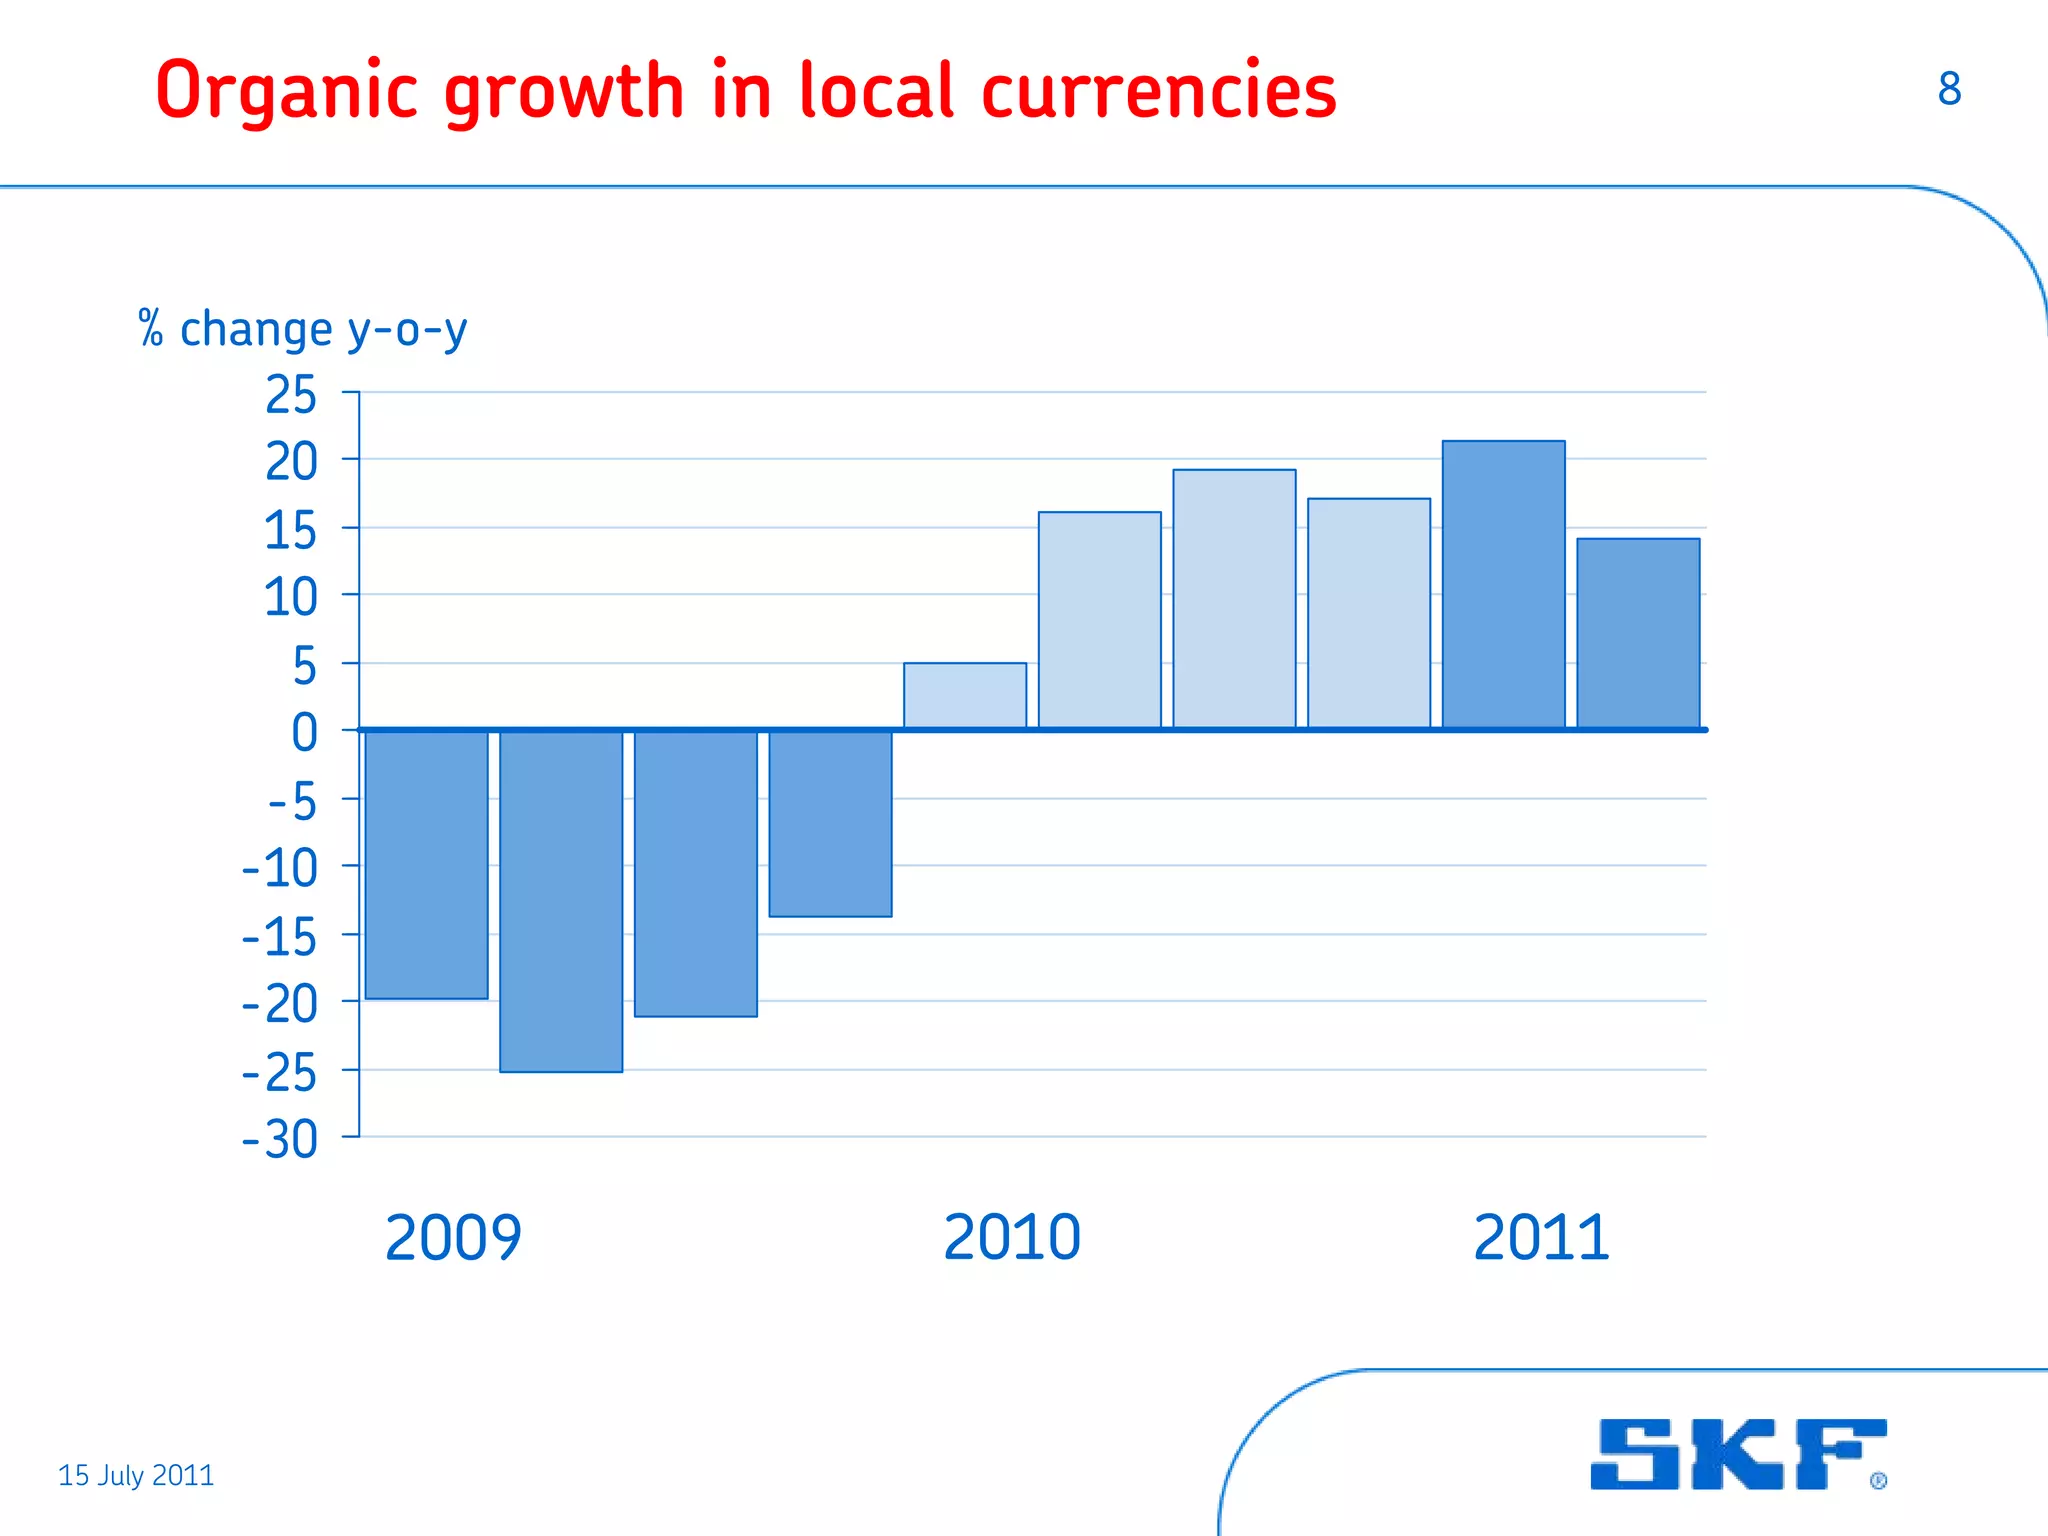
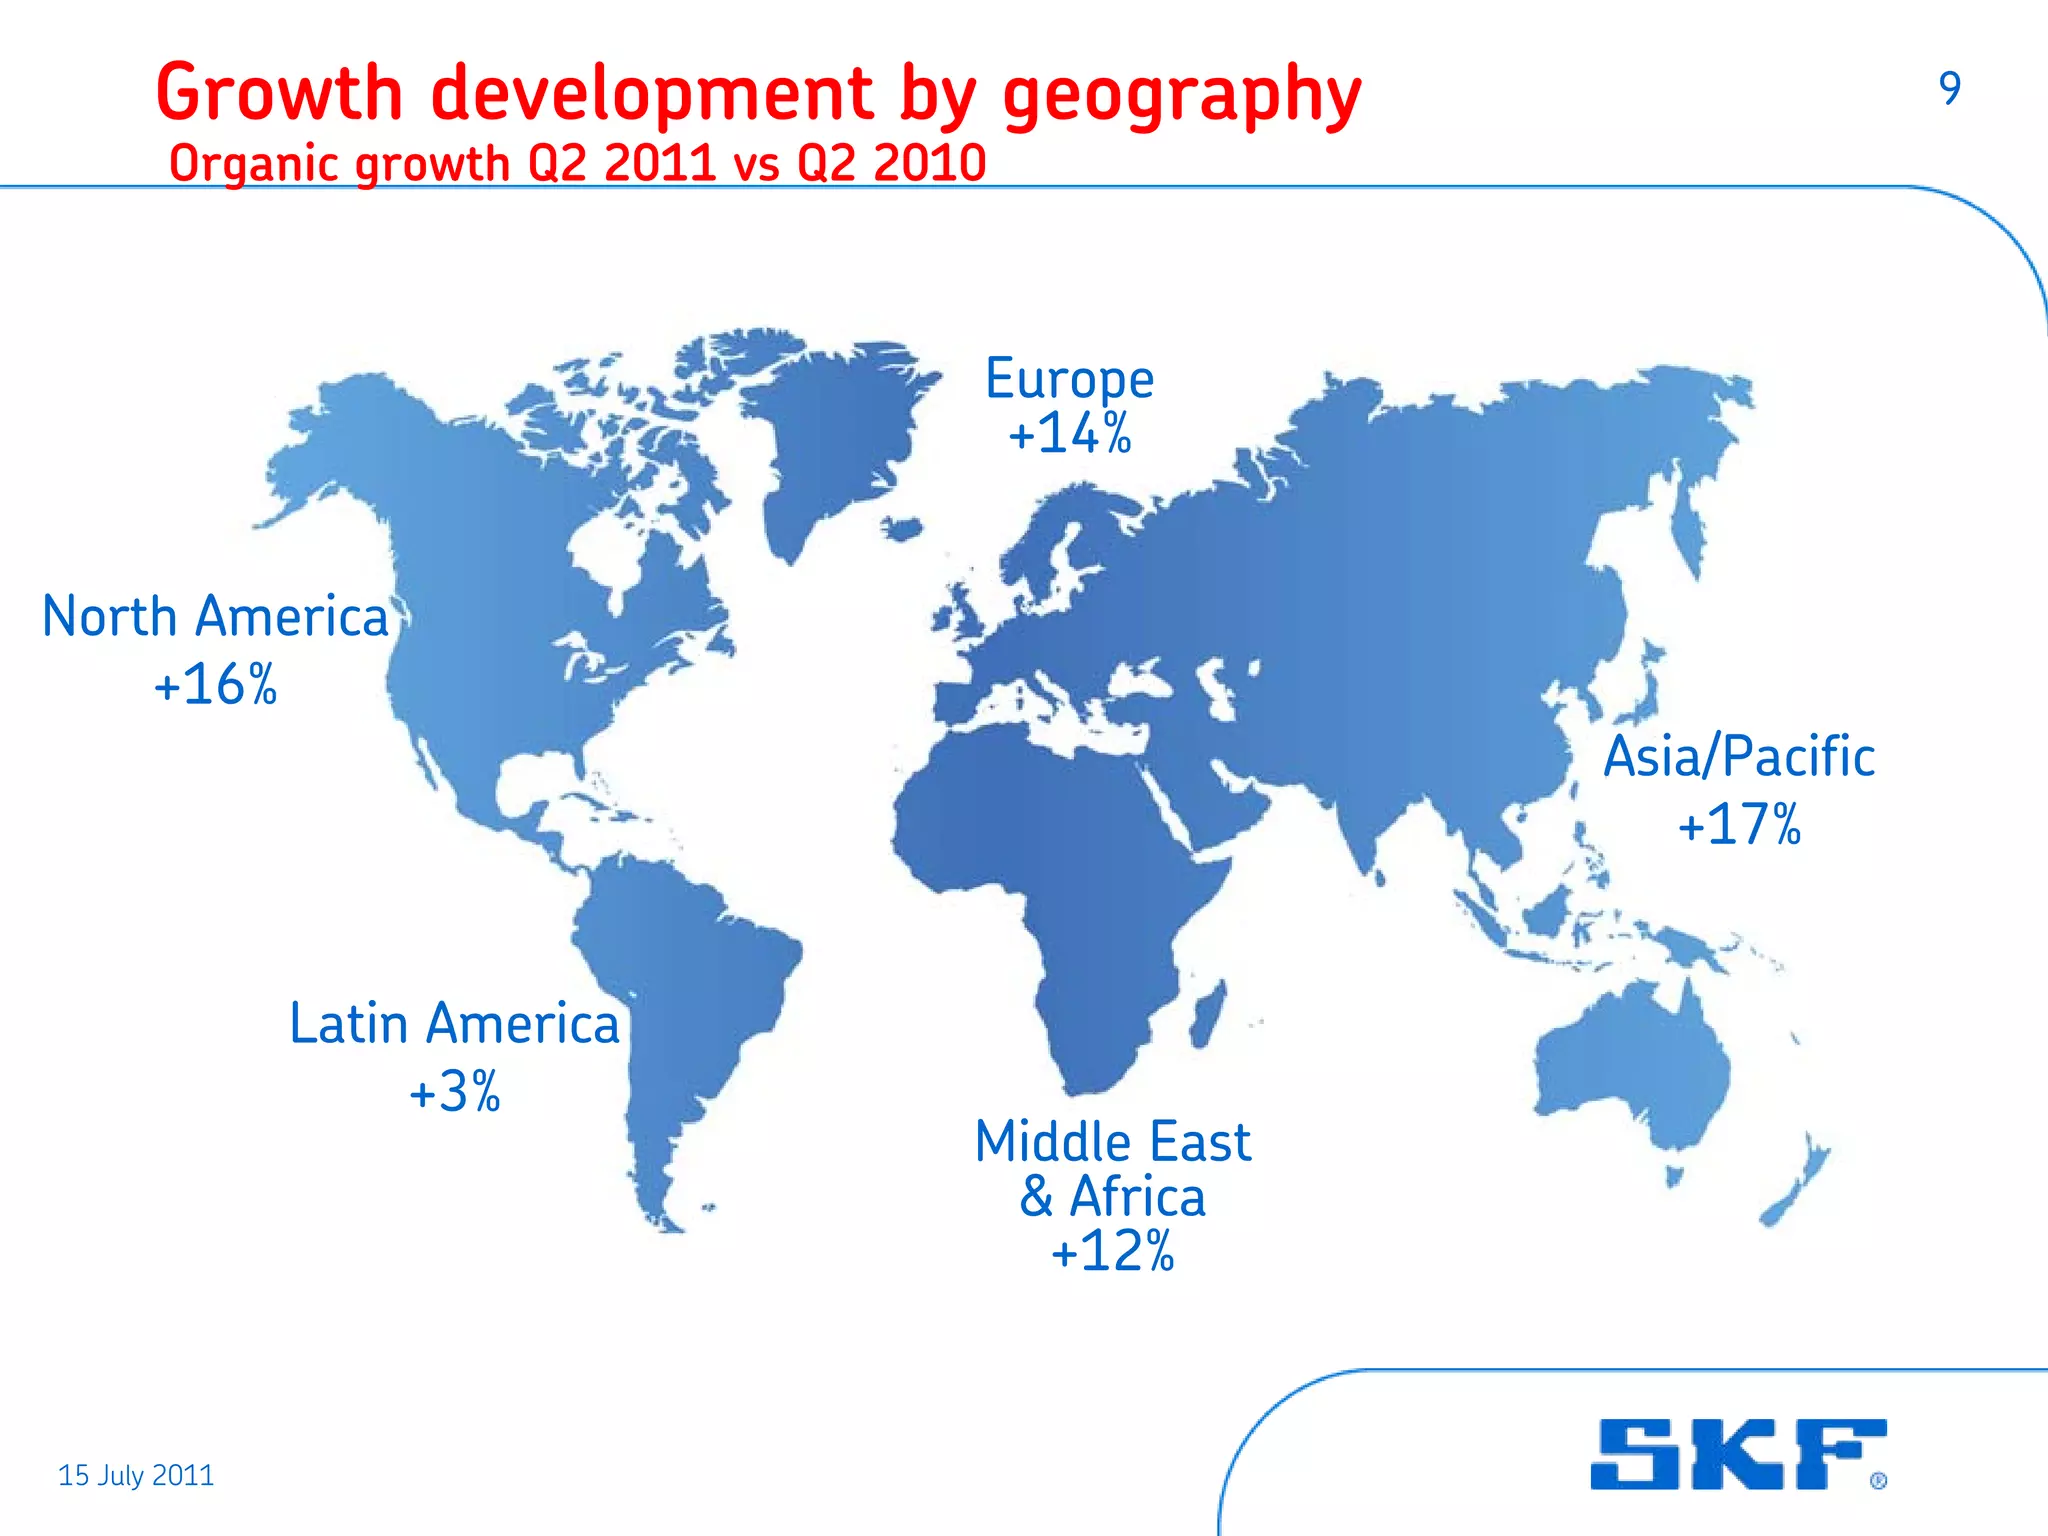
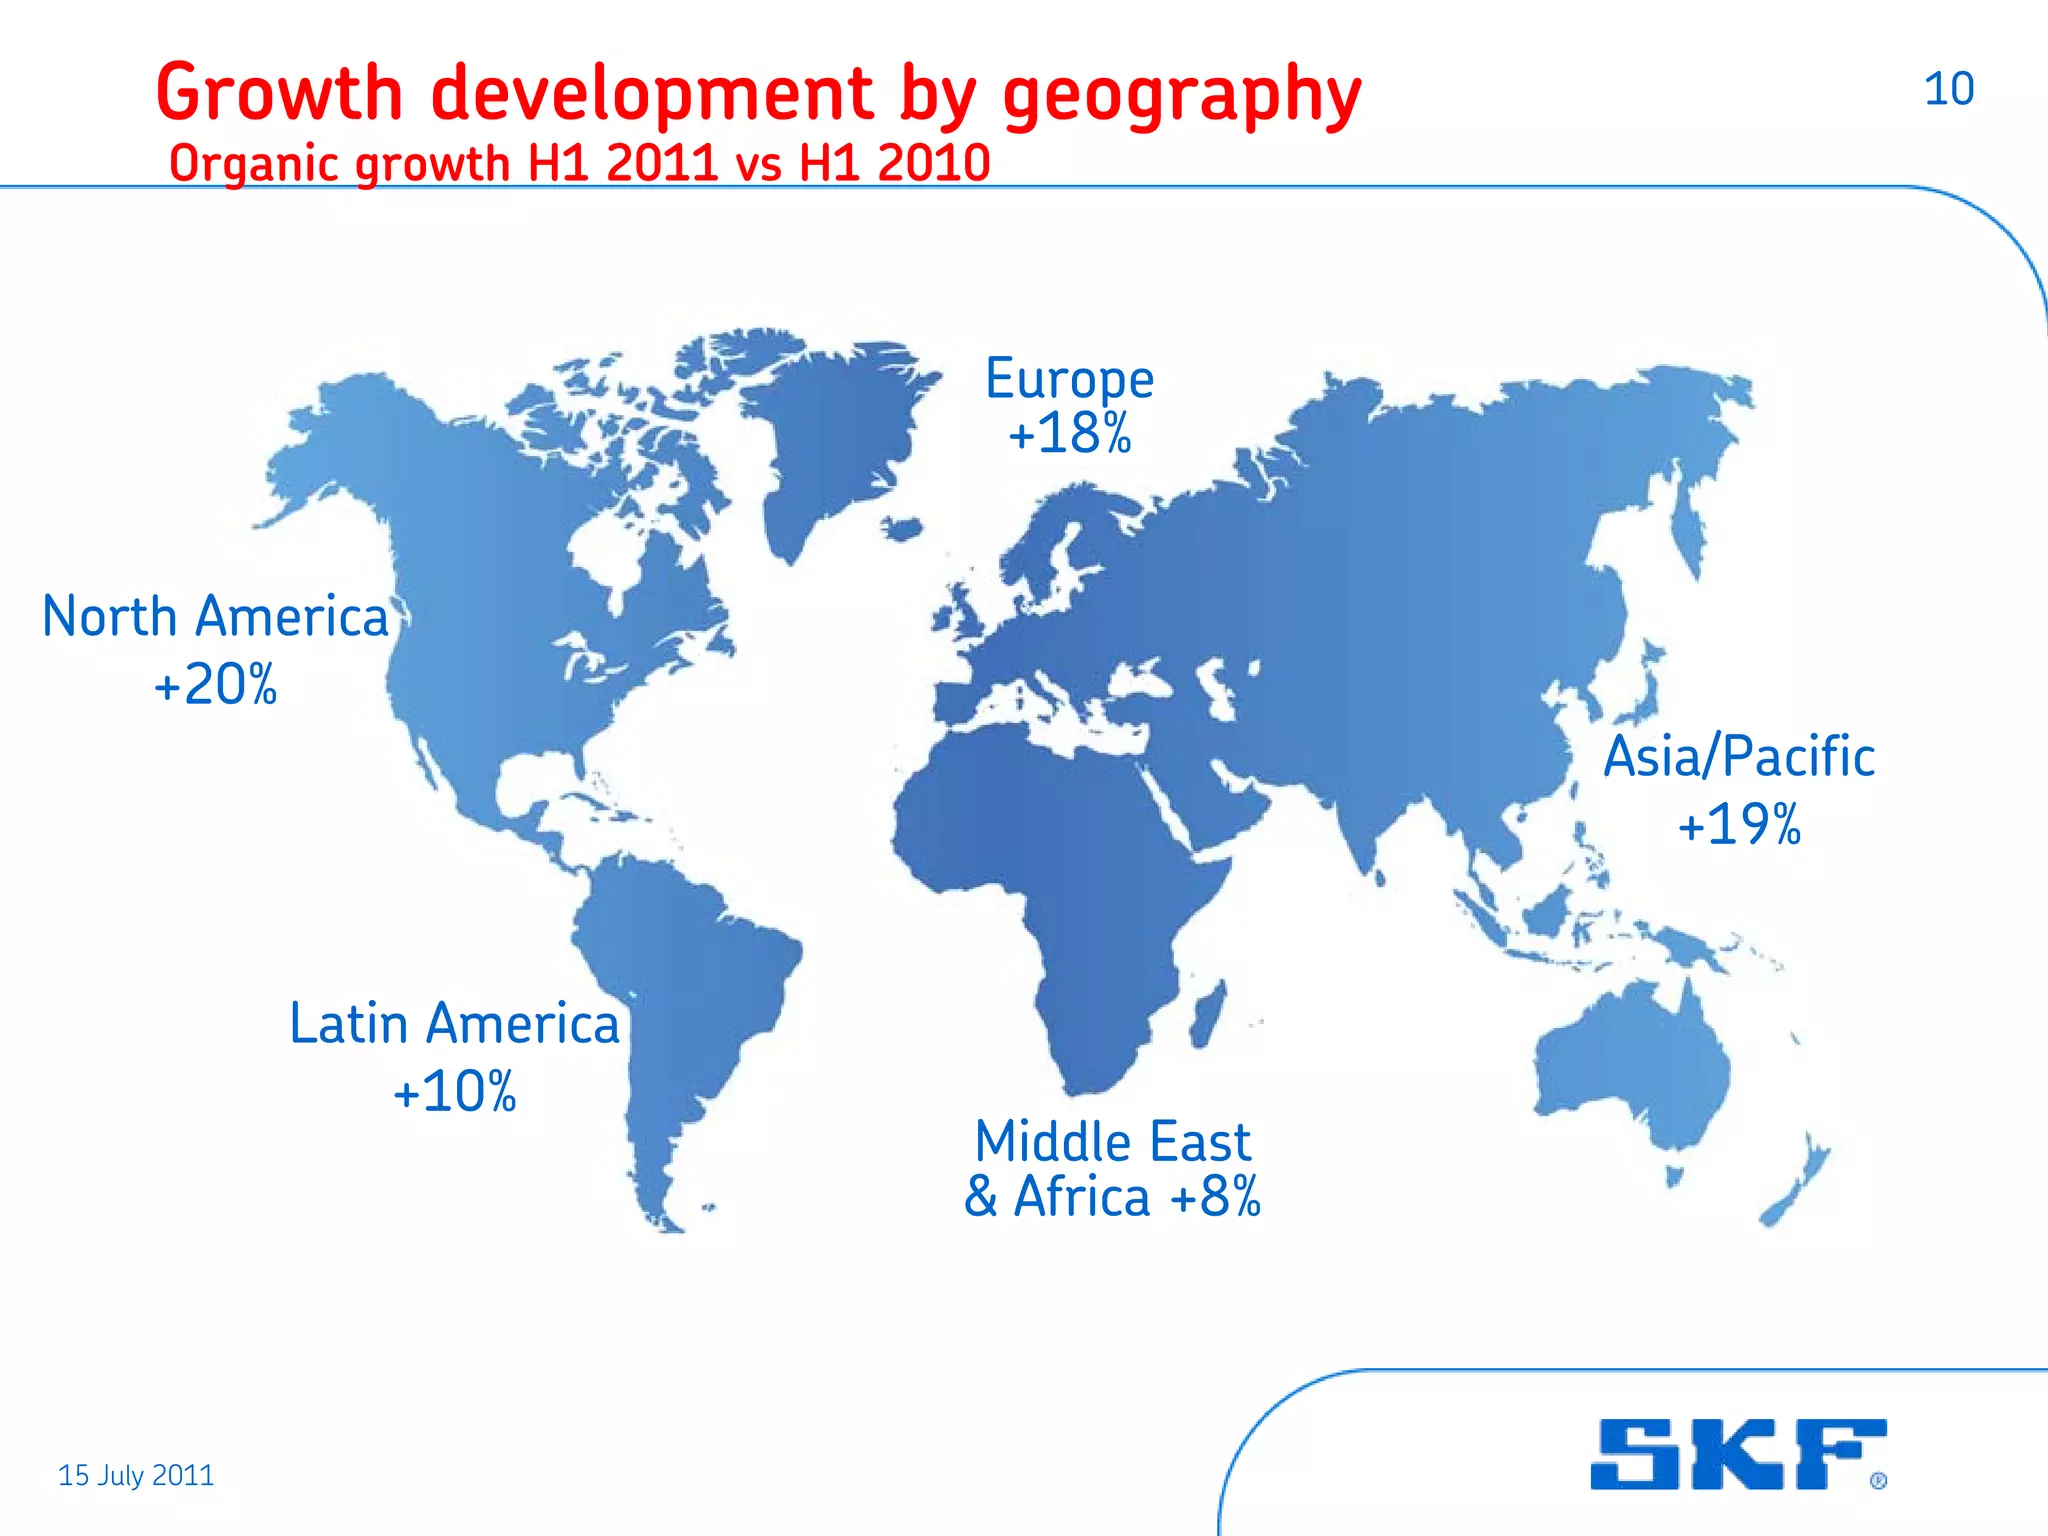
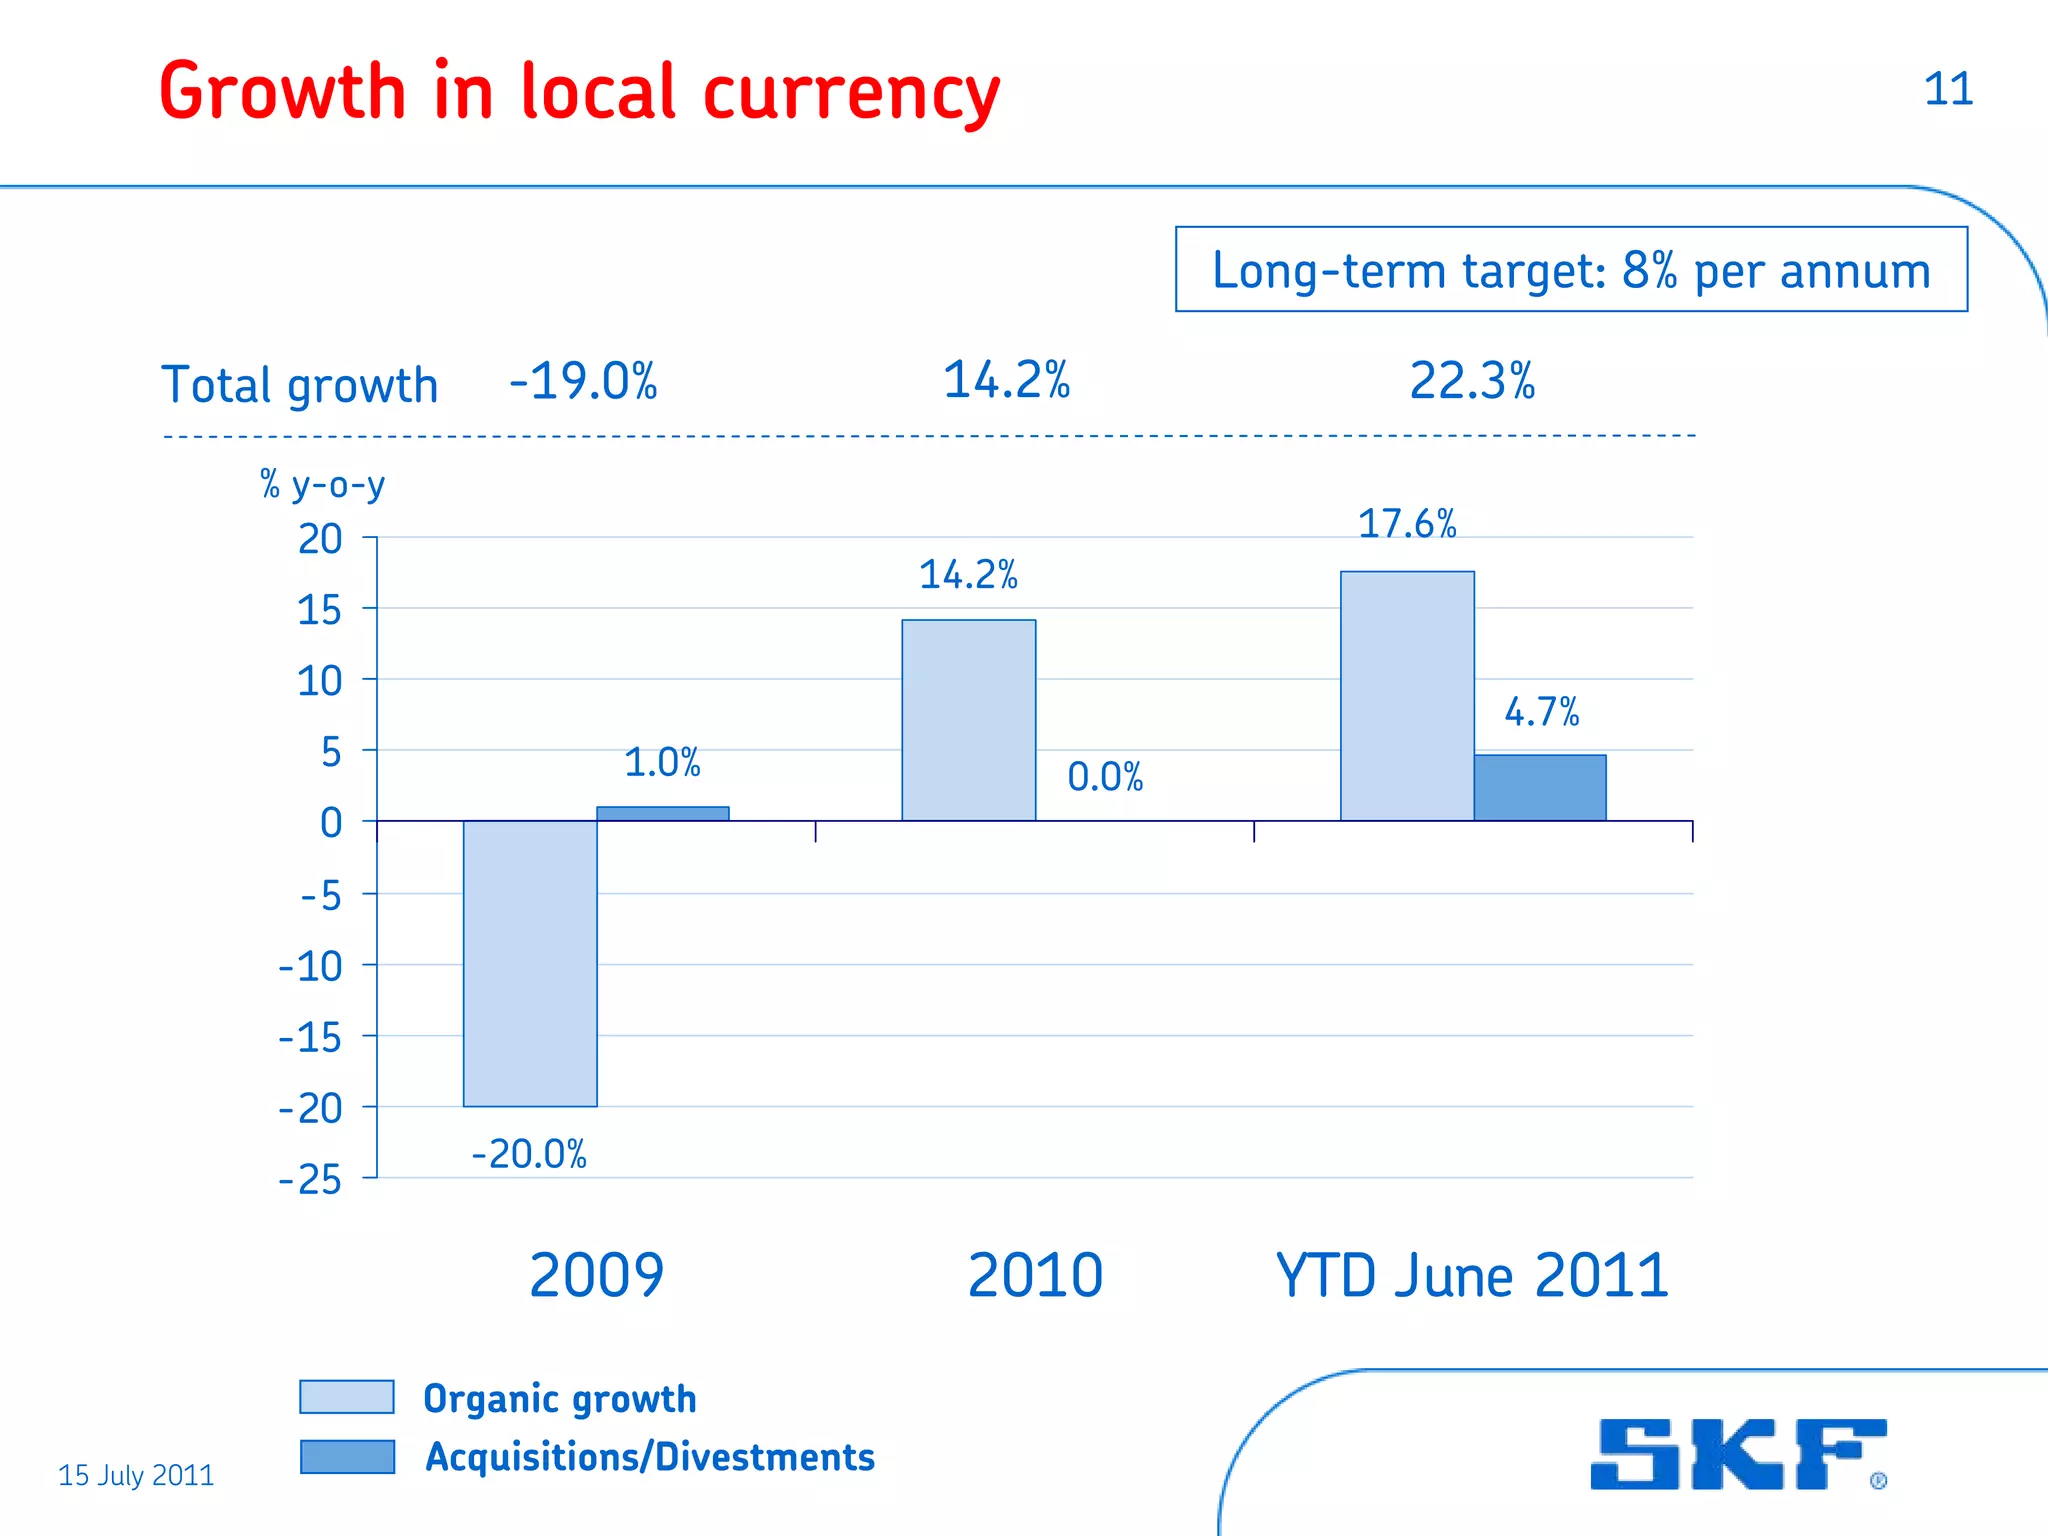
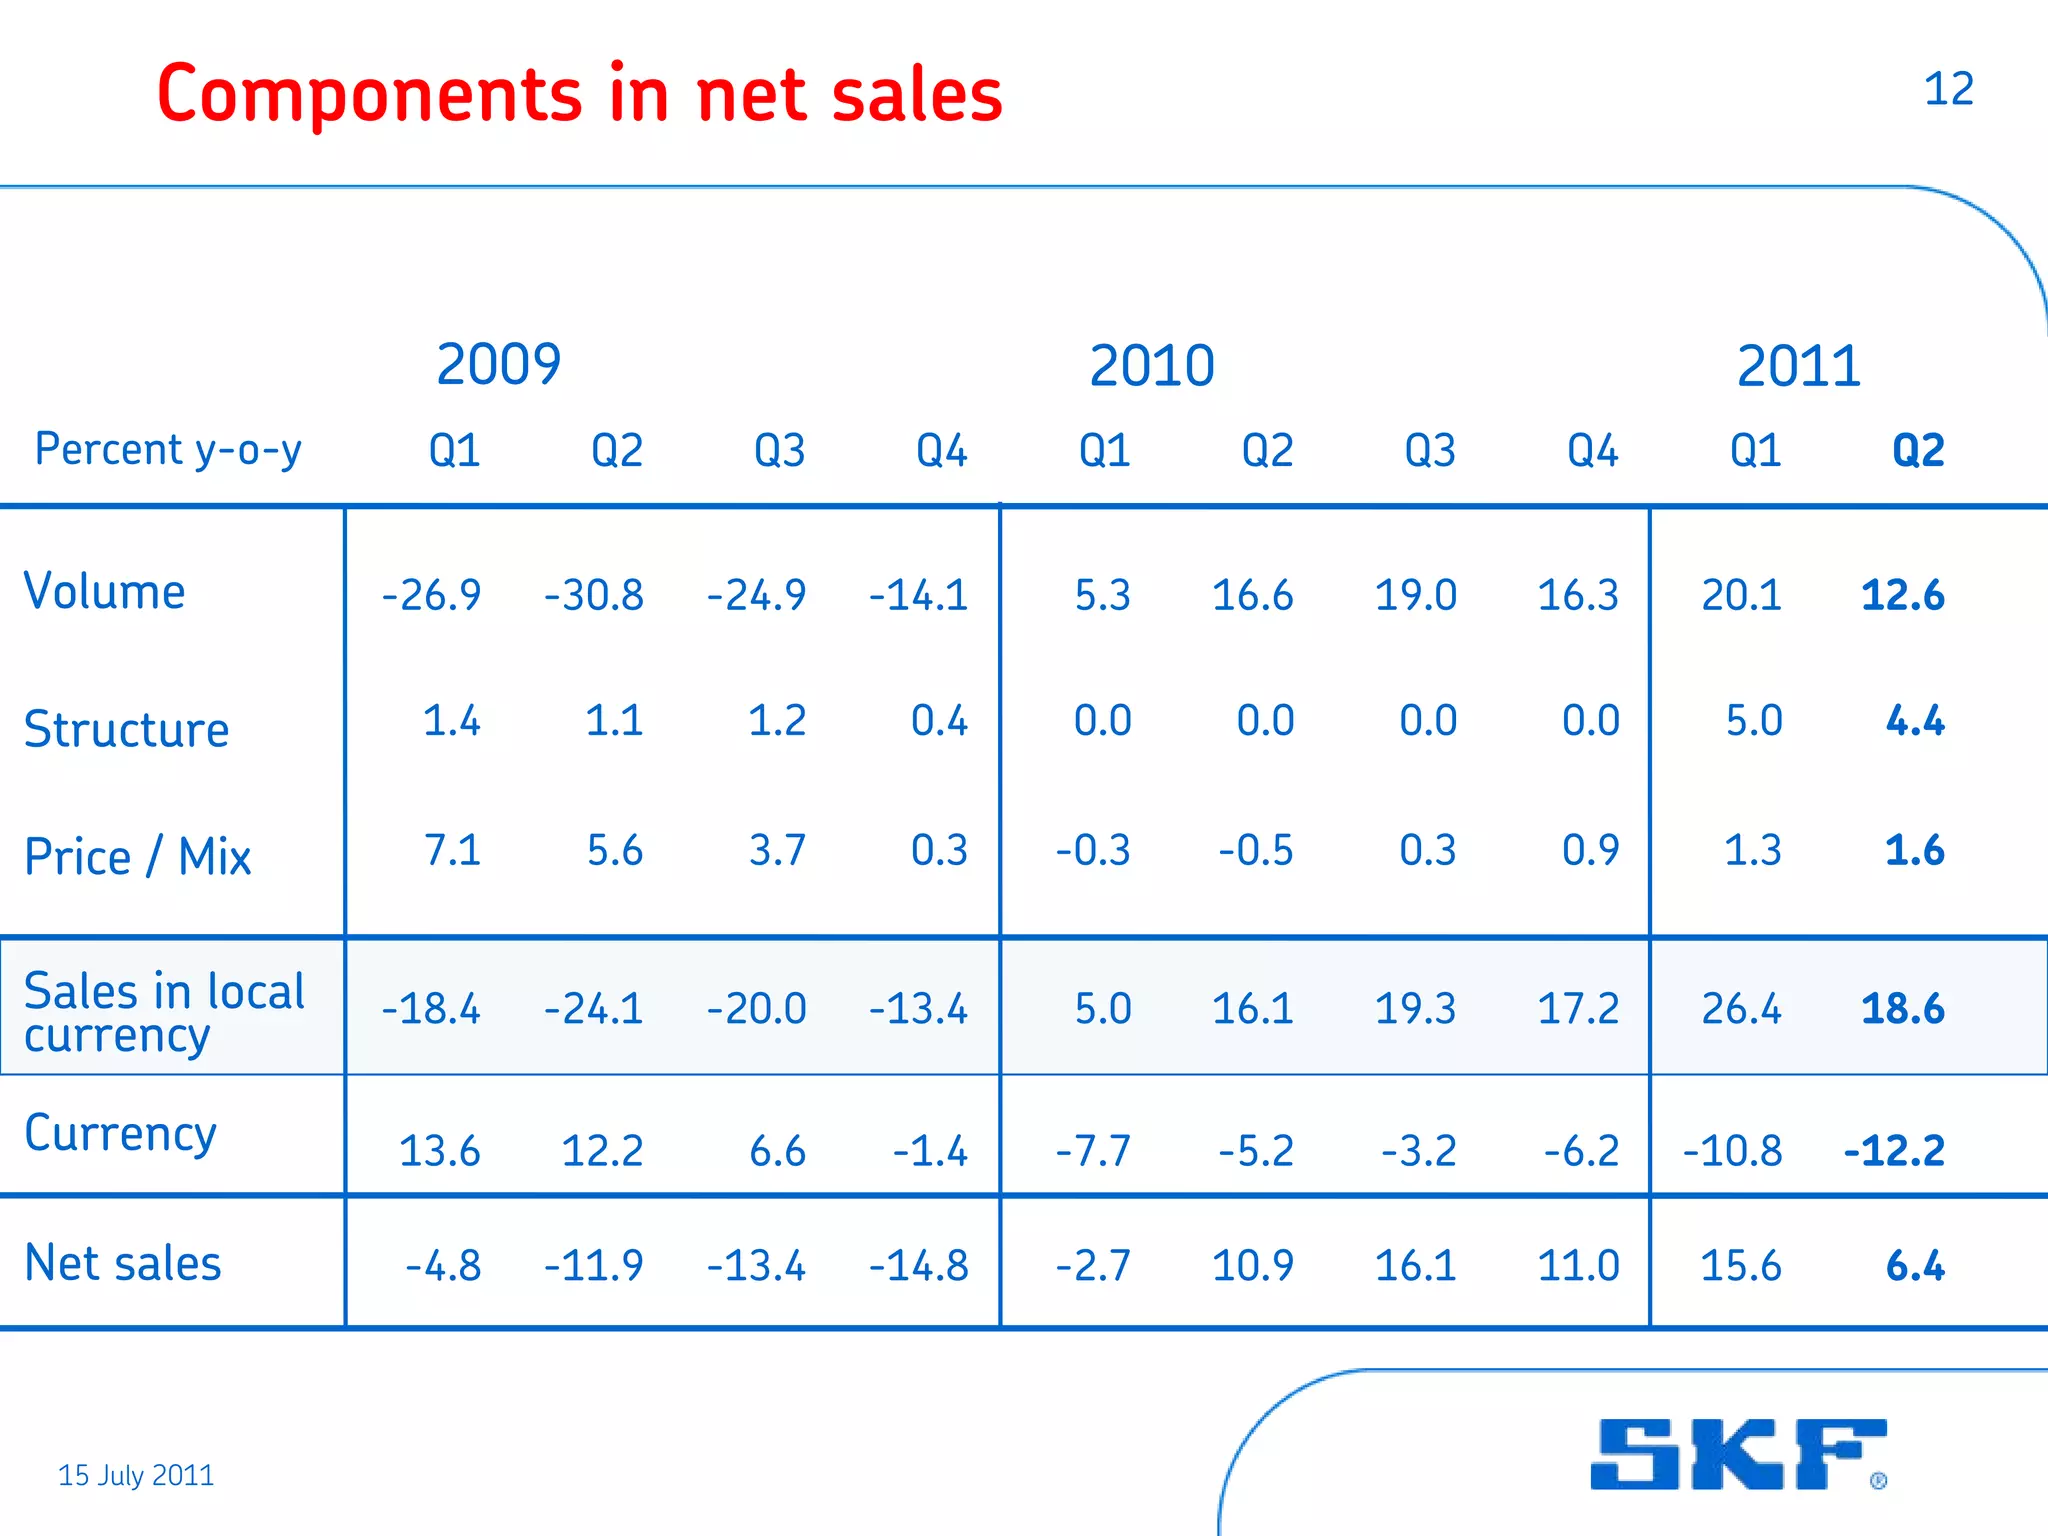
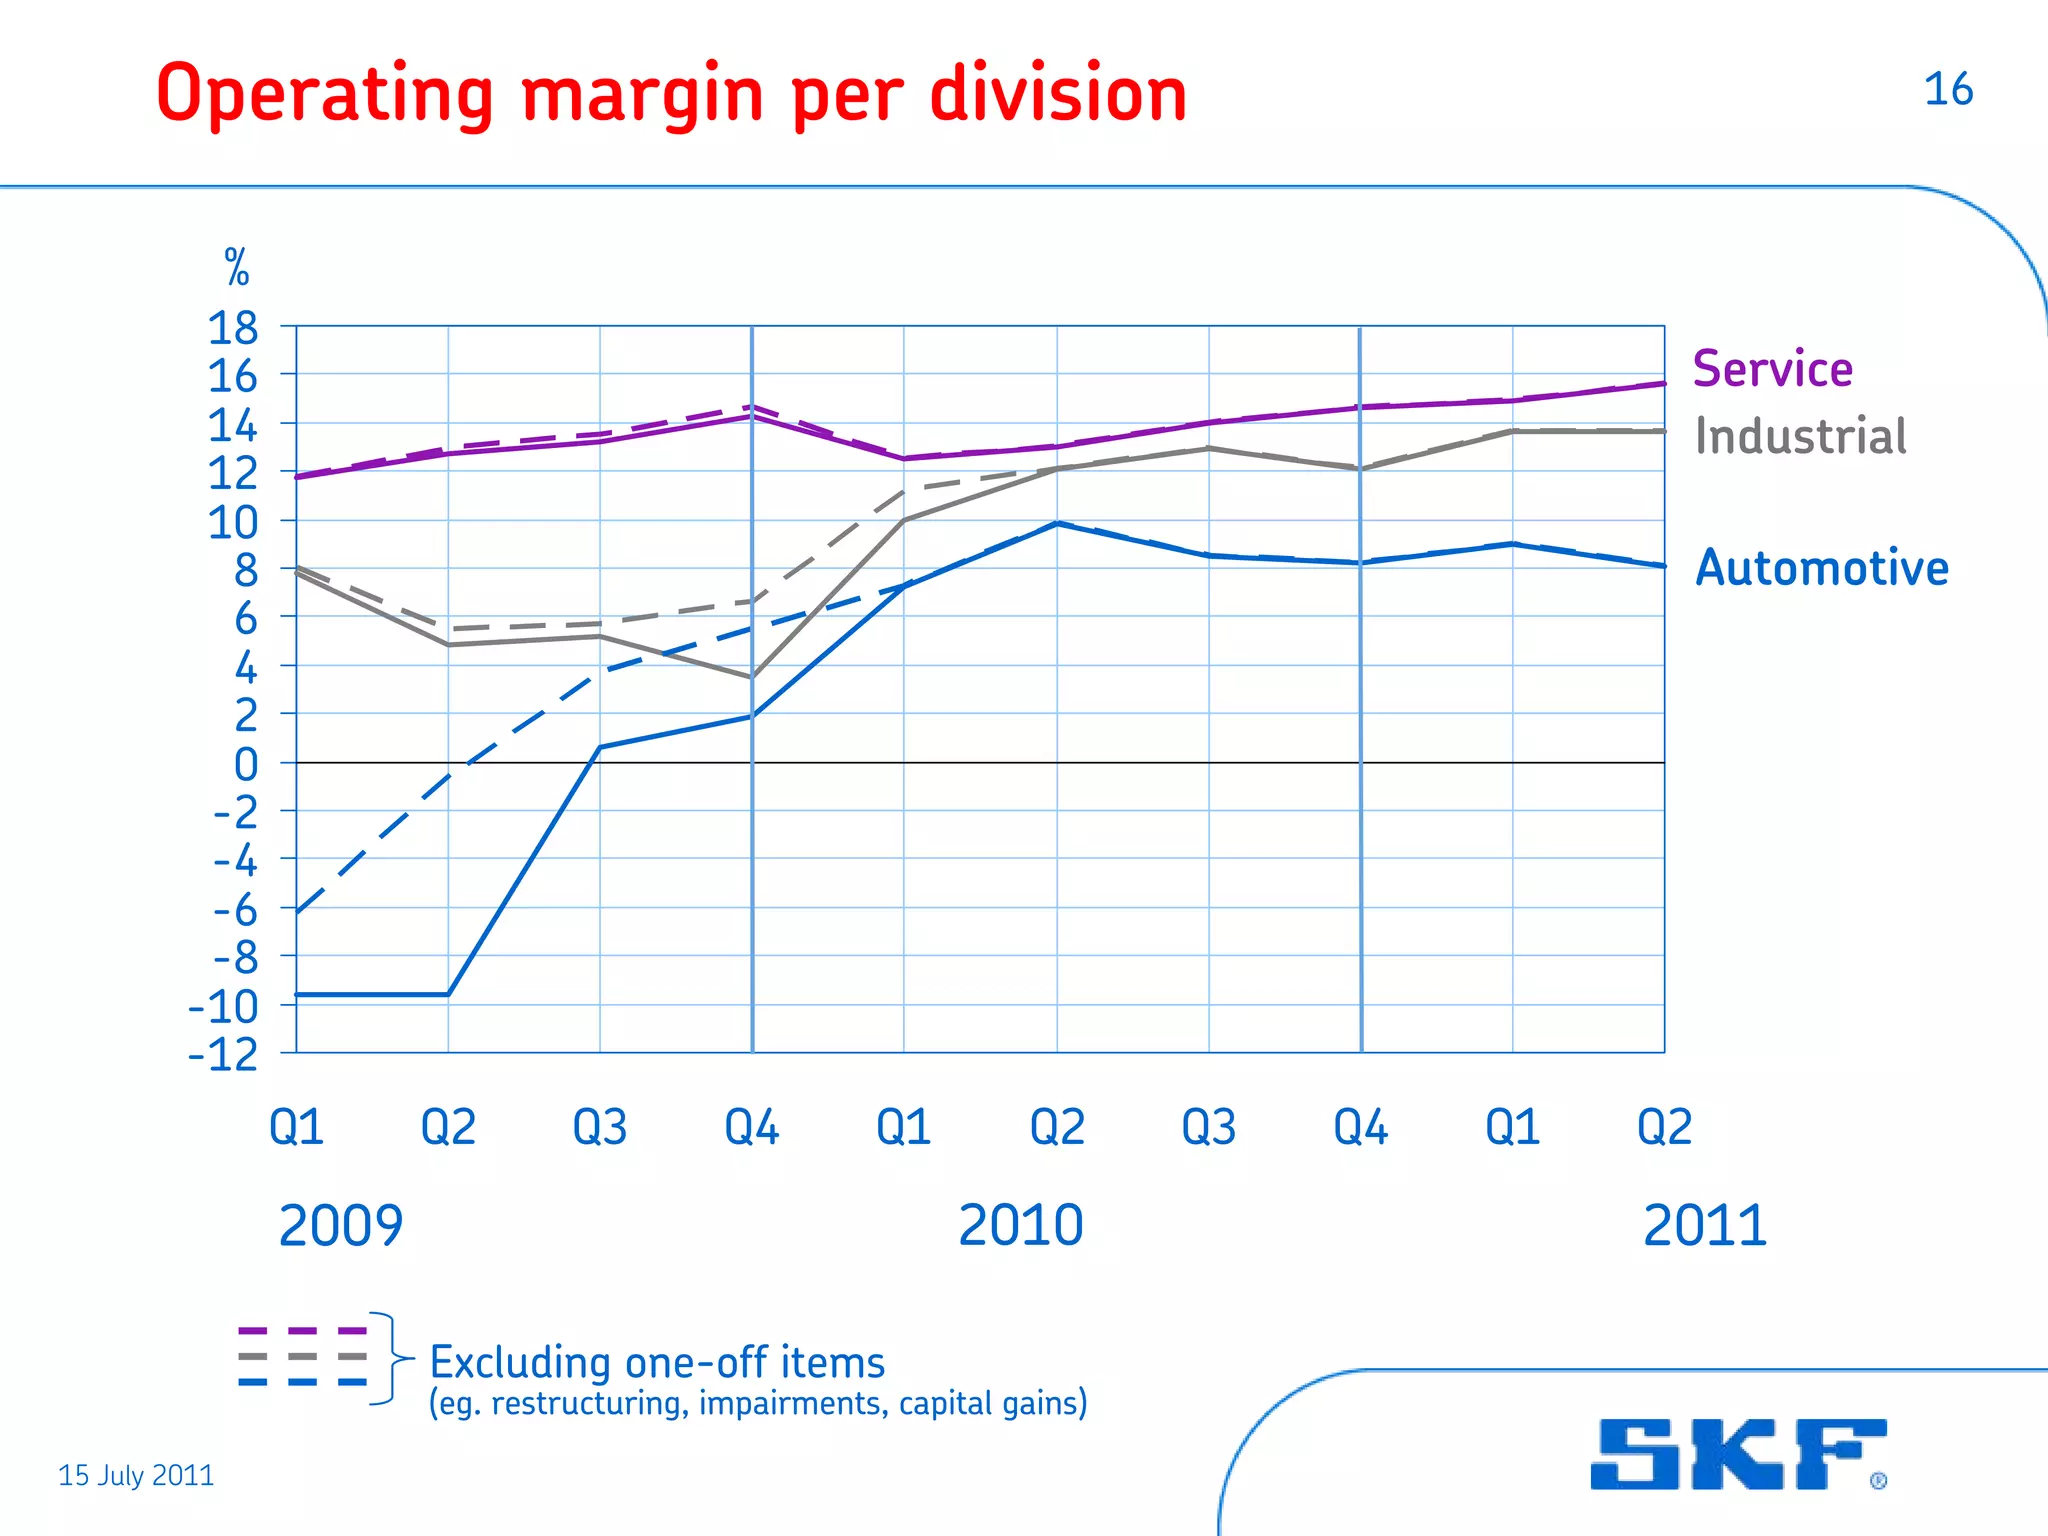
- Organic sales growth was 14.2% in Q2 and 17.6% in H1 across all regions and divisions.
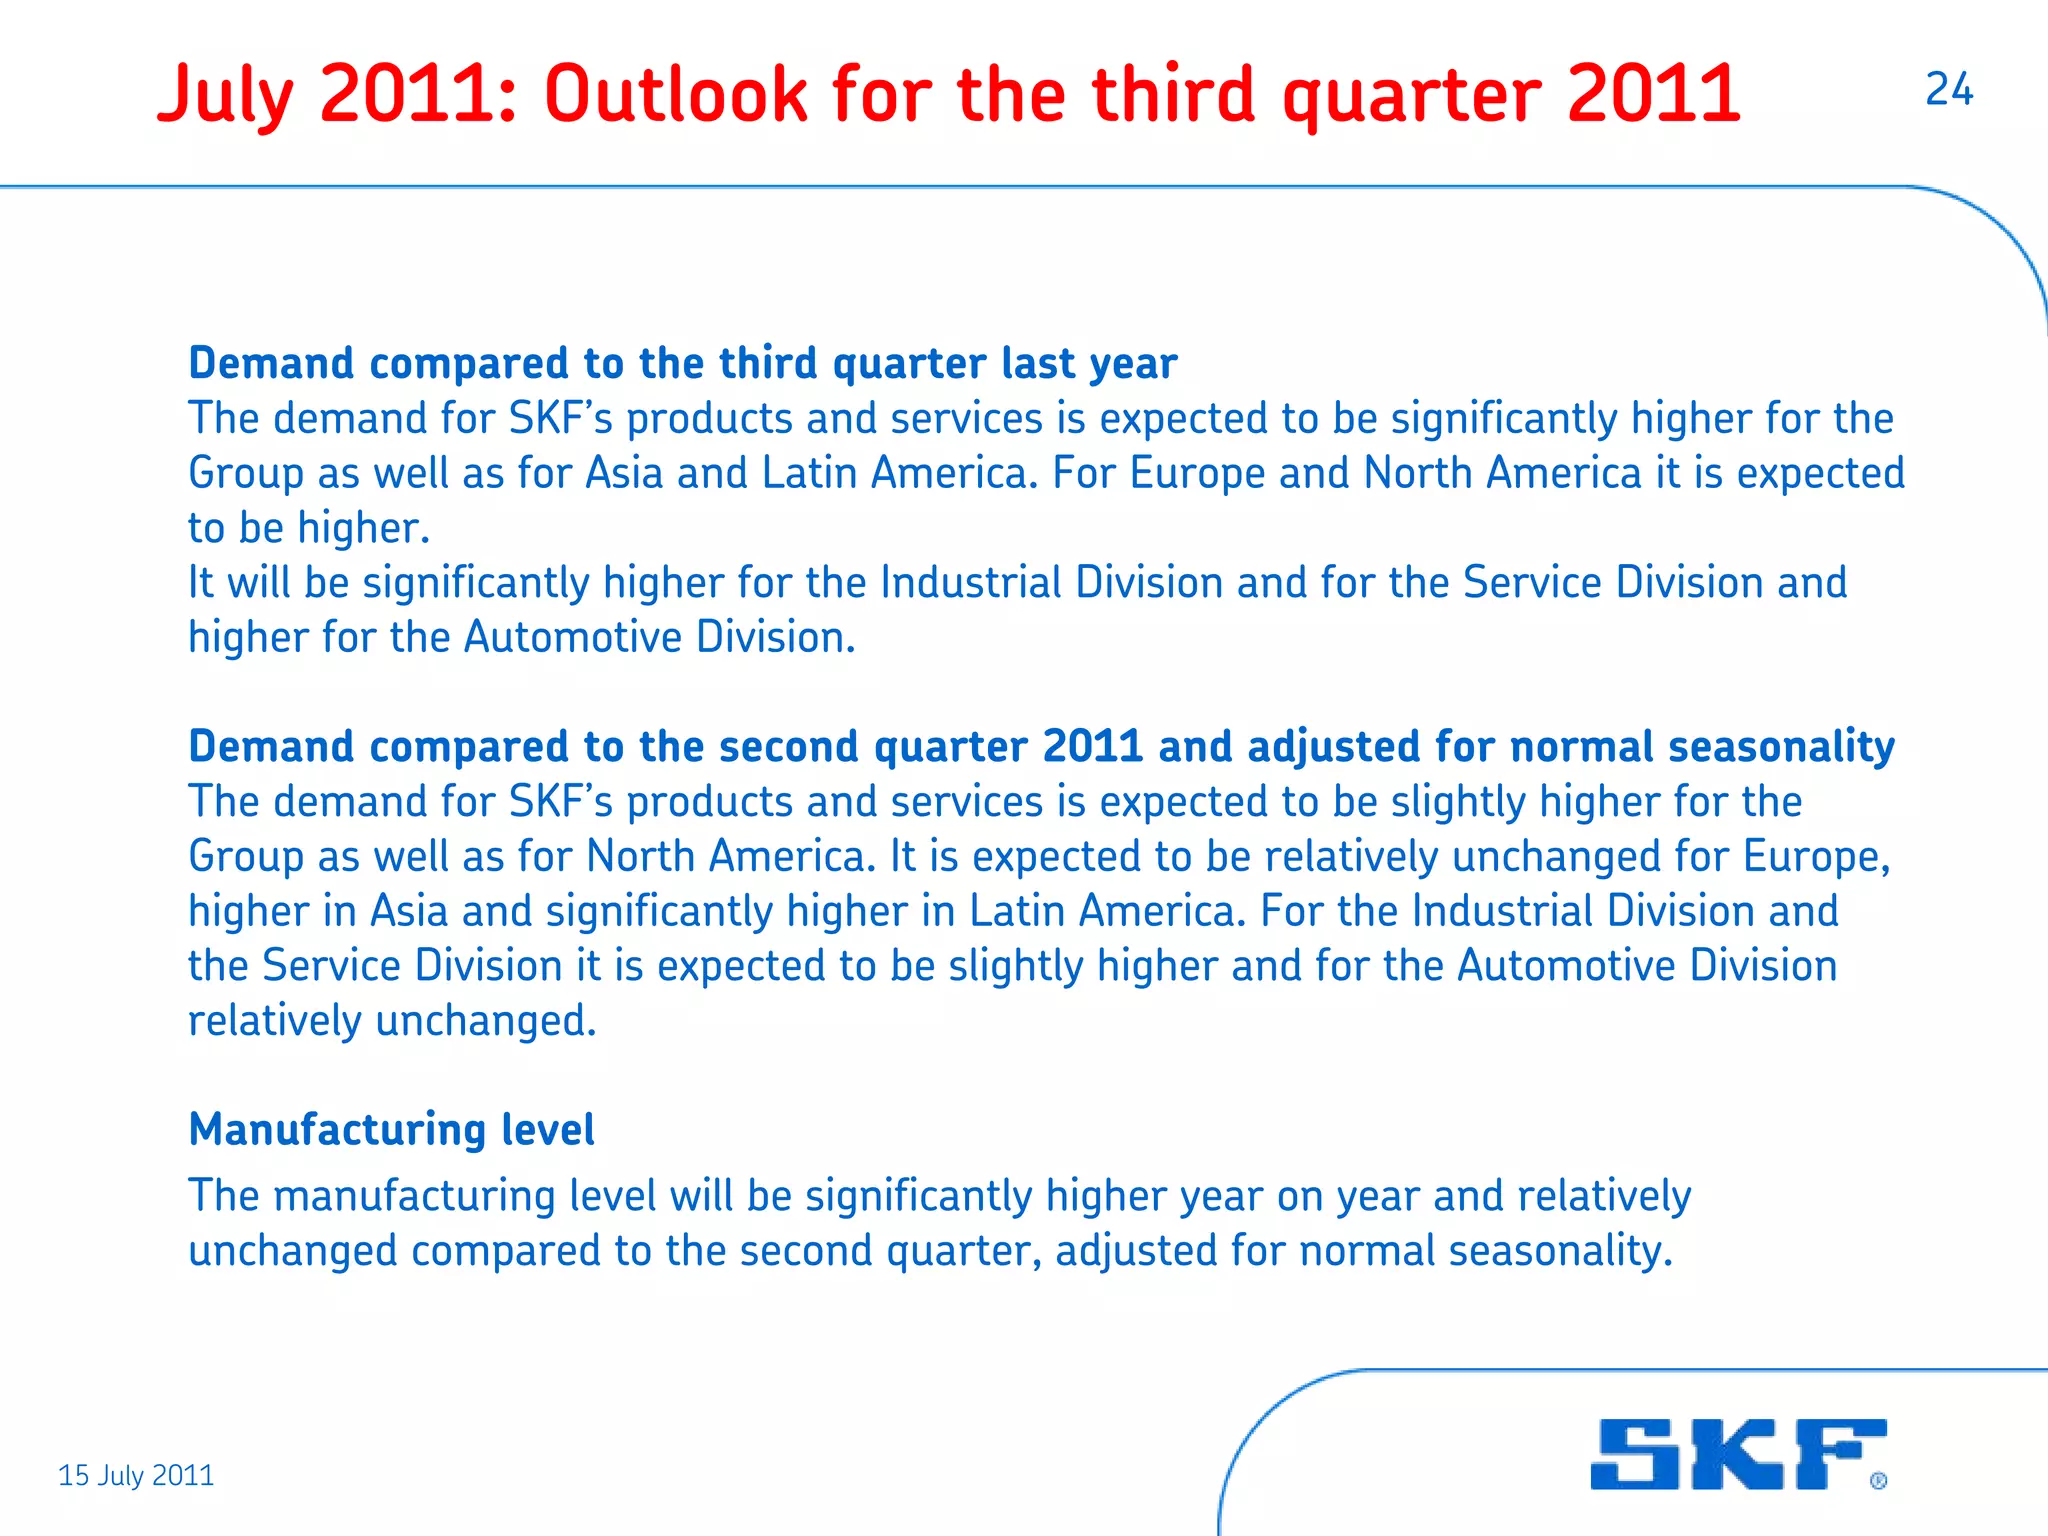
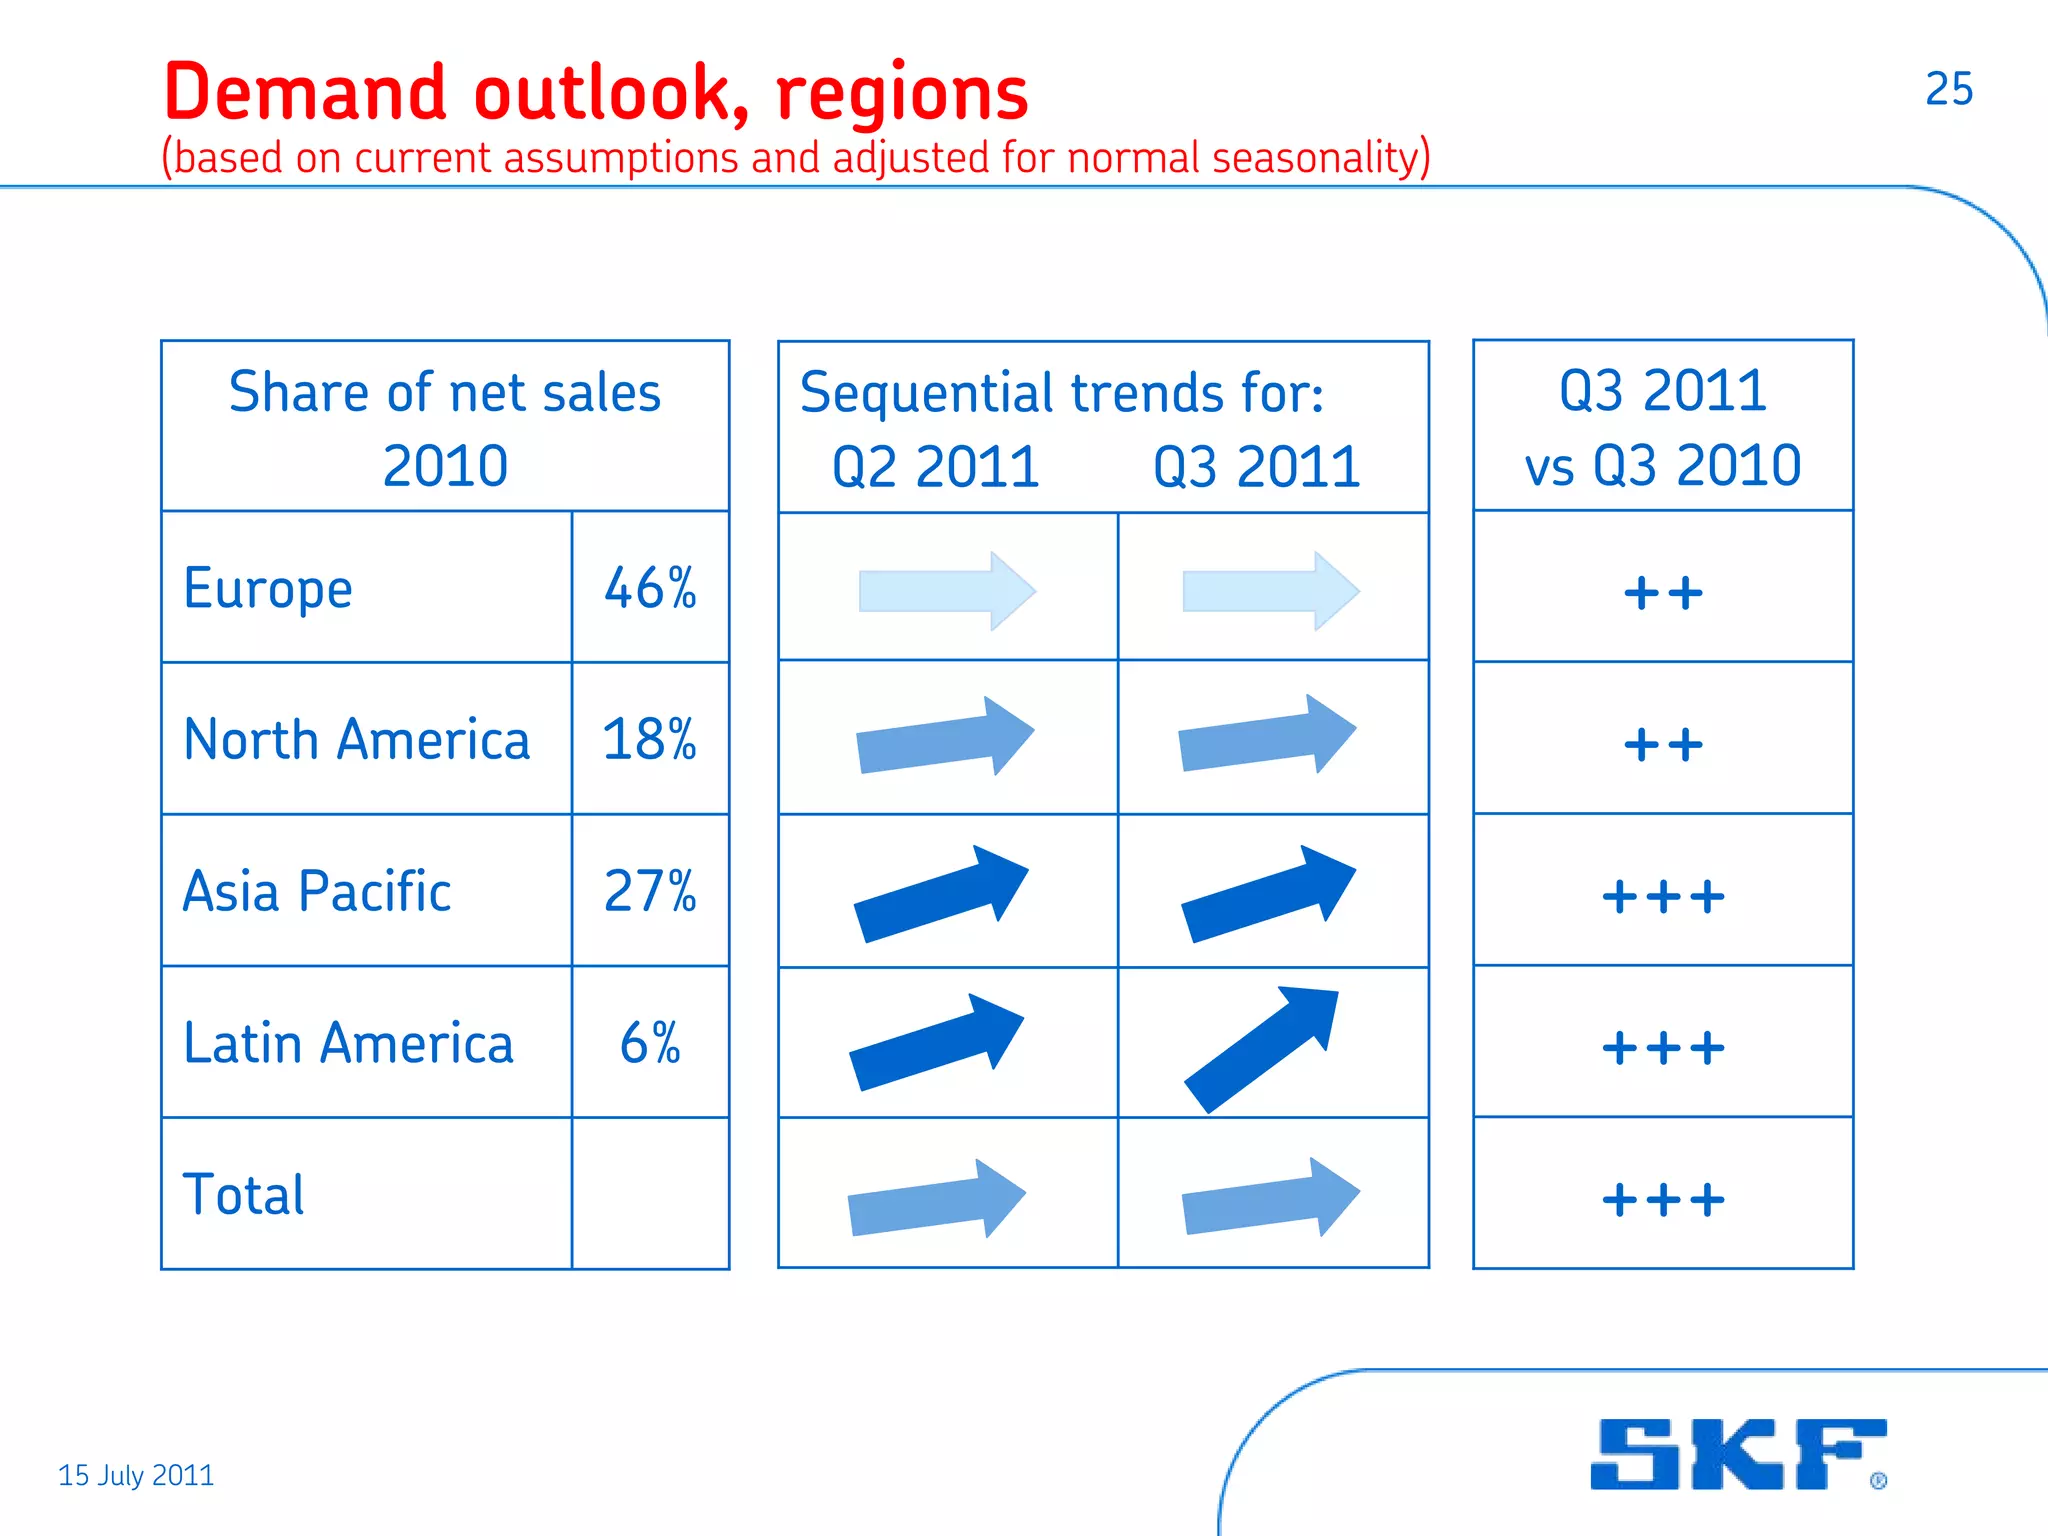
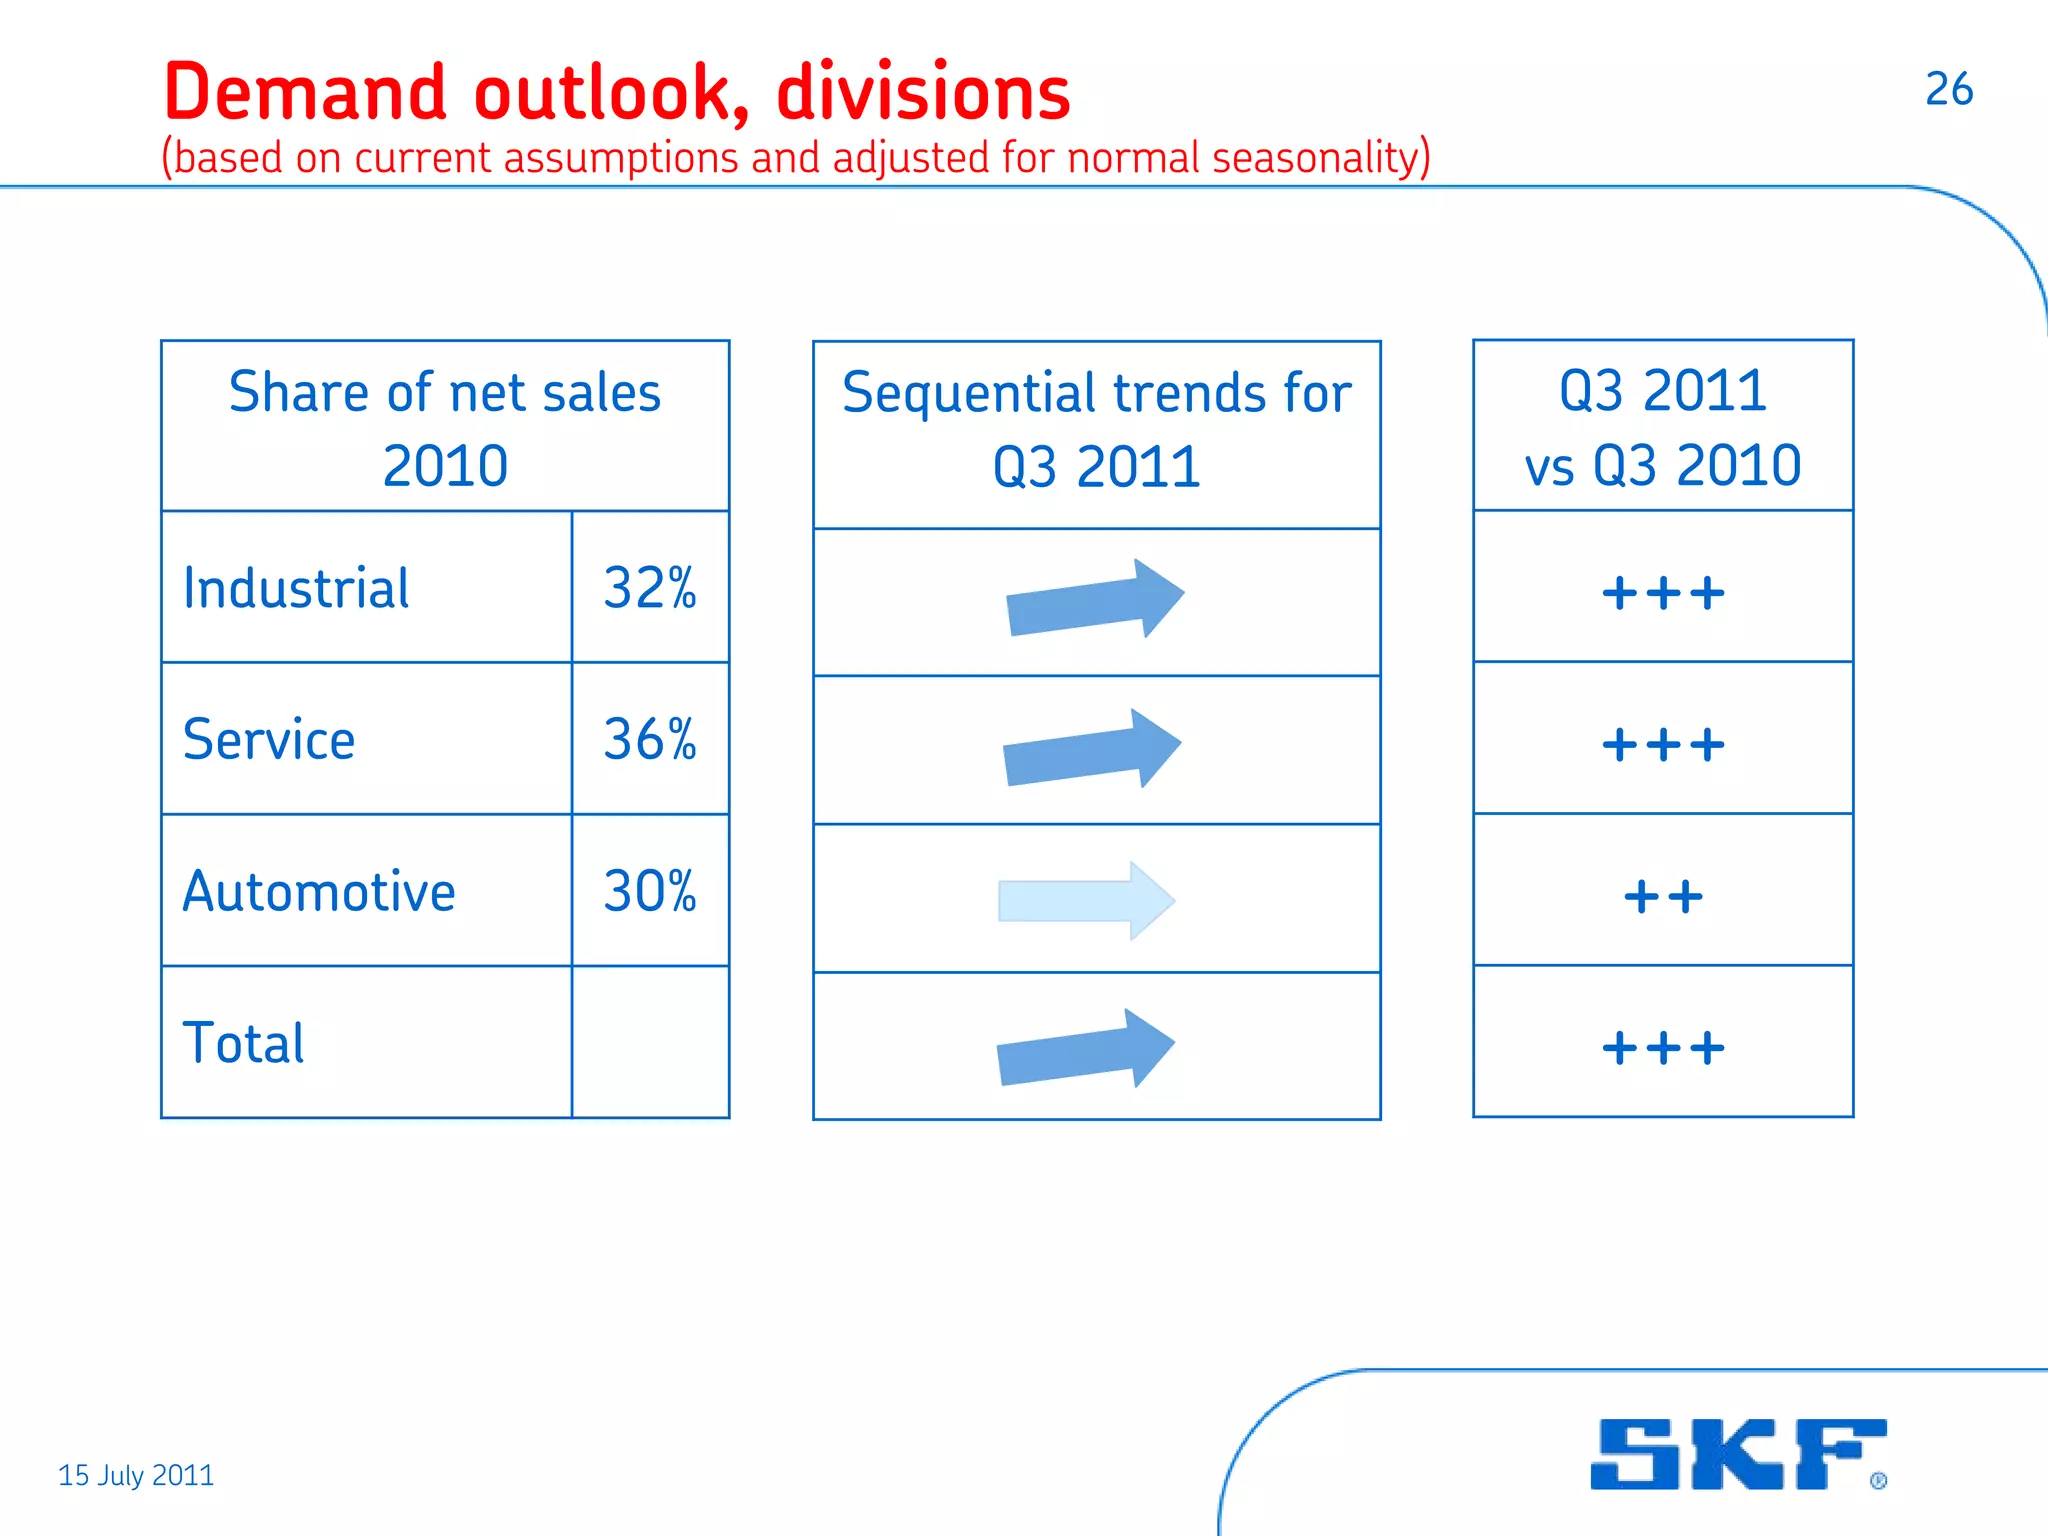
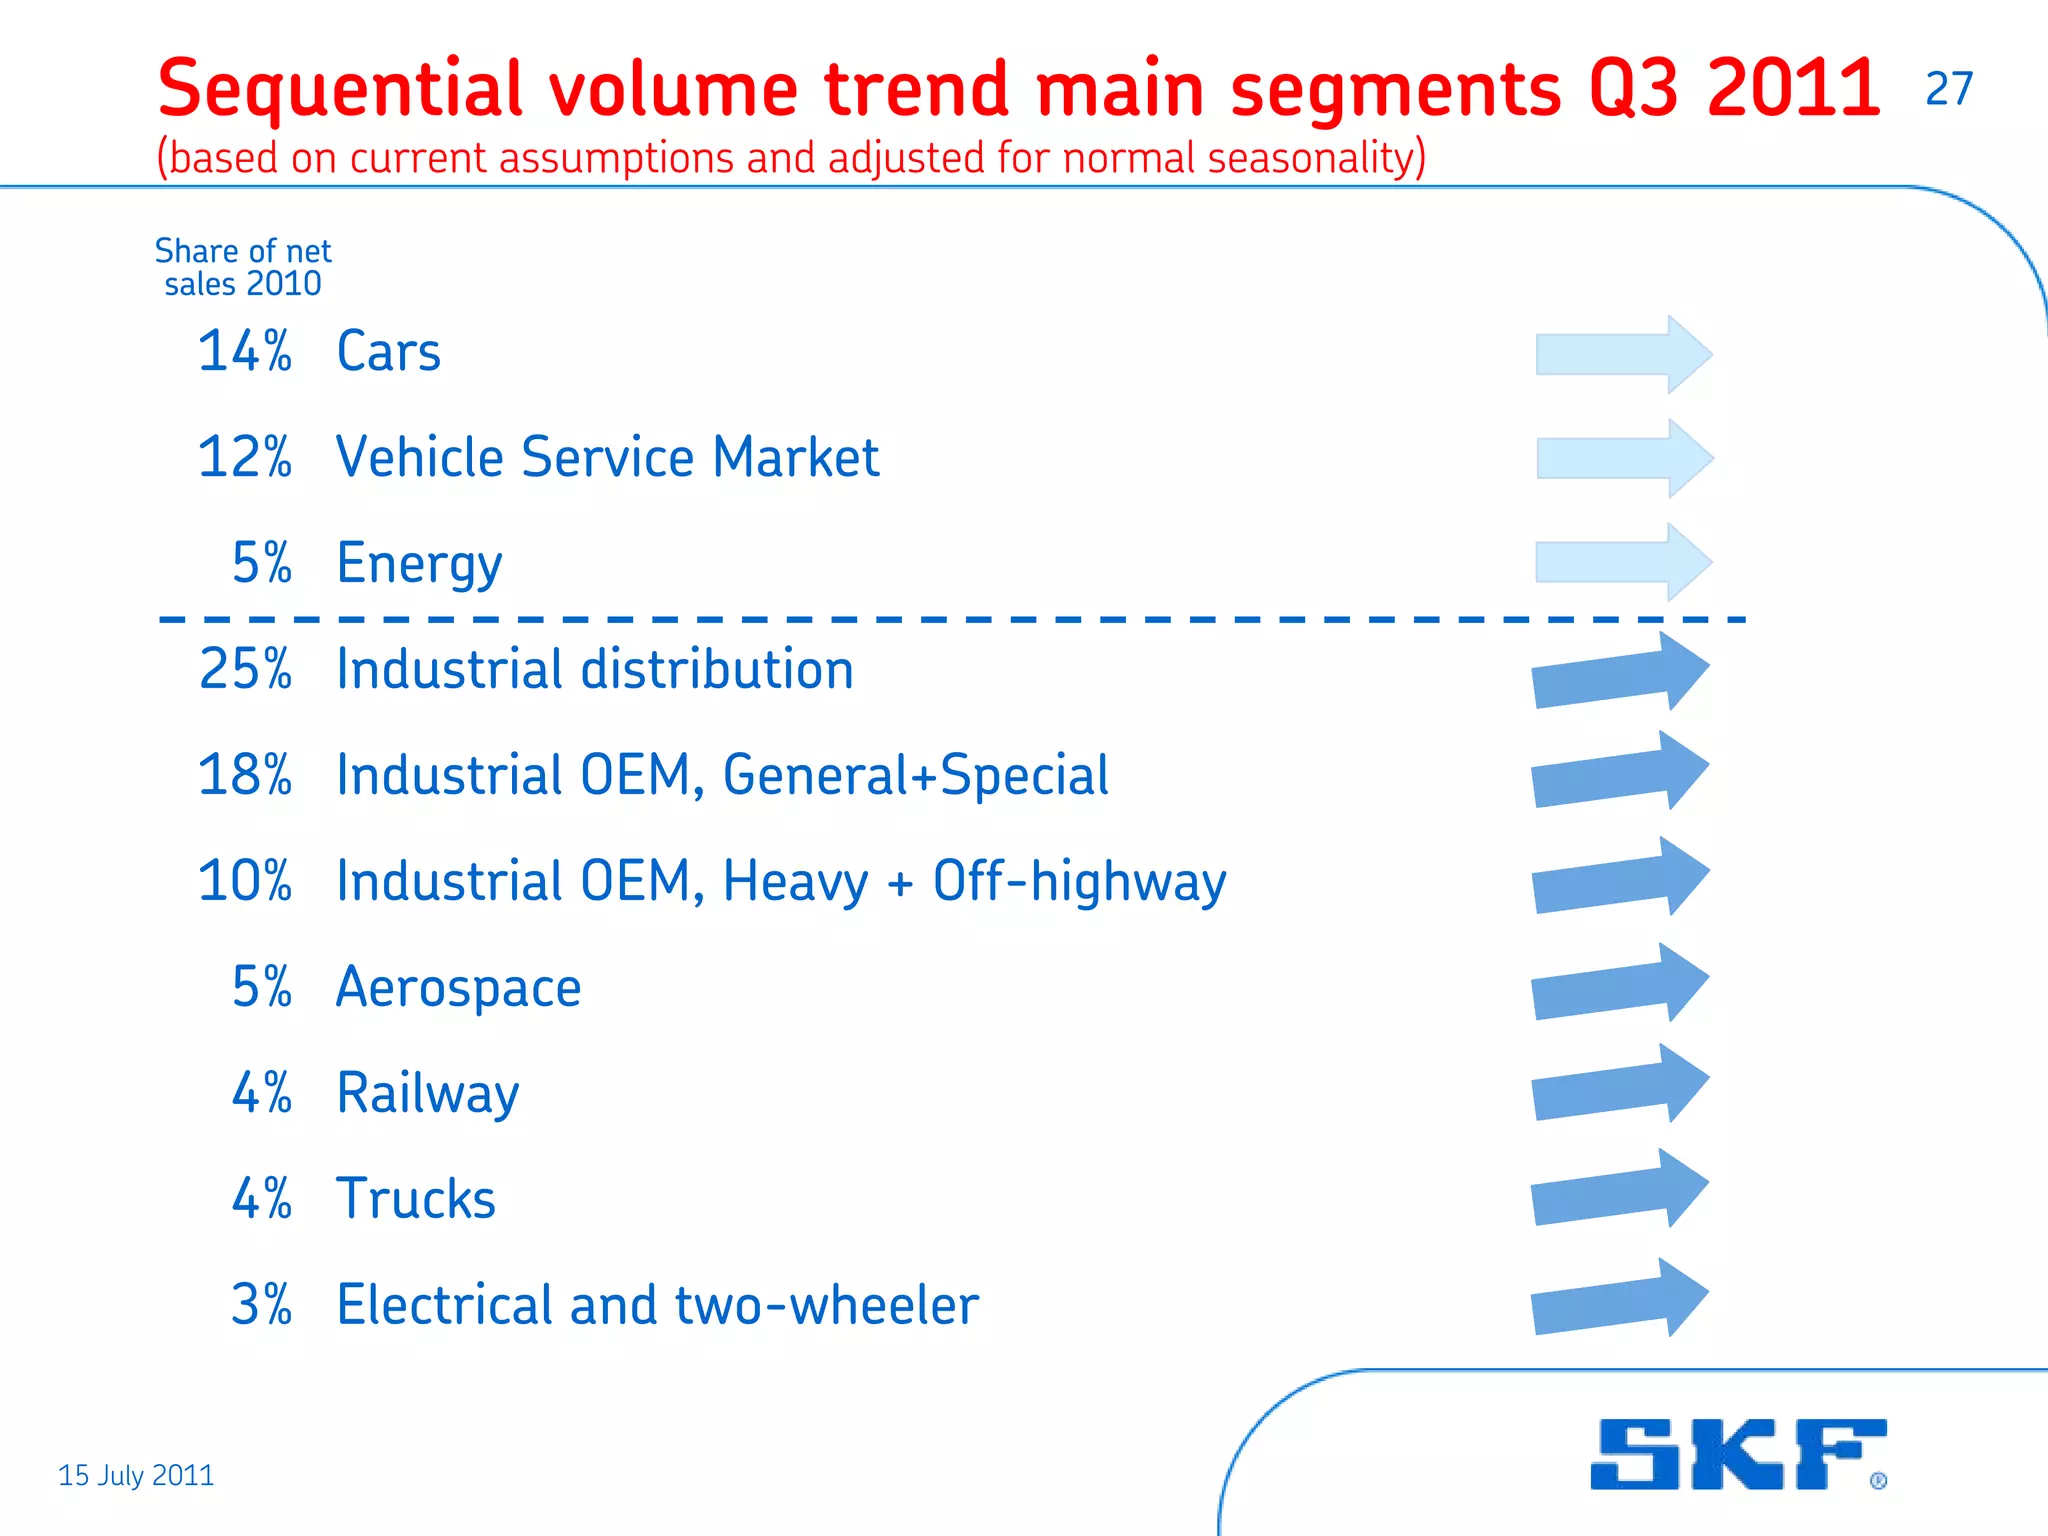
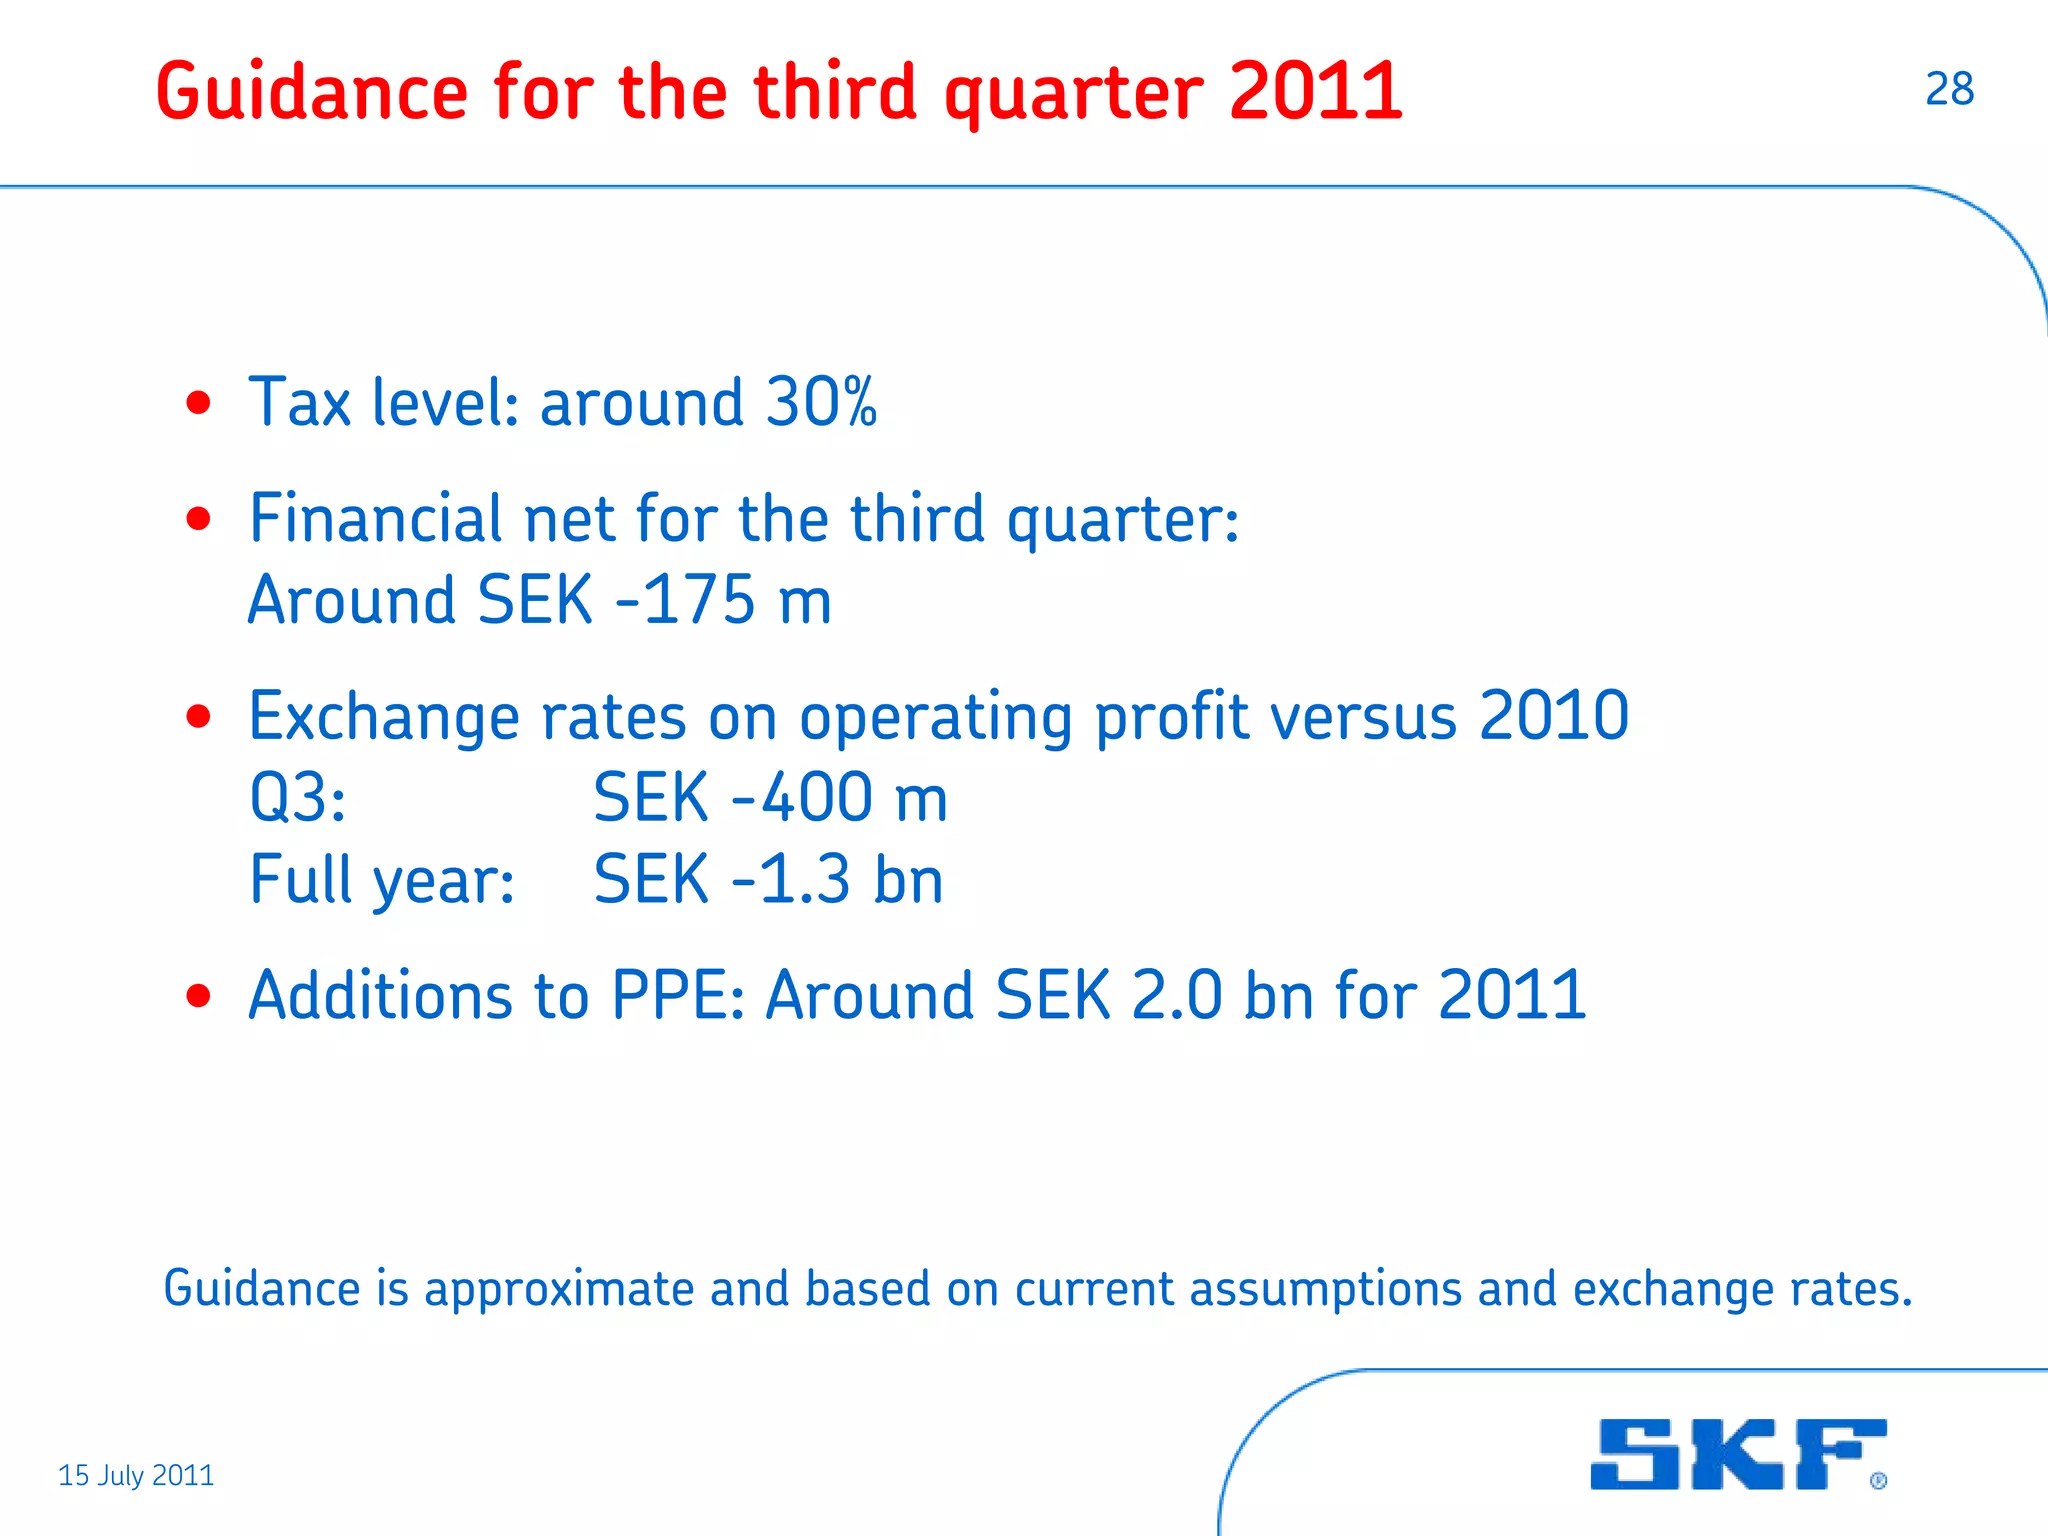
- The outlook for Q3 2011 calls for demand and manufacturing levels to be higher than the previous year and relatively stable sequentially.