Download to read offline


![vi
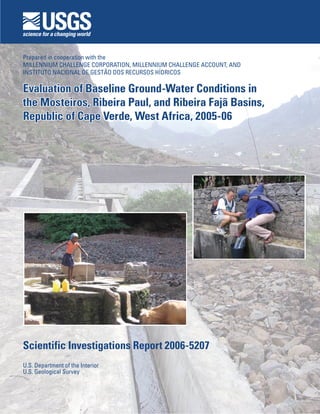
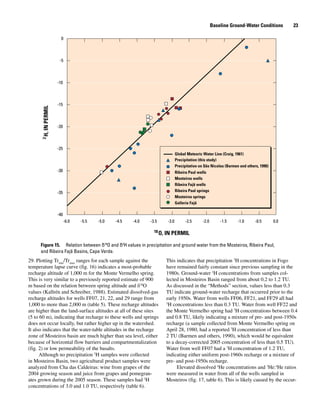
Conversion Factors, Datums, and Abbreviated
Water-Quality Units
Multiply By To obtain
Length
millimeter (mm) 0.0394 inch (in.)
meter (m) 3.2808 foot (ft)
kilometer (km) 0.6215 mile (mi)
Area
square kilometer (km2
) 247.0966 acre
square kilometer (km2
) 0.3861 square mile (mi2
)
Volume
milliliter (ml) 0.0338 ounce, fluid (fl. oz)
liter (L) 2.1133 pint (pt)
liter (L) 1.0566 quart (qt)
liter (L) 0.2642 gallon (gal)
cubic meter (m3
) 264.201 gallon (gal)
cubic centimeter (cm3
) 0.0610 cubic inch (in3
)
cubic meter (m3
) 35.3107 cubic foot (ft3
)
cubic meter (m3
) 1.3079 cubic yard (yd3
)
Flow rate
cubic meter per day (m3
/d) 35.3107 cubic foot per day (ft3
/d)
liter per minute (L/m) 0.2642 gallon per minute (gal/min)
Density
cubic centimeter per gram (cm3
/g) 0.0160 cubic foot per pound (ft3
/lb)
Hydraulic conductivity
meter per day (m/d) 3.2808 foot per day (ft/d)
Hydraulic gradient
meter per kilometer (m/km) 5.2798 foot per mile (ft/mi)
Transmissivity1
meter squared per day (m2
/d) 10.7643 foot squared per day (ft2
/d)
1
Transmissivity: The standard unit for transmissivity is cubic foot per day per square foot times foot of aquifer thick-
ness [(ft3
/d)/ft2
]ft. In this report, the mathematically reduced form, foot squared per day (ft2
/d), is used for conve-
nience.](https://image.slidesharecdn.com/09dc3fa6-04b7-406c-b1bf-836a01a42776-151013105906-lva1-app6891/85/SIR2006_5207-8-320.jpg)


![12 Evaluation of Baseline Ground-Water Conditions, Republic of Cape Verde, West Africa, 2005-06
also increases the permeability of these basaltic lava flows. In
contrast to the basement rocks, the noticeable absence of dikes
cutting across the basalts of the Principal Eruptive Complex
reduces the likelihood of flow barriers, thus further enhancing
the probability of ground-water flow in this layer.
The southern (highest-altitude) part of the Mosteiros
Basin is composed of the Upper Principal Eruptive Complex
associated with Fogo’s upper volcanic cone. In contrast to the
prominent lava flows of the Principal Eruptive Complex, this
layer is dominated by pyroclastic tuffs, lapilli, and agglomer-
ates and is cut by a dense network of basaltic sills and dikes,
which are less transmissive for ground-water flow.
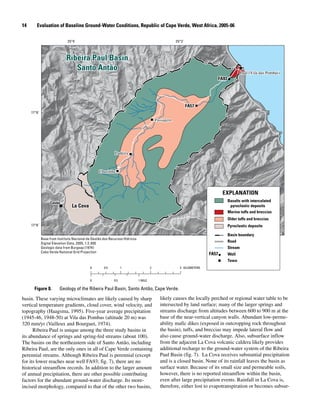
The morphology of the Mosteiros Basin is dominated
by the steep slope of the main volcanic cone and numerous
recent lava flows and cinder cones (fig. 6). Superimposed on
this slope are narrow incised gullies, indicative of the high-
energy runoff from sporadic but intense precipitation events.
Because of the recent creation of the island and the intensity of
runoff, soil layers are generally very thin or non-existent. The
exception to this is along the northeastern coast, where vol-
canic cliffs form a very steep escarpment juxtaposed against
a nearly flat coastal plain with rich volcanically derived soils.
The southern border of the Mosteiros Basin is defined by the
1,000-m near-vertical wall of the island’s 8-km-wide caldera.
This feature acts as a prominent surface-water divide. Water
falling on the north-facing slope of the caldera wall runs off
toward the coastal areas of the Mosteiros Basin; water falling
on the south-facing slope drains into the closed basin of the
caldera. Because the caldera bottom is covered by highly
permeable volcanic deposits (lapilli, scoria, and basalt flows)
and receives relatively large amounts of precipitation, this area
likely provides a substantial amount of recharge to the island’s
ground-water system.
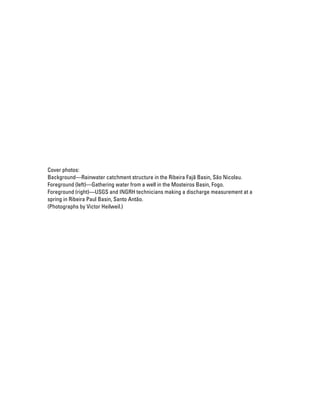
Seven-year (1996-2002) average annual precipitation was
207 mm at the Mosteiros station (75-m altitude), 346 mm at
the Monte Barro station (348-m altitude), and 379 mm at the
Pau Cortado station (460-m altitude) (fig. 5, table 2; Instituto
Nacional de Meteorologia e Geofisica, written commun.,
2005). These data follow the expected trend of higher precipi-
tation rates at higher altitudes. Although precipitation data
for the same 7-year period are not available in the highland
areas of the basin, historical data from the Monte Velha station
(850-m altitude) and the Cha das Caldeiras station (1,650-m
altitude) indicate that annual rainfall exceeds 1,000 mm in the
upper reaches of the basin (Barmen and others, 1990). This
precipitation supplies sporadic runoff and flow to gullies, but
there are no perennial streams in the basin. The range from 72
to 453 mm/yr at Mosteiros (table 2) shows the annual variabil-
ity in precipitation within the basin.
Ribeira Paul Basin, Santo Antão
Santo Antão is the northwesternmost island of Cape
Verde and the Ribeira Paul Basin is located on its northeast-
ern coast (fig. 1). The basin area, not including the adjacent
La Cova closed basin, is 15 km2
(table 1). The basin’s verti-
cal relief of 1,500 m (fig. 7) is much less than that of the
Mosteiros Basin; however, it is a more deeply incised basin,
as indicated by its higher average topographic slope of about
38 degrees, compared to 23 and 27 degrees for the other two
study basins.
As with the Mosteiros Basin, the geology of the Ribeira
Paul Basin is dominated by volcanic rocks. In contrast to
Fogo, the island of Santo Antão is geologically much older,
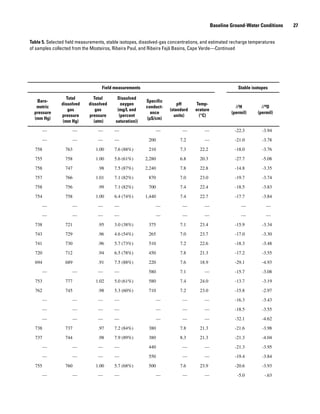
Table 2. Annual precipitation at selected stations in the Mosteiros, Ribeira Paul, and Ribeira Fajã Basins, Cape Verde
[Precipitation reported in millimeters]
Station name Mosteiros
Monte
Barro
Pau
Cortado
Figeuiral
Paul
Passagem Covão Posto
Canto
Fajã
Cachaço
Altitude
(meters)
75 348 460 200 300 810 410 575 715
Basin Mosteiros Mosteiros Mosteiros Paul Paul Paul Fajã Fajã Fajã
1996 72 435 207 599 1054 773 187 251 319
1997 149 213 272 246 525 509 237 371 378
1998 158 410 366 276 384 409 230 213 296
1999 453 504 620 1,044 1,391 958 430 386 541
2000 76 117 196 695 1,172 940 366 187 344
2001 279 403 731 263 314 438 189 207 352
2002 264 339 259 443 658 636 411 501 677
7-year average 207 346 379 509 785 666 293 302 415
12 Evaluation of Baseline Ground-Water Conditions, Republic of Cape Verde, West Africa](https://image.slidesharecdn.com/09dc3fa6-04b7-406c-b1bf-836a01a42776-151013105906-lva1-app6891/85/SIR2006_5207-22-320.jpg)


![18 Evaluation of Baseline Ground-Water Conditions, Republic of Cape Verde, West Africa, 2005-06
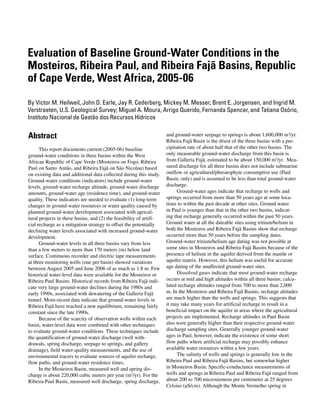
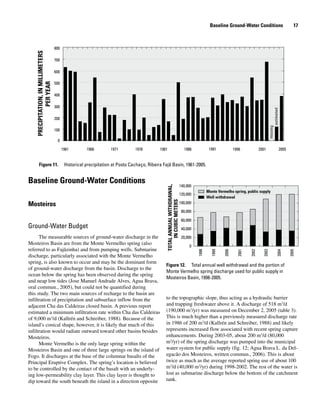
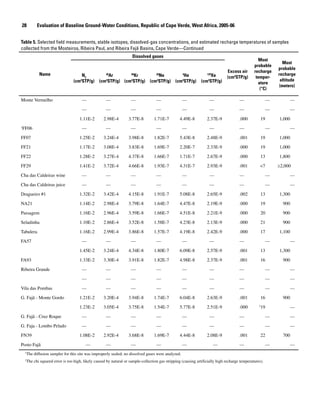
Table 3. Records of selected springs and streams in the Mosteiros, Ribeira Paul, and Ribeira Fajã Basins, Cape Verde
[Altitude: m, meters; Discharge: m3
/d, cubic meters per day; Specific conductance: μS/cm, microsiemens per centimeter at 25 degrees Celsius; Temperature:
°C, degrees Celsius; Measurement Agency: INGRH, Instituto Nacional de Gestão dos Recursos Hídricos; MAAP, Ministero do Ambiente, Agricultura e
Pescas; SAF, Servicio Autonimo Fajã; USGS, U.S. Geological Survey; —, no data]
Site name Basin
Latitude Longitude
(degree/minute/
second)
Altitude
(m)
Discharge
measurement
method
Date
Springs
Tabulera Paul 170654 0250328 830 Bucket stopwatch 8/4/2005
NA21 Paul 170834 0250234 440 Bucket stopwatch 8/6/2005
Dragueiro #1 Paul 170816 0250231 270 Bucket stopwatch 12/8/2005
Dragueiro #2 Paul 170823 0250231 250 Bucket stopwatch 12/7/2005
Seladinha Paul 170711 0250249 460 Bucket stopwatch 12/5/2005
Bucket stopwatch 12/8/2005
Passagem Paul 170756 0250232 300 Bucket stopwatch 8/4/2005
Monte Vermelho Mosteiros 150254 0242147 5 — 8/12/2005
Bucket stopwatch; tank level 12/2/2005
Galleria Fajã (Total) Fajã 163845 0241927 250 Tank level, in-line flow meter 8/18/2005
Tank level, in-line flow meter 12/13/2005
G. Fajã Monte Gordo Irrigation Fajã 270 In-line flow meter stopwatch 12/13/2005
G. Fajã Monte Gordo Domestic Fajã 270 In-line flow meter stopwatch 12/13/2005
G. Fajã Cruz Roque Branch Fajã 267 Bucket stopwatch 12/13/2005
G. Fajã Lombo Pelado Branch Fajã 265 Bucket stopwatch 12/13/2005
Streams
Ribeirinha Paul 170819 0250231 250 Bucket stopwatch 12/6/2005
Morcas Paul 170628 0250302 710 Bucket stopwatch 12/5/2005
Oio de Agua Paul 170624 0250320 955 Bucket stopwatch 12/5/2005
João Deaninha Paul 170648 0250227 740 Bucket stopwatch 12/5/2005
Covada Clara Paul 170646 0250239 550 Bucket stopwatch 12/5/2005
Cabouco Paul 170755 0250245 560 Bucket stopwatch 12/5/2005
Cringa stream channel Paul 170656 0250259 560 Bucket stopwatch 12/8/2005
Cringa - Cha de Padre Cima Paul 170654 0250256 480 Bucket stopwatch 12/8/2005
Zeagrios # 3 Paul 170629 0250234 680 Bucket stopwatch 12/5/2005
Zeagrios # 4 Paul 170629 0250232 700 Bucket stopwatch 12/5/2005
Bucket stopwatch 12/8/2005
Zeagrios # 5 Paul 170636 0250230 750 Bucket stopwatch 12/8/2005
Calistrinho Paul 170650 0250243 500 Estimate only 12/5/2005
Calistrinho A Paul 170659 0250242 500 Bucket stopwatch 12/8/2005
Calistrinho B Paul 170659 0250242 500 Pygmy flow meter 12/8/2005
Fidelo Diversion Paul 170715 0250258 430 Estimate only 12/5/2005
Pygmy flow meter 12/9/2005
Cabelão Diversion Paul 170714 0250256 430 Bucket stopwatch 12/9/2005
Ribeira Cabelão Paul 170702 0250258 425 Bucket stopwatch 12/5/2005
170717 0250256 420 Pygmy flow meter 12/9/2005
Cha João Vaz A Paul 170734 0250248 360 Bucket stopwatch 12/9/2005
Cha João Vaz B Paul 170734 0250248 355 Bucket stopwatch 12/9/2005
Cha João Vaz C Paul 170734 0250248 350 Pygmy flow meter 12/9/2005
Cha João Vaz D Paul 170734 0250248 355 Pygmy flow meter 12/9/2005
1
Spring and stream sites measured by the INGRH on December 5-6, 2005, do not have specific-conductance measurements because of equipment failure.](https://image.slidesharecdn.com/09dc3fa6-04b7-406c-b1bf-836a01a42776-151013105906-lva1-app6891/85/SIR2006_5207-28-320.jpg)
![20 Evaluation of Baseline Ground-Water Conditions, Republic of Cape Verde, West Africa, 2005-06
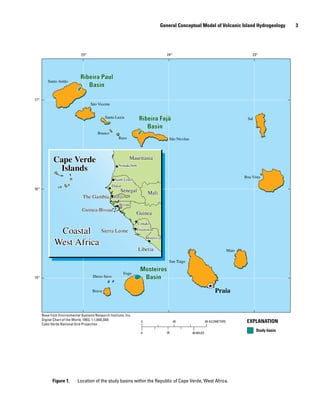
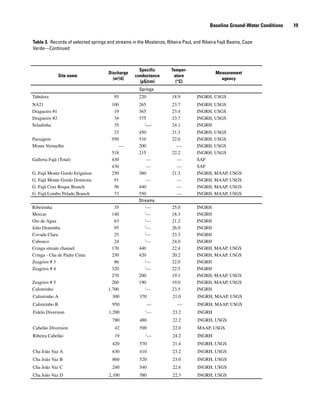
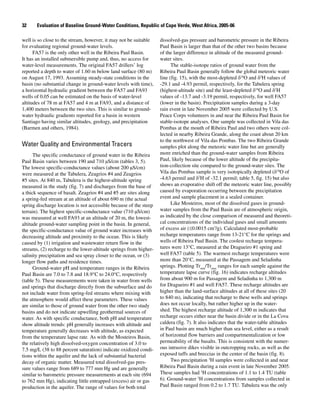
Table 4. Records of selected wells in the Mosteiros, Ribeira Paul, and Ribeira Fajã Basins, Cape Verde
[Altitude, Depth of well, and Water level below land surface: m, meters; Pumping rate: m3
/d, cubic meters per day; —, no data]
Well name Basin
Latitude Longitude
(degree/minute/second)
Altitude
(m)
Year
Drilled
Depth of
well (m)
Water level
below land
surface (m)
Date
Pumping
rate
(m3
/d)
FF06 Mosteiros 150133 0241908 60 70.6 63.50 12/02/05
FF07 Mosteiros 150221 0242014 20 35.8 17.61 12/02/05
17.57 12/03/05
17.73 03/31/06
FF21 Mosteiros 150246 0242104 40 54.3 — 08/11/05 180
39.46 12/03/05
FF22 Mosteiros 150246 0242104 40 53.0 39.55 03/11/98
39.55 08/11/05
39.25 12/03/05 470
FF29 Mosteiros 150229 0242043 60 2005 61.9 51.94 06/01/05
51.46 08/12/05
51.45 12/03/05
51.48 03/31/06
FA57 Paul 170820 0250140 80 1993 43.0 1.60 08/17/93
1.29 01/07/94
— 08/08/05 192
— 12/07/05
FA93 Paul 170849 0250104 20 2004 21.1 16.15 07/14/04
15.40 08/25/04
16.24 08/05/05
15.34 12/08/05
16.40 06/15/06
FN12 Fajã 163839 0241935 250 1978 146.0 111.10 10/14/78
FN21 Fajã 163813 0242014 310 1980 128.0 115.07 04/10/79
FN39 Fajã 163950 0241914 80 1980 104.3 51.54 01/10/80
52.58 10/30/82
72.43 11/02/98
72.81 02/18/02
73.12 12/13/05
73.11 03/08/06
FN41 Faja 163758 0242042 490 1980 189.2 173.40 03/10/80
163809 0242025 Dry 03/08/06](https://image.slidesharecdn.com/09dc3fa6-04b7-406c-b1bf-836a01a42776-151013105906-lva1-app6891/85/SIR2006_5207-30-320.jpg)


![26 Evaluation of Baseline Ground-Water Conditions, Republic of Cape Verde, West Africa, 2005-06
Table 5. Selected field measurements, stable isotopes, dissolved-gas concentrations, and estimated recharge temperatures of
samples collected from the Mosteiros, Ribeira Paul, and Ribeira Fajã Basins, Cape Verde
[Sample type: precip, precipitation; Altitude: m, meters; Barometric pressure and Total dissolved gas pressure: mm Hg, millimeters mercury; Dissolved
oxygen: mg/L, milligrams per liter, %, percent saturation; Specific conductance: μS/cm, microsiemens per centimeter at 25 degrees Celsius; Temperature: °C,
degrees Celsius; Dissolved gases: cm3
STP/g, cubic centimeters per gram at standard temperature and pressure; E, exponent; Most probable recharge tempera-
ture and altitude: average of most probable range based on intersection of Trmin
/Trmax
line with temperature lapse band; —, no data; , less than; ≥, greater than
or equal to]
Name
Sample
type
Basin
Latitude Longitude
Date
Altitude
(m)(degree/minute/ second)
Monte Vermelho Spring Mosteiros 150254 242147 10/29/1987 5
8/12/2005
12/2/2005
1
FF06 Well Mosteiros 150133 0241908 12/2/2005 60
FF07 Well Mosteiros 150221 0242014 12/2/2005 20
FF21 Well Mosteiros 150246 0242104 8/11/2005 40
FF22 Well Mosteiros 150246 0242104 12/3/2005 40
FF29 Well Mosteiros 150229 0242043 12/3/2005 60
Cha das Caldeiras wine Precip. Mosteiros 145830 0242150 2004 1,650
Cha das Caldeiras juice Precip. Mosteiros 145830 0242150 2005 1,650
Dragueiro #1 Spring Paul 170816 0250231 12/8/2005 270
NA21 Spring Paul 170834 0250234 8/6/2005 440
Passagem Spring Paul 170756 0250232 8/4/2005 300
Seladinha Spring Paul 170711 0250249 12/8/2005 460
Tabulera Spring Paul 170654 0250328 8/4/2005 840
FA57 Well Paul 170820 0250140 8/8/2005 80
12/7/2005 80
FA93 Well Paul 170849 0250104 8/5/2005 20
Ribeira Grande Precip. Paul 171049 0250356 11/22/2005 18
11/24/2005
Vila das Pombas Precip. Paul 170851 0250048 11/23/2005 10
G. Fajã - Monte Gordo Spring Fajã 163845 0241927 8/18/2005 270
12/14/2005
G. Fajã - Cruz Roque Spring Fajã 163845 0241927 12/15/2005 267
G. Faja - Lombo Pelado Spring Fajã 163845 0241927 12/15/2005 265
FN39 Well Fajã 163950 0241914 12/13/2005 90
Posto Fajã Precip. Fajã 163829 0242012 9/16/2005 410](https://image.slidesharecdn.com/09dc3fa6-04b7-406c-b1bf-836a01a42776-151013105906-lva1-app6891/85/SIR2006_5207-36-320.jpg)
![Table6.TritiumandheliumconcentrationandestimatedageofsamplescollectedfromtheMosteiros,RibeiraPaul,andRibeiraFajãBasins,CapeVerde
[3
Handprecision:TU,tritiumunits;4
He:cm3
STP/g,cubiccentimeterspergramatstandardtemperatureandpressure;R/Ra
:Measured3
He:4
Heisotopicratiorelativetotheheliumisotopicratioofair;4
Heterr
:
terrigenichelium,cm3
STP/g,cubiccentimeterspergramatstandardtemperatureandpressure;3
Hetrit
:tritiogenichelium,TU,tritiumunits;3
Hetrit
andApparent3
H/3
Heage:rangesbasedonterrigenic3
He:4
He
ratiosbetween1.3x10-5
and1x10-8
;NMF,notmeaningful;—,nodata;±,plusorminus;,lessthan;,greaterthan]
Name
Sample
type
Basin
LatitudeLongitude
Date
3
Hand
precision
(TU)
4
He
(cm3
STP/g)
R/Ra
4
Heterr
(cm3
STP/g)
3
Hetrit
(TU)
Apparent
3
H/3
He
age
(year)
Apparent
recharge
year
(degree/minute/second)
MonteVermelhoSpringMosteiros15025402421478/12/20050.8±0.1—————1
post-1950s
12/2/2005.4±.14.49E-81.0281.0E-100to65to50post-1950s
FF06WellMosteiros150133024190812/2/2005.2±.1—————1
pre-1950s
FF07WellMosteiros150221024201412/2/20051.2±.15.43E-81.8935.02E-9NMFNMF1
post-1950s
FF21WellMosteiros15024602421048/11/2005.3±.12.20E-77.5401.74E-7NMFNMF1
pre-1950s
FF22WellMosteiros150246024210412/3/2005.9±.21.71E-77.0021.26E-7NMFNMF1
post-1950s
FF29WellMosteiros150229024204312/3/2005.2±.14.31E-78.2963.80E-7NMFNMF1
pre-1950s
ChadasCaldeirasWineMosteiros145830024215020043.0±.1——————
ChadasCaldeirasJuiceMosteiros145830024215020051.0±.1——————
Dragueiro#1SpringPaul170816025023112/8/2005.5±.15.08E-81.0391.0E-101to515to45post-1950s
NA21SpringPaul17083402502348/6/2005.7±.14.47E-81.0043.55E-100to0.30to10post-1950s
PassagemSpringPaul17075602502328/4/20051.2±.14.51E-81.2521.0E-106to730to40post-1950s
SeladinhaSpringPaul170711025024912/8/20052.1±.14.23E-8.9981.0E-100to20to15post-1950s
TabuleraSpringPaul17065402503288/4/2005.2±.14.19E-81.0044.89E-100to0.350pre-1950s
FA57WellPaul17082002501408/8/20051.7±.1——————
12/7/2005.9±.16.09E-82.6451.11E-8NMFNMF1
post-1950s
FA93WellPaul17084902501048/5/20051.3±.14.98E-81.0714.39E-100to20to20post-1950s
RibeiraGrandePrecip.Paul171049025035611/24/20051.1±.1——————
ViladasPombasPrecip.Paul170851025004811/23/20051.4±.1——————
G.Fajã-Monte
Gordo
SpringFajã16384502419278/18/2005.2±.16.04E-83.3301.40E-8NMFNMF1
pre-1950s
12/14/2005.0±.15.77E-83.4211.44E-8NMFNMF1
pre-1950s
G.Fajã-CruzRoqueSpringFajã163845024192712/15/2005.0±.1—————1
pre-1950s
G.Faja-Lombo
Pelado
SpringFajã163845024192712/15/2005.0±.1—————1
pre-1950s
FN39WellFajã163950024191412/13/2005.3±.14.44E-81.0031.0E-100to850pre-1950s
1
Apparentrechargeyearisonlybasedon3
Hconcentration.
Baseline Ground-Water Conditions 29](https://image.slidesharecdn.com/09dc3fa6-04b7-406c-b1bf-836a01a42776-151013105906-lva1-app6891/85/SIR2006_5207-39-320.jpg)


This report analyzes baseline groundwater conditions in three basins in Cape Verde - Mosteiros, Ribeira Paul, and Ribeira Fajã - based on existing data and new data collected in 2005-2006. Key findings include: 1) Groundwater levels varied between basins and over time, with some wells showing fluctuations of up to 1.8 meters. 2) Measured groundwater discharge was approximately 220,000 cubic meters/year in Mosteiros, 1,600,000 cubic meters/year in Ribeira Paul, and 150,000 cubic meters/year in Ribeira Fajã. 3) Groundwater ages ranged from over 50 years to within


![11.[40 51]correlates in groundwater quality parameters and textural classes o...](https://cdn.slidesharecdn.com/ss_thumbnails/11-40-51correlatesingroundwaterqualityparametersandtexturalclassesofsoilsinaperi-industrialdistrictofthenigeriandeltaregion-120512235818-phpapp02-thumbnail.jpg?width=640&height=640&fit=bounds)


