The study investigates the microstructures and mechanical properties of medium-Al lightweight steels with varying silicon (Si) content, revealing that Si enhances strength, ductility, and strain hardening. The research indicates that aging treatments affect the microstructure and mechanical properties differently depending on Si content, with the 3Si steel exhibiting the best strength-ductility synergy after short aging. The findings contribute to understanding the role of Si in microstructural evolution and its implications for the applications of lightweight steels.
![Acta Materialia 245 (2023) 118611
Available online 11 December 2022
1359-6454/© 2022 Acta Materialia Inc. Published by Elsevier Ltd. All rights reserved.
Simultaneously enhancing strength-ductility synergy and strain
hardenability via Si-alloying in medium-Al FeMnAlC lightweight steels
Huihui Zhi a,b
, Jinshan Li a,b,*
, Wanmin Li a
, Mohamed Elkot c,d
, Stoichko Antonov c
,
Heng Zhang a
, Minjie Lai a,*
a
State Key Laboratory of Solidification Processing, Northwestern Polytechnical University, Xi’an 710072, China
b
Innovation Center NPU⋅Chongqing, Chongqing 401135, China
c
Max-Planck-Institut für Eisenforschung GmbH, Max-Planck-Str. 1, Düsseldorf 40237, Germany
d
Department of Metallurgical and Materials Engineering, Suez University, Suez 43512, Egypt
A R T I C L E I N F O
Keywords:
Austenitic steels
Long-range ordering
Deformation twinning
Planar slip
Transmission electron microscopy
A B S T R A C T
We studied the initial microstructures, mechanical responses and deformation-induced microstructures of the
medium-Al Fe-21Mn-6Al-1C-xSi (x = 0, 1.5, 3 wt.%) lightweight steels both in their solution-treated and aged
states. Our results reveal that nano-sized long-range ordered domains exist in the solution-treated steels, which
feature L12 type ordering in the 0Si and 1.5Si steels and L′
12 type ordering in the 3Si steel. Aging at 550 ◦
C for 20
h has little effect on the microstructures of the 0Si steel, but leads to κ′
-carbide precipitation in the 1.5Si steel. For
the 3Si steel, aging at 550 ◦
C for 1 h already results in the precipitation of uniformly-distributed nano-sized
κ′
-carbides (4.2 nm). The strength, ductility and strain hardenability of the solution-treated steels all enhance
with increasing Si content. The yield strength (YS) of the aged steels with κ′
-carbides enhances with increasing
aging time, accompanied by the reduction of ductility. The short-time (1 h) aged 3Si steel exhibits excellent
strength-ductility synergy, with YS > 900 MPa and total elongation > 50%. The increase in YS with Si addition
originates from the grain boundary, solid-solution and order strengthening. For the 0Si steel, the strain hardening
is governed by the evolution of high-density dislocation walls and microbands. The occurrence of both dynamic
slip band refinement (DSBR) and twinning-induced plasticity effects in the 3Si steel accounts for the increase of
strain hardenability with Si-alloying. The DSBR effect still exists and the progressively-formed slip bands are
homogeneously distributed in the short-time aged 3Si steel, explaining its high ductility.
1. Introduction
In the past decades, high-Mn austenitic steels have attracted much
attention for automotive applications due to their superior mechanical
properties [1]. The chemical compositions of typical high-Mn austenitic
steels normally consist of 18–30 wt.% Mn, <12 wt.% Al and 0.6–1.8 wt.
% C [2]. In the case of low Al content (0–3 wt.%), such steels exhibit
twinning-induced plasticity (TWIP) effect due to the occurrence of
deformation twinning during their plastic deformation [3]. As
increasing Al content reduces the mass density of such steels by ~1.3%
per 1 wt.% Al [2], the particular steels with medium (4–7 wt.%) and
high (8–12 wt.%) Al contents are commonly designated as austenitic
lightweight steels [2,4–6].
Previous studies [2,6–8] suggested that the addition of Al promoted
the formation of ordered structures. Depending on the degree of
ordering, the ordered structures, including long-range ordered (LRO)
domains and κ′
-carbides (off-stoichiometric (Fe, Mn)3AlCx) with an L′
12
structure, lead to a wide range of increase in yield strength [2,6,7]. For
example, Yao et al. [7] reported that the yield strength of a
Fe-30Mn-9Al-1.2C (wt.%) lightweight steel was increased by ~500 MPa
after aging at 600 ◦
C for 24 h due to the precipitation of ordered
κ′
-carbides. It has been revealed that the ordered structures can form
during aging at 470–700 ◦
C in lightweight steels containing 7–10 wt.%
Al, or even during quenching after solution-treatment when the Al
content exceeds 10 wt.% [9]. However, an excessive increase of the Al
content or long-time aging often leads to the formation of other complex
microstructures such as a lamellar κ-carbides/α-ferrite structure, B2
(FeAl) and D03 (Fe3Al) brittle intermetallic compounds, and β-Mn along
grain boundaries, deteriorating the ductility of high-Al lightweight
steels [1,10,11]. Additionally, a high Al content also results in the
* Corresponding authors at: State Key Laboratory of Solidification Processing, Northwestern Polytechnical University, Xi’an 710072, China.
E-mail addresses: ljsh@nwpu.edu.cn (J. Li), lai@nwpu.edu.cn (M. Lai).
Contents lists available at ScienceDirect
Acta Materialia
journal homepage: www.elsevier.com/locate/actamat
https://doi.org/10.1016/j.actamat.2022.118611
Received 19 October 2022; Received in revised form 8 December 2022; Accepted 10 December 2022](https://image.slidesharecdn.com/simultaneouslyenhancingstrengthductilitysynergyandstrain-240730105301-f602a5c4/85/Simultaneously-enhancing-strength-ductility-synergy-and-strain-pdf-1-320.jpg)
![Acta Materialia 245 (2023) 118611
Available online 11 December 2022
1359-6454/© 2022 Acta Materialia Inc. Published by Elsevier Ltd. All rights reserved.
Simultaneously enhancing strength-ductility synergy and strain
hardenability via Si-alloying in medium-Al FeMnAlC lightweight steels
Huihui Zhi a,b
, Jinshan Li a,b,*
, Wanmin Li a
, Mohamed Elkot c,d
, Stoichko Antonov c
,
Heng Zhang a
, Minjie Lai a,*
a
State Key Laboratory of Solidification Processing, Northwestern Polytechnical University, Xi’an 710072, China
b
Innovation Center NPU⋅Chongqing, Chongqing 401135, China
c
Max-Planck-Institut für Eisenforschung GmbH, Max-Planck-Str. 1, Düsseldorf 40237, Germany
d
Department of Metallurgical and Materials Engineering, Suez University, Suez 43512, Egypt
A R T I C L E I N F O
Keywords:
Austenitic steels
Long-range ordering
Deformation twinning
Planar slip
Transmission electron microscopy
A B S T R A C T
We studied the initial microstructures, mechanical responses and deformation-induced microstructures of the
medium-Al Fe-21Mn-6Al-1C-xSi (x = 0, 1.5, 3 wt.%) lightweight steels both in their solution-treated and aged
states. Our results reveal that nano-sized long-range ordered domains exist in the solution-treated steels, which
feature L12 type ordering in the 0Si and 1.5Si steels and L′
12 type ordering in the 3Si steel. Aging at 550 ◦
C for 20
h has little effect on the microstructures of the 0Si steel, but leads to κ′
-carbide precipitation in the 1.5Si steel. For
the 3Si steel, aging at 550 ◦
C for 1 h already results in the precipitation of uniformly-distributed nano-sized
κ′
-carbides (4.2 nm). The strength, ductility and strain hardenability of the solution-treated steels all enhance
with increasing Si content. The yield strength (YS) of the aged steels with κ′
-carbides enhances with increasing
aging time, accompanied by the reduction of ductility. The short-time (1 h) aged 3Si steel exhibits excellent
strength-ductility synergy, with YS > 900 MPa and total elongation > 50%. The increase in YS with Si addition
originates from the grain boundary, solid-solution and order strengthening. For the 0Si steel, the strain hardening
is governed by the evolution of high-density dislocation walls and microbands. The occurrence of both dynamic
slip band refinement (DSBR) and twinning-induced plasticity effects in the 3Si steel accounts for the increase of
strain hardenability with Si-alloying. The DSBR effect still exists and the progressively-formed slip bands are
homogeneously distributed in the short-time aged 3Si steel, explaining its high ductility.
1. Introduction
In the past decades, high-Mn austenitic steels have attracted much
attention for automotive applications due to their superior mechanical
properties [1]. The chemical compositions of typical high-Mn austenitic
steels normally consist of 18–30 wt.% Mn, <12 wt.% Al and 0.6–1.8 wt.
% C [2]. In the case of low Al content (0–3 wt.%), such steels exhibit
twinning-induced plasticity (TWIP) effect due to the occurrence of
deformation twinning during their plastic deformation [3]. As
increasing Al content reduces the mass density of such steels by ~1.3%
per 1 wt.% Al [2], the particular steels with medium (4–7 wt.%) and
high (8–12 wt.%) Al contents are commonly designated as austenitic
lightweight steels [2,4–6].
Previous studies [2,6–8] suggested that the addition of Al promoted
the formation of ordered structures. Depending on the degree of
ordering, the ordered structures, including long-range ordered (LRO)
domains and κ′
-carbides (off-stoichiometric (Fe, Mn)3AlCx) with an L′
12
structure, lead to a wide range of increase in yield strength [2,6,7]. For
example, Yao et al. [7] reported that the yield strength of a
Fe-30Mn-9Al-1.2C (wt.%) lightweight steel was increased by ~500 MPa
after aging at 600 ◦
C for 24 h due to the precipitation of ordered
κ′
-carbides. It has been revealed that the ordered structures can form
during aging at 470–700 ◦
C in lightweight steels containing 7–10 wt.%
Al, or even during quenching after solution-treatment when the Al
content exceeds 10 wt.% [9]. However, an excessive increase of the Al
content or long-time aging often leads to the formation of other complex
microstructures such as a lamellar κ-carbides/α-ferrite structure, B2
(FeAl) and D03 (Fe3Al) brittle intermetallic compounds, and β-Mn along
grain boundaries, deteriorating the ductility of high-Al lightweight
steels [1,10,11]. Additionally, a high Al content also results in the
* Corresponding authors at: State Key Laboratory of Solidification Processing, Northwestern Polytechnical University, Xi’an 710072, China.
E-mail addresses: ljsh@nwpu.edu.cn (J. Li), lai@nwpu.edu.cn (M. Lai).
Contents lists available at ScienceDirect
Acta Materialia
journal homepage: www.elsevier.com/locate/actamat
https://doi.org/10.1016/j.actamat.2022.118611
Received 19 October 2022; Received in revised form 8 December 2022; Accepted 10 December 2022](https://image.slidesharecdn.com/simultaneouslyenhancingstrengthductilitysynergyandstrain-240730105301-f602a5c4/75/Simultaneously-enhancing-strength-ductility-synergy-and-strain-pdf-1-2048.jpg)
![Acta Materialia 245 (2023) 118611
2
remarkable reduction of the Young’s modulus [12,13], and causes
blockage of ladle nozzle during the continuous casting process [14].
High-Al lightweight steels have high stacking fault energies (SFEs),
ranging from 80 to 120 mJ/m2
, due to their high Al content (8–12 wt.%)
[4,15–17]. Consequently, both TWIP and transformation-induced plas
ticity (TRIP) effects are suppressed in such steels and their deformation
mechanism is dominated by dislocation slip. For such steels, the subdi
vision of dislocation structures into slip bands or microbands is
responsible for their strain hardening behavior. The corresponding
phenomenon is often referred to as dynamic slip band refinement
(DSBR) [2,7] or microband-induced plasticity (MBIP) [4,16,18]. In the
case of low-Al TWIP steels, their SFEs are relatively low (18–50 mJ/m2
)
and hence their plastic deformation is characterized by the continuous
formation of deformation twins, leading to the so-called “dynamic
Hall-Petch effect” and increased tensile strength and ductility [19–21].
Nevertheless, TWIP steels normally suffer from low yield strength
(≤~300 MPa). Although short-range ordered (SRO) structures may exist
within the low-Al austenite of such steels, their role in enhancing the
yield strength is negligible [21,22]. To the best of our knowledge, little
attention has hitherto been paid to medium-Al (4–7 wt.%) lightweight
steels, probably due to the lack of ordered structures and the weak TWIP
effect in such steels.
Similar to Al, the addition of Si also reduces the mass density of
austenitic steels, causing ~0.8% reduction in density per 1 wt.% Si [14].
Furthermore, it can alleviate the blockage of ladle nozzle during casting
by increasing the fluidity [14]. Recent ab initio and thermodynamic
calculations suggested that the Si addition energetically favored the
formation of κ′
-carbides and increased the coarsening kinetics of
κ′
-carbides in high-Al lightweight steels [23,24]. Despite its strength
ening effect, the formation of coarse κ′
-carbides was found to reduce the
strain hardening rate and ductility of the austenitic steels [23,24]. This
was ascribed to the shear localization promoted by the coarse κ′
-carbides
[23,24]. On the other hand, however, the Si addition decreases the SFE
of austenitic steels. For instance, the SFE of the Fe-18Mn-0.6C steel (19.3
mJ/m2
) is decreased to 13.8 and 4.8 mJ/m2
with the addition of 1.5 and
3 wt.% Si, respectively, leading to earlier occurrence of TWIP or even
TRIP effect and thus enhanced strain hardening rate and ductility [25,
26]. Thus, it is expected that the Si addition can promote the formation
of ordered structures and the TWIP effect in medium-Al lightweight
steels, where the latter has been verified by Lai et al. [27] in a
solution-treated Fe-26.7Mn-5.6Al-3Si-1C steel. However, the role of Si
in the formation and evolution of the ordered structures as well as their
contributions to the strength in the medium-Al lightweight steels remain
to be elucidated. It is also of particular importance to examine the
development of deformation-induced microstructures and their contri
butions to the strain hardening behavior in the Si-alloyed medium-Al
lightweight steels.
In this study, influences of Si on the microstructures, mechanical
responses and deformation mechanisms of the medium-Al Fe-21Mn-6Al-
1C-xSi (x = 0, 1.5, 3 wt.%) lightweight steels in both their solution-
treated and aged states are investigated. The nominal compositions
are selected by taking into account the compromise between rendering
the SFE value as low as possible [28] and maintaining a sufficient sol
ubility of Si [29]. At first, the initial microstructures of the
solution-treated Fe-21Mn-6Al-1C-xSi steels as well as their evolution
during aging are characterized by using electron backscatter diffraction
(EBSD), transmission electron microscopy (TEM) and three-dimensional
atom probe tomography (3D-APT). Afterwards, the
deformation-induced microstructures in these steels, including disloca
tion and twin substructures, are examined by TEM [2]. The SFEs of these
steels are measured through weak-beam dark field (WBDF) imaging [28]
and compared with thermodynamic predictions. Finally, the contribu
tions originating from the Si addition to the yield strength and strain
hardening behavior are discussed based on the experimental results and
available theoretical models.
2. Materials and experimental details
Three ingots with nominal compositions of Fe-21Mn-6Al-1C-xSi (x =
0, 1.5, 3 wt.%) were prepared by vacuum induction melting under high-
purity Ar atmosphere. The measured compositions of these as-cast in
gots are as shown in Table 1. The as-cast ingots were homogenized at
1100 ◦
C for 3 h, and subsequently hot-rolled (HR) and cold-rolled (CR)
to 1.5 mm-thick sheets. The CR steel sheets were then solution-treated at
1050 ◦
C to obtain equiaxed grain structures with nearly equivalent grain
sizes. For simplicity, hereafter, the three solution-treated steels are
referred to as 0Si, 1.5Si, 3Si, respectively. Some of the solution-treated
samples were isothermally aged at 550 ◦
C for different durations (0.5
h, 1 h, 5 h, 10 h, 20 h, 40 h) followed by water quenching. These samples
are hereafter designated by their Si content and aging time, e.g., the 0Si
steel sample aged for 0.5 h is referred to as 0Si-ag0.5.
Dog-bone-shaped tensile specimens with a gauge length of 8 mm, a
width of 2 mm and a thickness of 1.5 mm were cut from the solution-
treated and the aged sheets by electrical discharge machining (EDM).
Quasi-static uniaxial tensile tests were performed at an initial strain rate
of 1 × 10− 3
s− 1
in a Zwick/Roell Z5.0TN universal testing machine,
where a laser extensometer was used to monitor the tensile strain. At
least three tensile specimens were deformed until fracture for each
material state to confirm reproducibility. To reveal the microstructural
evolution during straining, interrupted tensile tests to engineering
strains of 1%, 3%, 14% and 35% were performed as well. Microhardness
measurement was carried out using a LECO AMH55 automatic hardness
tester with a nominal load of 500 gf and dwell time of 15 s. Each
microhardness value reported in this work is the average of 20 mea
surements. The shear modulus and Poisson’s ratio were measured at
ambient temperature using a resonant frequency and damping analyzer,
while the mass density was determined based on Archimedes’s princi
ple. Differential scanning calorimetry (DSC) measurements were carried
out in a Netzsch DSC 404 C device using specimens weighing ~10 mg.
The microstructural characterization via EBSD was performed in a
Zeiss Sigma 300 scanning electron microscope, where the specimens
were prepared by mechanical polishing using a colloidal silica suspen
sion. The geometrically necessary dislocation (GND) density was
derived from the EBSD data using the MTEX toolbox implemented in
Matlab [30,31]. For TEM analysis, ~0.5 mm-thick flat specimens pre
pared using EDM were first ground into foils with a thickness of <100
µm and then further thinned until perforation by double-jet electro
chemical polishing at 20 V and -30 ◦
C with an electrolyte consisting of
90 vol.% methanol and 10 vol.% perchloric acid. TEM observation was
carried out in a FEI Tecnai G2 F20 instrument operated at 200 kV. APT
experiments were performed on a local electrode atom probe instrument
(CAMECA LEAP 5000 XR) in voltage-pulsing mode with a repetition rate
of 200 kHz, a pulse fraction of 15%, and a specimen temperature of 60 K.
The APT data were reconstructed and analyzed using the AP Suite 6.1
software (CAMECA software suite). APT specimens were prepared from
a [001] oriented grain using the focused ion beam (FIB) lift-out tech
nique in a FEI Helios NanoLab 600i instrument.
3. Results
3.1. Initial microstructures
3.1.1. Solution-treated specimens
EBSD analyses reveal that the solution-treated 0Si, 1.5Si and 3Si
steels are all composed of a single face-centered cubic (FCC) γ austenite
phase. Fig. 1(a, e, i) are the EBSD inverse pole figure (IPF) maps of the
0Si, 1.5Si and 3Si steels, respectively, where equiaxed γ grain structures
including many annealing twin boundaries (indicated by white lines)
are shown. It is also illustrated that there is no obvious texture in these
steels. The GND density maps, Fig. 1(b, f, j), reveal that these steels are
fully recrystallized and their mean GND densities are 1.1 × 10¹²
, 1.2 ×
1012
and 1.7 × 10¹²
m− 2
, respectively. The nearly equivalent grain sizes
H. Zhi et al.](https://image.slidesharecdn.com/simultaneouslyenhancingstrengthductilitysynergyandstrain-240730105301-f602a5c4/85/Simultaneously-enhancing-strength-ductility-synergy-and-strain-pdf-2-320.jpg)
![Acta Materialia 245 (2023) 118611
3
for the 0Si (D = 48 μm), 1.5Si (D = 49 μm) and 3Si (D = 45 μm) steels are
obtained by tailoring their holding time (60, 45 and 15 min, respec
tively) at 1050 ◦
C. The measured DSC curves (Supplementary Fig. S1)
show that the solidus (Ts) and liquidus (TL) temperatures of the 0Si steel
are respectively 1356 and 1384 ◦
C, but they reduce to 1269 and 1290 ◦
C
with increasing the Si content to 3 wt.%. As listed in Table 2, the
measured shear modulus (μ) and mass density (ρ) of the 0Si, 1.5Si and
3Si steels also reduce slightly with the increase of Si content, but their
Poisson’s ratio (ν) remains constant at 0.35 for all Si contents.
Fig. 1(c, g, k) show the selected area diffraction patterns (SADPs)
taken along the [001]γ zone axis of the 0Si, 1.5Si and 3Si steels,
respectively, where satellite reflections are seen in the vicinity of some
Table 1
Chemical compositions (wt.%) of the three as-cast Fe-21Mn-6Al-1C-xSi (x=0, 1.5, 3 wt.%) steel ingots measured by wet-chemical analysis.
Steel Element concentration (wt.%)
Mn Al C Si Ni Cu P S Fe
0Si 21.11 5.84 1.00 0.01 0.01 0.016 <0.01 0.005 Bal.
1.5Si 21.71 5.99 1.00 1.68 0.01 <0.01 <0.01 0.006 Bal.
3Si 21.75 6.00 0.94 3.28 0.01 <0.01 <0.01 0.006 Bal.
Fig. 1. Microstructures of the solution-treated (a–d) 0Si, (e–h) 1.5Si and (i–l) 3Si steels. (a, e, i) EBSD IPF map. D is the mean grain size with annealing twin
boundaries taken into account. (b, f, j) GND density map derived from the EBSD data, where ρG is the mean value. (c, g, k) Selected area diffraction patterns recorded
along the [001]γ zone axis, where the primary γ diffraction spots and weak superlattice reflections from the long-range ordered domains are indexed. (d, h, l) TEM
dark-field images taken from the (100)LRO or (110)LRO reflection of the long-range ordered domains.
Table 2
Measured shear modulus (μ), Poisson’s ratio (ν), mass density (ρ), solidus (TS)
and liquidus (TL) temperatures of the solution-treated Fe-21Mn-6Al-1C-xSi
(x=0, 1.5, 3 wt.%) steels.
Steel μ (GPa) ν ρ (g/cm3
) TS (◦
C) TL (◦
C)
0Si 63.13 ±
0.44
0.35 ±
0.01
7.16 ±
0.02
1356 1384
1.5Si 62.15 ±
0.49
0.35 ±
0.01
7.05 ±
0.01
Not
measured
Not
measured
3Si 58.28 ±
0.45
0.35 ±
0.01
6.96 ±
0.02
1269 1290
H. Zhi et al.](https://image.slidesharecdn.com/simultaneouslyenhancingstrengthductilitysynergyandstrain-240730105301-f602a5c4/85/Simultaneously-enhancing-strength-ductility-synergy-and-strain-pdf-3-320.jpg)
![Acta Materialia 245 (2023) 118611
4
of the primary γ diffraction spots. In addition, superlattice reflections are
visible at the 1/2 {220}γ or/and 1/2 {200}γ positions, indicating that
long-range atomic ordering already occurs during quenching after so
lution treatment. For the 0Si and 1.5Si steels, it should be noted that only
at the 1/2 {220}γ positions there exist superlattice reflections, as shown
in Fig. 1(c, g). This means that only the {110} type ordering occurs in
these two steels. It is also illustrated that the superlattice reflections in
the 1.5Si steel are more intense than those in the 0Si steel (Supple
mentary Fig. S2), indicating that the degree of {110} type ordering in
creases with the Si addition. This type of ordering has been revealed to
be an interstitially-disordered L12 type ordered crystal structure in a
previous study [32]. In contrast to the 0Si and 1.5Si steels, the super
lattice reflections occur at both the 1/2 {220}γ and the 1/2 {200}γ po
sitions in the 3Si steel and their reflection intensity ratio I(110)LRO/I(100)
LRO is ~0.91 (Fig. 1(k) and Supplementary Fig. S2). It was demonstrated
that interstitial C ordering at the (1
2, 1
2, 1
2) body-centered site of the or
dered L12 structure was responsible for such an intensity difference
between the {100}LRO and {110}LRO superlattice reflections [33]. This
means that the ordering in the 3Si steel is characterized by a L′
12 type
ordered crystal structure.
The satellite reflections adjacent to the {200}γ and {220}γ primary
diffraction spots have been revealed to originate from the lattice mod
ulation caused by the concentration fluctuations of solute Al and C
atoms (especially C atoms) in a previous study [33]. This implies that
spinodal decomposition occurs during quenching after solution treat
ment. Fig. 1(d, h, l) are TEM dark-field (DF) images taken from the
{100}LRO or {110}LRO superlattice reflections, showing that the
nano-sized LRO domains are homogeneously distributed in the γ matrix.
It can be deduced that the modulated ordered structures in the present
solution-treated 0Si, 1.5Si and 3Si steels are formed due to the occur
rence of spinodal decomposition and ordering of C and Al.
3.1.2. Aged specimens
Fig. 2(a) shows the effect of aging time on the Vickers microhardness
of the 0Si, 1.5Si and 3Si steels. It is illustrated that the microhardness of
these steels in their solution-treated states increases from 160 HV (0Si)
through 186 HV (1.5Si) to 212 HV (3Si) with the Si addition. For the 0Si
steel, its microhardness is found to remain almost unchanged upon aging
at 550 ◦
C for up to 40 h, implying that there may be no precipitation in
this steel during its aging process. The same situation is present for the
1.5Si steel when the aging time does not exceed 10 h. The further in
crease of the aging time, however, first leads to the slight increase of the
microhardness of this steel, reaching a peak value of 201 HV at 20 h, and
then the decrease of the microhardness, reaching 188 HV at 40 h. In
contrast to the 0Si and 1.5Si steels, the microhardness of the 3Si steel
sharply increases from 212 HV to 340 HV after aging for 1 h, and then
continues to increase with the aging time, reaching a peak value of 491
HV at 10 h. Afterwards, the microhardness of this steel slightly decreases
Fig. 2. Microhardness and microstructures of the aged 0Si, 1.5Si and 3Si steels. (a) Microhardness as a function of aging time for the 0Si, 1.5Si and 3Si steels aged at
550 ◦
C. (b, d, f, h, j) Selected area diffraction patterns recorded along the [001]γ zone axis. (c, e, g, i, k) TEM dark-field images taken from the {110}LRO or
{110}κ’ reflections.
H. Zhi et al.](https://image.slidesharecdn.com/simultaneouslyenhancingstrengthductilitysynergyandstrain-240730105301-f602a5c4/85/Simultaneously-enhancing-strength-ductility-synergy-and-strain-pdf-4-320.jpg)
![Acta Materialia 245 (2023) 118611
5
with increasing the aging time, reaching 429 HV at 40 h, corresponding
to a softening phenomenon caused by over-aging. Thus, it can be
concluded that the addition of Si promotes the age-hardening effect, but,
on the other hand, accelerates its saturation [23].
In austenitic lightweight steels, the age-hardening effect is often
related with the formation and growth of L′
12 type ordered structures, i.
e., nano-sized κ′
-carbides within the γ matrix [23,34,35]. Fig. 2(b–k)
display the SADPs and TEM DF images taken from the {100} or {110}
superlattice reflection of the aged 0Si, 1.5Si and 3Si steels. It is illus
trated that aging at 550 ◦
C for 20 h has little effect on the microstruc
tures of the 0Si steel (Fig. 2(b, c) and Supplementary Fig. S2), verifying
that there is no further precipitation during the aging process of this
steel. Fig. 2(d, e) shows that the microstructures of the 1.5Si steel do not
change either after short-time aging (e.g., 1.5Si-ag1). However, when
the aging time is increased to 20 h, the intensities of the {100} super
lattice reflections become much higher than those of the {110} super
lattice reflections, as revealed in Fig. 2(f) and Supplementary Fig. S2.
This indicates a remarkable increase in the degree of C ordering, i.e.,
converting the L12 type ordered structure into the L′
12 type ordered
structure [32]. Fig. 2(g) demonstrates that in the 1.5Si-ag20 sample the
L′
12 type ordered structures are κ′
-carbides with cuboidal morphologies
[24]. In the case of 3Si steel, aging at 550 ◦
C for 1 h already leads to the
formation of κ′
-carbides, as shown in Fig. 2(h, i). It is also revealed that
the I(110)κ′/I(100)κ′ of the 3Si-ag1 sample is 0.38, lower than that (0.46) of
the 1.5Si-ag20 sample (Supplementary Fig. S2), indicating that the Si
addition promotes the degree of C ordering. Fig. 2(j, k) and
Supplementary Fig. S2 show that the increase of aging time results in the
further decrease of I(110)κ′/I(100)κ′ and the coarsening of the cuboidal
κ′
-carbides.
It should also be noted that the satellite reflections adjacent to the
primary γ diffraction spots occurring in the solution-treated 3Si steel
(Fig. 1(k)) vanishes in the 3Si-ag1 sample (Fig. 2(h)). A similar phe
nomenon was reported in Ref. [33], where the separation between the
satellite reflections and primary diffraction spots was found to become
smaller and smaller and eventually could not be readily resolved due to
the coarsening of the ordered structure after additional aging. Thus, the
disappearance of satellite reflections in the present 3Si steel after
short-time aging actually results from the transformation from L12 type
LRO domains to L′
12 type LRO domains/κ′
-carbides.
3.1.3. Quantification of the ordered structures
Fig. 3 (a–d, f) are the typical inverse fast Fourier transformation
(FFT) images of the 0Si, 0Si-ag20, 1.5Si, 1.5Si-ag1 and 3Si samples,
respectively, showing the L12/L′
12 type LRO domains. It is illustrated
that some of such domains in the same sample are interconnected, which
is actually a typical feature for spinodal decomposition [36]. The
average sizes of these LRO domains determined by measuring more than
200 domains are plotted in Fig. 3(i), which shows that their average
sizes increase slightly from 1.07 through 1.17 to 1.22 nm for the
solution-treated 0Si, 1.5Si and 3Si steels. The volume fractions of the
LRO domains in these steels are 11.3%, 17.3% and 22.2%, respectively,
as displayed in Fig. 3(j). Fig. 3(e, g, h) show the high-resolution TEM
Fig. 3. Atomic-scale characterization of the LRO domains and κ′
-carbides in the solution-treated or aged 0Si, 1.5Si and 3Si steels. (a–d, f) Inverse fast Fourier
transformation images. (e, g, h) High-resolution TEM images, where the insets are the corresponding fast Fourier transformation images. (i) Average size and (j)
volume fraction of the LRO domains or κ′
-carbides as a function of aging time.
H. Zhi et al.](https://image.slidesharecdn.com/simultaneouslyenhancingstrengthductilitysynergyandstrain-240730105301-f602a5c4/85/Simultaneously-enhancing-strength-ductility-synergy-and-strain-pdf-5-320.jpg)
![Acta Materialia 245 (2023) 118611
6
images of the 1.5Si-ag20, 3Si-ag1 and 3Si-ag20 samples, respectively,
where the insets are the corresponding FFT images. In these samples, the
LRO domains have transformed into cuboidal κ′
-carbides, as marked by
dashed squares. The average sizes of the cuboidal κ′
-carbides in the
1.5Si-ag20, 3Si-ag1 and 3Si-ag20 samples are respectively 5.7, 4.2 and
7.9 nm, as shown in Fig. 3(i). Their volume fractions (Fig. 3(j)) are
21.0%, 31.8% and 35.7%, respectively, indicating that both the Si
addition and the increase of aging time promote the formation of
κ′
-carbides.
As reported previously, it is rather difficult to quantitatively resolve
the chemical evolution of nano-sized LRO domains in the solution-
treated lightweight steels [2,24,37] and high entropy alloys [29,36]
using APT, due to their extremely small size and lack of appreciable
partitioning of elements. Here, we only examined the elemental parti
tioning behavior between the κ′
-carbides and γ matrix. Fig. 4(a) displays
the reconstructed 3D-APT atom map of the 3Si-ag1 sample. In this map,
a 7 at.% C iso-concentration surface shown in a magenta color, clearly
distinguishes the C-enriched κ′
-carbides from the C-depleted γ matrix.
Fig. 4(b) is a 2D cross-sectional (C+Al) concentration map extracted
from the 3D reconstruction, where the enrichment of C and Al is clearly
shown in the cuboidal κ′
-carbides with [001] oriented interfaces. The
proximity histogram of the κ′
-carbides derived from all iso-surfaces,
Fig. 4(c), demonstrates that Al and C partition into the nano-sized
κ′
-carbides, where Fe, Mn and Si are rejected. The similar elemental
partitioning behavior was also reported in previous studies [23,24,34,
35]. Table 3 summarizes the chemical compositions of the κ′
-carbides
and γ matrix in the 3Si-ag1 sample derived from the APT data. It is
illustrated that the C content in the present κ′
-carbides is ~11.4 at.%,
which is ~43% lower than that (20 at.%) of the stoichiometric (Fe,
Mn)3AlC κ-carbide. For comparison, the C concentration in the
κ′
-carbides of other lightweight steels are presented in Supplementary
Table S1, which also reveal that the Si addition promotes the parti
tioning of C into κ′
-carbides. The volume fraction of the κ′
-carbides
derived from the APT data using the lever rule is 29.6%, as shown in
Fig. 4(d). This value is in good agreement with that measured by TEM
(Fig. 3(j)).
3.2. Mechanical responses
3.2.1. Solution-treated specimens
Fig. 5(a) shows the typical tensile engineering stress-strain curves of
the solution-treated 0Si, 1.5Si and 3Si steels, which have almost iden
tical grain sizes (Fig. 1). It is illustrated that both the strength and
ductility of these steels increase with the Si addition, indicating that the
strength-ductility trade-off is evaded via Si-alloying. The tensile me
chanical properties of these steels are plotted in Fig. 5(b). As seen in this
figure, the 0.2% offset yield strength (YS) increases from 289 through
343 to 436 MPa and the ultimate tensile strength (UTS) enhances from
641 through 720 to 836 MPa with the Si addition. It is also displayed
that the Si addition leads to the increase in the uniform elongation (UEL)
from 46% through 64% to 78% and the enhancement in the total
elongation (TEL) from 63% through 80% to 95%. The true stress-strain
curves along with the corresponding strain hardening curves of the
solution-treated 0Si, 1.5Si and 3Si steels are plotted in Fig. 5(c). With the
increase of true strain, three strain hardening stages (I, II and III) can be
observed for all of the three steels, as indicated by vertical dashed lines
in Fig. 5(c). The stage II is characterized by the increase of strain
hardening rate and it extends with the Si addition. It should also be
noted that the decrease of strain hardening rate during stage III becomes
slower with the Si addition. These changes in the strain hardening
behavior should be responsible for the significant enhancement of
strength and ductility with the Si addition (Fig. 5(a)). The SEM images of
Fig. 5(d) show that the fracture surfaces of the solution-treated 0Si, 1.5Si
and 3Si steels are all characterized by dimples, indicating that they all
fracture in a ductile mode.
3.2.2. Aged specimens
The typical engineering stress-strain curves of the 0Si, 1.5Si and 3Si
steels after aging at 550 ◦
C for 0.5–20 h are shown in Fig. 6(a), while the
mechanical properties of these aged steels as well as their solution-
treated counterparts are compared in Fig. 6(b). It is illustrated that the
mechanical properties of the 0Si-ag20 and 1.5Si-ag1 steels are almost
identical with those of their solution-treated counterparts. This is
consistent with the results of microhardness measurements (Fig. 2(a)),
implying that the mechanical properties of the aged steels remain almost
constant when the aging treatments have little effect on their LRO do
mains (Fig. 2(b–e)). Nonetheless, when the LRO domains transform into
Fig. 4. APT characterization of the 3Si-ag1 steel. (a) 3D-reconstruction of the APT specimen, where the intragranular κ′
-carbides are highlighted by 7 at.% C iso-
surfaces. (b) A section of the 3D concentration map of C + Al (at.%). (c) Proximity histogram of atom concentrations with respect to the 7 at.% C iso-surface,
quantitatively showing the partitioning behavior of individual elements. (d) Volume fraction of the intragranular κ′
-carbides determined from the APT data using
the lever rule. Here, Cκ′, Cγ and CB are atom concentration within the κ′
-carbide precipitates, γ-austenite matrix and the bulk for the 3Si-ag1 steel, respectively.
Table 3
APT analysis on the chemical constitutions (at.%) of the κ′
-carbide precipitates
and γ-austenite matrix in the 3Si steel after aging at 550 ◦
C for 1 h.
Phase Fe Mn Al Si C
κ′
-carbide 56.23 ±
0.62
15.00 ±
0.51
13.96 ±
0.36
3.35 ±
0.33
11.38 ±
0.48
γ matrix 64.26 ±
0.11
16.76 ±
0.08
9.34 ±
0.14
6.49 ±
0.09
3.11 ±
0.07
H. Zhi et al.](https://image.slidesharecdn.com/simultaneouslyenhancingstrengthductilitysynergyandstrain-240730105301-f602a5c4/85/Simultaneously-enhancing-strength-ductility-synergy-and-strain-pdf-6-320.jpg)
![Acta Materialia 245 (2023) 118611
7
κ′
-carbides during aging, the mechanical properties of the aged steels
change significantly, as displayed in Fig. 6(a, b). For instance, aging for
20 h leads to the formation of κ′
-carbides in the 1.5Si steel (Fig. 2(f, g)),
which increases its YS from 343 to 442 MPa but decreases its TEL from
80% to 30%. The facture surface of the 1.5Si-ag20 steel, Fig. 6(d), shows
both intergranular fracture features (brittle fracture mode) and dimples
(ductile fracture mode). As demonstrated in Supplementary Fig. S3(a–c),
the former is due to the formation of brittle phases along some FCC grain
boundaries.
In the case of the 3Si steel, aging for as short as 0.5 h already results
in the formation of κ′
-carbides. When the aging time is no longer than 5
h, the YS of the 3Si steel is found to enhance significantly with the in
crease of aging time, where the increments in its YS after aging for 0.5, 1
and 5 h are respectively 356, 491 and 734 MPa. Although the ductility
decreases with increasing aging time, the UEL and TEL of the 3Si-ag0.5
steel (52% and 67%) as well as the 3Si-ag1 steel (40% and 55%) are
actually still rather high. The fracture surface, which is characterized by
large numbers of dimples, and the obvious necking of the 3Si-ag1 steel
(Fig. 6(d)) also allude to its high ductility. Thus, the 3Si-ag0.5 and 3Si-
ag1 steels actually exhibit excellent strength-ductility synergy. Fig. 6(c)
shows the true stress-strain curves and strain hardening curves of these
two steels. It is illustrated that their strain hardening stage II is also
characterized by the increase of strain hardening rate, resembling that of
their solution-treated counterpart. Also noted is that their stage II ex
tends to large true strains (> 20%) followed by sluggish reduction of the
strain hardening rate over a strain range of >15% within stage III, which
should be responsible for their high ductility and UTS (929 and 1040
MPa for the 3Si-ag0.5 and 3Si-ag1, respectively). When the aging time is
increased to 5 h, however, the TEL of the corresponding aged 3Si steel (i.
e., 3Si-ag5) reduces to below 10%, as displayed in Fig. 6(a, b). It is also
illustrated that further increasing the aging time leads to nearly com
plete loss of ductility, although the YS of the corresponding aged 3Si
steels reaches above 1100 MPa. No necking occurs in such aged steels
and their fracture surfaces are characterized by intergranular brittle
fracture features (Fig. 6(d)). Supplementary Fig. S3(d–i) demonstrate
that the intergranular brittle fracture presumably originates from the
massive formation of intergranular brittle phases in these steels.
With respect to the mechanical properties of the present Si-alloyed
steels, a comparison with the other single- and dual-phase lightweight
steels as well as conventional TWIP steels [38–59] is shown on the Ashby
plot of UTS × TEL versus YS in Fig. 7(a). The corresponding data can be
found in Supplementary Table S2. It is demonstrated that the excellent
combinations of strength and ductility distinguish the 3Si, 3Si-ag0.5 and
3Si-ag1 steels from other steels. The changes in YS and UEL after the
addition of a certain alloying element in various austenitic lightweight
steels [5,59–64] are plotted in Fig. 7(b), where the corresponding data
for the present Si-alloyed steels are included for comparison. As seen in
this figure, the steels with Al, Cu, Ni, Mo, Cr or Ti addition all suffer from
the strength-ductility trade-off dilemma when compared to their coun
terparts without the corresponding alloying element, i.e., the increase in
YS is accompanied by the decrease in UEL and vice versa. By contrast,
the Si addition is revealed to lead to the evasion of such dilemma in the
medium-Al lightweight steels. Obviously, the increase in strength after
the Si addition should be correlated with the formation of LRO domains
or k′
-carbides for the present Si-alloyed steels. To clarify the origin of
their enhanced ductility, the evolution of their microstructures upon
Fig. 5. Mechanical properties and fracture surfaces of the solution-treated 0Si, 1.5Si and 3Si steels. (a) Tensile engineering stress-strain curves. (b) Tensile properties
as a function of Si content. (c) True stress-strain curves and corresponding strain hardening curves. (d) SEM images of the fracture surfaces.
H. Zhi et al.](https://image.slidesharecdn.com/simultaneouslyenhancingstrengthductilitysynergyandstrain-240730105301-f602a5c4/85/Simultaneously-enhancing-strength-ductility-synergy-and-strain-pdf-7-320.jpg)
![Acta Materialia 245 (2023) 118611
8
Fig. 6. Mechanical properties and fracture surfaces of the aged 0Si, 1.5Si and 3Si steels. (a) Tensile engineering stress-strain curves. (b) Tensile properties as a
function of aging time. (c) True stress-strain curves and corresponding strain hardening curves of the 3Si-ag0.5 and 3Si-ag1 steels. (d) SEM images of the fracture
surfaces for the 1.5Si-ag20, 3Si-ag1 and 3Si-ag20 steels.
Fig. 7. Comparisons of mechanical properties. (a) Ashby plot of UTS × TEL versus YS for single- and dual-phase lightweight steels as well as conventional TWIP
steels. The experimental data for the Fe-Mn [39,40], Fe-Al [38], Fe-Mn-C [43–49], Fe-Mn-Al-Si [50–53], Fe-Mn-Al-C [44,54–57,59] and Fe-Mn-Si-C [41,42,58] steels
are compared with those for the present Si-alloyed steels. (b) Changes in the YS and UEL after the addition of a certain alloying element in various austenitic
lightweight steels, where the results derived from the experimental data for Al [59,61], Cu [60], Ni [62], Mo [5], Cr [63], Ti [64] are compared with those for Si.
H. Zhi et al.](https://image.slidesharecdn.com/simultaneouslyenhancingstrengthductilitysynergyandstrain-240730105301-f602a5c4/85/Simultaneously-enhancing-strength-ductility-synergy-and-strain-pdf-8-320.jpg)
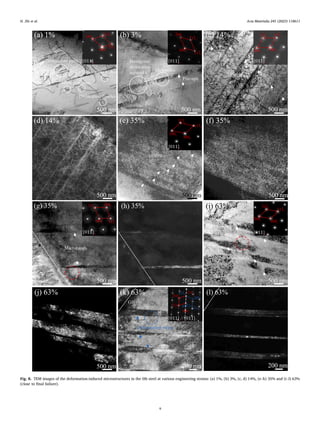
![Acta Materialia 245 (2023) 118611
10
deformation is examined below.
3.3. Microstructural evolution upon deformation
Fig. 8 shows the evolution of deformation-induced microstructures
in the 0Si steel with the accumulation of engineering strain. When the
strain reaches 1%, planar slip features and planar dislocation configu
rations such as dislocation multi-junctions, dislocation pairs and dislo
cation nodes occur, as displayed in Fig. 8(a). More complex planar
dislocation configurations, such as dislocation pile-ups, dislocation
multiples and hexagonal dislocation networks, are formed when the
strain is increased to 3% (Fig. 8(b)). With further increasing the strain to
14%, such dislocation configurations develop into highly-dense dislo
cation arrays (Fig. 8(c, d)), forming the so-called high-density disloca
tion walls (HDDWs) [65]. It is also illustrated that the HDDWs with
highly localized dislocation activities are formed on {111}γ coplanar slip
systems and they act as strong barriers against the dislocation gliding on
other active slip systems. Similar phenomena were observed in other
austenitic lightweight steels and Hadfield steels as well [65–67]. Fig. 8
(e, f) show that the microstructural evolution with increasing strain from
14% to 35% is characterized by the multiplication of the HDDWs and the
increase in their thickness. The latter is expected to result from the
interaction between the HDDWs and their adjacent slip activities [66,
67]. In between the HDDWs, there are dislocation tangles and dynamic
recovery is expected to occur as well. At the same strain level, a few
microbands parallel to the primary slip planes are also found (Fig. 8(g,
h)). Such bands were reported to be developed from HDDWs during
deformation [65,68,69]. When the strain is increased to 63%, more such
microbands are formed and their thickness reaches up to ~500 nm
(Fig. 8(i, j)). Additionally, Fig. 8(k) shows an area containing deforma
tion twins as verified by their SADP. The TEM DF image of Fig. 8(l)
reveals that the hundreds of nanometers-thick twins visible in Fig. 8(k)
are actually twin bundles consisting of several thinner parallel twins.
Given that the deformation twins only occur near the fracture surface,
their contribution to the overall ductility and strain-hardenability is
expected to be very limited. This means that the strain-hardenability of
the 0Si steel is mainly contributed by the dynamic formation of HDDWs
and parallel microbands, i.e., the MBIP effect revealed in the
Fe-13.93Mn-2.58Al-1.30C Hadfield steel [66,67] exists here as well.
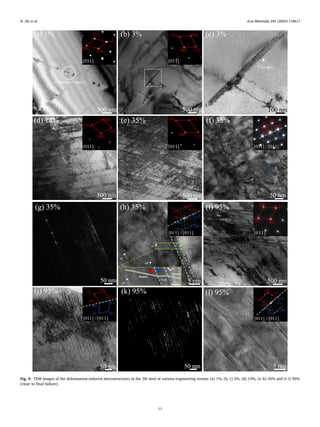
The deformation-induced microstructures of the 3Si steel are shown
in Fig. 9. Upon straining to 1%, planar slip bands containing dislocation
pairs occur on various {111}γ slip planes, as displayed in Fig. 9(a). The
number of planar slip bands increases with increasing the strain to 3%
and the dislocation activities are almost fully localized into these bands
(Fig. 9(b)). Thus, extended dislocation pile-ups occur within the indi
vidual bands (Fig. 9(c)). The further increase of the strain leads to
further multiplication of the planar slip bands and the increase in the
number of dislocations within the individual bands, as displayed in
Fig. 9(d) for 14% engineering strain. Also noted are that the distribution
of the planar slip bands is relatively homogeneous and most non-
coplanar bands cross through each other, indicating that the planar
slip bands cannot prevent the slip transmission [2,70]. Upon further
increasing the strain to 35%, as shown in Fig. 9(e), high-density planar
slip bands occur and their distribution is still relatively homogeneous.
Thus, the slip band structure actually undergoes dynamic refinement
(DSBR effect [2,6]), reducing the spacing between the slip bands to
~100 nm. In addition, Fig. 9(f) shows an area containing deformation
twins, as identified by their SADP and TEM DF image (Fig. 9(g)). The
high-resolution TEM image of Fig. 9(h) reveals that these twins are fairly
thin (<5 nm) and a few stacking faults (SFs) are formed as well. The
number of deformation twins increases with the further increase of
strain. When the strain is increased to 95%, the deformation-induced
microstructures are dominated by both high-density slip bands (Fig. 9
(i)) and deformation twins (Fig. 9(j–l)). As illustrated in the
high-resolution TEM image of Fig. 9(l), the individual deformation twins
are still fairly thin (<20 nm). Thus, both the DSBR and TWIP effects are
responsible for the extraordinary strain-hardenability of the 3Si steel.
For comparison, the deformation-induced microstructures of an aged
steel, 3Si-ag1, are displayed in Fig. 10, which reveals that the defor
mation mechanism of this steel is prevailed by planar slip. At the early
stage of its plastic deformation, the dislocation activities are found to be
localized in a series of discrete planar slip bands generated along various
{111}γ planes (Fig. 10(a, b)). Within the individual bands, extended
dislocation pile-ups occur as well (Fig. 10(b)), similar to that in the 3Si
steel. As illustrated in Fig. 10(c–e), the evolution of dislocation micro
structures with the accumulation of strain in the 3Si-ag1 steel is char
acterized by the multiplication of the planar slip bands as well as the
progressive refinement of the slip band spacing. This process proceeds
until the final stage of plastic deformation with the strain reaching up to
55%. It should be noted that the distribution of the progressively-formed
slip bands in the present 3Si-ag1 steel is relatively homogeneous, which
is different from that in the Fe-30Mn-9Al-1.2C-1.5Si lightweight steel
with a similar strength level [24]. In the latter steel, the large κ′
-carbides
(~11.5 nm) cause non-uniform distribution of the slip bands, which
leads to severe strain localization and premature failure at a strain of
~20% [24]. It should also be noted that deformation twins are absent in
the 3Si-ag1 steel during its entire plastic deformation process, implying
that the strain-hardenability of this steel is primarily contributed by the
DSBR effect.
Fig. 11(a) shows the mean slip band spacing measured from TEM
images as a function of true strain in the 3Si and 3Si-ag1 steels, where
the error bars represent the in-homogeneities in the deformation mi
crostructures originating from locally varying stress states [2]. It is
illustrated that the mean slip band spacing reduces with the accumula
tion of strain in both steels, corresponding to the DSBR effect. The dif
ference between them lies in that the mean slip band spacing for the 3Si
steel is smaller than that for the 3Si-ag1 steel at each strain level. This
implies that the DSBR effect in the former is more pronounced than that
in the latter. The thickness distributions of the deformation twins in the
deformed 0Si and 3Si steels are plotted in Fig. 11(b). For the 0Si steel,
the deformation twins, only occurring near the fracture surface, are
revealed to have a wide range of thickness, ranging from 5 to 60 nm. The
mean twin thickness for this steel is ~29.0 nm. For the 3Si steel, how
ever, the maximum twin thickness is less than 20 nm and the mean twin
thicknesses for the 35%- and 95%-strained samples are ~1.8 and ~4.2
nm, respectively. Thus, the mean thickness of the deformation twins in
the 3Si steel is much smaller than that in the 0Si steel as well as that
(~25 nm) in the Fe-22Mn-0.6C TWIP steel [71].
4. Discussion
4.1. Formation of L′
12 type ordered structures promoted by Si-alloying
The results demonstrate that L12 type ordered nano-domains are
formed in the 0Si and 1.5Si steels during quenching following solution
treatments (Fig. 1(c, d, g, h)). In such domains, the interstitial C atoms
were claimed to be randomly distributed [32]. The increase of Si con
centration is revealed to promote the ordering of C in the L12 type or
dered nano-domains and hence the conversion of L12 type ordering into
L′
12 type ordering [32,33], leading to the formation of L′
12 type ordered
nano-domains in the solution-treated 3Si steel (Fig. 1(k, l)). Indeed, the
fact that the Si addition promotes the formation of L′
12 type ordered
structures is also verified by the aging products in the present Si-alloyed
steels. As shown in Fig. 3, the κ′
-carbides with a L′
12 crystal structure are
formed during aging in the 1.5Si-ag20, 3Si-ag1 and 3Si-ag20 steels,
while they are absent in the 0Si steel even after aging for 20 h.
Previously reported experimental results have demonstrated that
high contents of Al and C are essential for the formation of LRO domains
or κ′
-carbides in high-Al lightweight steels [1]. This is in line with the
present discovery that Al and C are enriched in the κ′
-carbides (Fig. 4
and Table S1). As revealed by ab initio calculations, the local atomic
ordering associated with the formation of LRO domains or κ′
-carbides
H. Zhi et al.](https://image.slidesharecdn.com/simultaneouslyenhancingstrengthductilitysynergyandstrain-240730105301-f602a5c4/85/Simultaneously-enhancing-strength-ductility-synergy-and-strain-pdf-10-320.jpg)
![Acta Materialia 245 (2023) 118611
12
very probably originates from the strong C-Al bonding [72]. Recent
studies also suggested that Si increased the activities of Al and C in the
austenite matrix of high-Al lightweight steels [34]. This explains why
the Si addition promotes the formation of L′
12 type ordered structures
(with enrichment of Al and C) in the present Si-alloyed steels. Further
more, both experimental results and ab initio calculations showed that
there was a repulsive interaction between C and Si [34], accounting for
the depletion of Si within the κ′
-carbides (Fig. 4(c)). Similar phenomena
were also reported in a near-α Ti-6Al alloy [73,74], where O was found
to promote the atomic ordering of Al and the subsequent Ti3Al precip
itation although it partitioned into the α-phase matrix.
4.2. Role of Si-alloying in enhancing yield strength
As illustrated in Fig. 5, the YS of the 1.5Si and 3Si steels is higher than
that of the 0Si steel, i.e., the addition of Si enhances the YS. Here, we
reveal the role of Si-alloying in enhancing the YS by taking the 3Si steel
as an example. Apart from the solid-solution strengthening (σss) and
grain boundary strengthening (σgb), the order strengthening (σorder) and
coherency strengthening (σcoh) contribute to the YS of the 0Si and 3Si
steels as well due to the existence of LRO nano-domains in these steels.
The occurrence of dislocation pairs in the deformed 0Si and 3Si steels
(Figs. 8(a) and 9(a)) implies that the LRO nano-domains in these steels
are cut through by the moving dislocations [2]. On the other hand, since
the misfit between the matrix and LRO nano-domains is rather low [8,
24], the σcoh is negligible here. Thus, the yield strength σy of the 0Si and
3Si steels can be expressed using the following equation [36],
σy = σ0 + σss + σgb + σorder (1)
where σ0 is the friction stress.
To assess the contribution of grain boundary to the YS, a series of 0Si
and 3Si samples were solution-treated for different times at 1050 ◦
C to
reach different grain sizes. Given that atomic ordering in lightweight
steels only occurs during quenching [2], the degree of ordering in either
the 0Si or the 3Si samples is expected to be constant irrespective of their
grain size. By fitting the experimental data using the Hall-Petch (HP)
relationship σgb = Kd− 1/2
(Supplementary Fig. S4), the HP coefficient K
and the summation of (σ0 + σss + σorder) for the 0Si steel are estimated to
be 462 MPa⋅μm− 0.5
and 230 MPa, respectively, while for the 3Si steel
these two values are respectively 636 MPa⋅μm− 0.5
and 338 MPa.
Therefore, σgb for the 0Si (D = 48 μm) and 3Si (D = 45 μm) steels is
respectively ~66 and ~95 MPa. By comparing the above quantitative
results between the 0Si and 3Si steels, the increments Δσgb and Δ(σss +
σorder) induced by the addition of 3 wt.% Si are calculated to be 29 and
108 MPa, respectively. However, due to the difficulty in resolving the
chemical composition of the nano-sized L12 or L′
12 LRO domains (Figs. 1
and 3) [2,24], it is not yet possible to quantitatively estimate the indi
vidual contribution of the solid-solution strengthening (Δσss) and order
strengthening (Δσorder).
Since the composition of the κ′
-carbides in the 3Si-ag1 steel has been
obtained via APT measurements (Fig. 4), the σorder of this steel can be
calculated by the following formula [8,24],
σorder =
M
N
γAPB
b
̅̅̅̅̅
Vf
√
[ ̅̅̅̅̅̅̅̅̅̅̅̅̅̅̅̅
12γAPBr
πμb2
√
−
̅̅̅̅̅
Vf
√
]
(2)
where M ≈ 3.06 is the Taylor factor for austenitic steels [71], b = 0.26
nm is the magnitude of the Burgers vector for the dislocations [2], N = 6
Fig. 10. TEM images of the deformation-induced microstructures in the 3Si-ag1 steel at various engineering strains: (a, b) 3%, (c) 14%, (d) 35% and (e) 55% (close to
final failure).
H. Zhi et al.](https://image.slidesharecdn.com/simultaneouslyenhancingstrengthductilitysynergyandstrain-240730105301-f602a5c4/85/Simultaneously-enhancing-strength-ductility-synergy-and-strain-pdf-12-320.jpg)
![Acta Materialia 245 (2023) 118611
13
is the number of pile-up dislocations assisting the shearing of κ′
-carbides
[24,75], r = 2.1 nm is the radius of the κ′
-carbides and Vf = 32% is their
volume fraction. Yao et al. [7,8] established the relationship between
the anti-phase boundary (APB) energy γAPB and carbon content of the
κ′
-carbides based on ab initio calculations and experimental measure
ments, revealing that the γAPB ranged from 350 to 850 mJ/m2
with the
carbon content increasing from 0 to 20 at.%. The reliability of this
relationship has been verified by other experimental results [24]. Here,
Fig. 11. (a) Mean slip band spacing measured from TEM images as a function of true strain in the 3Si and 3Si-ag1 steels. (b) Twin thickness distributions for the 63%-
strained 0Si and the 35%- and 95%-strained 3Si samples measured from TEM images, respectively.
H. Zhi et al.](https://image.slidesharecdn.com/simultaneouslyenhancingstrengthductilitysynergyandstrain-240730105301-f602a5c4/85/Simultaneously-enhancing-strength-ductility-synergy-and-strain-pdf-13-320.jpg)
![Acta Materialia 245 (2023) 118611
14
the γAPB of the κ′
-carbides is approximated to be ~650 mJ/m2
, given that
their carbon content is 11.4 at.% (Table 3). The σorder of the 3Si-ag1 steel
is thus calculated to be 424 MPa, while the (σ0 + σss + σgb) of this steel is
503 MPa. It should be noted that the latter value is higher than the YS of
the 3Si steel (436 MPa), implying that the calculated value of 424 MPa
may correspond to the lower bound of the γAPB for the 3Si-ag1 steel.
4.3. Promotion of planar slip and deformation twinning via Si-alloying
As illustrated in Figs. 8–10, planar slip occurs in the 0Si, 3Si and 3Si-
ag1 steels during deformation and the moving dislocations are almost
fully confined within the planar slip bands in the latter two steels. In the
0Si steel, lots of dislocations out of such bands are found as well,
implying that the Si addition actually promotes the planar slip. Previous
studies [2,6,36,65,76] suggested that planar slip could be promoted by
decreasing the SFE, increasing the friction stress of moving dislocations
or the occurrence of local ordering. Below we will show that the Si
addition decreases the SFE. The friction stress of moving dislocations
was revealed to be mainly governed by the content of interstitial carbon
in lightweight steels [65], while the carbon contents are nearly the same
for all steels studied here. Thus, this factor is not responsible for the
promotion of planar slip via Si-alloying. Previous studies on high-Al
lightweight steels have revealed that the local destruction of ordered
structures by moving dislocations on certain slip planes would soften
these planes, causing the so-called “glide plane softening effect”, and
thus facilitate planar slip of the follow-up dislocations on these planes
[6,7,77]. In this context, it is very probable that the increase in the
carbon ordering, size and volume fraction of LRO structures with the Si
addition (Supplementary Fig. S2 and Fig. 3) promotes the planar slip for
the present medium-Al lightweight steels.
Since the carbon ordering, size and volume fraction of LRO domains
increases with increasing Si content (Supplementary Fig. S2 and Fig. 3),
the tendency for the moving dislocations to be confined within indi
vidual planar slip bands is expected to enhance with the Si addition. In
the 0Si steel with the weakest ordering, the dislocation activities are not
strictly localized into individual planar slip bands, so the dislocation
arrays residing on a primary slip plane would interact with the dislo
cations on adjacent non-coplanar slip planes. Such interactions lead to
the occurrence of HDDWs and microbands in the 0Si steel (Fig. 8)
[66–68]. The stronger ordering in the 3Si steel renders that almost all
dislocation activities are confined within individual planar slip bands in
this steel (Fig. 9). The scenario of plastic deformation for this steel is
expected to be that the dislocation densities in the preformed slip bands
increase with accumulating strain until reaching saturation and then
new slip bands form. In the 3Si-ag1 steel, the stress required for the
moving dislocations to destroy the local ordered structures is expected to
be higher than that in the 3Si steel, due to its high volume fraction of
ordered κ′
-carbides (31.8%). This results in denser dislocations within
existing slip bands (Figs. 9(c) and 10(b)) and larger slip band spacing at
the same strain levels (Fig. 11(a)).
The fact that the Si addition promotes the occurrence of deformation
twins is revealed in Figs. 8 and 9. This should originate from the
decrease of SFE with increasing Si content. Here, we have measured the
SFE of the 3Si steel. Fig. 12(a) shows a representative g(3g) WBDF image
of the 1/6<211> Shockley partials formed via the dissociation of perfect
1/2<110> dislocations in the 3Si steel. By measuring the spacing (dc) of
such partials using the way described in Ref. [78], the SFE (γSF) of the 3Si
steel can be calculated by the following equation [78,79],
γSF =
μb2
p
8πdc
2 − υ
1 − υ
(
1 −
2υcos2θ
2 − υ
)
(3)
where μ = 58.3 GPa is the shear modulus, bp = 0.146 nm is the
magnitude of the Burgers vector of the partials [80], ν = 0.35 is the
Poisson’s ratio and θ is the dislocation character angle. With the
experimentally measured dc and θ (Fig. 12(b)), the SFE of the 3Si steel is
determined to be 49 ± 4 mJ/m2
. It should be noted that the presence of
ordered structures actually increases the SFE, since each partial dislo
cation has to pass through the ordered obstacles [36]. Therefore, the
measured SFE represents an average value including the contributions
from both the γ matrix and ordered structures [36,81]. We have also
theoretically estimated the SFE of the 3Si steel using a sub-regular
thermodynamic model [82], where the ordered structures are not
taken into account. Interestingly, the theoretical value turns out to be 48
mJ/m2
, agreeing well with the experimental result. For the 0Si steel, it is
not viable to measure its SFE since no partial dislocations are observed.
The theoretically estimated SFE of this steel is 60 mJ/m2
, which is
higher than that of the 3Si steel and is out of the range (18 mJ/m2
< SFE
< 50 mJ/m2
[21]) for activating deformation twinning. This actually
verifies that the promotion of deformation twinning via Si-alloying re
sults from the reduced SFE with Si addition.
Since the critical resolved shear stress for deformation twinning is
proportional to the SFE [27,36,83,84] and the stress level of the 3Si steel
is higher than that of the 0Si steel at the same strain level (Fig. 5),
deformation twinning occurs earlier in the former than in the latter
(Figs. 8 and 9). Indeed, the deformation twins in the 0Si steel only occur
at the very high strain levels (e.g., 63%) close to its final failure. It should
also be noted that the deformation twins in this steel are thicker than
those in the 3Si steel (Fig. 11(b)). This may be due to the presence of
cross-slip in the 0Si steel, considering that the twin growth is assisted by
Fig. 12. (a) A representative g(3g) WBDF image of dissociated dislocations and (b) Shockley partial spacing (dc) as a function of the angle (θ) between the dislocation
line and the Burgers vector of full dislocation in the 1%-strained 3Si steel.
H. Zhi et al.](https://image.slidesharecdn.com/simultaneouslyenhancingstrengthductilitysynergyandstrain-240730105301-f602a5c4/85/Simultaneously-enhancing-strength-ductility-synergy-and-strain-pdf-14-320.jpg)
![Acta Materialia 245 (2023) 118611
15
cross slip in FCC metals [85]. In the 3Si steel, the cross-slip becomes
more difficult since both the increase in the carbon ordering, size and
volume fraction of ordered structures and the reduction of SFE suppress
the cross-slip [36]. Consequently, the deformation twins formed in the
3Si steel are thinner than those in the 0Si steel and conventional TWIP
steels [71].
4.4. High strain hardenability associated with Si-alloying
The results reveal that the enhanced strain hardenability of the 3Si
steel compared to the 0Si steel is primarily contributed by the occur
rence of joint DSBR and TWIP effects (Figs. 5(c) and 9). For the 3Si-ag1
steel, the DSBR effect occurs as well during its deformation (Fig. 10), so
its strain hardenability is also relatively high (Fig. 6(c)). Here, we have
quantitatively assessed the contributions of the DSBR and TWIP effects
to the strain hardenability in these two steels. We grouped the contri
butions to the total flow stress into two categories [2,7], i.e.,
σtot = σnd + σSH(ϵ) (4)
where σnd represents the summation of all contributions that are inde
pendent of the deformation and σSH(ϵ) corresponds to the deformation-
dependent strengthening mechanisms. For the 3Si steel, σSH(ϵ) consists
of the strain hardening contributions from both the refinement of slip
band structure (σD) and the deformation twinning (σT), while only the
former is present for the 3Si-ag1 steel. The σD can be derived by the
following formula [2,7,36],
σD =
KDMμb
Ds
(5)
where KD is a geometrical factor and Ds is the mean slip band spacing.
Apparently, the σD increases with increasing strain due to the reduction
of Ds (Fig. 11). The calculated results for the σD of both the 3Si and 3Si-
ag1 steels are plotted in Fig. 13, where the true stress-strain curves of
these two steels are included for comparison. It is revealed that for the
3Si-ag1 steel all calculated σD values agree well with the experimentally
measured true stress at the corresponding true strain level, verifying that
the strain hardening of this steel is governed by the DSBR effect. For the
3Si steel, however, such good agreement only occurs when the true
strain is not higher than 13% and at high strain levels the calculated σD
value is lower than the corresponding experimentally measured true
stress. For instance, the difference between the calculation and
experiment is 101 MPa when the true strain is 30%. The strain hardening
contribution from deformation twinning (σT) is expected to account for
such a difference. It should also be noted that the best fitting between
experiment and calculation is achieved when using KD values of 0.92
and 1.91 for the 3Si and 3Si-ag1 steels, respectively. The higher KD value
for the aged 3Si-ag1 steel should originate from the denser dislocations
within its individual slip bands compared to the 3Si steel at the same
strain level (Figs. 9 and 10).
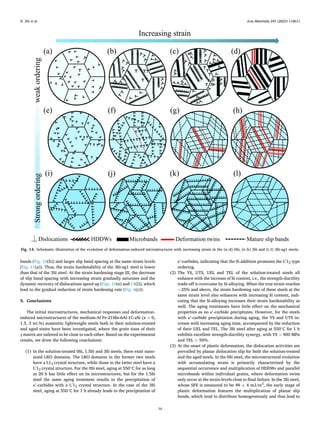
4.5. Evolution of deformation-induced microstructures upon straining
Based on the experimental results, the evolution of deformation-
induced microstructures with increasing strain for the 0Si, 3Si and
3Si-ag1 steels is schematically illustrated in Fig. 14. Fig. 14(a–d) show
the situation of the 0Si steel. At the initial stage of plastic deformation,
planar dislocation activities take place in this steel (Figs. 8(a, b) and 14
(a)), where the continuous reduction of strain hardening rate with
increasing strain (Fig. 5(c)) is primarily attributed to the large disloca
tion mean free path [71,86]. The limited events of dislocation annihi
lation at grain boundaries are expected to contribute to the reduction of
strain hardening rate as well. When entering the strain hardening stage
II (Fig. 5(c)), the plastic deformation is characterized by the occurrence
and multiplication of HDDWs (Figs. 8(c, d) and 14(b)). Since the HDDWs
act as obstacles against the approaching dislocations, the strain hard
ening rate increases with increasing strain at this stage. The micro
structural evolution with further increasing strain features the dynamic
recovery process via mutual annihilation of gliding dislocations and
cross slip (Figs. 8(e, f) and 14(c)) as well as the formation and thickening
of parallel microbands within individual γ grains (Figs. 8(g–j) and 14(c,
d)). This corresponds to the strain hardening stage III (Fig. 5(c)), where
the strain hardening rate reduces with increasing strain. It should also be
noted that deformation twins also occur in the 0Si steel (Figs. 8(k, l) and
14(d)) but only at the very high strain levels close to final failure.
The plastic deformation of the 3Si steel is primarily mediated by
planar slip and deformation twinning, as illustrated in Fig. 14 (e–h). In
this steel, the initially generated dislocations glide in a planar mode and
the activities of the follow-up dislocations tend to be confined within the
preformed planar slip bands (Figs. 9(a–c) and 14(e)). With increasing
strain, such bands accumulate more and more dislocations until satu
ration is reached, i.e., developing into mature slip bands, and meanwhile
multiplication of such bands occurs as well (Figs. 9(d, e) and 14(f)).
Since the distribution of the progressively formed slip bands is relatively
homogeneous, the slip band spacing continuously decreases (Figs. 9(e)
and 14(g)), contributing to the increase of strain hardening rate with
increasing strain (Fig. 5(c)). At this stage, i.e., the strain hardening stage
II, deformation twinning is also activated and contributes to the increase
of strain hardening rate as well (Fig. 9(f–h)). When entering the strain
hardening stage III, the strain hardening rate decreases with increasing
strain. This is expected to be due to the accelerated dynamic recovery
and the increased difficulty for slip band refinement (Fig. 9(e, i)), where
the dynamic recovery process corresponds to the occurrence of dislo
cation annihilation as the dislocations on parallel slip bands are close
enough or the stress is high enough to enable cross slip [2,7]. However,
the multiplication of deformation twins retards the reduction of strain
hardening rate (Figs. 9(j–l) and 14(h)).
Fig. 14(i–l) illustrate the microstructural evolution upon straining in
the 3Si-ag1 steel. It is revealed that the dominant deformation mecha
nism of this steel is planar slip. At the early stages of plastic deformation,
the microstructural evolution with increasing strain is prevailed by the
multiplication of planar slip bands (Figs. 10(a–d) and 14(i–k)). These
progressively formed slip bands also tend to distribute homogeneously,
leading to the dynamic refinement of slip band spacing and hence the
increase of strain hardening rate at the strain hardening stage II (Fig. 6
(c)). The precipitation of κ’-carbides during aging in the 3Si-ag1 steel is
expected to suppress the deformation twinning that occurs in the 3Si
steel, but it leads to higher density of dislocations within existing slip
Fig. 13. Calculated stresses of the 3Si and 3Si-ag1 steels at different true strain
levels, where the measured true stress-strain curves of these two steels are
included for comparison.
H. Zhi et al.](https://image.slidesharecdn.com/simultaneouslyenhancingstrengthductilitysynergyandstrain-240730105301-f602a5c4/85/Simultaneously-enhancing-strength-ductility-synergy-and-strain-pdf-15-320.jpg)
![Acta Materialia 245 (2023) 118611
17
DSBR effect. Fairly thin (<20 nm) deformation twins progres
sively form in this steel when the engineering strain reaches 35%
and above, leading to TWIP effect. In the short-time (1 h) aged 3Si
steel, the DSBR effect is still present and the distribution of the
progressively-formed slip bands is relatively homogeneous,
although the TWIP effect is suppressed by the precipitation of
κ′
-carbides.
(4) Compared to the 0Si steel, the higher YS of the 3Si steel originates
from the grain boundary strengthening, solid-solution strength
ening and order strengthening associated with the Si-alloying,
while its higher strain-hardenability stems from the DSBR and
TWIP effects promoted by the Si-alloying. The roles of Si-alloying
in simultaneously enhancing the strength and strain-
hardenability clarified here are useful for guiding the design of
austenitic lightweight steels to attain exceptional mechanical
properties.
Declaration of Competing Interest
The authors declare that they have no known competing financial
interests or personal relationships that could have appeared to influence
the work reported in this paper.
Acknowledgements
The authors are grateful for the financial support from the National
Science Foundation of China (Nos. 52071266 and 52201141), Natural
Science Foundation of Chongqing, China (No. cstc2021jcyj-
msxmX1189), and China Postdoctoral Science Foundation (No.
2021M702662). Mohamed Elkot acknowledges the fund of DAAD and
MoHE of Egypt through GERLS scholarship.
Supplementary materials
Supplementary material associated with this article can be found, in
the online version, at doi:10.1016/j.actamat.2022.118611.
References
[1] S. Chen, R. Rana, A. Haldar, R.K. Ray, Current state of Fe-Mn-Al-C low density
steels, Prog. Mater. Sci. 89 (2017) 345–391.
[2] E. Welsch, D. Ponge, S.M. Hafez Haghighat, S. Sandlöbes, P. Choi, M. Herbig,
S. Zaefferer, D. Raabe, Strain hardening by dynamic slip band refinement in a high-
Mn lightweight steel, Acta Mater. 116 (2016) 188–199.
[3] J.E. Jin, Y.K. Lee, Effects of Al on microstructure and tensile properties of C-bearing
high Mn TWIP steel, Acta Mater. 60 (2012) 1680–1688.
[4] J.D. Yoo, K.T. Park, Microband-induced plasticity in a high Mn–Al–C light steel,
Mater. Sci. Eng. A Struct. Mater. 496 (2008) 417–424.
[5] J. Moon, S.J. Park, J.H. Jang, T.H. Lee, C.H. Lee, H.U. Hong, H.N. Han, J. Lee, B.
H. Lee, C. Lee, Investigations of the microstructure evolution and tensile
deformation behavior of austenitic Fe-Mn-Al-C lightweight steels and the effect of
Mo addition, Acta Mater. 147 (2018) 226–235.
[6] C. Haase, C. Zehnder, T. Ingendahl, A. Bikar, F. Tang, B. Hallstedt, W. Hu, W. Bleck,
D.A. Molodov, On the deformation behavior of κ-carbide-free and κ-carbide-
containing high-Mn light-weight steel, Acta Mater. 122 (2017) 332–343.
[7] M.J. Yao, E. Welsch, D. Ponge, S.M.H. Haghighat, S. Sandlöbes, P. Choi, M. Herbig,
I. Bleskov, T. Hickel, M. Lipinska-Chwalek, P. Shanthraj, C. Scheu, S. Zaefferer,
B. Gault, D. Raabe, Strengthening and strain hardening mechanisms in a
precipitation-hardened high-Mn lightweight steel, Acta Mater. 140 (2017)
258–273.
[8] M.J. Yao, P. Dey, J.B. Seol, P. Choi, M. Herbig, R.K.W. Marceau, T. Hickel,
J. Neugebauer, D. Raabe, Combined atom probe tomography and density
functional theory investigation of the Al off-stoichiometry of κ-carbides in an
austenitic Fe–Mn–Al–C low density steel, Acta Mater. 106 (2016) 229–238.
[9] M.C. Ha, J.M. Koo, J.K. Lee, S.W. Hwang, K.T. Park, Tensile deformation of a low
density Fe–27Mn–12Al–0.8 C duplex steel in association with ordered phases at
ambient temperature, Mater. Sci. Eng. A Struct. Mater. 586 (2013) 276–283.
[10] W.C. Cheng, C.Y. Cheng, C.W. Hsu, D.E. Laughlin, Phase transformation of the L12
phase to kappa-carbide after spinodal decomposition and ordering in an
Fe–C–Mn–Al austenitic steel, Mater. Sci. Eng. A Struct. Mater. 642 (2015) 128–135.
[11] O. Acselrad, I. Kalashnikov, E. Silva, M.S. Khadyev, R. Simao, Diagram of phase
transformations in the austenite of hardened alloy Fe-28% Mn-8.5% Al-1% C-
1.25% Si as a result of aging due to isothermal heating, Met. Sci. Heat Treat. 48
(2006) 543–553.
[12] G. Frommeyer, E. Drewes, B. Engl, Physical and mechanical properties of iron-
aluminium-(Mn, Si) lightweight steels, Metall. Res. Technol. 97 (2000) 1245–1253.
[13] R. Rana, C. Liu, R.K. Ray, Low-density low-carbon Fe–Al ferritic steels, Scr. Mater.
68 (2013) 354–359.
[14] C. Song, H. Wang, Z. Sun, J. Xu, H. Chen, W. Yin, A new hot-rolled lightweight steel
with ultra-high strength and good ductility designed by dislocation character and
transformation strain, Scr. Mater. 212 (2022), 114583.
[15] G. Frommeyer, U. Brüx, Microstructures and mechanical properties of high-
strength Fe-Mn-Al-C light-weight TRIPLEX steels, Steel Res. Int. 77 (2006)
627–633.
[16] J. Yoo, S. Hwang, K.T. Park, Origin of extended tensile ductility of a Fe-28Mn-10Al-
1C steel, Metall. Mater. Trans. A 40 (2009) 1520–1523.
[17] H. Ding, D. Han, J. Zhang, Z. Cai, Z. Wu, M. Cai, Tensile deformation behavior
analysis of low density Fe–18Mn–10Al–xC steels, Mater. Sci. Eng. A Struct. Mater.
652 (2016) 69–76.
[18] I. Gutierrez-Urrutia, D. Raabe, Microbanding mechanism in an Fe–Mn–C high-Mn
twinning-induced plasticity steel, Scr. Mater. 69 (2013) 53–56.
[19] L. Tang, L. Wang, M. Wang, H. Liu, S. Kabra, Y. Chiu, B. Cai, Synergistic
deformation pathways in a TWIP steel at cryogenic temperatures: in situ neutron
diffraction, Acta Mater. 200 (2020) 943–958.
[20] S. Liu, L. Qian, J. Meng, D. Li, P. Ma, F. Zhang, Simultaneously increasing both
strength and ductility of Fe-Mn-C twinning-induced plasticity steel via Cr/Mo
alloying, Scr. Mater. 127 (2017) 10–14.
[21] B.C. De Cooman, Y. Estrin, S.K. Kim, Twinning-induced plasticity (TWIP) steels,
Acta Mater. 142 (2018) 283–362.
[22] S.H. Kayani, S. Park, J.G. Kim, J.B. Seol, H. Sung, Direct observation of chemical
short-range order in 25 wt% Mn steel via transmission electron microscopy, Scr.
Mater. 213 (2022), 114642.
[23] C. Kim, S. Kwon, B. Lee, J. Moon, S. Park, J. Lee, H. Hong, Atomistic study of nano-
sized κ-carbide formation and its interaction with dislocations in a cast Si added
FeMnAlC lightweight steel, Mater. Sci. Eng. A Struct. Mater. 673 (2016) 108–113.
[24] Z. Wang, W. Lu, H. Zhao, J. He, K. Wang, B. Zhou, D. Ponge, D. Raabe, Z. Li,
Formation mechanism of κ-carbides and deformation behavior in Si-alloyed
FeMnAlC lightweight steels, Acta Mater. 198 (2020) 258–270.
[25] K. Jeong, J.E. Jin, Y.S. Jung, S. Kang, Y.K. Lee, The effects of Si on the mechanical
twinning and strain hardening of Fe–18Mn–0.6C twinning-induced plasticity steel,
Acta Mater. 61 (2013) 3399–3410.
[26] S.M. Lee, S.J. Lee, S. Lee, J.H. Nam, Y.K. Lee, Tensile properties and deformation
mode of Si-added Fe-18Mn-0.6C steels, Acta Mater. 144 (2018) 738–747.
[27] Z.H. Lai, Y.H. Sun, Y.T. Lin, J.F. Tu, H.W. Yen, Mechanism of twinning induced
plasticity in austenitic lightweight steel driven by compositional complexity, Acta
Mater. 210 (2021), 116814.
[28] D.T. Pierce, J.A. Jiménez, J. Bentley, D. Raabe, C. Oskay, J.E. Wittig, The influence
of manganese content on the stacking fault and austenite/ε-martensite interfacial
energies in Fe–Mn–(Al–Si) steels investigated by experiment and theory, Acta
Mater. 68 (2014) 238–253.
[29] D. Wei, L. Wang, Y. Zhang, W. Gong, T. Tsuru, I. Lobzenko, J. Jiang, S. Harjo,
T. Kawasaki, J.W. Bae, W. Lu, Z. Lu, Y. Hayasaka, T. Kiguchi, N.L. Okamoto,
T. Ichitsubo, H.S. Kim, T. Furuhara, E. Ma, H. Kato, Metalloid substitution elevates
simultaneously the strength and ductility of face-centered-cubic high-entropy
alloys, Acta Mater. 225 (2022), 117571.
[30] F. Bachmann, R. Hielscher, H. Schaeben, Texture analysis with MTEX–free and
open source software toolbox, Solid State Phenom. (2010) 63–68. Trans Tech Publ.
[31] W. Pantleon, Resolving the geometrically necessary dislocation content by
conventional electron backscattering diffraction, Scr. Mater. 58 (2008) 994–997.
[32] K. Yang, W.K. Choo, Evidence of carbon ordering and morphology change in a
cubic carbide phase, Philos. Mag. Lett. 62 (1990) 221–226.
[33] W.K. Choo, J.H. Kim, J.C. Yoon, Microstructural change in austenitic Fe-30.0wt%
Mn-7.8wt%Al-1.3wt%C initiated by spinodal decomposition and its influence on
mechanical properties, Acta Mater. 45 (1997) 4877–4885.
[34] L.N. Bartlett, D.C. Van Aken, J. Medvedeva, D. Isheim, N.I. Medvedeva, K. Song, An
atom probe study of kappa carbide precipitation and the effect of silicon addition,
Metall. Mater. Trans. A 45 (2014) 2421–2435.
[35] C. Kim, M. Terner, J. Lee, H. Hong, J. Moon, S. Park, J. Jang, C. Lee, B. Lee, Y. Lee,
Partitioning of C into κ-carbides by Si addition and its effect on the initial
deformation mechanism of Fe-Mn-Al-C lightweight steels, J. Alloy. Compd. 775
(2019) 554–564.
[36] J. Miao, C. Slone, S. Dasari, M. Ghazisaeidi, R. Banerjee, E.P. George, M.J. Mills,
Ordering effects on deformation substructures and strain hardening behavior of a
CrCoNi based medium entropy alloy, Acta Mater. 210 (2021), 116829.
[37] J. Zhang, Y. Jiang, W. Zheng, Y. Liu, A. Addad, G. Ji, C. Song, Q. Zhai, Revisiting
the formation mechanism of intragranular κ-carbide in austenite of a Fe-Mn-Al-Cr-
C low-density steel, Scr. Mater. 199 (2021), 113836.
[38] J. Herrmann, G. Inden, G. Sauthoff, Deformation behaviour of iron-rich iron-
aluminum alloys at low temperatures, Acta Mater. 51 (2003) 2847–2857.
[39] F. Moszner, S.S. Gerstl, P. Uggowitzer, J.F. Löffler, Atomic-scale characterization of
prior austenite grain boundaries in Fe–Mn-based maraging steel using site-specific
atom probe tomography, Acta Mater. 73 (2014) 215–226.
[40] X. Liang, J.R. McDermid, O. Bouaziz, X. Wang, J.D. Embury, H.S. Zurob,
Microstructural evolution and strain hardening of Fe–24Mn and Fe–30Mn alloys
during tensile deformation, Acta Mater. 57 (2009) 3978–3988.
[41] H. Koh, S. Lee, S. Choi, S. Kwon, N. Kim, S. Park, Effect of hot rolling conditions on
the microstructure and mechanical properties of Fe-C-Mn-Si multiphase steels, Scr.
Mater. 38 (1998) 763–768.
H. Zhi et al.](https://image.slidesharecdn.com/simultaneouslyenhancingstrengthductilitysynergyandstrain-240730105301-f602a5c4/85/Simultaneously-enhancing-strength-ductility-synergy-and-strain-pdf-17-320.jpg)
![Acta Materialia 245 (2023) 118611
18
[42] R. Xiong, H. Peng, T. Zhang, J.W. Bae, H.S. Kim, Y. Wen, Superior strain-hardening
by deformation-induced nano-HCP martensite in Fe–Mn–Si–C high-manganese
steel, Mater. Sci. Eng. A Struct. Mater. 824 (2021), 141864.
[43] P. Lan, J. Zhang, Tensile property and microstructure of Fe-22Mn-0.5 C TWIP steel,
Mater. Sci. Eng. A Struct. Mater. 707 (2017) 373–382.
[44] J.K. Kim, B.C. De Cooman, Stacking fault energy and deformation mechanisms in
Fe-xMn-0.6 C-yAl TWIP steel, Mater. Sci. Eng. A Struct. Mater. 676 (2016)
216–231.
[45] J.H. Choi, M.C. Jo, H. Lee, A. Zargaran, T. Song, S.S. Sohn, N.J. Kim, S. Lee, Cu
addition effects on TRIP to TWIP transition and tensile property improvement of
ultra-high-strength austenitic high-Mn steels, Acta Mater. 166 (2019) 246–260.
[46] P. Lan, J. Zhang, Twinning and dynamic strain aging behavior during tensile
deformation of Fe-Mn-C TWIP steel, Mater. Sci. Eng. A Struct. Mater. 700 (2017)
250–258.
[47] D. Li, L. Qian, C. Wei, S. Liu, F. Zhang, J. Meng, The role of Mn on twinning
behavior and tensile properties of coarse-and fine-grained Fe–Mn–C twinning-
induced plasticity steels, Mater. Sci. Eng. A Struct. Mater. 789 (2020), 139586.
[48] S.M. Anijdan, M. Sabzi, H. Najafi, M. Jafari, A. Eivani, N. Park, H. Jafarian, The
influence of aluminum on microstructure, mechanical properties and wear
performance of Fe–14% Mn–1.05% C manganese steel, J. Mater. Res. Technol. 15
(2021) 4768–4780.
[49] A.R. Park, J.H. Nam, M. Kim, I.S. Jang, Y.K. Lee, Evaluations of tensile properties
as a function of austenitizing temperature and springback by V-bending testing in
medium-Mn steels, Mater. Sci. Eng. A Struct. Mater. 787 (2020), 139534.
[50] D.T. Pierce, J.A. Jiménez, J. Bentley, D. Raabe, J.E. Wittig, The influence of
stacking fault energy on the microstructural and strain-hardening evolution of
Fe–Mn–Al–Si steels during tensile deformation, Acta Mater. 100 (2015) 178–190.
[51] I.R. Souza Filho, A. Dutta, D.R. Almeida Junior, W. Lu, M.J.R. Sandim, D. Ponge, H.
R.Z. Sandim, D. Raabe, The impact of grain-scale strain localization on strain
hardening of a high-Mn steel: Real-time tracking of the transition from the γ → ε →
α’ transformation to twinning, Acta Mater. 197 (2020) 123–136.
[52] Z. Xu, X. Shen, T. Allam, W. Song, W. Bleck, Austenite transformation and
deformation behavior of a cold-rolled medium-Mn steel under different annealing
temperatures, Mater. Sci. Eng. A Struct. Mater. 829 (2022), 142115.
[53] B. Sun, Y. Ma, N. Vanderesse, R.S. Varanasi, W. Song, P. Bocher, D. Ponge,
D. Raabe, Macroscopic to nanoscopic in situ investigation on yielding mechanisms
in ultrafine grained medium Mn steels: Role of the austenite-ferrite interface, Acta
Mater. 178 (2019) 10–25.
[54] Z. Li, Y. Wang, X. Cheng, Z. Li, C. Gao, S. Li, The effect of rolling and subsequent
aging on microstructures and tensile properties of a Fe–Mn–Al–C austenitic steel,
Mater. Sci. Eng. A Struct. Mater. 822 (2021), 141683.
[55] K.K. Ko, H.J. Bae, E.H. Park, H.U. Jeong, H.S. Park, J.S. Jeong, J.G. Kim, H. Sung,
N. Parl, J.B. Seol, A feasible route to produce 1.1 GPa ferritic-based low-Mn
lightweight steels with ductility of 47%, J. Mater. Sci. Mater. Med. 117 (2022)
225–237.
[56] D.J. Magagnosc, D.M. Field, C.S. Meredith, K. An, T.R. Walter, K.R. Limmer, J.
T. Lloyd, Temperature and stress dependent twinning behavior in a fully austenitic
medium-Mn steel, Acta Mater. 231 (2022), 117864.
[57] J. Zhang, D. Raabe, C.C. Tasan, Designing duplex, ultrafine-grained Fe-Mn-Al-C
steels by tuning phase transformation and recrystallization kinetics, Acta Mater.
141 (2017) 374–387.
[58] H. Lee, M.C. Jo, S.S. Sohn, A. Zargaran, J.H. Ryu, N.J. Kim, S. Lee, Novel medium-
Mn (austenite + martensite) duplex hot-rolled steel achieving 1.6 GPa strength
with 20 % ductility by Mn-segregation-induced TRIP mechanism, Acta Mater. 147
(2018) 247–260.
[59] H. Springer, D. Raabe, Rapid alloy prototyping: Compositional and thermo-
mechanical high throughput bulk combinatorial design of structural materials
based on the example of 30Mn–1.2 C–xAl triplex steels, Acta Mater. 60 (2012)
4950–4959.
[60] Z. Chen, M.X. Liu, J.K. Zhang, L. Yang, Y.H. Zhang, C.J. Song, Q.J. Zhai, Effect of
annealing treatment on microstructures and properties of austenite-based Fe-
28Mn-9Al-0.8 C lightweight steel with addition of Cu, China Foundry 18 (2021)
207–216.
[61] H. Lai, C. Wan, The study of work hardening in Fe-Mn-Al-C alloys, J. Mater. Sci. 24
(1989) 2449–2453.
[62] C. Kim, H.U. Hong, J.H. Jang, B.H. Lee, S.J. Park, J. Moon, C.H. Lee, Reverse
partitioning of Al from κ-carbide to the γ-matrix upon Ni addition and its
strengthening effect in Fe–Mn–Al–C lightweight steel, Mater. Sci. Eng. A Struct.
Mater. 820 (2021), 141563.
[63] K.W. Kim, S.J. Park, J. Moon, J.H. Jang, H.Y. Ha, T.H. Lee, H.U. Hong, B.H. Lee, H.
N. Han, Y.J. Lee, C.H. Lee, S.D. Kim, Characterization of microstructural evolution
in austenitic Fe-Mn-Al-C lightweight steels with Cr content, Mater. Charact. 170
(2020), 110717.
[64] J. Moon, H.H. Jo, S.J. Park, S.D. Kim, T.H. Lee, C.H. Lee, M.G. Lee, H.U. Hong, D.
W. Suh, D. Raabe, Ti-bearing lightweight steel with large high temperature
ductility via thermally stable multi-phase microstructure, Mater. Sci. Eng. A Struct.
Mater. 808 (2021), 140954.
[65] I. Gutierrez-Urrutia, D. Raabe, Multistage strain hardening through dislocation
substructure and twinning in a high strength and ductile weight-reduced
Fe–Mn–Al–C steel, Acta Mater. 60 (2012) 5791–5802.
[66] D. Canadinc, H. Sehitoglu, H. Maier, The role of dense dislocation walls on the
deformation response of aluminum alloyed hadfield steel polycrystals, Mater. Sci.
Eng. A Struct. Mater. 454 (2007) 662–666.
[67] D. Canadinc, H. Sehitoglu, H. Maier, Y. Chumlyakov, Strain hardening behavior of
aluminum alloyed Hadfield steel single crystals, Acta Mater. 53 (2005) 1831–1842.
[68] J. Huang, G. Gray III, Microband formation in shock-loaded and quasi-statically
deformed metals, Acta Metall. 37 (1989) 3335–3347.
[69] Z. Wang, I. Baker, Z. Cai, S. Chen, J.D. Poplawsky, W. Guo, The effect of interstitial
carbon on the mechanical properties and dislocation substructure evolution in
Fe40.4Ni11.3Mn34.8Al7.5Cr6 high entropy alloys, Acta Mater. 120 (2016)
228–239.
[70] S.D. Kim, J.Y. Park, S.J. Park, J.h. Jang, J. Moon, H.Y. Ha, C.H. Lee, J.Y. Kang, J.
H. Shin, T.H. Lee, Direct observation of dislocation plasticity in high-Mn
lightweight steel by in-situ TEM, Sci. Rep. 9 (2019) 15171.
[71] H. Zhi, C. Zhang, S. Antonov, H. Yu, T. Guo, Y. Su, Investigations of dislocation-
type evolution and strain hardening during mechanical twinning in Fe-22Mn-0.6C
twinning-induced plasticity steel, Acta Mater. 195 (2020) 371–382.
[72] J.H. Kang, T. Ingendahl, J. von Appen, R. Dronskowski, W. Bleck, Impact of short-
range ordering on yield strength of high manganese austenitic steels, Mater. Sci.
Eng. A Struct. Mater. 614 (2014) 122–128.
[73] H.M. Gardner, A. Radecka, D. Rugg, D.E.J. Armstrong, M.P. Moody, P.A.J. Bagot,
A study of the interaction of oxygen with the α2 phase in the model alloy Ti–7wt%
Al, Scr. Mater. 185 (2020) 111–116.
[74] Y. Chong, R. Zhang, M.S. Hooshmand, S. Zhao, D.C. Chrzan, M. Asta, J.W. Morris,
A.M. Minor, Elimination of oxygen sensitivity in α-titanium by substitutional
alloying with Al, Nat. Commun. 12 (2021) 6158.
[75] T.W.J. Kwok, K.M. Rahman, V.A. Vorontsov, D. Dye, Strengthening κ-carbide steels
using residual dislocation content, Scr. Mater. 213 (2022), 114626.
[76] F. He, S. Wei, J.L. Cann, Z. Wang, J. Wang, C.C. Tasan, Composition-dependent slip
planarity in mechanically-stable face centered cubic complex concentrated alloys
and its mechanical effects, Acta Mater. 220 (2021) 117314.
[77] V. Gerold, H.P. Karnthaler, On the origin of planar slip in f.c.c. alloys, Acta Metall.
37 (1989) 2177–2183.
[78] G. Laplanche, A. Kostka, C. Reinhart, J. Hunfeld, G. Eggeler, E.P. George, Reasons
for the superior mechanical properties of medium-entropy CrCoNi compared to
high-entropy CrMnFeCoNi, Acta Mater. 128 (2017) 292–303.
[79] B. Mahato, S.K. Shee, T. Sahu, S. Ghosh Chowdhury, P. Sahu, D.A. Porter, L.
P. Karjalainen, An effective stacking fault energy viewpoint on the formation of
extended defects and their contribution to strain hardening in a Fe–Mn–Si–Al
twinning-induced plasticity steel, Acta Mater. 86 (2015) 69–79.
[80] L. Mosecker, D.T. Pierce, A. Schwedt, M. Beighmohamadi, J. Mayer, W. Bleck, J.
E. Wittig, Temperature effect on deformation mechanisms and mechanical
properties of a high manganese C+N alloyed austenitic stainless steel, Mater. Sci.
Eng. A Struct. Mater. 642 (2015) 71–83.
[81] R. Zhang, S. Zhao, J. Ding, Y. Chong, T. Jia, C. Ophus, M. Asta, R.O. Ritchie, A.
M. Minor, Short-range order and its impact on the CrCoNi medium-entropy alloy,
Nature 581 (2020) 283–287.
[82] O. Zambrano, Stacking fault energy maps of Fe–Mn–Al–C–Si steels: effect of
temperature, grain size, and variations in compositions, J. Eng. Mater. Technol.
138 (2016).
[83] W. Guo, J. Su, W. Lu, C.H. Liebscher, C. Kirchlechner, Y. Ikeda, F. Körmann, X. Liu,
Y. Xue, G. Dehm, Dislocation-induced breakthrough of strength and ductility trade-
off in a non-equiatomic high-entropy alloy, Acta Mater. 185 (2020) 45–54.
[84] I. Karaman, H. Sehitoglu, H.J. Maier, Y.I. Chumlyakov, Competing mechanisms
and modeling of deformation in austenitic stainless steel single crystals with and
without nitrogen, Acta Mater. 49 (2001) 3919–3933.
[85] J. Venables, Deformation twinning in face-centred cubic metals, Philos. Mag. 6
(1961) 379–396.
[86] S. Mishra, M. Yadava, K.N. Kulkarni, N.P. Gurao, A new phenomenological
approach for modeling strain hardening behavior of face centered cubic materials,
Acta Mater. 178 (2019) 99–113.
H. Zhi et al.](https://image.slidesharecdn.com/simultaneouslyenhancingstrengthductilitysynergyandstrain-240730105301-f602a5c4/85/Simultaneously-enhancing-strength-ductility-synergy-and-strain-pdf-18-320.jpg)


