SlideShare a Scribd company logo
Northern Border University
College of engineering
Industrial Engineering Department
Year : 2020-2021,1st
Term
Course : Probabilities and. Statistics
Course No.: 1405 -204
Sheet No. 1
Dr. Yehya Mesalam
Page 1 of 10
1. Thirty students are completed probability course in the first year of mechanical engineering
department. Their grades are shown below.
B B A F C C
C C B D B DN
B DN F A D D
F B C D A F
DN B DN B A B
(a) Develop a frequency distribution for their grades.
(b) Develop a relative frequency distribution for their grades.
(c) Develop a percent frequency distribution for their grades.
(d) Develop a bar graph.
(e) Construct a pie chart
Northern Border University
College of engineering
Industrial Engineering Department
Year : 2020-2021,1st
Term
Course : Probabilities and. Statistics
Course No.: 1405 -204
Sheet No. 1
Dr. Yehya Mesalam
Page 2 of 10
2. The following measurements were recorded for the cooking time, in hours, of a certain type of
Meat
3.6 2.5 4.8 4.9 3.6
2.9 3.4 5.6 3.7 2.8
4.4 4.0 5.2 3.0 4.8
4.8 4.0 5.9 6.5 4.8
Assume that the measurements are a simple random sample.
(a) What is the sample size for the above sample?
(b) Calculate the sample mean for these data.
(c) Calculate the sample median.
(d) Plot the data by way of a dot plot.
Northern Border University
College of engineering
Industrial Engineering Department
Year : 2020-2021,1st
Term
Course : Probabilities and. Statistics
Course No.: 1405 -204
Sheet No. 1
Dr. Yehya Mesalam
Page 3 of 10
3. Construct a stem-and-leaf display for the following data, Then calculate the mean, mode, and
median, for the following data
10.7 4.9 8.9 11.7 6.3 7.7 3.3 4.9 8.3 10.2 11.9
7.7 8.9 6.4 6.3 7.7 3.9 4.9 8.9 10.6 10.9 4.9
8.9 11.7 9.3 7.3 10.3 4.9 8.7 10. 4 7.4 6.9 4.2
Northern Border University
College of engineering
Industrial Engineering Department
Year : 2020-2021,1st
Term
Course : Probabilities and. Statistics
Course No.: 1405 -204
Sheet No. 1
Dr. Yehya Mesalam
Page 4 of 10
4. The following are historical data on staff salaries (dollars per hour) for 30 schools sampled in
the eastern part of the United States in the early 1970s.
3.79 2.99 2.77 2.91 3.10 1.84 2.52 3.22 3.14 2.68
2.45 2.14 2.67 2.52 2.71 2.75 3.57 3.85 3.54 3.51
3.36 2.05 2.89 2.83 3.13 2.44 2.10 3.71 2.37 3.37
(a) Compute the sample mean and sample standard deviation.
(b) Construct a stem-and-leaf display of the data.
(c) Construct a box plot.
Northern Border University
College of engineering
Industrial Engineering Department
Year : 2020-2021,1st
Term
Course : Probabilities and. Statistics
Course No.: 1405 -204
Sheet No. 1
Dr. Yehya Mesalam
Page 5 of 10
5. In a certain company the mean annual vacation period is 15 day. Fourteen employees were
randomly chosen from this company and their vacation days inquired. The following data were
obtained: 6, 12, 11, 12, 10, 7, 12, 14, 16, 18, 11, 12, 16, 17. Select the correct answer
1. The range value is
a- 6 b- 12
c- 14 d- 18
2. The Mean value is
a- 12.429 b- 12.418
c- 12 d- 3.54
3. The variance value is
a- 6 b- 12.418
c- 12.429 d- 3.54
4. The Standard deviation value is
a- 6 b- 12.418
c- 12.429 d- 3.54
5. The C.V value is
a- 0.5 b- 14
c- 0.283 d- 0.354
6. The Mode value is
a- 6 b- 12
c- 14 d- 18
7. The Median value is
a- 6 b- 12
c- 14 d- 18
8. The sample size is
a- 11 b- 12
c- 14 d- 18
9. The Maximum value is
a- 6 b- 12
c- 14 d- 18
10. The minimum value is
a- 6 b- 7
c- 11 d- 12
Northern Border University
College of engineering
Industrial Engineering Department
Year : 2020-2021,1st
Term
Course : Probabilities and. Statistics
Course No.: 1405 -204
Sheet No. 1
Dr. Yehya Mesalam
Page 6 of 10
6. The following data represent the viscosity (friction, as in automobile oil) taken from 120
manufacturing batches (ordered from lowest viscosity to highest viscosity).
12.6 12.8 13.0 13.1 13.3 13.3 13.4 13.5 13.6 13.7 13.7 13.7 13.8
13.8 13.9 13.9 14.0 14.0 14.0 14.1 14.1 14.1 14.2 14.2 14.2 14.3
14.3 14.3 14.3 14.3 14.3 14.4 14.4 14.4 14.4 14.4 14.4 14.4 14.4
14.5 14.5 14.5 14.5 14.5 14.5 14.6 14.6 14.6 14.7 14.7 14.8 14.8
14.8 14.8 14.9 14.9 14.9 14.9 14.9 14.9 14.9 15.0 15.0 15.0 15.0
15.1 15.1 15.1 15.1 15.2 15.2 15.2 15.2 15.2 15.2 15.2 15.2 15.3
15.3 15.3 15.3 15.3 15.4 15.4 15.4 15.4 15.5 15.5 15.6 15.6 15.6
15.6 15.6 15.7 15.7 15.7 15.8 15.8 15.9 15.9 16.0 16.0 16.0 16.0
16.1 16.1 16.1 16.2 16.3 16.4 16.4 16.5 16.5 16.6 16.8 16.9 16.9
17.0 17.6 18.6
Using 7 equal intervals with the lowest starting at 12.
(a) Set up a frequency and a relative frequency distribution.
(b) Construct a frequency polygon and a frequency histogram.
(c) Construct a relative frequency histogram
(d) The median and the mode (analytically and graphically)
(e) The mean and the variance using both the long method and the short-cut method.
(f) Set up a less than and an or-more frequency distributions.
(g) Construct the two O-gives.
(h) Estimate the value below which 75% of the viscosity values fall.
(i) What conclusions can you reach about the viscosity of the chemical?
Northern Border University
College of engineering
Industrial Engineering Department
Year : 2020-2021,1st
Term
Course : Probabilities and. Statistics
Course No.: 1405 -204
Sheet No. 1
Dr. Yehya Mesalam
Page 7 of 10
7. Complete the table, then select the correct answer.
Class limit f % f d f *d f *d2
10 - 19 10 10 3
- 30
- 90
20 - 29 10 2
- -20 40
30 - 39 f1=22 1
- f1
- 22
40 - 49 25 25 0 0 0
50 - 59 f2=23 1 f2 23
60 - 69 10 2 20 40
Sum 100 -29 215
1. The lower limit for third interval is
a- 29.5 b- 30
c- 39.5 d- 39
2. The upper limit for third interval is
a- 29.5 b- 30
c- 39.5 d- 39
3. The upper boundary for first interval
is
e- 19.5 f- 20
g- 29.5 h- 29
4. The lower boundary for second interval
is
a- 19.5 b- 20
c- 29.5 d- 29
5. The mean value is
a- 45.5 b- 41.6
c- 42.7 d- 14.445
6. The variance value is
a- 45.5 b- 41.6
c- 208.67 d- 14.445
7. The Standard deviation value is
a- 45.5 b- 41.6
c- 42.7 d- 14.445
Northern Border University
College of engineering
Industrial Engineering Department
Year : 2020-2021,1st
Term
Course : Probabilities and. Statistics
Course No.: 1405 -204
Sheet No. 1
Dr. Yehya Mesalam
Page 8 of 10
8. The C.V value is
a- 6 b- 12.418
c- 18 d- 3.54
9. The Mode value is
a- 45.5 b- 41.6
c- 42.7 d- 14.445
10. The Median value is
a- 45.5 b- 41.6
c- 42.7 d- 14.445
11. The total frequency (sample size) is
a- 6 b- 7
c- 10 d- 100
12. The relative frequency for class two is
a- 0.1 b- 10%
c- 10 d- 100
13. The percentage frequency for first class
is
a- 0.1 b- 10%
c- 10 d- 100
14. The percentage frequency for first class
is
a- 0.1 b- 10%
c- 10 d- 100
15. The class width is
a- 6 b- 7
c- 10 d- 100
16. The number of intervals are
a- 6 b- 7
c- 10 d- 100
17. The class mark for fourth class is
e- 40 f- 40.5
g- 44.5 h- 49.5
Northern Border University
College of engineering
Industrial Engineering Department
Year : 2020-2021,1st
Term
Course : Probabilities and. Statistics
Course No.: 1405 -204
Sheet No. 1
Dr. Yehya Mesalam
Page 9 of 10
8. Given the following frequency distribution;
Time (min) 11-20 21-30 31-40 41-50 51-60 61-70 71-80 Total
Frequency 3 7 12 16 10 8 4 60
Find (a) Mean and standard deviation by both long and short method;
(b) The coefficient of variation (c) the median; (d) the mode.
Northern Border University
College of engineering
Industrial Engineering Department
Year : 2020-2021,1st
Term
Course : Probabilities and. Statistics
Course No.: 1405 -204
Sheet No. 1
Dr. Yehya Mesalam
Page 10 of 10
9. Complete the table then calculates the C.V, mode and median graphically.
Class limit f d f.d f.d2
-
-
-
- 0
-
-
-
0
12
25
45
57
80
86
33
10
0
0
10
20
30
40
50
60
70
80
90
100
31.95 44.95 57.95 70.95 83.95 96.95 109.95122.95

More Related Content

Similar to Sheet 1.pdf

Me2020 (1)
Me2020 (1)Me2020 (1)
Me2020 (1)
Punit Kumar
 
Solutions Manual for Basic Business Statistics 13th Edition by Berenson
Solutions Manual for Basic Business Statistics 13th Edition by BerensonSolutions Manual for Basic Business Statistics 13th Edition by Berenson
Solutions Manual for Basic Business Statistics 13th Edition by Berenson
riven063
 
BDESIGN 2 LEDGER (2020) (344-362) (1).pdf
BDESIGN 2 LEDGER (2020) (344-362) (1).pdfBDESIGN 2 LEDGER (2020) (344-362) (1).pdf
BDESIGN 2 LEDGER (2020) (344-362) (1).pdf
DeepakM559276
 
Placement papers of all it and non it companies
Placement papers of all it and non it companiesPlacement papers of all it and non it companies
Placement papers of all it and non it companiesSachin Sharma
 
1 3 my statlab module one problem set complete solutions correct answers key
1 3 my statlab module one problem set complete solutions correct answers key1 3 my statlab module one problem set complete solutions correct answers key
1 3 my statlab module one problem set complete solutions correct answers key
Song Love
 
RME-085 TQM Unit-5 part 6
RME-085 TQM Unit-5  part 6RME-085 TQM Unit-5  part 6
RME-085 TQM Unit-5 part 6
ssuserf6c4bd
 
Grade 10 Science 2018 Exam
Grade 10 Science 2018 ExamGrade 10 Science 2018 Exam
Grade 10 Science 2018 Exam
Neil MacIntosh
 
MULTIPLE CHOICE. Record your answer choices. 1.7.2.8.docx
MULTIPLE CHOICE.   Record your answer choices. 1.7.2.8.docxMULTIPLE CHOICE.   Record your answer choices. 1.7.2.8.docx
MULTIPLE CHOICE. Record your answer choices. 1.7.2.8.docx
gilpinleeanna
 
0625 s11 qp_63
0625 s11 qp_630625 s11 qp_63
0625 s11 qp_63King Ali
 
Final exam management 2019
Final exam management 2019Final exam management 2019
Final exam management 2019
cairo university
 
Optimization of Process Parameters Using Taguchi for Friction Stir Welding of...
Optimization of Process Parameters Using Taguchi for Friction Stir Welding of...Optimization of Process Parameters Using Taguchi for Friction Stir Welding of...
Optimization of Process Parameters Using Taguchi for Friction Stir Welding of...
IRJET Journal
 
9702 s09 ms_all
9702 s09 ms_all9702 s09 ms_all
9702 s09 ms_all
Sajit Chandra Shakya
 
Business studies
Business studiesBusiness studies
Business studies
harold9
 
Buckling test
Buckling test Buckling test
Buckling test
Saif al-din ali
 
CXC MATHEMATICS MULTIPLE CHOICE
CXC MATHEMATICS MULTIPLE CHOICECXC MATHEMATICS MULTIPLE CHOICE
CXC MATHEMATICS MULTIPLE CHOICE
MadanaDookieram
 
P79 mba202
P79 mba202P79 mba202
P79 mba202
Sonal Patil
 
0625 w10 qp_63
0625 w10 qp_630625 w10 qp_63
0625 w10 qp_63King Ali
 
0625 s10 qp_61
0625 s10 qp_610625 s10 qp_61
0625 s10 qp_61King Ali
 
Week 1 Practice SetUniversity of Phoenix MaterialPract.docx
Week 1 Practice SetUniversity of Phoenix MaterialPract.docxWeek 1 Practice SetUniversity of Phoenix MaterialPract.docx
Week 1 Practice SetUniversity of Phoenix MaterialPract.docx
nealralix138661
 
Presentation2_Agus Widyianto_MSME.pdf
Presentation2_Agus Widyianto_MSME.pdfPresentation2_Agus Widyianto_MSME.pdf
Presentation2_Agus Widyianto_MSME.pdf
AgusWidyianto2
 

Similar to Sheet 1.pdf (20)

Me2020 (1)
Me2020 (1)Me2020 (1)
Me2020 (1)
 
Solutions Manual for Basic Business Statistics 13th Edition by Berenson
Solutions Manual for Basic Business Statistics 13th Edition by BerensonSolutions Manual for Basic Business Statistics 13th Edition by Berenson
Solutions Manual for Basic Business Statistics 13th Edition by Berenson
 
BDESIGN 2 LEDGER (2020) (344-362) (1).pdf
BDESIGN 2 LEDGER (2020) (344-362) (1).pdfBDESIGN 2 LEDGER (2020) (344-362) (1).pdf
BDESIGN 2 LEDGER (2020) (344-362) (1).pdf
 
Placement papers of all it and non it companies
Placement papers of all it and non it companiesPlacement papers of all it and non it companies
Placement papers of all it and non it companies
 
1 3 my statlab module one problem set complete solutions correct answers key
1 3 my statlab module one problem set complete solutions correct answers key1 3 my statlab module one problem set complete solutions correct answers key
1 3 my statlab module one problem set complete solutions correct answers key
 
RME-085 TQM Unit-5 part 6
RME-085 TQM Unit-5  part 6RME-085 TQM Unit-5  part 6
RME-085 TQM Unit-5 part 6
 
Grade 10 Science 2018 Exam
Grade 10 Science 2018 ExamGrade 10 Science 2018 Exam
Grade 10 Science 2018 Exam
 
MULTIPLE CHOICE. Record your answer choices. 1.7.2.8.docx
MULTIPLE CHOICE.   Record your answer choices. 1.7.2.8.docxMULTIPLE CHOICE.   Record your answer choices. 1.7.2.8.docx
MULTIPLE CHOICE. Record your answer choices. 1.7.2.8.docx
 
0625 s11 qp_63
0625 s11 qp_630625 s11 qp_63
0625 s11 qp_63
 
Final exam management 2019
Final exam management 2019Final exam management 2019
Final exam management 2019
 
Optimization of Process Parameters Using Taguchi for Friction Stir Welding of...
Optimization of Process Parameters Using Taguchi for Friction Stir Welding of...Optimization of Process Parameters Using Taguchi for Friction Stir Welding of...
Optimization of Process Parameters Using Taguchi for Friction Stir Welding of...
 
9702 s09 ms_all
9702 s09 ms_all9702 s09 ms_all
9702 s09 ms_all
 
Business studies
Business studiesBusiness studies
Business studies
 
Buckling test
Buckling test Buckling test
Buckling test
 
CXC MATHEMATICS MULTIPLE CHOICE
CXC MATHEMATICS MULTIPLE CHOICECXC MATHEMATICS MULTIPLE CHOICE
CXC MATHEMATICS MULTIPLE CHOICE
 
P79 mba202
P79 mba202P79 mba202
P79 mba202
 
0625 w10 qp_63
0625 w10 qp_630625 w10 qp_63
0625 w10 qp_63
 
0625 s10 qp_61
0625 s10 qp_610625 s10 qp_61
0625 s10 qp_61
 
Week 1 Practice SetUniversity of Phoenix MaterialPract.docx
Week 1 Practice SetUniversity of Phoenix MaterialPract.docxWeek 1 Practice SetUniversity of Phoenix MaterialPract.docx
Week 1 Practice SetUniversity of Phoenix MaterialPract.docx
 
Presentation2_Agus Widyianto_MSME.pdf
Presentation2_Agus Widyianto_MSME.pdfPresentation2_Agus Widyianto_MSME.pdf
Presentation2_Agus Widyianto_MSME.pdf
 

More from Mohamed Ali

Chapter 7 2022.pdf
Chapter 7 2022.pdfChapter 7 2022.pdf
Chapter 7 2022.pdf
Mohamed Ali
 
Chapter 2 2022.pdf
Chapter 2 2022.pdfChapter 2 2022.pdf
Chapter 2 2022.pdf
Mohamed Ali
 
Chapter 1 2022.pdf
Chapter 1 2022.pdfChapter 1 2022.pdf
Chapter 1 2022.pdf
Mohamed Ali
 
Chapter 1 2021.pdf
Chapter 1 2021.pdfChapter 1 2021.pdf
Chapter 1 2021.pdf
Mohamed Ali
 
Chapter 6 2022.pdf
Chapter 6 2022.pdfChapter 6 2022.pdf
Chapter 6 2022.pdf
Mohamed Ali
 
Chapter 5 2022.pdf
Chapter 5 2022.pdfChapter 5 2022.pdf
Chapter 5 2022.pdf
Mohamed Ali
 
Chapter 3 2022.pdf
Chapter 3 2022.pdfChapter 3 2022.pdf
Chapter 3 2022.pdf
Mohamed Ali
 
Chapter 4 2022.pdf
Chapter 4 2022.pdfChapter 4 2022.pdf
Chapter 4 2022.pdf
Mohamed Ali
 
Ch 6.pdf
Ch 6.pdfCh 6.pdf
Ch 6.pdf
Mohamed Ali
 
Ch 5.pdf
Ch 5.pdfCh 5.pdf
Ch 5.pdf
Mohamed Ali
 
Ch 4.pdf
Ch 4.pdfCh 4.pdf
Ch 4.pdf
Mohamed Ali
 
Ch 3.pdf
Ch 3.pdfCh 3.pdf
Ch 3.pdf
Mohamed Ali
 
Ch 2.pdf
Ch 2.pdfCh 2.pdf
Ch 2.pdf
Mohamed Ali
 
Ch 1.pdf
Ch 1.pdfCh 1.pdf
Ch 1.pdf
Mohamed Ali
 
information system Ch 2
information system Ch 2information system Ch 2
information system Ch 2
Mohamed Ali
 
Information system
Information systemInformation system
Information system
Mohamed Ali
 

More from Mohamed Ali (16)

Chapter 7 2022.pdf
Chapter 7 2022.pdfChapter 7 2022.pdf
Chapter 7 2022.pdf
 
Chapter 2 2022.pdf
Chapter 2 2022.pdfChapter 2 2022.pdf
Chapter 2 2022.pdf
 
Chapter 1 2022.pdf
Chapter 1 2022.pdfChapter 1 2022.pdf
Chapter 1 2022.pdf
 
Chapter 1 2021.pdf
Chapter 1 2021.pdfChapter 1 2021.pdf
Chapter 1 2021.pdf
 
Chapter 6 2022.pdf
Chapter 6 2022.pdfChapter 6 2022.pdf
Chapter 6 2022.pdf
 
Chapter 5 2022.pdf
Chapter 5 2022.pdfChapter 5 2022.pdf
Chapter 5 2022.pdf
 
Chapter 3 2022.pdf
Chapter 3 2022.pdfChapter 3 2022.pdf
Chapter 3 2022.pdf
 
Chapter 4 2022.pdf
Chapter 4 2022.pdfChapter 4 2022.pdf
Chapter 4 2022.pdf
 
Ch 6.pdf
Ch 6.pdfCh 6.pdf
Ch 6.pdf
 
Ch 5.pdf
Ch 5.pdfCh 5.pdf
Ch 5.pdf
 
Ch 4.pdf
Ch 4.pdfCh 4.pdf
Ch 4.pdf
 
Ch 3.pdf
Ch 3.pdfCh 3.pdf
Ch 3.pdf
 
Ch 2.pdf
Ch 2.pdfCh 2.pdf
Ch 2.pdf
 
Ch 1.pdf
Ch 1.pdfCh 1.pdf
Ch 1.pdf
 
information system Ch 2
information system Ch 2information system Ch 2
information system Ch 2
 
Information system
Information systemInformation system
Information system
 

Recently uploaded

TECHNICAL TRAINING MANUAL GENERAL FAMILIARIZATION COURSE
TECHNICAL TRAINING MANUAL   GENERAL FAMILIARIZATION COURSETECHNICAL TRAINING MANUAL   GENERAL FAMILIARIZATION COURSE
TECHNICAL TRAINING MANUAL GENERAL FAMILIARIZATION COURSE
DuvanRamosGarzon1
 
J.Yang, ICLR 2024, MLILAB, KAIST AI.pdf
J.Yang,  ICLR 2024, MLILAB, KAIST AI.pdfJ.Yang,  ICLR 2024, MLILAB, KAIST AI.pdf
J.Yang, ICLR 2024, MLILAB, KAIST AI.pdf
MLILAB
 
Halogenation process of chemical process industries
Halogenation process of chemical process industriesHalogenation process of chemical process industries
Halogenation process of chemical process industries
MuhammadTufail242431
 
Cosmetic shop management system project report.pdf
Cosmetic shop management system project report.pdfCosmetic shop management system project report.pdf
Cosmetic shop management system project report.pdf
Kamal Acharya
 
H.Seo, ICLR 2024, MLILAB, KAIST AI.pdf
H.Seo,  ICLR 2024, MLILAB,  KAIST AI.pdfH.Seo,  ICLR 2024, MLILAB,  KAIST AI.pdf
H.Seo, ICLR 2024, MLILAB, KAIST AI.pdf
MLILAB
 
block diagram and signal flow graph representation
block diagram and signal flow graph representationblock diagram and signal flow graph representation
block diagram and signal flow graph representation
Divya Somashekar
 
Standard Reomte Control Interface - Neometrix
Standard Reomte Control Interface - NeometrixStandard Reomte Control Interface - Neometrix
Standard Reomte Control Interface - Neometrix
Neometrix_Engineering_Pvt_Ltd
 
WATER CRISIS and its solutions-pptx 1234
WATER CRISIS and its solutions-pptx 1234WATER CRISIS and its solutions-pptx 1234
WATER CRISIS and its solutions-pptx 1234
AafreenAbuthahir2
 
Planning Of Procurement o different goods and services
Planning Of Procurement o different goods and servicesPlanning Of Procurement o different goods and services
Planning Of Procurement o different goods and services
JoytuBarua2
 
Courier management system project report.pdf
Courier management system project report.pdfCourier management system project report.pdf
Courier management system project report.pdf
Kamal Acharya
 
The Benefits and Techniques of Trenchless Pipe Repair.pdf
The Benefits and Techniques of Trenchless Pipe Repair.pdfThe Benefits and Techniques of Trenchless Pipe Repair.pdf
The Benefits and Techniques of Trenchless Pipe Repair.pdf
Pipe Restoration Solutions
 
Vaccine management system project report documentation..pdf
Vaccine management system project report documentation..pdfVaccine management system project report documentation..pdf
Vaccine management system project report documentation..pdf
Kamal Acharya
 
DESIGN A COTTON SEED SEPARATION MACHINE.docx
DESIGN A COTTON SEED SEPARATION MACHINE.docxDESIGN A COTTON SEED SEPARATION MACHINE.docx
DESIGN A COTTON SEED SEPARATION MACHINE.docx
FluxPrime1
 
Immunizing Image Classifiers Against Localized Adversary Attacks
Immunizing Image Classifiers Against Localized Adversary AttacksImmunizing Image Classifiers Against Localized Adversary Attacks
Immunizing Image Classifiers Against Localized Adversary Attacks
gerogepatton
 
COLLEGE BUS MANAGEMENT SYSTEM PROJECT REPORT.pdf
COLLEGE BUS MANAGEMENT SYSTEM PROJECT REPORT.pdfCOLLEGE BUS MANAGEMENT SYSTEM PROJECT REPORT.pdf
COLLEGE BUS MANAGEMENT SYSTEM PROJECT REPORT.pdf
Kamal Acharya
 
Quality defects in TMT Bars, Possible causes and Potential Solutions.
Quality defects in TMT Bars, Possible causes and Potential Solutions.Quality defects in TMT Bars, Possible causes and Potential Solutions.
Quality defects in TMT Bars, Possible causes and Potential Solutions.
PrashantGoswami42
 
power quality voltage fluctuation UNIT - I.pptx
power quality voltage fluctuation UNIT - I.pptxpower quality voltage fluctuation UNIT - I.pptx
power quality voltage fluctuation UNIT - I.pptx
ViniHema
 
Event Management System Vb Net Project Report.pdf
Event Management System Vb Net  Project Report.pdfEvent Management System Vb Net  Project Report.pdf
Event Management System Vb Net Project Report.pdf
Kamal Acharya
 
一比一原版(SFU毕业证)西蒙菲莎大学毕业证成绩单如何办理
一比一原版(SFU毕业证)西蒙菲莎大学毕业证成绩单如何办理一比一原版(SFU毕业证)西蒙菲莎大学毕业证成绩单如何办理
一比一原版(SFU毕业证)西蒙菲莎大学毕业证成绩单如何办理
bakpo1
 
Architectural Portfolio Sean Lockwood
Architectural Portfolio Sean LockwoodArchitectural Portfolio Sean Lockwood
Architectural Portfolio Sean Lockwood
seandesed
 

Recently uploaded (20)

TECHNICAL TRAINING MANUAL GENERAL FAMILIARIZATION COURSE
TECHNICAL TRAINING MANUAL   GENERAL FAMILIARIZATION COURSETECHNICAL TRAINING MANUAL   GENERAL FAMILIARIZATION COURSE
TECHNICAL TRAINING MANUAL GENERAL FAMILIARIZATION COURSE
 
J.Yang, ICLR 2024, MLILAB, KAIST AI.pdf
J.Yang,  ICLR 2024, MLILAB, KAIST AI.pdfJ.Yang,  ICLR 2024, MLILAB, KAIST AI.pdf
J.Yang, ICLR 2024, MLILAB, KAIST AI.pdf
 
Halogenation process of chemical process industries
Halogenation process of chemical process industriesHalogenation process of chemical process industries
Halogenation process of chemical process industries
 
Cosmetic shop management system project report.pdf
Cosmetic shop management system project report.pdfCosmetic shop management system project report.pdf
Cosmetic shop management system project report.pdf
 
H.Seo, ICLR 2024, MLILAB, KAIST AI.pdf
H.Seo,  ICLR 2024, MLILAB,  KAIST AI.pdfH.Seo,  ICLR 2024, MLILAB,  KAIST AI.pdf
H.Seo, ICLR 2024, MLILAB, KAIST AI.pdf
 
block diagram and signal flow graph representation
block diagram and signal flow graph representationblock diagram and signal flow graph representation
block diagram and signal flow graph representation
 
Standard Reomte Control Interface - Neometrix
Standard Reomte Control Interface - NeometrixStandard Reomte Control Interface - Neometrix
Standard Reomte Control Interface - Neometrix
 
WATER CRISIS and its solutions-pptx 1234
WATER CRISIS and its solutions-pptx 1234WATER CRISIS and its solutions-pptx 1234
WATER CRISIS and its solutions-pptx 1234
 
Planning Of Procurement o different goods and services
Planning Of Procurement o different goods and servicesPlanning Of Procurement o different goods and services
Planning Of Procurement o different goods and services
 
Courier management system project report.pdf
Courier management system project report.pdfCourier management system project report.pdf
Courier management system project report.pdf
 
The Benefits and Techniques of Trenchless Pipe Repair.pdf
The Benefits and Techniques of Trenchless Pipe Repair.pdfThe Benefits and Techniques of Trenchless Pipe Repair.pdf
The Benefits and Techniques of Trenchless Pipe Repair.pdf
 
Vaccine management system project report documentation..pdf
Vaccine management system project report documentation..pdfVaccine management system project report documentation..pdf
Vaccine management system project report documentation..pdf
 
DESIGN A COTTON SEED SEPARATION MACHINE.docx
DESIGN A COTTON SEED SEPARATION MACHINE.docxDESIGN A COTTON SEED SEPARATION MACHINE.docx
DESIGN A COTTON SEED SEPARATION MACHINE.docx
 
Immunizing Image Classifiers Against Localized Adversary Attacks
Immunizing Image Classifiers Against Localized Adversary AttacksImmunizing Image Classifiers Against Localized Adversary Attacks
Immunizing Image Classifiers Against Localized Adversary Attacks
 
COLLEGE BUS MANAGEMENT SYSTEM PROJECT REPORT.pdf
COLLEGE BUS MANAGEMENT SYSTEM PROJECT REPORT.pdfCOLLEGE BUS MANAGEMENT SYSTEM PROJECT REPORT.pdf
COLLEGE BUS MANAGEMENT SYSTEM PROJECT REPORT.pdf
 
Quality defects in TMT Bars, Possible causes and Potential Solutions.
Quality defects in TMT Bars, Possible causes and Potential Solutions.Quality defects in TMT Bars, Possible causes and Potential Solutions.
Quality defects in TMT Bars, Possible causes and Potential Solutions.
 
power quality voltage fluctuation UNIT - I.pptx
power quality voltage fluctuation UNIT - I.pptxpower quality voltage fluctuation UNIT - I.pptx
power quality voltage fluctuation UNIT - I.pptx
 
Event Management System Vb Net Project Report.pdf
Event Management System Vb Net  Project Report.pdfEvent Management System Vb Net  Project Report.pdf
Event Management System Vb Net Project Report.pdf
 
一比一原版(SFU毕业证)西蒙菲莎大学毕业证成绩单如何办理
一比一原版(SFU毕业证)西蒙菲莎大学毕业证成绩单如何办理一比一原版(SFU毕业证)西蒙菲莎大学毕业证成绩单如何办理
一比一原版(SFU毕业证)西蒙菲莎大学毕业证成绩单如何办理
 
Architectural Portfolio Sean Lockwood
Architectural Portfolio Sean LockwoodArchitectural Portfolio Sean Lockwood
Architectural Portfolio Sean Lockwood
 

Sheet 1.pdf

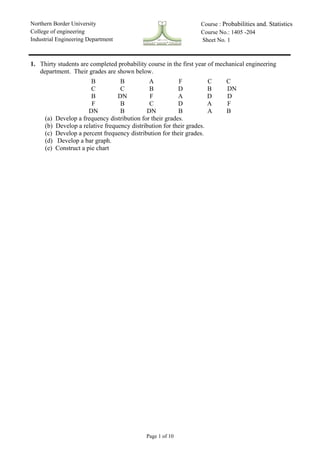
  • 1. Northern Border University College of engineering Industrial Engineering Department Year : 2020-2021,1st Term Course : Probabilities and. Statistics Course No.: 1405 -204 Sheet No. 1 Dr. Yehya Mesalam Page 1 of 10 1. Thirty students are completed probability course in the first year of mechanical engineering department. Their grades are shown below. B B A F C C C C B D B DN B DN F A D D F B C D A F DN B DN B A B (a) Develop a frequency distribution for their grades. (b) Develop a relative frequency distribution for their grades. (c) Develop a percent frequency distribution for their grades. (d) Develop a bar graph. (e) Construct a pie chart
  • 2. Northern Border University College of engineering Industrial Engineering Department Year : 2020-2021,1st Term Course : Probabilities and. Statistics Course No.: 1405 -204 Sheet No. 1 Dr. Yehya Mesalam Page 2 of 10 2. The following measurements were recorded for the cooking time, in hours, of a certain type of Meat 3.6 2.5 4.8 4.9 3.6 2.9 3.4 5.6 3.7 2.8 4.4 4.0 5.2 3.0 4.8 4.8 4.0 5.9 6.5 4.8 Assume that the measurements are a simple random sample. (a) What is the sample size for the above sample? (b) Calculate the sample mean for these data. (c) Calculate the sample median. (d) Plot the data by way of a dot plot.
  • 3. Northern Border University College of engineering Industrial Engineering Department Year : 2020-2021,1st Term Course : Probabilities and. Statistics Course No.: 1405 -204 Sheet No. 1 Dr. Yehya Mesalam Page 3 of 10 3. Construct a stem-and-leaf display for the following data, Then calculate the mean, mode, and median, for the following data 10.7 4.9 8.9 11.7 6.3 7.7 3.3 4.9 8.3 10.2 11.9 7.7 8.9 6.4 6.3 7.7 3.9 4.9 8.9 10.6 10.9 4.9 8.9 11.7 9.3 7.3 10.3 4.9 8.7 10. 4 7.4 6.9 4.2
  • 4. Northern Border University College of engineering Industrial Engineering Department Year : 2020-2021,1st Term Course : Probabilities and. Statistics Course No.: 1405 -204 Sheet No. 1 Dr. Yehya Mesalam Page 4 of 10 4. The following are historical data on staff salaries (dollars per hour) for 30 schools sampled in the eastern part of the United States in the early 1970s. 3.79 2.99 2.77 2.91 3.10 1.84 2.52 3.22 3.14 2.68 2.45 2.14 2.67 2.52 2.71 2.75 3.57 3.85 3.54 3.51 3.36 2.05 2.89 2.83 3.13 2.44 2.10 3.71 2.37 3.37 (a) Compute the sample mean and sample standard deviation. (b) Construct a stem-and-leaf display of the data. (c) Construct a box plot.
  • 5. Northern Border University College of engineering Industrial Engineering Department Year : 2020-2021,1st Term Course : Probabilities and. Statistics Course No.: 1405 -204 Sheet No. 1 Dr. Yehya Mesalam Page 5 of 10 5. In a certain company the mean annual vacation period is 15 day. Fourteen employees were randomly chosen from this company and their vacation days inquired. The following data were obtained: 6, 12, 11, 12, 10, 7, 12, 14, 16, 18, 11, 12, 16, 17. Select the correct answer 1. The range value is a- 6 b- 12 c- 14 d- 18 2. The Mean value is a- 12.429 b- 12.418 c- 12 d- 3.54 3. The variance value is a- 6 b- 12.418 c- 12.429 d- 3.54 4. The Standard deviation value is a- 6 b- 12.418 c- 12.429 d- 3.54 5. The C.V value is a- 0.5 b- 14 c- 0.283 d- 0.354 6. The Mode value is a- 6 b- 12 c- 14 d- 18 7. The Median value is a- 6 b- 12 c- 14 d- 18 8. The sample size is a- 11 b- 12 c- 14 d- 18 9. The Maximum value is a- 6 b- 12 c- 14 d- 18 10. The minimum value is a- 6 b- 7 c- 11 d- 12
  • 6. Northern Border University College of engineering Industrial Engineering Department Year : 2020-2021,1st Term Course : Probabilities and. Statistics Course No.: 1405 -204 Sheet No. 1 Dr. Yehya Mesalam Page 6 of 10 6. The following data represent the viscosity (friction, as in automobile oil) taken from 120 manufacturing batches (ordered from lowest viscosity to highest viscosity). 12.6 12.8 13.0 13.1 13.3 13.3 13.4 13.5 13.6 13.7 13.7 13.7 13.8 13.8 13.9 13.9 14.0 14.0 14.0 14.1 14.1 14.1 14.2 14.2 14.2 14.3 14.3 14.3 14.3 14.3 14.3 14.4 14.4 14.4 14.4 14.4 14.4 14.4 14.4 14.5 14.5 14.5 14.5 14.5 14.5 14.6 14.6 14.6 14.7 14.7 14.8 14.8 14.8 14.8 14.9 14.9 14.9 14.9 14.9 14.9 14.9 15.0 15.0 15.0 15.0 15.1 15.1 15.1 15.1 15.2 15.2 15.2 15.2 15.2 15.2 15.2 15.2 15.3 15.3 15.3 15.3 15.3 15.4 15.4 15.4 15.4 15.5 15.5 15.6 15.6 15.6 15.6 15.6 15.7 15.7 15.7 15.8 15.8 15.9 15.9 16.0 16.0 16.0 16.0 16.1 16.1 16.1 16.2 16.3 16.4 16.4 16.5 16.5 16.6 16.8 16.9 16.9 17.0 17.6 18.6 Using 7 equal intervals with the lowest starting at 12. (a) Set up a frequency and a relative frequency distribution. (b) Construct a frequency polygon and a frequency histogram. (c) Construct a relative frequency histogram (d) The median and the mode (analytically and graphically) (e) The mean and the variance using both the long method and the short-cut method. (f) Set up a less than and an or-more frequency distributions. (g) Construct the two O-gives. (h) Estimate the value below which 75% of the viscosity values fall. (i) What conclusions can you reach about the viscosity of the chemical?
  • 7. Northern Border University College of engineering Industrial Engineering Department Year : 2020-2021,1st Term Course : Probabilities and. Statistics Course No.: 1405 -204 Sheet No. 1 Dr. Yehya Mesalam Page 7 of 10 7. Complete the table, then select the correct answer. Class limit f % f d f *d f *d2 10 - 19 10 10 3 - 30 - 90 20 - 29 10 2 - -20 40 30 - 39 f1=22 1 - f1 - 22 40 - 49 25 25 0 0 0 50 - 59 f2=23 1 f2 23 60 - 69 10 2 20 40 Sum 100 -29 215 1. The lower limit for third interval is a- 29.5 b- 30 c- 39.5 d- 39 2. The upper limit for third interval is a- 29.5 b- 30 c- 39.5 d- 39 3. The upper boundary for first interval is e- 19.5 f- 20 g- 29.5 h- 29 4. The lower boundary for second interval is a- 19.5 b- 20 c- 29.5 d- 29 5. The mean value is a- 45.5 b- 41.6 c- 42.7 d- 14.445 6. The variance value is a- 45.5 b- 41.6 c- 208.67 d- 14.445 7. The Standard deviation value is a- 45.5 b- 41.6 c- 42.7 d- 14.445
  • 8. Northern Border University College of engineering Industrial Engineering Department Year : 2020-2021,1st Term Course : Probabilities and. Statistics Course No.: 1405 -204 Sheet No. 1 Dr. Yehya Mesalam Page 8 of 10 8. The C.V value is a- 6 b- 12.418 c- 18 d- 3.54 9. The Mode value is a- 45.5 b- 41.6 c- 42.7 d- 14.445 10. The Median value is a- 45.5 b- 41.6 c- 42.7 d- 14.445 11. The total frequency (sample size) is a- 6 b- 7 c- 10 d- 100 12. The relative frequency for class two is a- 0.1 b- 10% c- 10 d- 100 13. The percentage frequency for first class is a- 0.1 b- 10% c- 10 d- 100 14. The percentage frequency for first class is a- 0.1 b- 10% c- 10 d- 100 15. The class width is a- 6 b- 7 c- 10 d- 100 16. The number of intervals are a- 6 b- 7 c- 10 d- 100 17. The class mark for fourth class is e- 40 f- 40.5 g- 44.5 h- 49.5
  • 9. Northern Border University College of engineering Industrial Engineering Department Year : 2020-2021,1st Term Course : Probabilities and. Statistics Course No.: 1405 -204 Sheet No. 1 Dr. Yehya Mesalam Page 9 of 10 8. Given the following frequency distribution; Time (min) 11-20 21-30 31-40 41-50 51-60 61-70 71-80 Total Frequency 3 7 12 16 10 8 4 60 Find (a) Mean and standard deviation by both long and short method; (b) The coefficient of variation (c) the median; (d) the mode.
  • 10. Northern Border University College of engineering Industrial Engineering Department Year : 2020-2021,1st Term Course : Probabilities and. Statistics Course No.: 1405 -204 Sheet No. 1 Dr. Yehya Mesalam Page 10 of 10 9. Complete the table then calculates the C.V, mode and median graphically. Class limit f d f.d f.d2 - - - - 0 - - - 0 12 25 45 57 80 86 33 10 0 0 10 20 30 40 50 60 70 80 90 100 31.95 44.95 57.95 70.95 83.95 96.95 109.95122.95