Downloaded 79 times
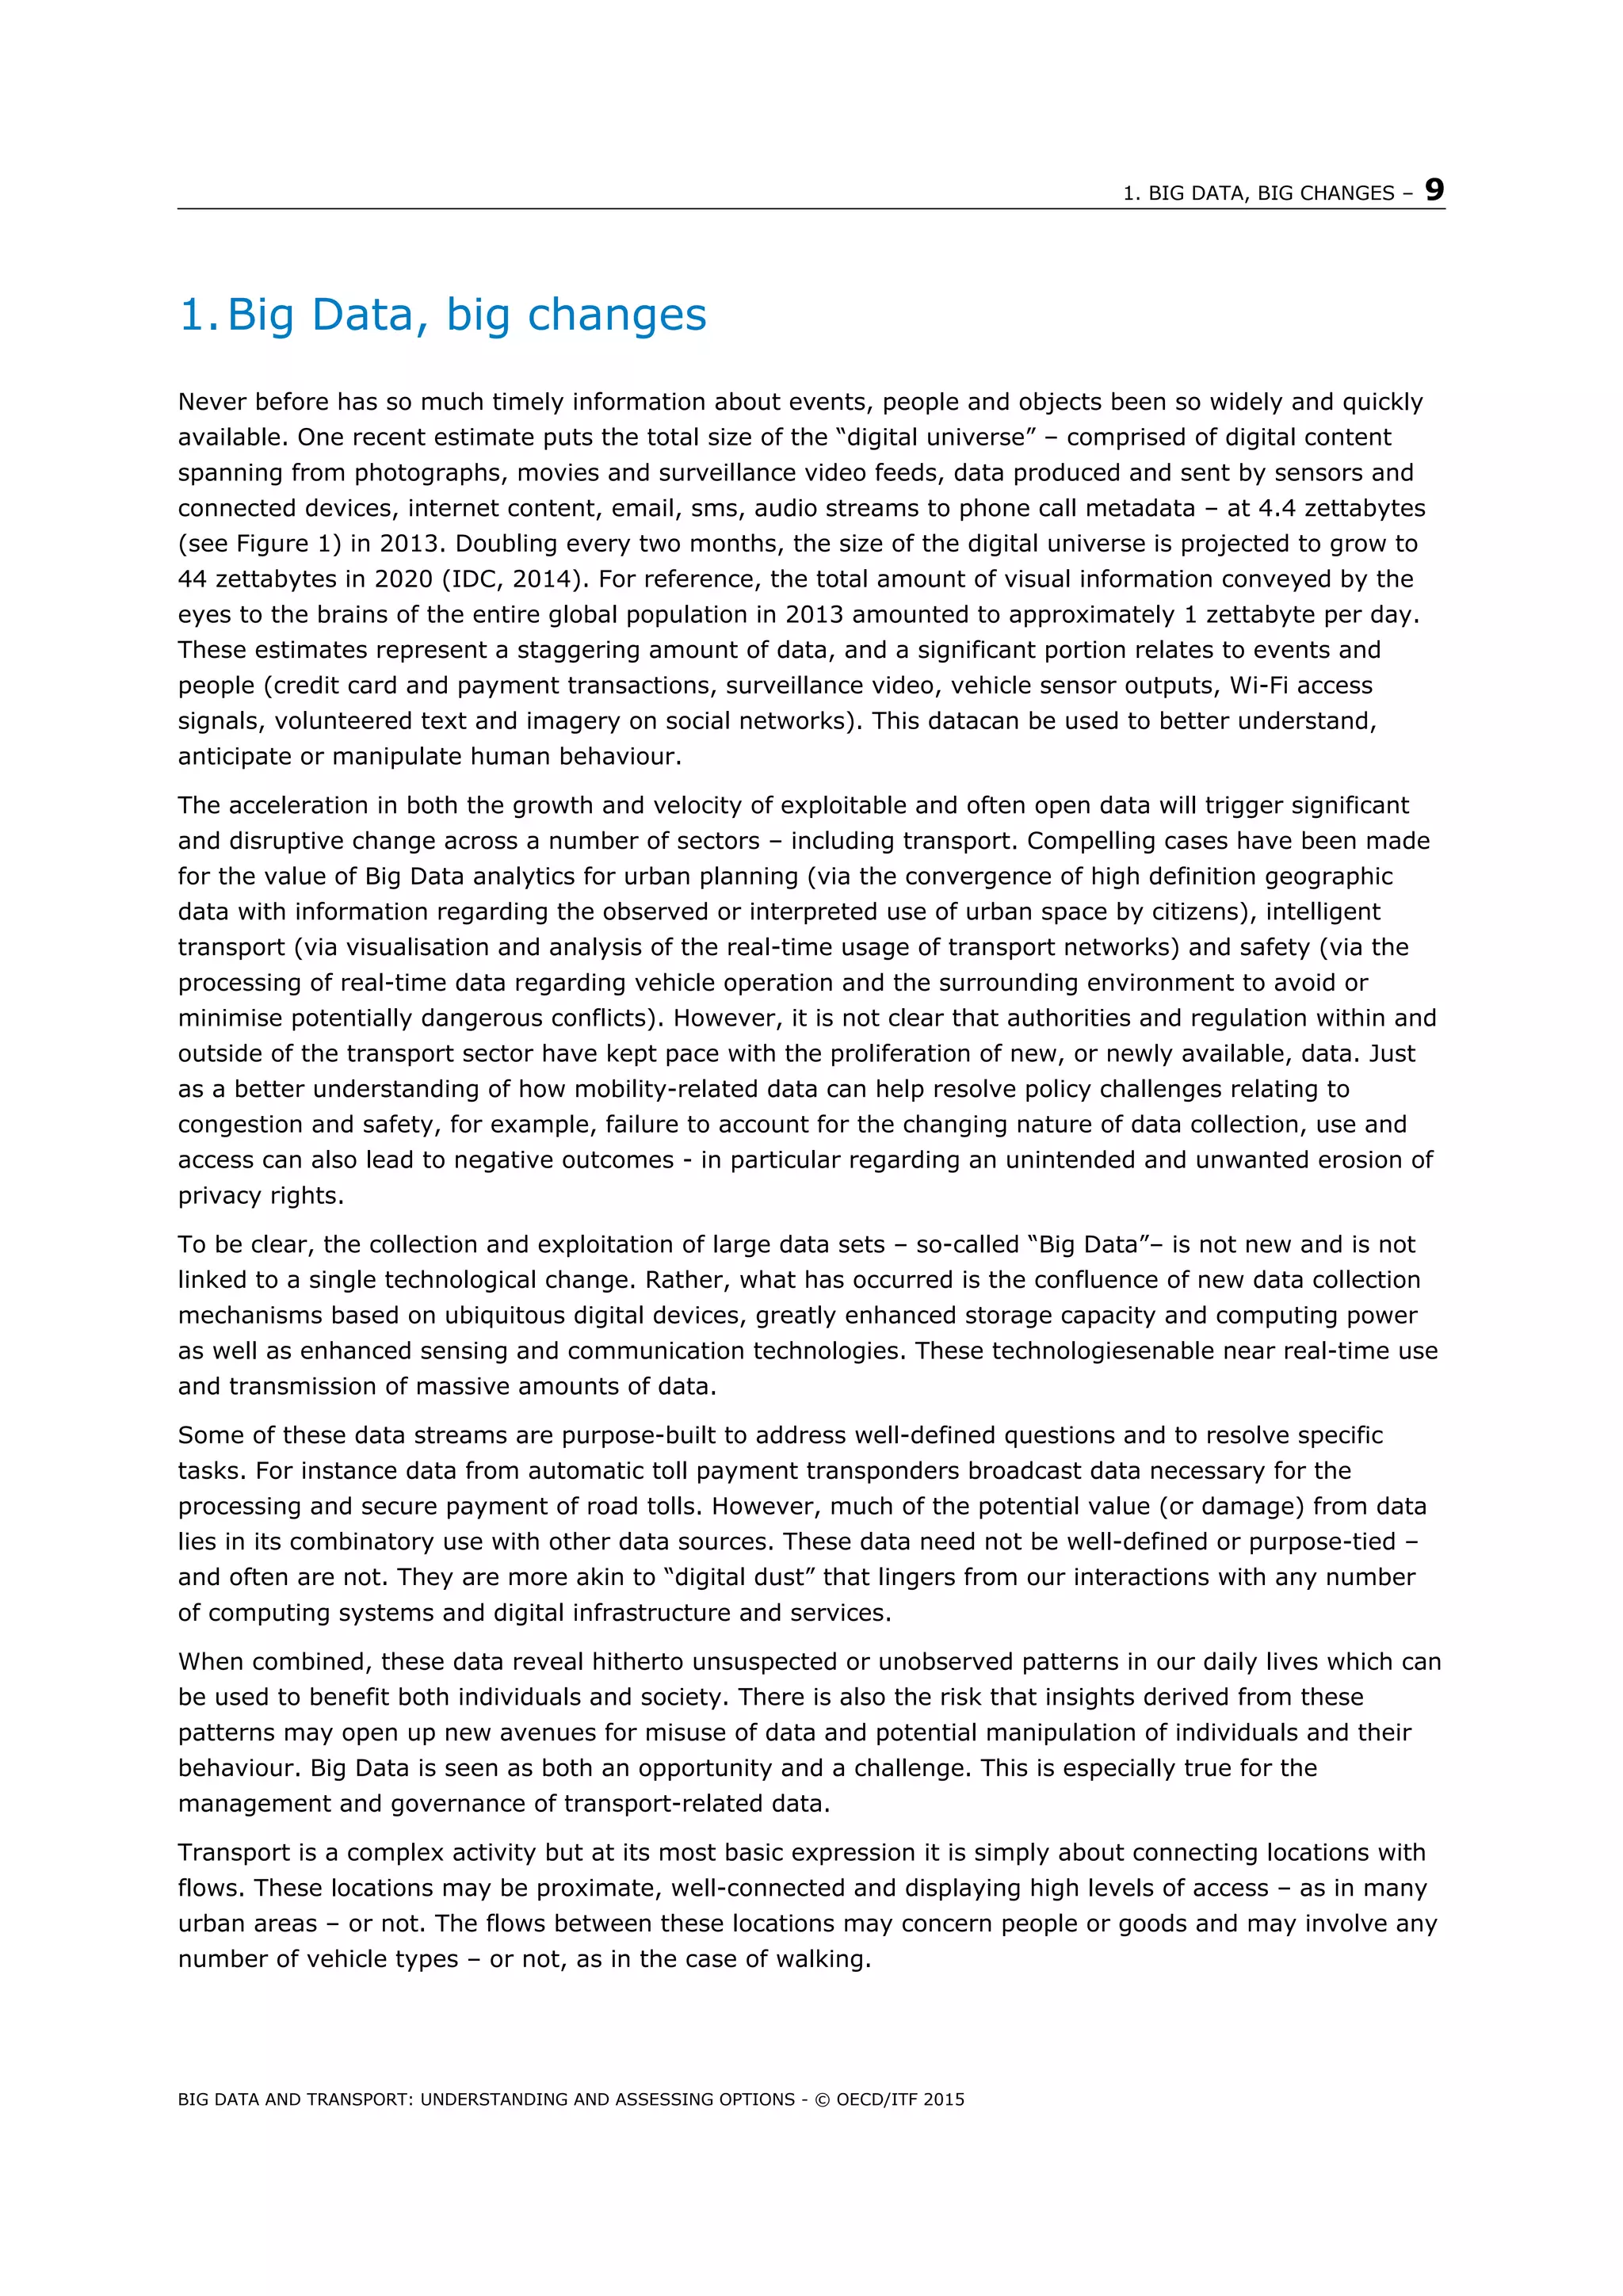
![40 – 3. BIG DATA, PERSONAL DATA AND PRIVACY
BIG DATA AND TRANSPORT: UNDERSTANDING AND ASSESSING OPTIONS - © OECD/ITF 2015
subject itself but harvested from ambient data sources or emerges ex-post from co-mingling of various data
streams. This risk increases with the growth in data volumes and, especially, the growth in data sources
like smart phones and other personal mobile devices.
In the second instance, it stresses that the value emerging from data collection and analytics increasingly
emerges after the fact and after combining and mining diverse data streams. The President’s Council of
Advisors on Science and Technology suggests that compelling benefits emerge from retaining personal or
potentially personably identifiable data for subsequent re-analysis as analytical techniques evolve.
Arbitrarily requiring data to be deleted would, they argue, stifle innovative insights and uses that may
otherwise emerge.
Effectively anonymising or otherwise obscuring personal information within retained data would moot
privacy concerns relating to data retention. But the proliferation of Big Data sets and the multiplication of
data sources erode the effectiveness of anonymisation and de-identification techniques.
The Executive Office report also highlights the challenge of enacting meaningful consent from citizens and
consumers. Consumers are often presented with an exhaustive notification text while they are trying to
access a particular service. The app or service provider may have spent considerable effort and legal
expertise crafting a thorough consent notification document that does not conflict with the service
provider’s commercial interest. However, the consumer in a hurry to access a service rarely reviews such a
notification, rendering any consent they provide as superficial or blind. In this way, data protection efforts
may in fact be weakened rather than strengthened by the current notice and consent framework.
Additionally, the intersection between the need to provide notice and consent under current regulatory
frameworks and the practice of broadly and open-endedly mining data has resulted in increasingly wide-
ranging and permissive privacy notice and consent clauses. This has led to a situation where data subjects
may willingly agree to an erosion of their privacy rights because they are neither engaged in a meaningful
way and because of overly broad conditions regarding use of their data.
Faced with these challenges, the report of the Executive Office asks “whether a greater focus on how data
is used and reused would be a more productive basis for managing privacy rights in a big data
environment”. (Executive Office of the President, 2014) In particular, the President’s Council of Advisors on
Science and Technology notes that:
“…the non-obvious nature of Big Data’s products of analysis make it all but impossible for an
individual to make fine-grained privacy choices for every new situation or app. For the
principle of Individual Control to have meaning, [we] believe that the burden should no longer
fall on the consumer to manage privacy for each company with which the consumer interacts
by a framework like “notice and consent.” Rather, each company should take responsibility for
conforming its uses of personal data to a personal privacy profile designated by the consumer
and made available to that company (including from a third party designated by the
consumer)”. (PCAST, 2014)
This view is shared by many industry actors (see below) and, if implemented, would signal a strong break
from existing data protection frameworks like those outlined in the OECD principles and in EU legislation.
Private-sector initiatives
Since the update to the OECD principles, two private-sector initiatives have sought to push the regulatory
framework further still. The first initiative, led by Microsoft Corporation and organised by the Oxford
University Internet Institute, released the report “Data Protection Principles for the 21st
Century”. (OII,
2014) The second initiative, organised by the World Economic Forum (WEF) in collaboration with the Boston](https://image.slidesharecdn.com/itf-cpb-transportbigdata-150528190325-lva1-app6892/75/Big-Data-and-Transport-Understanding-and-assessing-options-41-2048.jpg)

![BIBLIOGRAPHY – 59
BIG DATA AND TRANSPORT: UNDERSTANDING AND ASSESSING OPTIONS - © OECD/ITF 2015
Bibliography
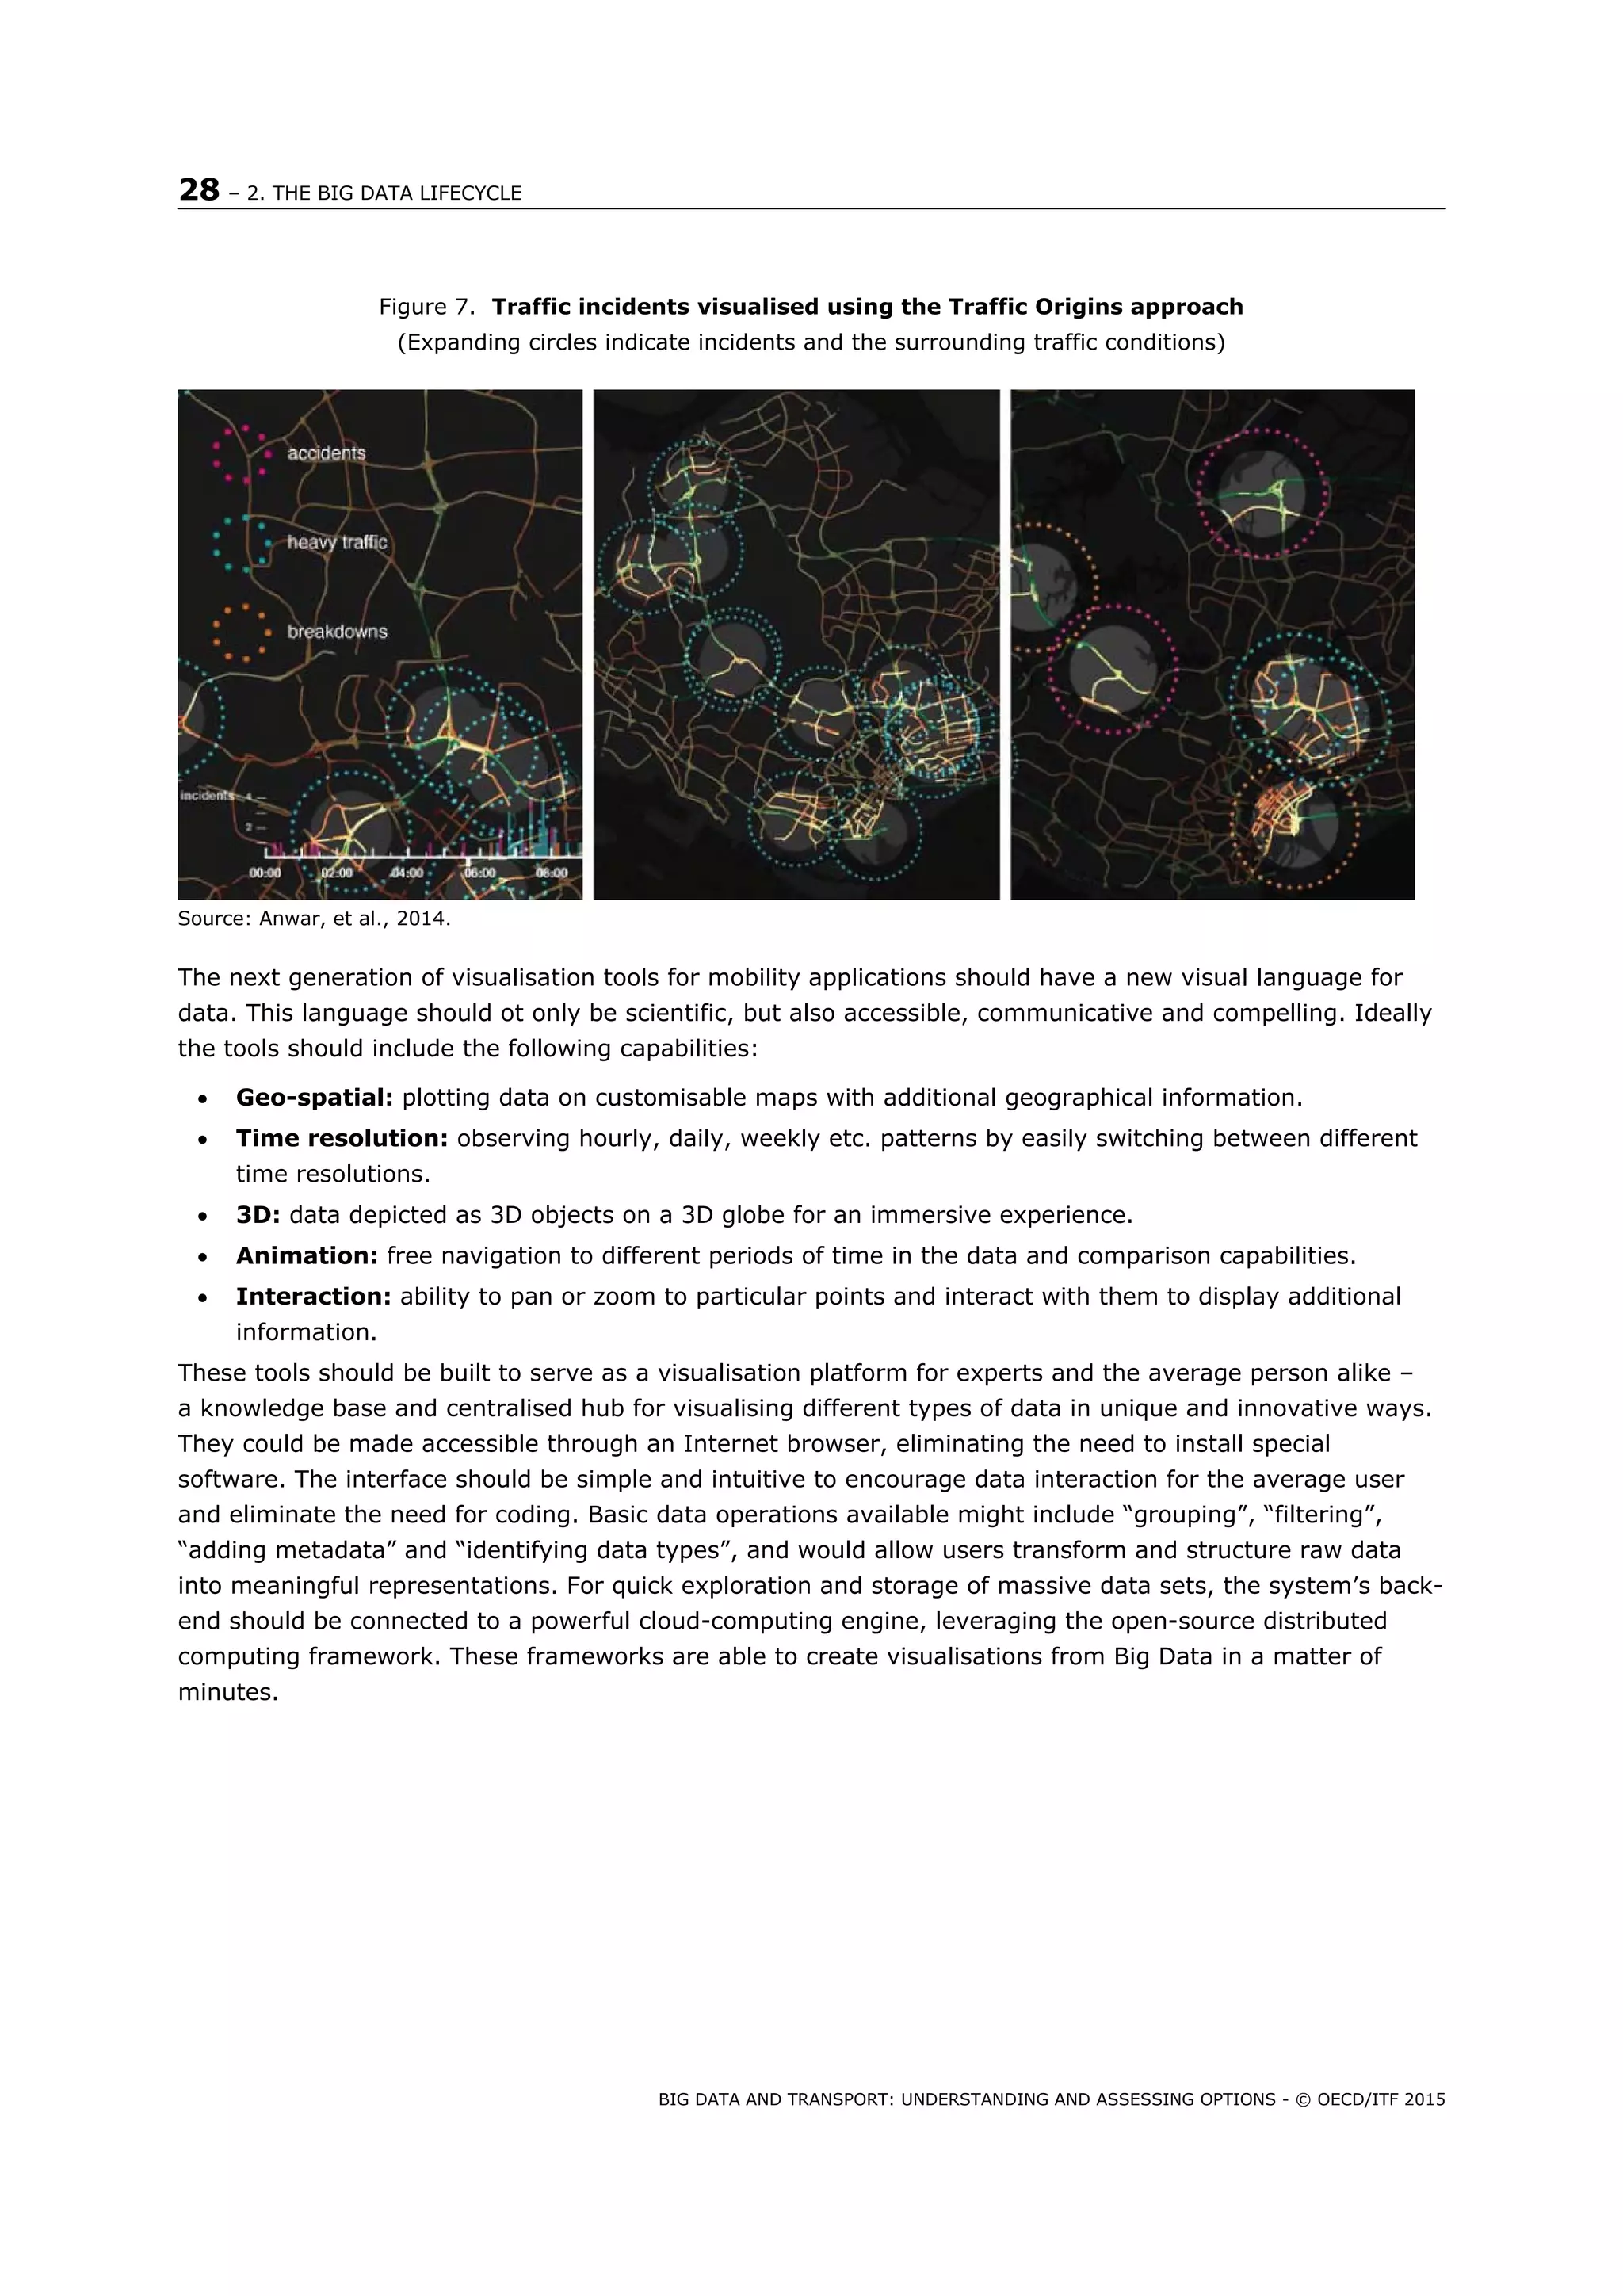
Anwar, A., Nagel, T. & Ratti, C., 2014. Traffic Origins: A Simple Visualization Technique to Support Traffic
Incident Analysis.. s.l., IEEE Pacific Visualization Symposium.
APEC, 2004. APEC Privacy Framework. s.l.:s.n.
Asslett, M., 2013. Spotlight: Big data reconsidered: it's the economics, stupid. [Online]
Available at: https://451research.com/report-short?entityId=79479&referrer=marketing
[Accessed 7 August 2014].
Balebako, R., Shay, R. & Cranor, L. F., 2013. Is Your Inseam a Biometric? Evaluating the Understandability
of Mobile Privacy Notice Categories, Pittsburgh: CyLab: Carnegie Mellon University.
Banks, C., 2011. Top 10: The Quotable Eric Schmidt. [Online]
Available at: http://blogs.wsj.com/digits/2011/01/21/top-10-the-quotable-eric-schmidt/
[Accessed 16 September 2014].
Becker, R. et al., 2011. A Tale of One City: Using Cellular Network Data for Urban Planning. Pervasive
Computing, IEEE, 10(4), pp. 18 - 26.
Benko, H., Morris, M., Brush, A. & Wilson, A., 2009. Insights on Interactive Tabletops: A Survey of
Researchers and Developers. , s.l.: Microsoft Research Technical Report MSR-TR-2009-22.
Bernecker, T. et al., 2012. Activity recognition on 3D accelerometer data. München: Institute for
Informatics, Ludwig-Maximilians-Universität.
Bhatti, J. & Humphreys, T. E., 2014. Covert Control of Surface Vessels via Counterfeit Civil GPS Signals.
s.l.:The University of Texas at Austin Radionavigation Laboratory.
Blumberg, A. J. & Eckersley, P., 2009. On Locational Privacy and How to Avoid Losing it Forever.
s.l.:Electronic Frontier Foundation.
Broadcom, 2014. Broadcom Announces Industry's First Global Navigation and Sensor Hub Combo Chip.
Irvine, CA: s.n.
Calabrese, F., Colonna, M., Lovisolo, P. & Ratti, C., 2011. Real-Time Urban Monitoring Using Cell Phones: A
Case Study in Rome. IEEE Transactions on Intelligent Transportation Systems, 12(1), pp. 141 - 151.
Cate, F. H., 2006. The Failure of Fair Information Practice Principles. In: Consumer Protection in the Age of
the Information Economy. s.l.:Social Science Research Network (SSRN).
Cavoukian, A., 2010. Privacy by design: the definitive workshop. A foreword by Ann Cavoukian, Ph.D.
Springer: s.n.
Cavoukian, A., 2012. Operationalizing Privacy by Design: A Guide to Implementing Strong Privacy
Practices. Toronto(Ontario): Office of the Information and Privacy Comissioner for the Province of Ontario.
Cavoukian, A. & Castro, D., 2014. Big Data and Innovation, Setting the Record Straight: De-identification
Does Work. Toronto: Office of the Information and Privacy Commissioner of the Province of Ontario.
Cavoukian, A. & Jones, J., 2012. Privacy by Design in the Age of Big Data. Toronto(Ontario): Office of the
Information and Privacy Commissioner for the Province of Ontario.
Cerrudo, C., 2014. Hacking US Traffic Control Systems. s.l., DEFCON Hacking Conference.
Cheung, A. S., 2014. Location privacy: the challenges of mobile service devices. Computer Law and
Security Review, 02.30(1).](https://image.slidesharecdn.com/itf-cpb-transportbigdata-150528190325-lva1-app6892/75/Big-Data-and-Transport-Understanding-and-assessing-options-60-2048.jpg)
![60 – BIBLIOGRAPHY
BIG DATA AND TRANSPORT: UNDERSTANDING AND ASSESSING OPTIONS - © OECD/ITF 2015
Clarke, R. & Wigan, M., 2011. You are where you've been: the privacvy implications of location and tracking
technologies. Journal of Location-Based Services, 5(3-4).
Community Research Association, 2012. Challenges and Opportunities with Big Data: A community white
paper developed by leading researchers across the United States. s.l.:Community Computing Consortium.
de Montjoye, Y.-A., Hidalgo, C. A., Verleysen, M. & Blondel, V. D., 2013. Unique in the Crowd: The Privacy
Bounds of Human Mobility. Scientific Reports: Nature.com, 25 March, Volume 3.
de Montjoye, Y.-A., Shmueli, E., Wang, S. & Pentland, A. S., 2014. openPDS: Protecting the Privacy of
Metadata through SafeAnswers. PLOS, 9(7).
De Mulder, Y., Danezis, G., Batina, L. & Preneel, B., 2008. Identification via location-profiling in GSM
networks. Alexandria (VA), Association for Computing Machinery.
de Smith, M. J., Goodchild, M. F. & Longley, P. A., 2013. Geospatial Analysis. A comprehensive Guide to
Principles, Techniques and Software Tools., s.l.: Spatial Analysis Online.
Dyson, G., 2013. No Time Is There - The Digital Universe and Why Things Appear To Be Speeding Up.
[Online]
Available at: http://longnow.org/seminars/02013/mar/19/no-time-there-digital-universe-and-why-things-
appear-be-speeding/
[Accessed 7 August 2014].
European Commission, Article 29 Data Protection Working Party, 2014. Opinion 05/2014 on Anonymisation
Techniques. Brussels: European Commission.
European Commission, 2011. Opinion 13/2011 on Geolocation services on smart mobile devices , s.l.:
European Commission.
European Commission, 2012. Commission proposes a comprehensive reform of the data protection rules.
[Online]
Available at: http://ec.europa.eu/justice/newsroom/data-protection/news/120125_en.htm
[Accessed 16 September 2014].
EVITA, 2012. EVITA Project Summary Report. [Online]
Available at: http://www.evita-project.org/Publications/EVITAD0.pdf
[Accessed 10 September 2014].
Executive Office of the President, 2014. Big Data: Seizing Opportunities, Preserving Values. Washington,
DC: Executive Office of the President.
Feng, T. & Timmermans, H. J., 2013. Transportation mode recognition using GPS and accelerometer.
Transportation Research, Volume 37, p. Part C.
Forbes, 2014a. Four Reasons Google Bought Waze. [Online]
Available at: http://www.forbes.com/sites/petercohan/2013/06/11/four-reasons-for-google-to-buy-waze/
[Accessed 14 October 2014].
Forbes, 2014b. Why Google's Waze Is Trading User Data With Local Governments. [Online]
Available at: http://www.forbes.com/sites/parmyolson/2014/07/07/why-google-waze-helps-local-
governments-track-its-users/
[Accessed 15 October 2014].
Fu, H. et al., 2014. Fu, H. et al., 2014. A Field Study of Run-Time Location Access Disclosures on Android
Smartphones. Internet Society.
Gambs, S., Killijian, M.-O. & del Prado Cortez, M. N., 2014. De-anonymization attack on geolocated data.
Journal of Computer and System Sciences, December.80(8).](https://image.slidesharecdn.com/itf-cpb-transportbigdata-150528190325-lva1-app6892/75/Big-Data-and-Transport-Understanding-and-assessing-options-61-2048.jpg)
![BIBLIOGRAPHY – 61
BIG DATA AND TRANSPORT: UNDERSTANDING AND ASSESSING OPTIONS - © OECD/ITF 2015
Goodin, D., 2014. Poorly anonymized logs reveal NYC cab drivers’ detailed whereabouts. [Online]
Available at: http://arstechnica.com/tech-policy/2014/06/poorly-anonymized-logs-reveal-nyc-cab-drivers-
detailed-whereabouts/
[Accessed 23 July 2014].
Greenleaf, G., 2012. The Influence of European Data Privacy Standards Outside Europe: Implications for
Globalization of Convention 108. International Data Privacy Law, April, 2(2), pp. 68-92.
Harford, T., 2014. Big data: Are we making a big mistake?, 28 March 2014. FT Magazine, 28 March.
Hawelka, B. et al., 2014. Geo-located twitter as proxy for global mobility patterns. Cartography and
Geographic Information Science, 41(3).
HBR, 2014. With Big Data comes Big Responsibility (Interview with Alex “Sandy” Pentland, Toshiba
Professor of Media Arts and Sciences at MIT). Harvard Business Review, November.Issue November 2014.
Hemminki, S., Nurmi, P. & Tarkoma, S., 2013. Accelerometer-based transportation mode detection on
smartphones. Rome, Association for Computing Machinery.
Holleczek, T. et al., 2014. Detecting Weak Public Transport Connections from Cell Phone and Public
Transport Records. s.l., The Third ASE International Conference on Big Data Science and Computing.
Hutchins, J. I. A. S. P., 2010. Probabilistic Analysis of a Large-Scale Urban Traffic Sensor Data Set.
Knowledge Discovery from Sensor Data. Berlin Heidelberg: Springer.
IDC, I. D. C. -., 2014. The Digital Universe of Opportunities: Rich Data and the Increasing Value of the
Internet of Things. [Online]
Available at: http://www.emc.com/leadership/digital-universe/2014iview/index.htm
[Accessed 7 August 2014].
IEA OPEN, nd. Energy Technology Bulletin. [Online]
Available at: http://www.iea.org/impagr/cip/archived_bulletins/issue_no23.htm
[Accessed 14 October 2014].
Isenberg, P., Hinrichs, U., Hancock, M. & Carpendale, S., 2010. Digital tables for collaborative information
exploration. In: Tabletops-Horizontal Interactive Displays. s.l.:Springer, pp. 387-405.
ITU, 2014. World Telecommunication/ICT Indicators database, s.l.: ITU.
Janeiro, C. d. O. d. P. d. R. d., 2014. Centro de Operações da Prefeitura do Rio de Janeiro. [Online]
Available at: http://www.centrodeoperacoes.rio.gov.br/institucional,
[Accessed 14 October 2014].
Kerns, A. J., Shepard, D. P., Bhatti, J. A. & Humphreys, T. E., 2014. Unmanned Aircraft Capture and Control
via GPS Spoofing. Journal of Field Robotics, 31(4).
Khalegi, B., Khamis, A., Karray, F. & Razavi, S., 2013. Multisensor data fusion: A review of the state-of-the-
art. Information Fusion, Volume 14, pp. 28-44.
Krzywinski, M. et al., 2009. Circos: An Information Aesthetic for Comparative Genomics. 19(9).
Li, Y. & Li, Z., 2013. Efficient missing data imputing for traffic flow by considering temporal and spatial
dependence. Transportation Research Part C: Emerging Technologies, Volume 34, pp. 108-120.
Lohr, S., 2014. For Big-Data Scientists, ‘Janitor Work’ Is Key Hurdle to Insights. s.l.:New York Times.
Manyika, J. et al., 2011. Big data: The next frontier for innovation, competition and productivity, s.l.:
McKinsey Global Institute.](https://image.slidesharecdn.com/itf-cpb-transportbigdata-150528190325-lva1-app6892/75/Big-Data-and-Transport-Understanding-and-assessing-options-62-2048.jpg)
![62 – BIBLIOGRAPHY
BIG DATA AND TRANSPORT: UNDERSTANDING AND ASSESSING OPTIONS - © OECD/ITF 2015
Manzoni, V., Maniloff, D., Kloeckl, K. & Ratti, C., nd. Transportation mode identification and real-time CO2
emission estimation using smartphones. SENSEable City Lab, Massachusetts Institute of Technology.
McKinsey Global Institute, 2011. Big data: The next frontier for innovation, competition, and productivity,
s.l.: McKinsey & Company.
Miller, C. & Valasek, C., 2014. A Survey of Remote Automotive Attack Surfaces, s.l.: Illmatics.
Morstatter, F., Pfeffer, J., Liu, H. & Carley, K., 2013. Is the Sample Good Enough? Comparing Data from
Twitter's Streaming API with Twitter's Firehose, s.l.: ICWSM .
Nabian, N., Offenhuber, D., Vanky, A. & Ratti, C., 2012. Data Dimension: Accessing Urban Data and Making
it Accessible. Urban Design and Planning, 166(1).
Natural Resources Canada, 2010. Geospatial Privacy and Risk Management Guide for Federal Agencies.
Ottawa: Canada Privacy Services Incorporated.
OECD, 2013. Exploring Data-Driven Innovation as a New Source of Growth; Mapping the Policy Issues
Raised by Big Data, Paris: OECD Publishing.
OECD, 2013. Privacy Expert Group Report on the Review of the 1980 OECD Privacy Guidelines, s.l.: OECD
Publishing.
OECD, 2013. The OECD Privacy Framework. Paris: OECD Publishing.
OII, 2014. Data Protection Principles for the 21st Century. Oxford: Oxford University.
OPCC, 2014. Results of the 2014 Global Privacy Enforcement Network Sweep. [Online]
Available at: https://www.priv.gc.ca/media/nr-c/2014/bg_140910_e.asp
[Accessed 23 September 2014].
Open Data Research Network, 2014. Transparency and Open Government Data in Rio de Janeiro: The
Collateral Effect of the Smart City. [Online]
Available at: http://www.opendataresearch.org/content/2014/576/transparency-and-open-government-
data-rio-de-janeiro-collateral-effect-smart-city
[Accessed 14 October 2014].
PCAST, 2014. Big Data and Privacy: A Technological Perspective. s.l.:President's Council of Advisors on
Science and Technology: Executive Office of the President.
Pentland, A., 2009. Reality Mining of Mobile Communications: Towards a New Deal on Data. s.l.:World
Economic Forum.
Peterson, S., 2011. Downed US drone: How Iran caught the 'beast' [Online],. Available at:. [Online]
Available at: http://www.csmonitor.com/World/Middle-East/2011/1209/Downed-US-drone-How-Iran-
caught-the-beast
[Accessed 21 September 2014].
Price, L., de la Rue du Can, S., Sinton, J. & Worrell, E., 2008. Sectoral trends in global energy use and
greenhouse gas emissions. Energy Policy, 36(4).
Ratti, C. & Nabian, N., 2010. Virtual Space, The City to Come. In: Innovation Perspectives for the 21st
Century. s.l.:BBVA, pp. 383-397.
Reddy, S. e., 2010. Using mobile phones to determine transportation modes. ACM Transactions on Sensor
Networks (TOSN), 6(2).
Rich, C., 2014. Privacy Laws in Asia. s.l.:Bureau of National Affairs, Inc.](https://image.slidesharecdn.com/itf-cpb-transportbigdata-150528190325-lva1-app6892/75/Big-Data-and-Transport-Understanding-and-assessing-options-63-2048.jpg)
![BIBLIOGRAPHY – 63
BIG DATA AND TRANSPORT: UNDERSTANDING AND ASSESSING OPTIONS - © OECD/ITF 2015
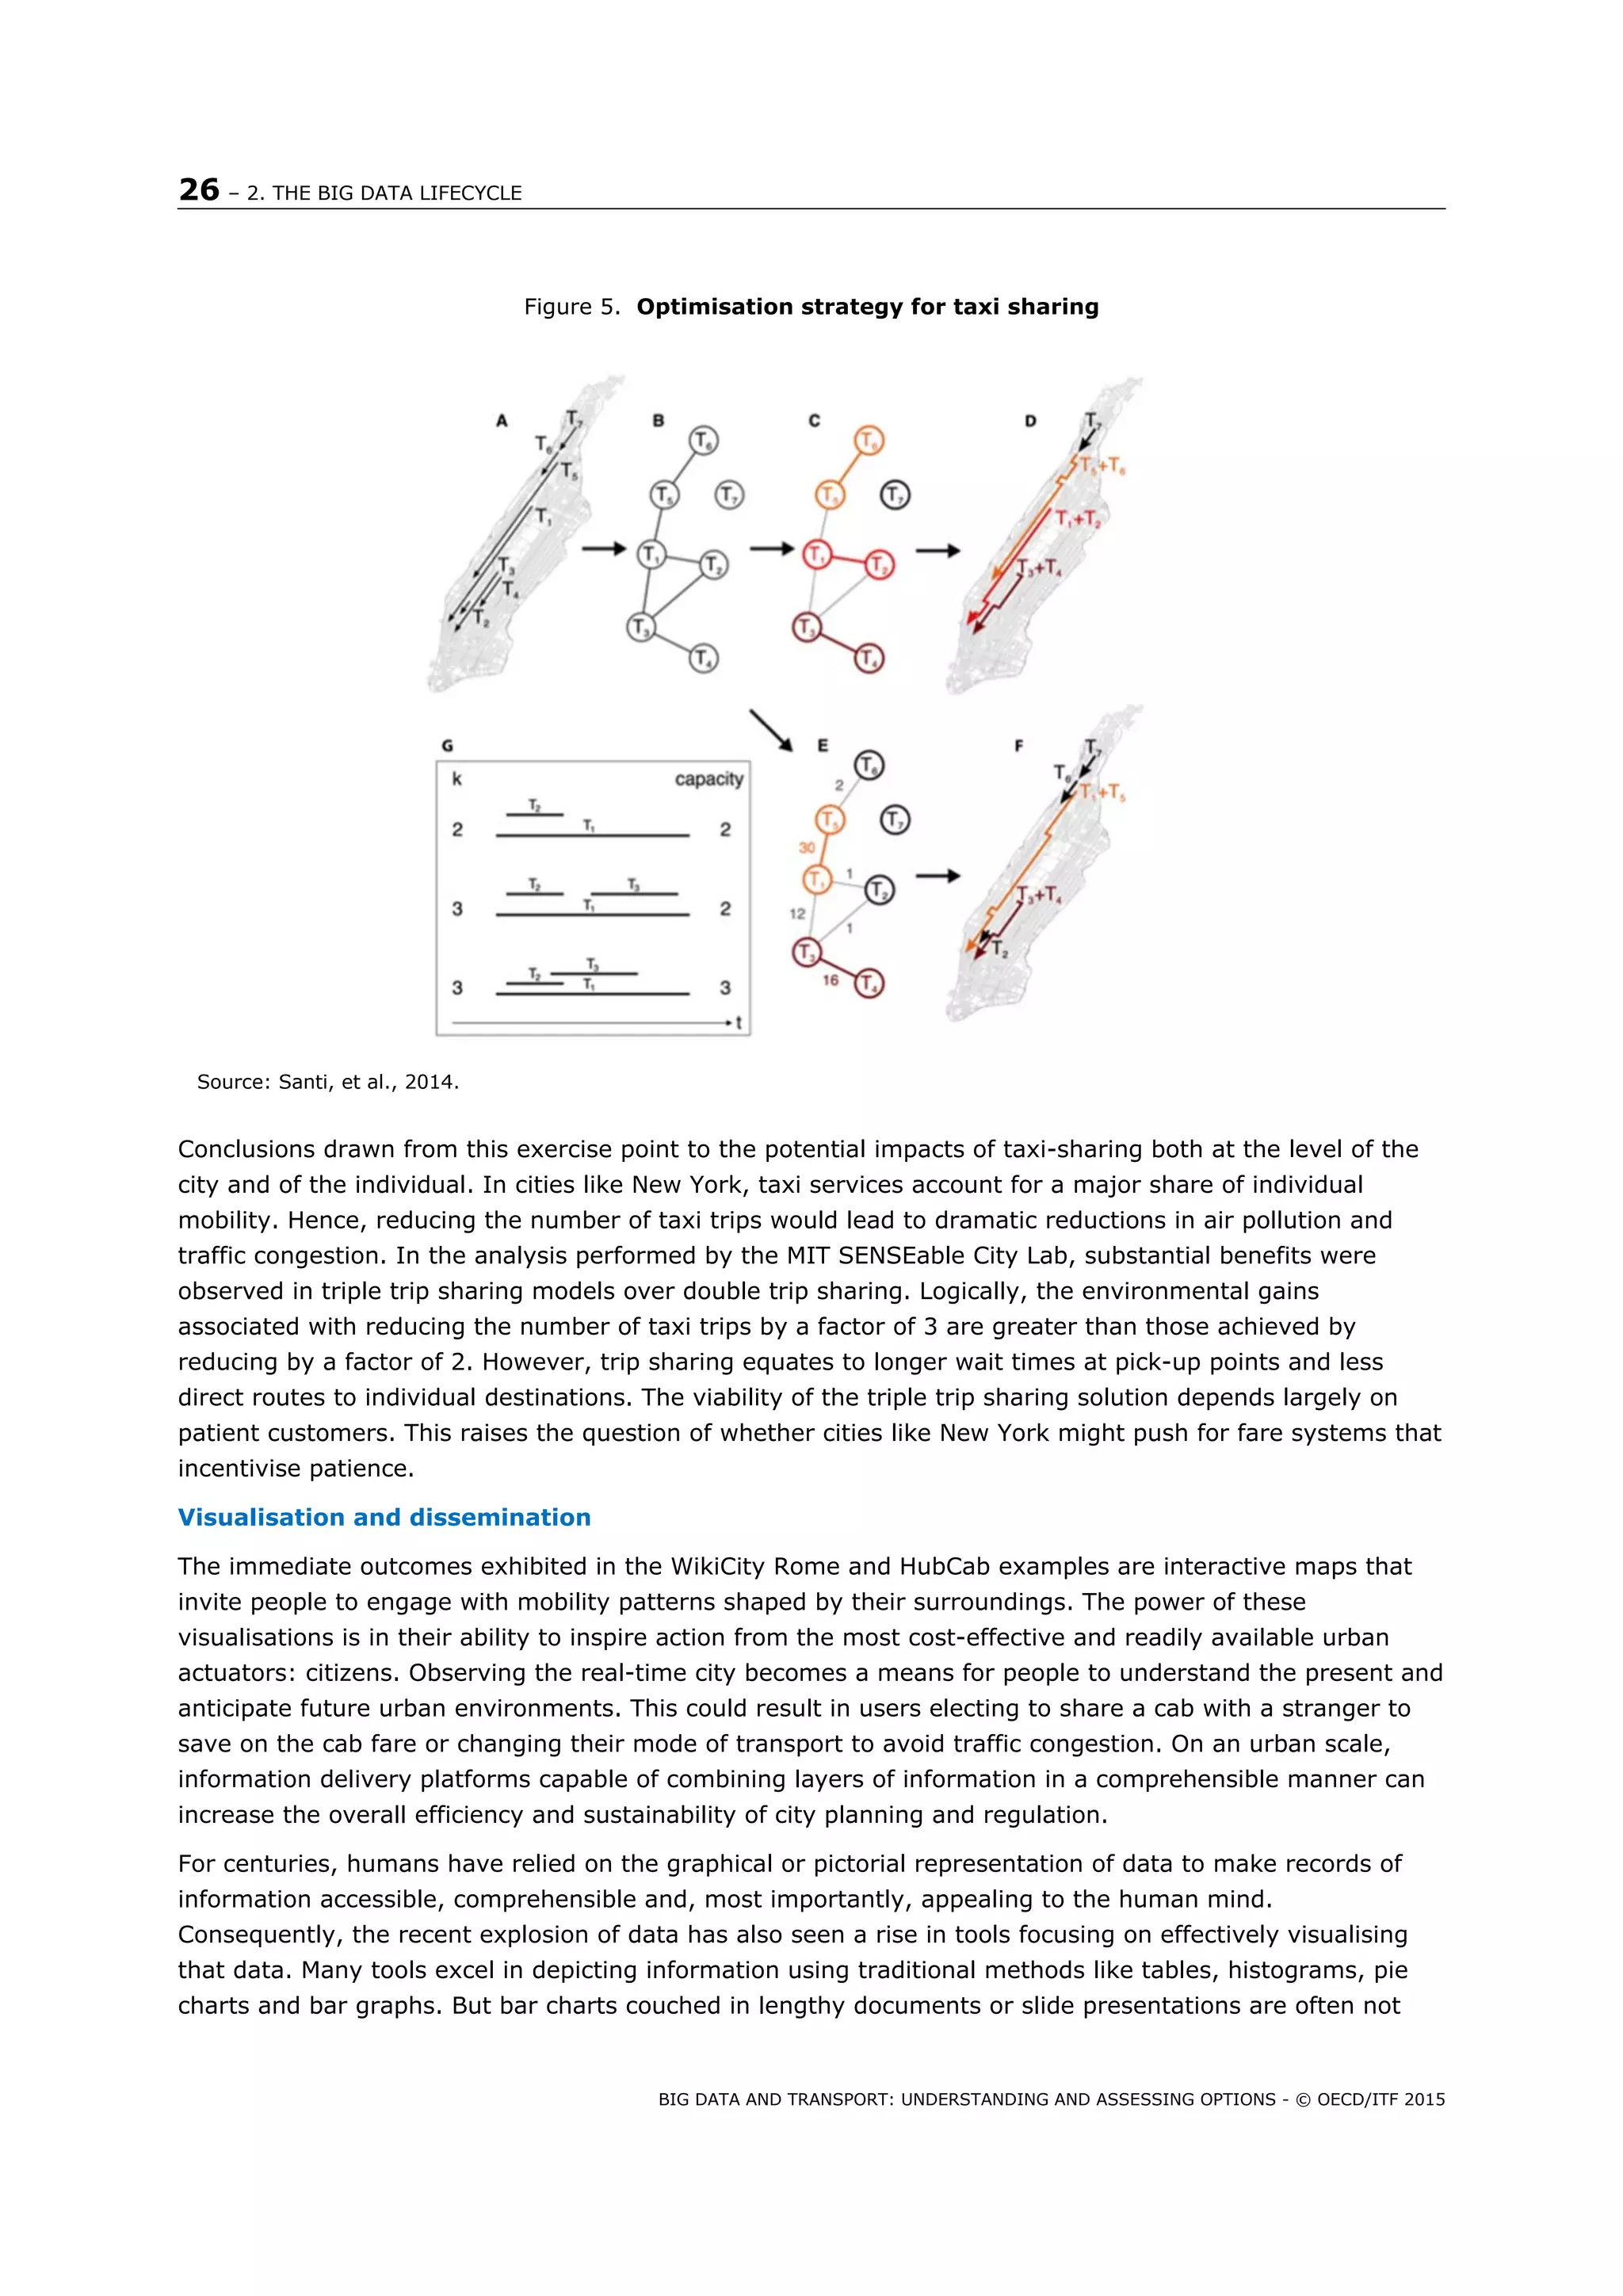
Santi, P., Resta, G. & Ratti, C., 2014. Quantifying the Benefits of Taxi Trips in New York through
Shareability Networks. ERCIM News 98.
Schwartz, P. M., 2013. The EU-US Privacy Collision: A Turn to Institutions and Procedures. Harvard Law
Review, May.126(7).
Shafique, M. A. & Hato, E., 2014. Use of acceleration data for transport mode prediction. Transportation,
2014(8).
Song, Y., Dahlmeier, D. & Bressan, S., 2014. Not so unique in the crowd: a simple and effective algorithm
for anonymising location data. Gold Coast, SIGIR.
Spreadtrum, 2013. Spreadtrum and Mozilla Take Aim at Global Smartphone Accessibility with Turnkey
Solution for US$25 Smartphones. [Online]
Available at: http://www.spreadtrum.com/en/news/press-releases/spreadtrum-and-mozilla-take-aim-at-
global-smartphone-accessibility
[Accessed 14 October 2014].
Sprenger, P., 1999. Sun on Privacy: 'Get Over It'. [Online]
Available at: http://archive.wired.com/politics/law/news/1999/01/17538
[Accessed 14 September 2014].
Stockx, T., 2014. Going deeper underground: Using accelerometers on mobile devices to enable positioning
on underground public transportation systems. s.l.: Universiteit Hasselt.
Susi, M., Renaudin, V. & Lachapelle, G., 2013. Motion mode detection and step detection algorithms for
mobile phone users. Sensors, Volume 13.
Tech America Foundation, 2012. Demystifying Big Data: A practical guide to transforming the business of
government, Washington, DC: Federal Big Data Commission: TechAmerica Foundation.
Tucker, P., 2014. The Naked Future: What Happens in a World That Anticipates Your Every Move?. New
York: Penguin Group (USA).
UN Populations Fund, 2007. State of the World Population; Unleashing the potential of urban growth, New
York: United Nations.
United States Environmental Protection Agency, 2014. U.S.-Brazil Joint Initiative on Urban Sustainability.
[Online]
Available at: http://www.epa.gov/jius/projects/rio_de_janeiro/rio_operations_center.html
[Accessed 2014 September 2014].
Wang, H., Calabrese, F., Di Lorenzo, G. & Ratti, C., 2010. Transportation mode inference from anonymized
and aggregated mobile phone call detail records., Funchal: IEEE.
WEF, 2013. Unlocking the Value of Personal Data: From Collection to Usage. Geneva: World Economic
Forum.
Westin, A., 1967. Privacy and Freedom. New York: Anthenum.
World Bank and Conveyal, 2014. Transport Analyst - Buenos Aires, Job Access. [Online]
Available at: http://wb-ba-analyst.dev.conveyal.com/
[Accessed 13 February 2015].
Yasin, R., 2011. IBM puts its ‘smart city’ technology in one package. [Online]
Available at: http://gcn.com/404.aspx?404=http://gcn.com/articles/2011/06/07/ibm-intelligent-
operations-center-for-%20smarter-cities.aspx
[Accessed 10 September 2014].](https://image.slidesharecdn.com/itf-cpb-transportbigdata-150528190325-lva1-app6892/75/Big-Data-and-Transport-Understanding-and-assessing-options-64-2048.jpg)
![64 – BIBLIOGRAPHY
BIG DATA AND TRANSPORT: UNDERSTANDING AND ASSESSING OPTIONS - © OECD/ITF 2015
Yuan, J., Zheng, Y., X. & Sun, G., 2011. Driving with knowledge from the physical world.. s.l., 17th ACM
SIGKDD international conference on Knowledge Discovery and Data Mining, ACM.
Zhang, H. &. B. J. 2., 2011. Anonymization of Location Data Does Not Work: A Large-Scale Measurement
Study. Las Vegas, MobiCom.
Zickhur, K., 2012. Three-quarters of smartphone owners use location-based services. [Online]
Available at: http://www.pewinternet.org/2012/05/11/three-quarters-of-smartphone-owners-use-location-
based-services/
[Accessed 28 September 2014].](https://image.slidesharecdn.com/itf-cpb-transportbigdata-150528190325-lva1-app6892/75/Big-Data-and-Transport-Understanding-and-assessing-options-65-2048.jpg)

Massive amounts of digital data are being generated from a variety of sources including sensors, devices and online activities, with estimates that the total "digital universe" will grow to 44 zettabytes by 2020. This data holds potential value when combined from different sources to provide new insights but also risks around privacy if used without appropriate protections. Transport authorities will need to evaluate how new and existing data sources can help improve operations, planning and safety while ensuring regulations keep pace with changing data practices.


