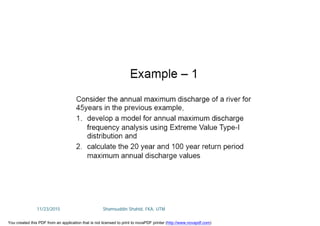
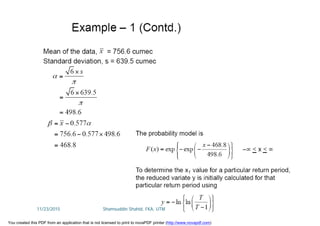
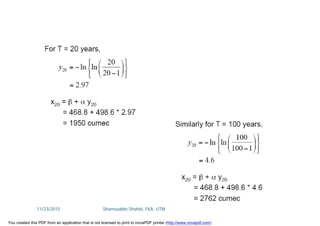
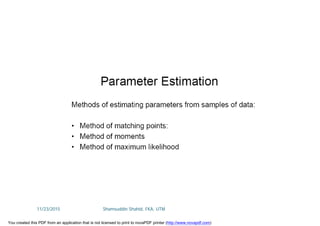
This document discusses probability distributions and their applications in statistical hydrology. It begins by explaining discrete and continuous random variables and their probability functions. It then covers several specific probability distributions including binomial, Poisson, normal, lognormal, gamma, exponential and Gumbel distributions. Examples are provided to illustrate how these distributions can be used to calculate probabilities of hydrologic events like floods or rainfall.


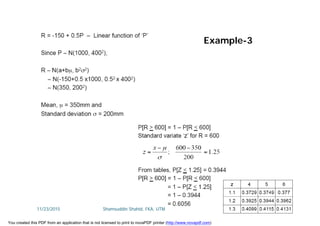
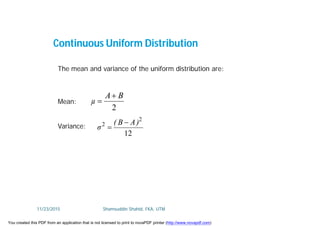
![• One of the simplest continuous distributions in all of statistics
is the continuous uniform distribution.
• This distribution is characterized by a density function that is
“flat,” and thus the probability is uniform in a closed interval.
• Applications of the continuous uniform distribution are not
wide.
• The density function of the continuous uniform random
variable X on the interval [A, B] is
Continuous Uniform Distribution
11/23/2015 Shamsuddin Shahid, FKA, UTM
You created this PDF from an application that is not licensed to print to novaPDF printer (http://www.novapdf.com)](https://image.slidesharecdn.com/shahid-lecture-13-mkag1273-151123083028-lva1-app6892/85/Shahid-Lecture-13-MKAG1273-28-320.jpg)
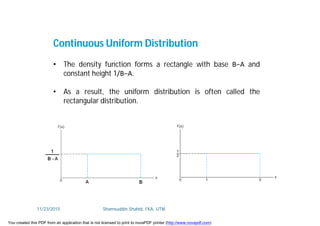
![Continuous Uniform Distribution
Suppose that a flood in an area never last for more than 4 days. Both long
and short floods occur quite often. In fact, it can be assumed that the
length X of a flood has a uniform distribution on the interval [0, 4].
(a) What is the probability density function?
(b) What is the probability that any flood lasts at least 3 days?
ANSWER:
(a) The appropriate density function for the uniformly distributed random
variable X in this situation is
(b) P[X 3] =
4
1
4
1
4
3
dx
11/23/2015 Shamsuddin Shahid, FKA, UTM
You created this PDF from an application that is not licensed to print to novaPDF printer (http://www.novapdf.com)](https://image.slidesharecdn.com/shahid-lecture-13-mkag1273-151123083028-lva1-app6892/85/Shahid-Lecture-13-MKAG1273-30-320.jpg)