Shah 01
Aashma Shah Thakuri
SOC 200
04/09/18
Word count: 1108
Linkages among Biodiversity, Livelihood, and Tourism
Abstract
The aim of this survey was to examine the affiliation amidst biodiversity reservation, livelihood advancements along with tourism advancement utilizing the appreciative inquiry view as a survey instrument. The survey was carried out in three various buffer-area societies typifying various states of tourism advancement within Chitwan Federal Reserve in Nepal. The outcomes show that tourism assists in adjusting regional individuals' perspectives towards the preservation of biodiversity and decrease individual's reliance on natural materials. Tourism, specifically small-scale and regionally managed ecotourism enterprises, is still determined as an instrument to better the livelihoods of individuals across safeguarded regions. The connections, nonetheless, differ with the stage of tourism advancement. This survey still advanced a foundation to assist in comprehending these connections.
Study Techniques
Study Region
The survey was carried out in Chitwan Federal Reserve, the most ancient Federal Reserve within Nepal, developed in the year 1973 along with a global heritage spot. This park is located in south-central Nepal. Conventionally, regional communities relied on reserve materials for wood, fuel, roofing resources along with other forest commodities. Most significantly, the way of life of the traditional societies relied on the forests. Thus, the strain on reserve materials increases with advances in the regional populace (Nyaupane & Poudel, 2011). In order to connect reservation
Shah 02
with livelihoods, the state of Nepal initiated buffer area laws in the year 1996 that determine buffer areas in subsisting safeguarded regions.
For the survey, with the assistance of reserve agents, three societies in the buffer area were chosen founded on the level of tourism advancement. The information was gathered from December in the year 2008 to January in the year 2009 utilizing the appreciative inquiry procedure.
Appreciative Enquiry
This survey assumed the appreciative inquiry procedure as a survey instrument to unearth the connections amidst biodiversity reservation, tourism advancement, and livelihood advancements. Appreciative inquiry is an easy, yet strong, instrument that assists the surveyor comprehend rural individual's information, requirements, and prerogatives without sidelining them from the survey. This view was most applicable due to the fact that it is appropriate for collectivist communities where every associate associate specifically with affiliates of a particular doctrinal, cultural or familial team (Nyaupane & Poudel, 2011).
The survey adhered to the 4-D AI stages with a few adjustments that entail five stages; grounding, disclosure, model, dream along with desti.
Major project report on Tata Motors and its marketing strategies
Shah 01Aashma Shah ThakuriSOC 200040918Word count 110.docx
1. Shah 01
Aashma Shah Thakuri
SOC 200
04/09/18
Word count: 1108
Linkages among Biodiversity, Livelihood, and Tourism
Abstract
The aim of this survey was to examine the affiliation amidst
biodiversity reservation, livelihood advancements along with
tourism advancement utilizing the appreciative inquiry view as
a survey instrument. The survey was carried out in three various
buffer-area societies typifying various states of tourism
advancement within Chitwan Federal Reserve in Nepal. The
outcomes show that tourism assists in adjusting regional
individuals' perspectives towards the preservation of
biodiversity and decrease individual's reliance on natural
materials. Tourism, specifically small-scale and regionally
managed ecotourism enterprises, is still determined as an
instrument to better the livelihoods of individuals across
safeguarded regions. The connections, nonetheless, differ with
the stage of tourism advancement. This survey still advanced a
foundation to assist in comprehending these connections.
Study Techniques
Study Region
The survey was carried out in Chitwan Federal Reserve, the
most ancient Federal Reserve within Nepal, developed in the
year 1973 along with a global heritage spot. This park is located
in south-central Nepal. Conventionally, regional communities
relied on reserve materials for wood, fuel, roofing resources
along with other forest commodities. Most significantly, the
way of life of the traditional societies relied on the forests.
Thus, the strain on reserve materials increases with advances in
the regional populace (Nyaupane & Poudel, 2011). In order to
2. connect reservation
Shah 02
with livelihoods, the state of Nepal initiated buffer area laws in
the year 1996 that determine buffer areas in subsisting
safeguarded regions.
For the survey, with the assistance of reserve agents, three
societies in the buffer area were chosen founded on the level of
tourism advancement. The information was gathered from
December in the year 2008 to January in the year 2009 utilizing
the appreciative inquiry procedure.
Appreciative Enquiry
This survey assumed the appreciative inquiry procedure as a
survey instrument to unearth the connections amidst
biodiversity reservation, tourism advancement, and livelihood
advancements. Appreciative inquiry is an easy, yet strong,
instrument that assists the surveyor comprehend rural
individual's information, requirements, and prerogatives without
sidelining them from the survey. This view was most applicable
due to the fact that it is appropriate for collectivist communities
where every associate associate specifically with affiliates of a
particular doctrinal, cultural or familial team (Nyaupane &
Poudel, 2011).
The survey adhered to the 4-D AI stages with a few adjustments
that entail five stages; grounding, disclosure, model, dream
along with destiny. Most associates were not ready to take part
in the survey thus forcing the survey team to create a
relationship with community elders to deliberate upon the
study’s goal, technique along with its gains to the society. The
survey determined the shareholders to be state workers, local
communities, private and community-founded institutions along
with tourism businessmen.
Linkages amidst Biodiversity, Livelihood, and Tourism
Respondents determined five principal themes, these were;
empowerment, ability building, economic gains, biodiversity
reservation along with ecological services and amenities
3. advancement that connect biodiversity reservation, livelihood
advancement, and tourism advancement. These primary themes
were specifically from the initial two stages of the AI
procedure.
Shah 03
The contrast of Linkages at Distinct Phases of Tourism
Advancement
Three buffer area spots were chosen founded on the level of
tourism advancement of the spot. The five themes discussed
before were utilized as an evaluation foundation and the results
were brought forth in the manner that proposes how stable or
unstable these connections are in all the spots. Generally,
regional individuals are more empowered out of all the societies
due to tourism along with buffer area plans. Nonetheless, this
differs with the stage of tourism advancement. In each of the
three regions, ability-creating activities like; ability
advancement together with revenue creating coaching plans
have been carried out (Nyaupane & Poudel, 2011). Ability-
creating activities were more aimed at regional cultural teams
like he Bote, Kumal along with Majhi. All of the responding
societies agreed that reservation along with tourism give
revenue to the regional economy, create employment and give
several resources to back up livelihoods, however, the stage of
effect is not similar. There were no significant distinctions in
material reservation and administration. Nonetheless, regional
habitants in Sauraha have a larger understanding of biodiversity
reservation, followed by Dibyapuri along with Madi.
Administration and Policy Implications
The discoveries of the study have various administration and
polity implications concerning the administration of
safeguarded regions and tourism in advancing nations. Several
surveys exposed that tourists will be charged more than the
subsisting entry charge. Thus, the entry charge should be
identified cautiously, in a manner that the reserve can create
utmost income to finance reservation along with livelihood
4. advancement plans without reducing the number of visitors
touring the reserve. On top of this, visitors are ready to pay
more if they are given data regarding the charges together with
trust on federal bodies. Administrators of safeguarded regions,
thus, should give data to visitors regarding why charges are
imposed and where they go, and get transparency via more
answerability and honesty.
The expenses of biodiversity reservation are felt by habitants
within or close to safeguarded regions. Thus, dissemination of
gains should put into consideration equity issues so that the
initial beneficiary of tourism advancement is those who went
through the harshest impacts from
Shah 04
reservation actions. The discoveries of this survey have several
implications for polity creators too. Correct state polities along
with organizational structures are primary to developing and
retaining precise connections amidst reservation, likelihood
advancement along with tourism (Nyaupane & Poudel, 2011).
The fence and fine strategy to the reservation was not
successful due to the fact that it interfered with individual's
privileges to utilize materials and assumed livelihood concerns.
Thus this study proposes that conventional reservation
strategies, in which tourism along with regional societies are
regarded as risks to reservation and surrounding societies.
Buffer area plans can probably assist in forming direct
connections.
Generally, this survey shows the connections amidst
biodiversity reservation, livelihood advancement along with
tourism advancement. Nonetheless, the affiliations differ
largely amidst the three spots. The connections are more stable
in greatly advanced tourism spots than in averagely and less-
advanced spots. Regional habitants in the largely advanced site
are more strengthened and have greater economic chances. They
are as an outcome, more supportive of reservation plans than
other spots. Thus, reserve administrators should take into
5. account tourism a primary instrument to better the connections
in biodiversity reservation along with livelihood advancement
(Nyaupane & Poudel, 2011).
Shah 05
References:
1. Nyaupane, G. P., & Poudel, S. (2011). Linkages Among
Biodiversity, Livelihood and Tourism, Vol. 38 (Issue 4), 1344-
1366
2. Bell, M. M., & Ashwood, L. L.(2015). An Invitation to
Environmental Sociology (5th ed.) Thousand Oaks, CA: SAGE
Publications.
Plastic debris in the open ocean
Andrés Cózara,1, Fidel Echevarríaa, J. Ignacio González-
Gordilloa, Xabier Irigoienb,c, Bárbara Úbedaa,
Santiago Hernández-Leónd, Álvaro T. Palmae, Sandra Navarrof,
Juan García-de-Lomasa, Andrea Ruizg,
María L. Fernández-de-Puellesh, and Carlos M. Duartei,j,k,l
aÁrea de Ecología, Facultad de Ciencias del Mar y Ambientales,
Universidad de Cádiz, Campus de Excelencia Internacional del
Mar, E-11510 Puerto Real, Spain;
bRed Sea Research Center, King Abdullah University of
6. Science and Technology, Thuwal 23955-6900, Kingdom of
Saudi Arabia; cAZTI, Arrantza eta
Elikaigintzarako Institutu Teknologikoa, 20110 Pasaia, Spain;
dInstituto de Oceanografía y Cambio Global, Universidad de
Las Palmas de Gran Canaria,
Campus Universitario de Tafira, 35017 Las Palmas de Gran
Canaria, Canary Islands, Spain; eFisioaqua, Las Condes,
6513677 Santiago, Chile; fDepartamento de
Ecología, Universidad de Barcelona, E-08028 Barcelona, Spain;
gPakea Bizkaia, 48990 Getxo, Spain; hInstituto Español de
Oceanografía, Centro Oceanográfico
de Baleares, 07015 Palma de Mallorca, Spain; iDepartment of
Global Change Research, Instituto Mediterráneo de Estudios
Avanzados (Universidad de las Islas
Baleares-Consejo Superior de Investigaciones Científicas),
07190 Esporles, Spain; jThe University of Western Australia
Oceans Institute and kSchool of Plant
Biology, The University of Western Australia, Crawley, WA
6009, Australia; and lFaculty of Marine Sciences, King
Abdulaziz University, Jeddah 21589,
Kingdom of Saudi Arabia
Edited by David M. Karl, University of Hawaii, Honolulu, HI,
and approved June 6, 2014 (received for review August 3, 2013)
There is a rising concern regarding the accumulation of floating
plastic debris in the open ocean. However, the magnitude and
the
fate of this pollution are still open questions. Using data from
the
Malaspina 2010 circumnavigation, regional surveys, and
previously
published reports, we show a worldwide distribution of plastic
on the surface of the open ocean, mostly accumulating in the
convergence zones of each of the five subtropical gyres with
comparable density. However, the global load of plastic on the
7. open ocean surface was estimated to be on the order of tens of
thousands of tons, far less than expected. Our observations of
the size distribution of floating plastic debris point at important
size-selective sinks removing millimeter-sized fragments of
floating
plastic on a large scale. This sink may involve a combination of
fast
nano-fragmentation of the microplastic into particles of microns
or
smaller, their transference to the ocean interior by food webs
and
ballasting processes, and processes yet to be discovered.
Resolving
the fate of the missing plastic debris is of fundamental
importance to
determine the nature and significance of the impacts of plastic
pollution in the ocean.
The current period of human history has been referred as
thePlastic Age (1). The light weight and durability of plastic
materials make them suitable for a very wide range of prod-
ucts. However, the intense consumption and rapid disposal of
plastic products is leading to a visible accumulation of plastic
debris (2). Plastic pollution reaches the most remote areas of
the planet, including the surface waters of the open ocean.
Indeed, high concentrations of floating plastic debris have
been reported in central areas of the North Atlantic (3) and
Pacific Oceans (4, 5), but oceanic circulation models suggest
possible accumulation regions in all five subtropical ocean
gyres (6, 7). The models predict that these large-scale vortices
act as conveyor belts, collecting the floating plastic debris re-
leased from the continents and accumulating it into central
convergence zones.
Plastic pollution found on the ocean surface is dominated by
particles smaller than 1 cm in diameter (8), commonly referred
8. to as microplastics. Exposure of plastic objects on the surface
waters to solar radiation results in their photodegradation, em-
brittlement, and fragmentation by wave action (9). However,
plastic fragments are considered to be quite stable and highly
durable, potentially lasting hundreds to thousands of years (2).
Persistent nano-scale particles may be generated during the
weathering of plastic debris, although their abundance has not
been quantified in ocean waters (9).
As the size of the plastic fragments declines, they can be
ingested by a wider range of organisms. Plastic ingestion has
been documented from small fish to large mammals (10–12).
The most evident effects of plastic ingestion are mechanical
[e.g.,
gastrointestinal obstruction in seabirds (13)], but plastic frag-
ments contain contaminants added during plastic manufacture or
acquired from seawater through sorption processes [e.g., hy-
drophobic chemicals (14, 15)]. Recent studies provide evidence
that these contaminants can accumulate in the receiving organ-
isms during digestion (14).
Our awareness of the significance of plastic pollution in the
ocean is relatively recent, and basic questions remain
unresolved.
Indeed, the quantity of plastic floating in the ocean and its final
destination are still unknown (16). Historical time series of
surface
plastic concentration in fixed ocean regions show no significant
increasing trend since the 1980s, despite an increase in
production
and disposal (3, 16, 17). These studies suggest that surface
waters
are not the final destination for buoyant plastic debris in the
ocean.
Nano-fragmentation, predation, biofouling, or shore deposition
9. have been proposed as possible mechanisms of removal from
the
surface (3, 9, 16).
On the basis of samples collected on a circumnavigation cruise
(Malaspina 2010 expedition), on five regional cruises, and
avail-
able data from recent studies (3–5, 17–19), we aim to provide a
first-order approximation of the load of plastic debris in surface
waters of the open ocean. We also examine the size distribution
of floating plastic debris collected along the circumnavigation
to
provide insight into the nature of possible losses of floating
plastic
from the open ocean surface.
Significance
High concentrations of floating plastic debris have been re-
ported in remote areas of the ocean, increasing concern about
the accumulation of plastic litter on the ocean surface. Since
the introduction of plastic materials in the 1950s, the global
production of plastic has increased rapidly and will continue in
the coming decades. However, the abundance and the distri-
bution of plastic debris in the open ocean are still unknown,
despite evidence of affects on organisms ranging from small
invertebrates to whales. In this work, we synthetize data col-
lected across the world to provide a global map and a first-
order approximation of the magnitude of the plastic pollution
in surface waters of the open ocean.
Author contributions: A.C., F.E., J.I.G.-G., X.I., and C.M.D.
designed research; A.C., F.E., J.I.
G.-G., X.I., B.U., S.H.-L., A.T.P., S.N., J.G.-d.-L., A.R.,
M.L.F.-d.-P., and C.M.D. performed
research; A.C., X.I., B.U., S.N., J.G.-d.-L., and M.L.F.-d.-P.
10. contributed new reagents/analytic
tools; A.C., J.I.G.-G., B.U., A.T.P., S.N., and J.G.-d.-L.
analyzed data; and A.C., F.E., X.I., and
C.M.D. wrote the paper.
The authors declare no conflict of interest.
This article is a PNAS Direct Submission.
Freely available online through the PNAS open access option.
1To whom correspondence should be addressed. E-mail:
[email protected]
This article contains supporting information online at
www.pnas.org/lookup/suppl/doi:10.
1073/pnas.1314705111/-/DCSupplemental.
www.pnas.org/cgi/doi/10.1073/pnas.1314705111 PNAS | July
15, 2014 | vol. 111 | no. 28 | 10239–10244
EN
V
IR
O
N
M
EN
TA
L
SC
IE
N
C
ES
11. http://crossmark.crossref.org/dialog/?doi=10.1073/pnas.1314705
111&domain=pdf&date_stamp=2014-07-02
mailto:[email protected]
http://www.pnas.org/lookup/suppl/doi:10.1073/pnas.131470511
1/-/DCSupplemental
http://www.pnas.org/lookup/suppl/doi:10.1073/pnas.131470511
1/-/DCSupplemental
www.pnas.org/cgi/doi/10.1073/pnas.1314705111
Results and Discussion
The dataset assembled here included 3,070 total samples col-
lected around the world (SI Appendix, Table S1). The frequency
of occurrence of plastic debris in the surface samples of the
open
ocean was considerably high (88%; Fig. 1). Nevertheless, the
con-
centration of plastic ranged broadly, spanning over four orders
of
magnitude across the open ocean. The distribution pattern
agreed
with those predicted from ocean surface circulation models (6,
7),
confirming the accumulation of plastic debris in the
convergence
zone of each of the five large subtropical gyres. Using the high
and
low ranges of spatial concentrations measured within 15 major
convergence/divergence zones in the global ocean (Fig. 2), we
es-
timate the amount of plastic in the open-ocean surface between
7,000 and 35,000 tons (Table 1). The plastic concentrations per
surface area were comparable across each of the five
accumulation
zones, although the North Pacific Ocean contributed importantly
to the global plastic load (between 33 and 35%), mainly owing
12. to
the size of this gyre. The plastic load in the North Pacific Ocean
could be related to the high human population on the eastern
coast
of the Asian continent, the most densely populated coast in the
world, with one-third of the global coastal population (20).
Indeed,
the surface plastic concentrations measured in the Kuroshio
Current, the western arm of the North Pacific Gyre, can become
exceptionally high, including the highest reported for nonaccu-
mulation regions (21, 22).
Continental plastic litter enters the ocean largely through
storm-water runoff, flowing into watercourses or directly dis-
charged into coastal waters. Estimating the plastic input to the
ocean is a complex task. In the 1970s, the US National
Academy
of Sciences estimated that the flux of plastic to the world
oceans
was 45,000 tons per year (23), equivalent to 0.1% of the global
production of plastic (24). Since then, the annual production
of plastic has quintupled (265 million tons per year in 2010).
Around 50% of the produced plastic is buoyant (24), and 60–
64%
of the terrestrial load of floating plastic to the sea is estimated
to
be exported from coastal to open-ocean waters (7). Despite the
possible inaccuracies of these numbers, a conservative first-
order
estimate of the floating plastic released into the open ocean
from
the 1970s (106 tons) is 100-fold larger than our estimate of the
current load of plastic stored in the ocean.
Examination of the size distribution of plastic debris on the
13. ocean surface shows a peak in abundance of fragments around
2 mm and a pronounced gap below 1 mm (Fig. 3A). Similar pat-
terns are found when the data are analyzed separately by ocean
basin (SI Appendix, Fig. S6). The predominance of fragments in
an intermediate interval (1–5 mm) of the plastic size spectra is
also a general feature for the oceanic size distributions reported
in the past (5, 8). However, experiments on the fragmentation of
plastic materials show that the size distribution of fragments
generated by a plastic object conforms to a fractal process,
spreading over several orders of magnitude and below the size
range in our study (25, 26). Cracking patterns of photodegraded
plastics are observed at multiple scales, from centimeters to few
microns (9). Therefore, the progressive fragmentation of the
plastic objects into more and smaller pieces should lead to
a gradual increase of fragments toward small sizes. In steady
state, the abundance–size distribution should follow a power
law,
with a scaling exponent equal to the spatial dimension of the
plastic objects (i.e., 3, SI Appendix, Fig. S8). Likewise, a stable
input and fragmentation of large plastic objects should result in
a steady volume–size distribution. A model based on fragmen-
tation, without additional losses, gave an abundance–size distri-
bution similar to that sampled, which showed a power exponent
of 2.93 ± 0.08, similar to the expected value, but only for size
classes larger than 5 mm. Below 5 mm, the observed size dis-
tribution diverged from that expected from the model (Fig. 3 B
and C). Because plastic input is progressively transferred
toward
small-size classes by fragmentation, this divergence results
from
the gradual accumulation of plastic losses. An assessment of
progressive departures of the observed distribution from a con-
servative distribution indicates that losses are concentrated
around sizes of 2.2 mm (Fig. 3C). Hence, the paucity of frag-
ments in the lowest part of the size distribution would be ex-
plained by the interruption of the downward transfer of plastic
14. at
the millimeter scale, unless there is an abrupt nano-fragmenta-
tion of the millimeter-sized particles directly into pieces of
Fig. 1. Concentrations of plastic debris in surface waters of the
global ocean. Colored circles indicate mass concentrations
(legend on top right). The map shows
average concentrations in 442 sites (1,127 surface net tows).
Gray areas indicate the accumulation zones predicted by a
global surface circulation model (6). Dark
and light gray represent inner and outer accumulation zones,
respectively; white areas are predicted as nonaccumulation
zones. Data sources are described in SI
Appendix, Table S1. Plastic concentrations along the Malaspina
circumnavigation and a latitudinal gradient are graphed in SI
Appendix, Figs. S4 and S5.
10240 | www.pnas.org/cgi/doi/10.1073/pnas.1314705111 Cózar
et al.
http://www.pnas.org/lookup/suppl/doi:10.1073/pnas.131470511
1/-/DCSupplemental/pnas.1314705111.sapp.pdf
http://www.pnas.org/lookup/suppl/doi:10.1073/pnas.131470511
1/-/DCSupplemental/pnas.1314705111.sapp.pdf
http://www.pnas.org/lookup/suppl/doi:10.1073/pnas.131470511
1/-/DCSupplemental/pnas.1314705111.sapp.pdf
http://www.pnas.org/lookup/suppl/doi:10.1073/pnas.131470511
1/-/DCSupplemental/pnas.1314705111.sapp.pdf
http://www.pnas.org/lookup/suppl/doi:10.1073/pnas.131470511
1/-/DCSupplemental/pnas.1314705111.sapp.pdf
http://www.pnas.org/lookup/suppl/doi:10.1073/pnas.131470511
1/-/DCSupplemental/pnas.1314705111.sapp.pdf
www.pnas.org/cgi/doi/10.1073/pnas.1314705111
few microns or smaller, allowing passage through the 200-μm
15. mesh net used (SI Appendix, Fig. S9). A sampling bias causing
the apparent loss in small sizes can be rejected because the size
distribution of nonplastic particles in the same samples
followed
the characteristic power distribution, with increasing
abundances
toward smaller sizes (SI Appendix, Fig. S12).
Our study reports an important gap in the size distribution of
floating plastic debris as well as a global surface load of plastic
well below that expected from production and input rates. To-
gether with the lack of observed increasing temporal trends in
surface plastic concentration (3, 16, 17), these findings provide
strong support to the hypothesis of substantial losses of plastic
from the ocean surface. A central question arising from this
conclusion is how floating plastic is being removed. Four main
possible sinks have been proposed: shore deposition, nano-
fragmentation, biofouling, and ingestion (3, 9). Although a rig-
orous attribution of losses to each of these mechanisms is not
yet
possible, our study provides some insights as to their
plausibility.
To counterbalance the increase in input rates over the past
decades, the removal rate of the presumed sink would also have
needed to increase (3). Alternatively, the lack of increasing
trends in surface plastic pollution could also be explained from
a removal rate much faster than the input into the ocean, with
the reduced global load of surface plastic resulting from a delay
between input and removal. Another requirement is that the sink
must lead to a degradation or permanent sequestration of plas-
tic. Finally, the size distribution of floating plastic debris is
evi-
dence for a size-selective loss process or processes.
A selective washing ashore of the millimeter-sized fragments
16. trapped in central areas of the open ocean is unlikely. Likewise,
there is no reason to assume that the rate of solar-induced
fragmentation increased since the 1980s (3). However, the gap
in
the plastic size distribution below 1 mm could indicate a fast
breaking down of the plastic fragments from millimeter scale to
micrometer scale. Recent scanning electron micrographs of the
surface of microplastic particles showed indications that
oceanic
bacterial populations may be contributing to their degradation,
potentially intervening in the fragmentation dynamics (27). The
scarce knowledge of the biological and physical processes
driving
the plastic fragmentation leaves room for the possibility of a
two-
phase fragmentation, with an accelerated breakdown of the
photodegraded fragments with dimension of few millimeters.
A preferential submersion of small-sized plastic, with high
surface:volume ratio, by ballasting owing to epiphytic growth
could
also be possible. Once biofouled fragments reach seawater
density,
they enter the water column as neutrally drifting or slowly
sinking
particles. Biofouled fragments probably are often incorporated
into the sediment in shallow and, particularly, nutrient-rich
areas
(28), but this may be a less effective mechanism in the deep,
open ocean (9, 29). Because the seawater density gradually in-
crease with depth, the slowly sinking plastic, marginally
exceed-
ing the surface seawater density, should remain suspended at a
depth where its density is equal to that of the medium. Field ex-
periments have shown that biofouled plastic debris undergoes a
rapid defouling when submerged, causing the plastic to return to
17. the surface (29). Defouling in deep water could occur, for ex-
ample, from adverse conditions for the epiphytic organisms
(e.g.,
decreasing irradiance) or the dissolution of carbonates and opal
owing to acidic conditions.
The fourth possible sink is ingestion by marine organisms. The
size interval accumulating most of plastic losses corresponds to
that of zooplankton (mainly copepods and euphausiids). Zoo-
planktivorous predators represent an abundant trophic guild in
the ocean, and it is known that accidental ingestion of plastic
occurs during their feeding activity. The reported incidence of
plastic in stomachs of epipelagic zooplanktivorous fish ranges
from
1 to 29% (30, 31), and in stomachs of small mesopelagic fish
from 9
to 35% (10, 32). The most frequent plastic size ingested by fish
in
all these studies was between 0.5 and 5 mm, matching the pre-
dominant size of plastic debris where global losses occur in our
assessment. Also, these plastic sizes are commonly found in
pred-
ators of zooplanktivorous fish (30, 31, 33).
Although diverse zooplanktivorous predators must contribute
to the plastic capture at millimeter scale, the small mesopelagic
fish likely play a relevant role. They constitute the most
abundant
and ubiquitous zooplanktivorous assemblage in the open ocean,
with densities close to one individual per square meter also in
the
oligotrophic subtropical gyres (34, 35). Mesopelagic fish live in
the middle layer (200–1,000 m deep) of the ocean but migrate to
Fig. 2. Ranges of surface plastic concentrations by ocean.
Nonaccumulation
18. zone (blue boxes), outer accumulation zone (green boxes), and
inner accu-
mulation zone (red boxes). The boundaries of the boxes indicate
the 25th
and 75th percentiles, the black lines within the box mark the
mean, and the
whiskers above and below the boxes indicate the 90th and 10th
percentiles.
Data used in this graph are mapped in Fig. 1. An equivalent
analysis for
a dataset of plastic concentrations not corrected by wind effects
is graphed
in SI Appendix, Fig. S3.
Table 1. Range of the global load of plastic debris in surface
waters of the open ocean
Plastic debris, kilotons North Pacific Ocean North Atlantic
Ocean Indian Ocean South Atlantic Ocean South Pacific Ocean
Total
Low estimate 2.3 1.0 0.8 1.7 0.8 6.6
Mid estimate 4.8 2.7 2.2 2.6 2.1 14.4
High estimate 12.4 6.7 5.1 5.4 5.6 35.2
Loads by ocean were estimated from the low, mid, and high
ranges of plastic concentration measured within major regions
in relation to the degree of surface
convergence (nonaccumulation zone, outer accumulation zone,
and inner accumulation zone). The ranges of plastic
concentration by zones are shown in Fig. 2.
Cózar et al. PNAS | July 15, 2014 | vol. 111 | no. 28 | 10241
EN
V
20. defecated. Gut content of mesopelagic fish is evacuated as long
Fig. 3. Size distribution of floating plastic debris
collected during the Malaspina circumnavigation at
calm conditions. (A) Size distribution in abundance
(light blue bars) and abundance normalized by the
width (in millimeters) of the size class (blue circles). (B)
Measured (blue circles) and modeled (red squares) size
distributions of normalized abundance in logarithmic
scale. Modeled distribution was strictly based on frag-
mentation of large plastic items. (C) Measured (blue
circles) and modeled (red squares) size distributions in
normalized volume. Green bars indicate the estimated
losses of plastic volume by size class (Δi). After
smoothing the measured distribution with a Weibull
function (black line, R = 0.9979, P < 0.0001), losses by
size were estimated from its progressive departure
from the modeled distribution. Dashed vertical lines
through all three graphs correspond to 1-mm and
5-mm size limits. Because plastic presence declined
for sizes over 10 cm, modeling analysis was applied
up to 10 cm. Note that the largest size class extends
from 10 cm to 1 m, the length of the net mouth.
Measured size distributions are built from the plastic
collected in tows with u* <0.5 cm·s
−1 (4,184 plastic
items) to avoid wind-mixing effect. An analysis of the
effect of wind mixing on plastic size distribution is
shown in SI Appendix, Fig. S7, and size distributions
for the whole Malaspina dataset (7,359 plastic items)
are graphed in SI Appendix, Fig. S10.
10242 | www.pnas.org/cgi/doi/10.1073/pnas.1314705111 Cózar
et al.
21. http://www.pnas.org/lookup/suppl/doi:10.1073/pnas.131470511
1/-/DCSupplemental/pnas.1314705111.sapp.pdf
http://www.pnas.org/lookup/suppl/doi:10.1073/pnas.131470511
1/-/DCSupplemental/pnas.1314705111.sapp.pdf
www.pnas.org/cgi/doi/10.1073/pnas.1314705111
viscous feces that assume spheroid shapes while sinking at high
velocities (around 1,000 m·d−1) (36). Hence, microplastic
fragments
could also reach the bottom via defecation, a proposition that
re-
quires further quantitative testing.
Surface losses of large plastic objects by sinking are un-
accounted for in our fragmentation model (Fig. 3). However,
these large objects, included those in the uppermost part of our
plastic size spectrum, are commonly observed on the seafloor
(37) and likely contribute significantly to reduce the global load
at the surface. Large plastic objects undergo particular bio-
fouling because they can host a wide size range of organisms
and
often show large cavities (e.g., bags, bottles) that facilitate their
ballasting and subsequent sinking.
In the present study, we confirm the gathering of floating
plastic debris, mainly microplastics, in all subtropical gyres.
The
current plastic load in surface waters of the open ocean was
estimated in the order of tens of thousands of tons (10,000–
40,000). This estimate could be greatly improved through
joining
sampling efforts particularly in semiclosed seas (e.g., Mediter-
ranean) and the southern hemisphere, where existing data are
scarce. Nevertheless, even our high estimate of plastic load,
based on the 90th percentile of the regional concentrations, is
22. considerably lower than expected, by orders of magnitude. Our
observations also show that large loads of plastic fragments
with
sizes from microns to some millimeters are unaccounted for in
the surface loads. The pathway and ultimate fate of the missing
plastic are as yet unknown. We cannot rule out either of the
proposed sink processes or the operation of sink processes yet
to
be identified. Indeed, the losses inferred from our assessment
likely involve a combination of multiple sinks. Missing micro-
plastic may derive from nano-fragmentation processes,
rendering
the very small pieces undetectable to convectional sampling
nets,
and/or may be transferred to the ocean interior. The abundance
of nano-scale plastic particles has still not been quantified in
the
ocean (9), and the measurements of microplastic in deep ocean
are very scarce, although available observations point to a sig-
nificant abundance of microplastic particles in deep sediments
(38), which invokes a mechanism for the vertical transport of
plastic particles, such as biofouling or ingestion. Because
plastic
inputs into the ocean will probably continue, and even increase,
resolving the ultimate pathways and fate of these debris is a
matter
of urgency.
Materials and Methods
From December 2010 to July 2011 the Spanish
circumnavigation expedition
Malaspina 2010 sampled surface plastic pollution at 141 sites
across the
oceans. Floating plastic was collected with a neuston net (1.0- ×
0.5-m mouth,
200-μm mesh) towed at 2–3 knots for periods 10–15 min (total
23. tows 225).
Tow areas were calculated from the readings of a flowmeter in
the mouth of
the net. Wind speed and water surface density were measured
during each
tow to estimate average friction velocity in water (u*) (39).
The material collected by the net was mixed with 0.2-mm-
filtered sea-
water. Subsequently, floating plastic debris was carefully
picked out from the
water surface with the aid of a dissecting microscope. This
examination was
repeated at least twice to ensure the detection of all of the
smallest plastic
particles. To confirm the plastic nature of the material collected
in the
examinations, Raman spectroscopy was applied to a random
subset of par-
ticles (n = 67). The analysis confirmed the identity of all plastic
particles, and
polyethylene was found to be the most common polymer type.
The vast
majority of the plastic items consisted of fragments of larger
objects, and
industrial resin pellets represented only a small fraction (<2%)
of all en-
countered items. Textile fibers were found only occasionally
and were ex-
cluded from the analysis because they could be airborne
contamination
from clothing during the sampling or processing (31).
Plastics extracted from the seawater samples were washed with
deionized
water and dried at room temperature. The total dry weight of the
24. plastics
collected in each tow was recorded. The maximum linear length
(l) of the
plastic items was measured by high-resolution scanning (SI
Appendix, Fig.
S11) and the image processing Zooimage software
(www.sciviews.org). Al-
ternatively, excessively large plastic objects were measured
with a ruler.
Overall, 7,359 plastic items were measured and separated in 28
size classes to
build a size distribution. Size limits of the bins followed a 0.1-
log series of l.
The width of the uppermost bin extended from 10 cm to the
length of the
net mouth (100 cm) to account for all sizes that could be
collected by the
net. The trapping efficiency of fine particles by the mesh was
tested from
the analysis of the size distribution of nonplastic particles in six
tows evenly
distributed along the circumnavigation (SI Appendix, Fig. S12).
Once the
plastic particles were picked out from the samples, the size
distribution of
nonplastic particles was measured by the same methods.
Wind stress can extend the vertical distribution of floating
plastic debris
into the surface mixing layer, resulting in underestimation of
the plastic
concentrations measured by the surface tows (0.25 m deep).
Thus, the in-
tegrated plastic abundance from the surface to the base of the
wind-mixed
25. layer (generally <25 m) was estimated with a model dependent
on u* and
the numerical concentrations measured in the surface tows (39).
Wind-cor-
rected abundances were converted to mass concentrations using
a correla-
tion based on simultaneous measurements of total mass and
abundance of
plastic in 570 worldwide tows (SI Appendix, Fig. S13).
Size-Distribution Analysis. A theoretical size distribution of
plastic derived
from fragmentation was modeled by assuming steady state
(large-objects
input = small-fragments output, below 0.2 mm). Given that the
plastic abun-
dance in a given size class depends on the fragmentation of
larger plastic
objects already present, we selected a size class with relatively
large plastic
(reference bin) and projected the plastic amount measured in
this bin toward
smaller and larger size classes (onward and backward in time).
Therefore, the
normalized abundance (divided by the width of the size-class
interval) of the
size class i derived from steady fragmentation was modeled as
Afi =
Aref · α · l
3
ref
α · l3i
=
26. Aref · l
3
ref
l3i
:
We used a standard shape for the plastic fragments having the
three principal
axes proportional to l. Thus, α · l3i accounts for the mean
volume of the
fragments of i, with α being a shape factor and li the nominal
length for the
class i, set at the bin midpoint. Aref is the normalized
abundance measured
in the reference bin (i = ref). The 20- to 25-mm class was
selected as reference,
although similar results were obtained by selecting other large-
size classes.
The normalized volume in each size class derived from
fragmentation was
modeled as Vfi = A
f
i · α · l
3
i = Aref · α · l
3
ref , being α = 0.1, a value corresponding
to flat-shaped volume. Because the steady fragmentation of the
large-plastic
27. input results in an even volume–size distribution, deviations of
the observed
size distribution from a conservative distribution can be related
to changes in
the fragmentation dynamics, inputs of small plastics, or losses
(SI Appendix,
Fig. S9). Estimating volumes from observed abundances ðV*i =
A*i · α · l3i Þ, and
after smoothing the resulting volume–size distribution to
remove small ir-
regularities, the deviations from a conservative distribution (Δi,
expressed as
percentage of total) were calculated as
Δi =
V*i−1 − V
*
iPn
i=1
���V*i−1 − V*i
���
=
�
A*i−1 · l
3
i−1
�
−
�
A*i · l
28. 3
i
�
Pn
i=1
���
�
Ai−1 · l3i−1
�
−
�
Ai · l3i
����
,
where i = 1, 2, . . ., n, with n being the lowest size class (0.2–
0.25 mm). The
denominator accounts for the total deviations accumulated
across the entire
size range studied. Negative values of Δi are related to net
plastic losses and
positive values to plastic accumulations. Note that Δi is
independent of the
standard plastic shape (α value) used in the computations.
Possible variations
of α with size were unable to induce changes in the volume–size
distribution
enough to explain the gap found in small sizes, owing to the
extreme
scarceness of plastic below 1 mm and the geometrical constrain
29. for α, get-
ting the maximum at 0.52 (spherical shape). Observed plastic
abundance in
the lowest part of the size spectrum was four orders of
magnitude lower
than expected from fragmentation (Fig. 3).
The size-distribution analysis is a useful tool to constrain the
possible
dynamics of marine plastic pollution. Nevertheless, the
mechanisms leading
to the observed plastic size distributions still are not entirely
understood and
deserve further attention, resolving the size dependence of the
sink/sources
processes, as well as testing the framework proposed here (SI
Appendix, Fig.
S9) to identify additional processes.
Spatial Analysis. To analyze the global distribution of floating
plastic, data
from the Malaspina circumnavigation were combined with
additional re-
gional surveys and recent (from 2006 to date) measurements
reported by
other researchers after data standardization (SI Appendix, Table
S1).
Cózar et al. PNAS | July 15, 2014 | vol. 111 | no. 28 | 10243
EN
V
IR
O
N
M
31. net type and mouth dimensions (one-half mouth height for
neuston nets,
three-fourths mouth height for manta nets). Plastic
concentrations mea-
sured with mesh sizes larger than 0.2 mm were multiplied by a
correction
factor derived from the plastic size distribution measured in the
Malaspina
circumnavigation. For 0.3-, 0.5-, and 1.0-mm mesh sizes,
numerical un-
derestimation was estimated at 0.4, 2.7, and 21.3%, and mass
un-
derestimation at 0.0, 0.4, and 5.0%, respectively. Data reported
in numerical
concentrations were converted to mass concentrations by using
the global
relationship found between total mass and abundance (SI
Appendix, Fig.
S13). For data reported without wind correction (3–5, 18), we
use satellite
winds from the CCMP database (http://podaac.jpl.nasa.gov) to
discard samples
collected with winds speeds larger than 5 m·s−1 (u* ∼0.6 cm·s
−1), the threshold
above which the effects of wind stress can be significant (39).
The range of the global plastic load in the surface ocean was
estimated
from the concentration ranges measured over 15 major zones in
relation
to the degree of surface convergence and by using two different
sets of
measurements, a wind-corrected dataset and a noncorrected
dataset. Using
a global circulation model (6), nonaccumulation, outer
32. accumulation, and
inner accumulation zones were delimited in each ocean basin to
reduce the
inaccuracies derived from an uneven distribution of
measurements. In ad-
dition, plastic measurements were spatially averaged over grid
cells of 2°
in both latitude and longitude to avoid overweight of areas with
high
sampling frequency. Overall, 442 grid cells (1,127 net tows)
were included in
the wind-corrected dataset (Fig. 1 and SI Appendix, Table S1).
Midrange
regional concentrations were calculated from the averaging of
the wind-
corrected plastic concentrations within each major zone. High-
range re-
gional concentrations were calculated from the 90th percentile.
We used
a wide confidence interval for the plastic load estimate to
address vari-
ability and possible inaccuracies in the spatial concentrations of
plastic.
Low-range concentrations were calculated from the averaging of
the di-
rect measurements of surface concentrations, without wind
correction or
discards by high wind mixing (noncorrected dataset: 851 grid
cells, 3,070
net tows; SI Appendix, Figs. S2 and S3). Global plastic loads in
the open-
ocean surface were estimated from high, mid, and low regional
concen-
trations and surface areas.
33. ACKNOWLEDGMENTS. We thank Pakea Bizkaia and the
Chilean Navy, which
contributed to the sample collection, and K. L. Law, M. C.
Goldstein, M. J. Doyle,
M. Eriksen, J. Reisser, and their collaborators for their
available data. We also
thank S. Loiselle and J. Ruiz for his useful suggestions in
writing the paper. This
research was funded by the Spanish Ministry of Economy and
Competitiveness
through the Malaspina 2010 expedition project (Consolider-
Ingenio 2010,
CSD2008-00077) and the Migrants and Active Flux in the
Atlantic Ocean project
(CTM2012-39587-C04-01). Original data reported in this paper
are freely avail-
able at http://metamalaspina.imedea.uib-csic.es/geonetwork.
This is Campus
de Excelencia Internacional del Mar (CEIMAR) Publication 58.
1. Yarsley VE, Couzens EG (1945) Plastics (Penguin, London).
2. Barnes DKA, Galgani F, Thompson RC, Barlaz M (2009)
Accumulation and fragmen-
tation of plastic debris in global environments. Philos Trans R
Soc Lond B Biol Sci
364(1526):1985–1998.
3. Law KL, et al. (2010) Plastic accumulation in the North
Atlantic subtropical gyre. Sci-
ence 329(5996):1185–1188.
4. Goldstein MC, Rosenberg M, Cheng L (2012) Increased
oceanic microplastic debris
enhances oviposition in an endemic pelagic insect. Biol Lett
8(5):817–820.
34. 5. Eriksen M, et al. (2013) Plastic pollution in the South Pacific
subtropical gyre. Mar
Pollut Bull 68(1–2):71–76.
6. Maximenko N, Hafner J, Niiler P (2012) Pathways of marine
debris derived from tra-
jectories of Lagrangian drifters. Mar Pollut Bull 65(1–3):51–62.
7. Lebreton LCM, Greer SD, Borrero JC (2012) Numerical
modelling of floating debris in
the world’s oceans. Mar Pollut Bull 64(3):653–661.
8. Hidalgo-Ruz V, Gutow L, Thompson RC, Thiel M (2012)
Microplastics in the marine
environment: A review of the methods used for identification
and quantification.
Environ Sci Technol 46(6):3060–3075.
9. Andrady AL (2011) Microplastics in the marine environment.
Mar Pollut Bull 62(8):
1596–1605.
10. Boerger CM, Lattin GL, Moore SL, Moore CJ (2010) Plastic
ingestion by planktivorous
fishes in the North Pacific Central Gyre. Mar Pollut Bull
60(12):2275–2278.
11. Choy CA, Drazen JC (2013) Plastic for dinner?
Observations of frequent debris in-
gestion by pelagic predatory fishes from the central North
Pacific. Mar Ecol Prog Ser
485:155–163.
12. de Stephanis R, Giménez J, Carpinelli E, Gutierrez-Exposito
C, Cañadas A (2013) As
35. main meal for sperm whales: Plastics debris. Mar Pollut Bull
69(1–2):206–214.
13. Azzarello MY, Van-Vleet ES (1987) Marine birds and
plastic pollution. Mar Ecol Prog
Ser 37:295–303.
14. Teuten EL, et al. (2009) Transport and release of chemicals
from plastics to the en-
vironment and to wildlife. Philos Trans R Soc Lond B Biol Sci
364(1526):2027–2045.
15. Hirai H, et al. (2011) Organic micropollutants in marine
plastics debris from the open
ocean and remote and urban beaches. Mar Pollut Bull
62(8):1683–1692.
16. Thompson RC, et al. (2004) Lost at sea: Where is all the
plastic? Science 304(5672):838.
17. Law KL, et al. (2014) Distribution of surface plastic debris
in the eastern pacific ocean
from an 11-year data set. Environ Sci Technol 48(9):4732–4738.
18. Doyle MJ, Watson W, Bowlin NM, Sheavly SB (2011)
Plastic particles in coastal pelagic
ecosystems of the Northeast Pacific ocean. Mar Environ Res
71(1):41–52.
19. Reisser J, et al. (2013) Marine plastic pollution in waters
around Australia: Charac-
teristics, concentrations, and pathways. PLoS ONE
8(11):e80466.
20. Center for International Earth Science Information Network
(2012) National Ag-
36. gregates of Geospatial Data: Population, Landscape and Climate
Estimates Version 3
(National Aeronautics and Space Administration Socioeconomic
Data and Applica-
tions Center, Palisades, NY). Available at
http://sedac.ciesin.columbia.edu/data/set/
nagdc-population-landscape-climate-estimates-v3. Accessed
October 16, 2012.
21. Day RH, Shaw DG, Ignell SE (1990) The quantitative
distribution and characteristics of
neuston plastic in the North Pacific Ocean, 1985–88.
Proceedings of the 2nd In-
ternational Conference on Marine Debris, eds Shomura RS,
Godfrey ML (National
Oceanic and Atmospheric Administration, Honolulu), pp 247–
266.
22. Yamashita R, Tanimura A (2007) Floating plastic in the
Kuroshio Current area,
western North Pacific Ocean. Mar Pollut Bull 54(4):485–488.
23. National Academy of Sciences (1975) Assessing Potential
Ocean Pollutants: A Report
of the Study Panel on Assessing Potential Ocean Pollutants to
the Ocean Affairs Board
(National Research Council, Washington, DC).
24. Association of Plastic Manufacturers (2011) Plastics – the
Facts 2011: An analysis of
European Plastic Production, Demand and Recovery for 2010
(Plastic Europe, Brussels).
25. Timár G, Blömer J, Kun F, Herrmann HJ (2010) New
universality class for the frag-
mentation of plastic materials. Phys Rev Lett 104(9):095502.
37. 26. Kishimura H, Noguchi D, Preechasupanya W, Matsumoto H
(2013) Impact fragmen-
tation of polyurethane and polypropylene cylinder. Physica A
392(22):5574–5580.
27. Zettler ER, Mincer TJ, Amaral-Zettler LA (2013) Life in the
“plastisphere”: Microbial
communities on plastic marine debris. Environ Sci Technol
47(13):7137–7146.
28. Vianello A, et al. (2013) Microplastic particles in sediments
of Lagoon of Venice, Italy:
First observations on occurrence, spatial patterns and
identification. Estuar Coast
Shelf Sci 130:54–61.
29. Andrady AL, Song Y (1991) Fouling of floating plastic
debris under Biscayne Bay ex-
posure conditions. Mar Pollut Bull 22(12):117–122.
30. Lusher AL, McHugh M, Thompson RC (2013) Occurrence of
microplastics in the gas-
trointestinal tract of pelagic and demersal fish from the English
Channel. Mar Pollut
Bull 67(1–2):94–99.
31. Foekema EM, et al. (2013) Plastic in north sea fish. Environ
Sci Technol 47(15):
8818–8824.
32. Davison P, Asch RG (2011) Plastic ingestion by
mesopelagic fishes in the North Pacific
Subtropical Gyre. Mar Ecol Prog Ser 432:173–180.
33. Eriksson C, Burton H (2003) Origins and biological
38. accumulation of small plastic
particles in fur seals from Macquarie Island. Ambio 32(6):380–
384.
34. Lam V, Pauly D (2005) Mapping the global biomass of
mesopelagic fishes. Sea Around
Us Proj Newsl 30:4.
35. Irigoien X, et al. (2014) Large mesopelagic fishes biomass
and trophic efficiency in the
open ocean. Nat Commun 5:3271.
36. Robison BH, Bailey TG (1981) Sinking rates and dissolution
of midwater fish fecal
matter. Mar Biol 65:135–142.
37. Pham CK, et al. (2014) Marine litter distribution and density
in European seas, from
the shelves to deep basins. PLoS ONE 9(4):e95839.
38. Van Cauwenberghe L, Vanreusel A, Mees J, Janssen CR
(2013) Microplastic pollution
in deep-sea sediments. Environ Pollut 182:495–499.
39. Kukulka T, Proskurowski G, Morét-Ferguson S, Meyer DW,
Law KL (2012) The effect of
wind mixing on the vertical distribution of buoyant plastic
debris. Geophys Res Lett
39(7):L07601.
10244 | www.pnas.org/cgi/doi/10.1073/pnas.1314705111 Cózar
et al.
http://www.pnas.org/lookup/suppl/doi:10.1073/pnas.131470511
1/-/DCSupplemental/pnas.1314705111.sapp.pdf
http://www.pnas.org/lookup/suppl/doi:10.1073/pnas.131470511
40. a basic question: How much plastic is
out there?” says Marcus Eriksen of the
institute. “We’ve found microplastic
ocean pollution, in varying concentra-
tions, everywhere in the world.”
The report estimates that some
5.25 trillion plastic particles weigh-
ing about 269,000 tons are floating in
the world’s oceans. Previous reports
only looked at one size class and thus
reported much lower plastic densities
in the world’s oceans.
The new research also demonstrat-
ed some unexpected findings, namely
a dramatic loss of microplastic from
the sea surface in the garbage patches
of the five subtropical gyres, large areas
of rotating currents where the frag-
ments tend to accumulate. In addition,
the survey found a wide distribution of
the smallest microplastics in remote re-
gions of the ocean. Though concentra-
tions in the gyres are lower than pre-
viously reported, plastics occur nearly
everywhere, often far outside of the
garbage patches.
Eriksen led a team of nine research-
ers from six different countries, includ-
ing Capt. Charles Moore, who found
the first garbage patch in the North
T he Science Teacher18
42. experience
Pacific. The researchers contributed
data from 24 expeditions studying
plastic floating on the sea surface. Mi-
croplastics were collected with nets,
while floating macroplastics were
counted by systematic observations.
These data were used to populate a
model that assumes plastic enters the
oceans from rivers, shipping lanes, and
densely populated coastlines. The data
and model show that large plastics are
abundant near coastlines and degrade
in the five subtropical gyres into mi-
croplastics, the smallest of which are,
surprisingly, present in more remote
regions such as the subpolar gyres.
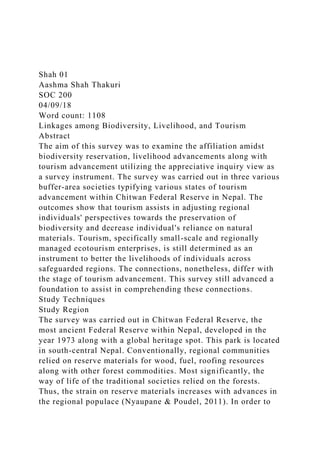
These maps show where the density of plastic debris of various
sizes was
measured. The count density was measured at 1,571 stations
from 680 net
tows and 891 visual survey transects for each of four plastic
size classes
(0.33–1.00 mm, 1.01–4.75 mm, 4.76–200 mm, and >200 mm).
Februa r y 2015 19
The garbage patches should thus
be characterized not as repositories or
final resting places, but as shredders
and redistributors of trash, where
43. sunlight (UV), oxidation, embrittle-
ment, breakage by waves and frag-
mentation by grazing fish all degrade
large plastic pieces to tiny fragments.
These microplastics are then ejected
from the garbage patches through
various mechanisms such as foraging
and filter-feeding by marine organ-
isms, and subsurface currents.
The new research categorized
plastic into four size classes: from
roughly equivalent to a grain of sand
to a grain of rice to a water bottle and
finally anything larger. Using con-
servative fragmentation rates, the re-
searchers expected to find more small
particles than larger ones. Surprising-
ly, their model showed that the small-
est fragments are less abundant than
the next larger size, but more small
particles are found outside of the gar-
bage patches.
Other research has established that
some marine organisms, including
seabirds and fish, ingest these toxic
plastics and may de-sorb these toxi-
cants. “The garbage patches could be
a frightfully efficient mechanism for
corrupting our food chain with toxic
microplastics,” says Eriksen.
The 5 Gyres Institute, which uses
44. research to motivate change, contends
that companies must take responsi-
bility for the entire life-cycle of the
products they create. Working in col-
laboration with multiple government
agencies, NGOs, and responsible cor-
porations, the 5 Gyres Institute will
continue to support campaigns such as
its ongoing effort to replace plastic mi-
crobeads in cosmetics and toothpastes
with biodegradable alternatives.
(PLOS ONE) http://bit.ly/1whEgzp;
video: http://vimeo.com/113359330
Februa r y 2015 21
Copyright of Science Teacher is the property of National
Science Teachers Association and
its content may not be copied or emailed to multiple sites or
posted to a listserv without the
copyright holder's express written permission. However, users
may print, download, or email
articles for individual use.