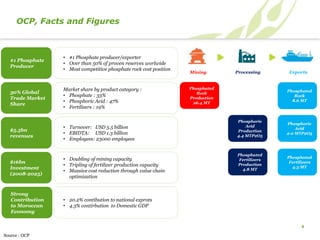
Overview of Phosphate Industry
IYCr2014
”Crystallography for the next generation: the legacy of IYCr”
Presented by : Lhoussaine Omari April 24th, 2015
Summary
2
1. Introduction
2. Keys OCP facts and figures
3. Overview of OCP Value Chain
4. Phosphate Market Situation
5. OCP Development Program
OCP Logo
3
OCP logo symbolizes a shark tooth
(Lamna obliqua) that are current
Fossil in Moroccan phosphates. This
figure is reproduced five times,
representing the five stars of the
national flag and on the other hand,
the destinations of our products to the
five continents. The set is in a circle
around which are placed two ears
folded in an arc, that symbolize the
fertility and growth
Phosphate, a Key Element for Plants Grow
4
Phosphate, a Critical Raw Material
5
Source : Report on critical raw materials for the EU – May 2014
OCP, Facts and Figures
6
Source : OCP
#1 Phosphate
Producer
30% Global
Trade Market
Share
$5.5bn
revenues
$16bn
Investment
(2008-2025)
• #1 Phosphate producer/exporter
• Over than 50% of proven reserves worlwide
• Most competitive phosphate rock cost position
Market share by product category :
• Phosphate : 33%
• Phosphoric Acid : 47%
• Fertilizers : 19%
• Turnover: USD 5.5 billion
• EBIDTA: USD 1.3 billion
• Employees: 23000 employees
• Doubling of mining capacity
• Tripling of fertilizer production capacity
• Massive cost reduction through value chain
optimization
Strong
Contribution
to Moroccan
Economy
• 20.2% contibution to national exprots
• 4.3% contirbution to Domestic GDP
Phosphated
Rock
Production
26.4 MT
Mining Processing
Phosphoric
Acid
Production
4.4 MTP2O5
Phosphated
Fertilizers
Production
4.8 MT
Phosphated
Rock
8.6 MT
Phosphoric
Acid
2.0 MTP2O5
Phosphated
Fertilizers
4.3 MT
Exports
OCP’s Product Portfolio
7
Source : OCP
Traditional Products:
• Phosphate;
• Phosphoric acid (MGA);
• Phosphated Fertilizers (DAP/MAP/TSP).
Specific and Innovative Producs :
• NPK Fertilizers;
• Sulfur Enhanced NPK Fertilizers;
• Micro-elements Enriched NPK Fertilizers;
• Water Soluble Fertilizers;
• Feeds (DCP/MCP);
• Trace Elements;
• Fluoride Products, Phosphogypsum…
Phosphoric
Acid
DAP/MAP Phosphate
Rock
TSP
Water
Soluble
Fertilizers
NPK
Enriched
Fertilizers
Fluoride
Products
Feeds
OCP International Presence
8
OCP Value Chain
9
Mining Processing Exports
Geology
Chemical
Valorisation
Exportation
Phosphate
Beneficiation
• Khouribga
• Youssoufia/ Benguérir
• Boucrâa
• Jorf Lasfar
• Safi
• Casablanca
• Jorf Lasfar
• Safi
• Laâyoune
50%
Extraction
• Khouribga
• Youssoufia
• Boucrâa
50%
Geology
10
 Main constituant = Apatite
(Ca, Na, Mg)10 (PO4)6-X (CO3)X FY (F, OH)2
 Associated minerals :
• Dolomite & calcite
• Quartz & opale
• Montmorillonite & attapulgite
• Gypsum & halite
Extraction
11
Drilling Blasting Pickling Defruiting Transport Mechanical
Treatment
Phosphate Beneficiation
12
Chemical Valorisation – Phosphoric Acid
Grinding
Reaction
Crystallization
Filtration
Concentration
Treatment
Phosphate
Sulfuric
acid
Phosphogypsum
Merchand Grade
Phosphoric Acid
Fluorapatite Sulfuric Acid
Phosphoric Acid Calcium Sulfate
CaSO4,nH2O
H3PO4
Ca3(PO4)2 H2SO4
Calcium Sulphate Crystallization form:
 n=2 : Dihydrate
 n=0,5 : Hemi-hydrate
 n=0 : Anhydrous
Chemical Valorisation - Fertilizers
14
KCL
H3PO4
H2SO4
Phosphate Rock
SSP
MAP
DAP
ASP
TSP
H2SO4
H3PO4
NPK
NH3
2NH3
NH3
H2SO4
2NH3
Strong Long-Term Demand Fundamentals
15
Source : FAO – IFA
Long-term CAGR based on estimated production volumes in 1961 and 2014
• 80% increase in global crop production will be required
within the next 40 years;
• Agriculture yield improvment through the use of fertilizers is
the major driver to address the imbalance between food
demand and supply.
Global Population is Steadily Increasing
Available Arable Land per Capita is Declining
Global Fertilizer Demand Has Grown Over
The Long-Term
OCP Additional Capacity Poised To Support Demand Growth
16
Source : IFA – Argus FMB - OCP
Global Phosphate-Based Fertilizer Demand Growth Global Phosphate-Based Fertilizer Supply Growth
MT P2O5 MT P2O5
OCP Launched an Important Investment Plan of $16Bn
17
New Mines and Benefeciation
Plants
 Additional Mining Capacity :
 More than 25 MT in Khouribga,
Gantour , Meskala and
Laayoune;
 New Rock Beneficiation Plants:
• 3 in Khouribga;
• 1 at Gantour,
• 1 at Meskala,
• 1 at Laayoune.
Slurry Pipelines (Instead of
Trains)
 Slurry Pipelines:
 Khouribga – Jorf Lasfar
(Operational) 38 MT/year;
 Gantour – Safi Pipeline
(Planned) 10 MT/year.
A World Class « Plug &
Play » Chemical Platform
 Jorf Phosphate Hub handling up to
10 new integrated fertilizer units &
expansion of logistical
infrastructures (storage, port…)
 Safi Phosphate Hub and
Phosboucraa Chemical Complex.
The Slurry Pipeline as a Cornerstone of the Development
Program
18
www.ocpgroup.ma

Session5_Omari.pdf

  • 1.
    Overview of PhosphateIndustry IYCr2014 ”Crystallography for the next generation: the legacy of IYCr” Presented by : Lhoussaine Omari April 24th, 2015
  • 2.
    Summary 2 1. Introduction 2. KeysOCP facts and figures 3. Overview of OCP Value Chain 4. Phosphate Market Situation 5. OCP Development Program
  • 3.
    OCP Logo 3 OCP logosymbolizes a shark tooth (Lamna obliqua) that are current Fossil in Moroccan phosphates. This figure is reproduced five times, representing the five stars of the national flag and on the other hand, the destinations of our products to the five continents. The set is in a circle around which are placed two ears folded in an arc, that symbolize the fertility and growth
  • 4.
    Phosphate, a KeyElement for Plants Grow 4
  • 5.
    Phosphate, a CriticalRaw Material 5 Source : Report on critical raw materials for the EU – May 2014
  • 6.
    OCP, Facts andFigures 6 Source : OCP #1 Phosphate Producer 30% Global Trade Market Share $5.5bn revenues $16bn Investment (2008-2025) • #1 Phosphate producer/exporter • Over than 50% of proven reserves worlwide • Most competitive phosphate rock cost position Market share by product category : • Phosphate : 33% • Phosphoric Acid : 47% • Fertilizers : 19% • Turnover: USD 5.5 billion • EBIDTA: USD 1.3 billion • Employees: 23000 employees • Doubling of mining capacity • Tripling of fertilizer production capacity • Massive cost reduction through value chain optimization Strong Contribution to Moroccan Economy • 20.2% contibution to national exprots • 4.3% contirbution to Domestic GDP Phosphated Rock Production 26.4 MT Mining Processing Phosphoric Acid Production 4.4 MTP2O5 Phosphated Fertilizers Production 4.8 MT Phosphated Rock 8.6 MT Phosphoric Acid 2.0 MTP2O5 Phosphated Fertilizers 4.3 MT Exports
  • 7.
    OCP’s Product Portfolio 7 Source: OCP Traditional Products: • Phosphate; • Phosphoric acid (MGA); • Phosphated Fertilizers (DAP/MAP/TSP). Specific and Innovative Producs : • NPK Fertilizers; • Sulfur Enhanced NPK Fertilizers; • Micro-elements Enriched NPK Fertilizers; • Water Soluble Fertilizers; • Feeds (DCP/MCP); • Trace Elements; • Fluoride Products, Phosphogypsum… Phosphoric Acid DAP/MAP Phosphate Rock TSP Water Soluble Fertilizers NPK Enriched Fertilizers Fluoride Products Feeds
  • 8.
  • 9.
    OCP Value Chain 9 MiningProcessing Exports Geology Chemical Valorisation Exportation Phosphate Beneficiation • Khouribga • Youssoufia/ Benguérir • Boucrâa • Jorf Lasfar • Safi • Casablanca • Jorf Lasfar • Safi • Laâyoune 50% Extraction • Khouribga • Youssoufia • Boucrâa 50%
  • 10.
    Geology 10  Main constituant= Apatite (Ca, Na, Mg)10 (PO4)6-X (CO3)X FY (F, OH)2  Associated minerals : • Dolomite & calcite • Quartz & opale • Montmorillonite & attapulgite • Gypsum & halite
  • 11.
    Extraction 11 Drilling Blasting PicklingDefruiting Transport Mechanical Treatment
  • 12.
  • 13.
    Chemical Valorisation –Phosphoric Acid Grinding Reaction Crystallization Filtration Concentration Treatment Phosphate Sulfuric acid Phosphogypsum Merchand Grade Phosphoric Acid Fluorapatite Sulfuric Acid Phosphoric Acid Calcium Sulfate CaSO4,nH2O H3PO4 Ca3(PO4)2 H2SO4 Calcium Sulphate Crystallization form:  n=2 : Dihydrate  n=0,5 : Hemi-hydrate  n=0 : Anhydrous
  • 14.
    Chemical Valorisation -Fertilizers 14 KCL H3PO4 H2SO4 Phosphate Rock SSP MAP DAP ASP TSP H2SO4 H3PO4 NPK NH3 2NH3 NH3 H2SO4 2NH3
  • 15.
    Strong Long-Term DemandFundamentals 15 Source : FAO – IFA Long-term CAGR based on estimated production volumes in 1961 and 2014 • 80% increase in global crop production will be required within the next 40 years; • Agriculture yield improvment through the use of fertilizers is the major driver to address the imbalance between food demand and supply. Global Population is Steadily Increasing Available Arable Land per Capita is Declining Global Fertilizer Demand Has Grown Over The Long-Term
  • 16.
    OCP Additional CapacityPoised To Support Demand Growth 16 Source : IFA – Argus FMB - OCP Global Phosphate-Based Fertilizer Demand Growth Global Phosphate-Based Fertilizer Supply Growth MT P2O5 MT P2O5
  • 17.
    OCP Launched anImportant Investment Plan of $16Bn 17 New Mines and Benefeciation Plants  Additional Mining Capacity :  More than 25 MT in Khouribga, Gantour , Meskala and Laayoune;  New Rock Beneficiation Plants: • 3 in Khouribga; • 1 at Gantour, • 1 at Meskala, • 1 at Laayoune. Slurry Pipelines (Instead of Trains)  Slurry Pipelines:  Khouribga – Jorf Lasfar (Operational) 38 MT/year;  Gantour – Safi Pipeline (Planned) 10 MT/year. A World Class « Plug & Play » Chemical Platform  Jorf Phosphate Hub handling up to 10 new integrated fertilizer units & expansion of logistical infrastructures (storage, port…)  Safi Phosphate Hub and Phosboucraa Chemical Complex.
  • 18.
    The Slurry Pipelineas a Cornerstone of the Development Program 18
  • 19.