8-2
Functional strategy- theapproach a functional area takes
to achieve corporate and business unit objectives and
strategies by maximizing resource productivity
Marketing strategy
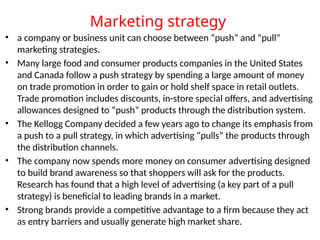
• acompany or business unit can choose between “push” and “pull”
marketing strategies.
• Many large food and consumer products companies in the United States
and Canada follow a push strategy by spending a large amount of money
on trade promotion in order to gain or hold shelf space in retail outlets.
Trade promotion includes discounts, in-store special offers, and advertising
allowances designed to “push” products through the distribution system.
• The Kellogg Company decided a few years ago to change its emphasis from
a push to a pull strategy, in which advertising “pulls” the products through
the distribution channels.
• The company now spends more money on consumer advertising designed
to build brand awareness so that shoppers will ask for the products.
Research has found that a high level of advertising (a key part of a pull
strategy) is beneficial to leading brands in a market.
• Strong brands provide a competitive advantage to a firm because they act
as entry barriers and usually generate high market share.
5.
Market development strategy-provides the ability to:
• Capture a larger market share
– Market saturation
– Market penetration
• Develop new uses and/or markets for current
products
6.
8-6
Product development strategy-provides the ability to:
• Develop new products for existing markets
• Develop new products for new markets
7.
8-7
• Line extension-using a successful brand name to
market other products
• Push strategy- promotions to gain or hold shelf
space in retail outlets
• Pull strategy- advertising to “pull” products through
the distribution channels
8.
8-8
• Skim pricing-offers the opportunity to “skim the
cream” from the top of the demand curve with a
high price while the product is novel and
competitors are few
• Penetration pricing- attempts to hasten market
development and offers the pioneer the opportunity
to use the experience curve to gain market share
with low price and then dominate the industry
9.
8-9
Financial Strategy- examinesthe financial
implications of corporate and business-level
strategic options and identifies the best financial
course of action
Financial strategy includes the management of:
• Dividends
• Stock price
• Sales of company patents
10.
8-10
Research and DevelopmentStrategy- deals with
product and process innovation and improvement
• Technological leader- pioneers innovation
• Technological follower- imitates the products of
competitors
• Open innovation- use of alliances and connections
with corporate, government, academic labs and
consumers to develop new products and processes
11.
Research and DevelopmentStrategy
• One example of an effective use of the leader R&D
functional strategy to achieve a differentiation competitive
advantage is Nike, Inc.
• Nike spends more than most in the industry on R&D to
differentiate the performance of its athletic shoes from that
of its competitors.
• As a result, its products have become the favorite of
serious athletes
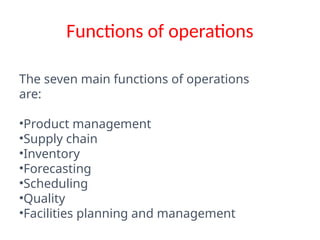
Functions of operations
Theseven main functions of operations
are:
•Product management
•Supply chain
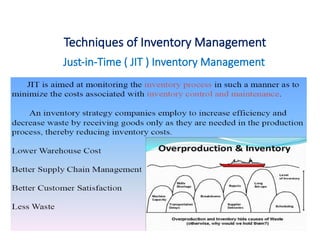
•Inventory
•Forecasting
•Scheduling
•Quality
•Facilities planning and management
14.
8-14
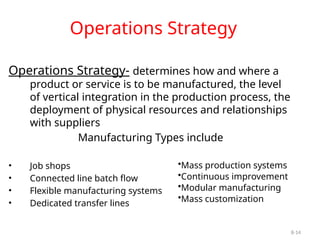
Operations Strategy- determineshow and where a
product or service is to be manufactured, the level
of vertical integration in the production process, the
deployment of physical resources and relationships
with suppliers
Manufacturing Types include
• Job shops
• Connected line batch flow
• Flexible manufacturing systems
• Dedicated transfer lines
•Mass production systems
•Continuous improvement
•Modular manufacturing
•Mass customization
Operations Strategy
15.
Job shops
Job shopsare typically small manufacturing systems that
handle job production, that is, custom/bespoke or semi-
custom/bespoke manufacturing processes such as small to
medium-size customer orders or batch jobs
Examples include :a paint shop, a machine tool shop, a
commercial printing shop
16.
Flexible manufacturing system(FMS)
A flexible manufacturing system (FMS) is a production method
that is designed to easily adapt to changes in the type and
quantity of the product being manufactured.
Machines and computerized systems can be configured to
manufacture a variety of parts and handle changing levels of
production.
Levels include: Product flexibility, process flexibility, and program
flexibility.
17.
Dedicated transfer lines
Inthis strategy, it is based on fixed automation and produce
a company’s core products or parts at high-volume.
Where it has highly automated assembly lines that are
typically designed to produce a single part or single-mass
produced product using little human labor.
It is designed to create products at a high production rate
8-19
It deals withobtaining raw materials, parts and supplies
needed to perform the operations function
Options include:
• Sole suppliers (Deming)
• Multiple
• Parallel sourcing
Purchasing Strategy
20.
Purchasing Strategy
• Undermultiple sourcing, the purchasing company orders a
particular part from several vendors.
• Multiple sourcing has traditionally been considered superior
to other purchasing approaches because it forces suppliers to
compete for the business of an important buyer, thus reducing
purchasing costs, and if one supplier cannot deliver, another
usually can, thus guaranteeing that parts and supplies are
always on hand when needed.
• So long as suppliers can provide evidence that they can meet
the product specifications, they are kept on the purchaser’s
list of acceptable vendors for specific parts and supplies.
• Unfortunately, the common practice of accepting the lowest
bid often compromises quality.
21.
Parallel sourcing
• Inparallel sourcing, two suppliers are the sole
suppliers of two different parts, but they are also
backup suppliers for each other’s parts.
• If one vendor cannot supply all of its parts on time,
the other vendor is asked to make up the
difference.
22.
8-22
Logistics Strategy- dealswith the flow of products
into and out of the manufacturing process
Trends include:
• Centralization
• Outsourcing
• Internet
23.
Outsourcing- purchasing fromsomeone else a
product or service that had been previously
provided internally
• Avoid outsourcing distinctive competencies
Offshoring- the outsourcing of an activity or a function
to a wholly-owned company or an independent
provider in another country
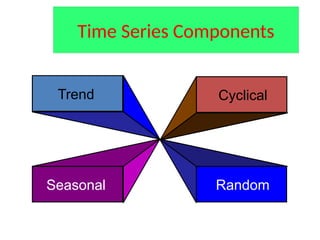
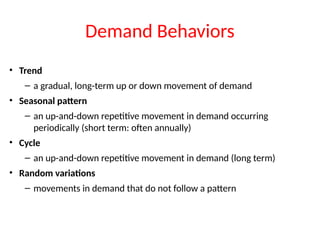
Demand Behaviors
• Trend
–a gradual, long-term up or down movement of demand
• Seasonal pattern
– an up-and-down repetitive movement in demand occurring
periodically (short term: often annually)
• Cycle
– an up-and-down repetitive movement in demand (long term)
• Random variations
– movements in demand that do not follow a pattern
31.
Forecast accuracy
2 commonlyused measures for summarizing
historical errors are
• The mean absolute deviation (MAD)
• The mean squared error (MSE)
32.
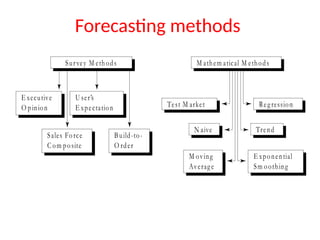
Survey M ethods
Executive
O pinion
U ser’s
E xpectation
Sales Force
Com posite
Build-to-
O rder
M athem atical M ethods
Test M arket Regression
N aive Trend
M oving
Average
E xponential
Sm oothing
Forecasting methods
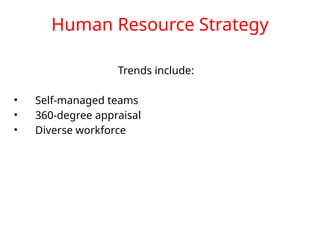
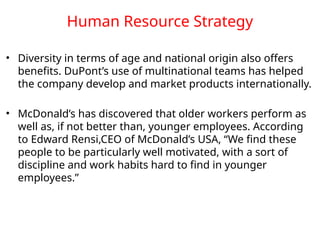
Human Resource Strategy
•Diversity in terms of age and national origin also offers
benefits. DuPont’s use of multinational teams has helped
the company develop and market products internationally.
• McDonald’s has discovered that older workers perform as
well as, if not better than, younger employees. According
to Edward Rensi,CEO of McDonald’s USA, “We find these
people to be particularly well motivated, with a sort of
discipline and work habits hard to find in younger
employees.”
8-36
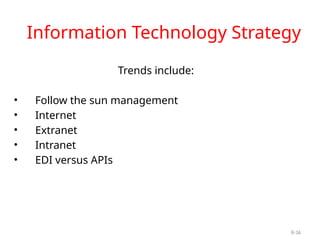
Trends include:
• Followthe sun management
• Internet
• Extranet
• Intranet
• EDI versus APIs
Information Technology Strategy
37.
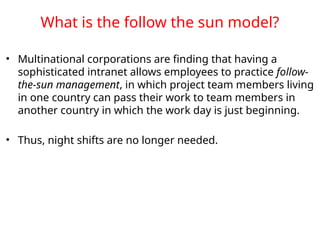
What is thefollow the sun model?
• Multinational corporations are finding that having a
sophisticated intranet allows employees to practice follow-
the-sun management, in which project team members living
in one country can pass their work to team members in
another country in which the work day is just beginning.
• Thus, night shifts are no longer needed.
38.
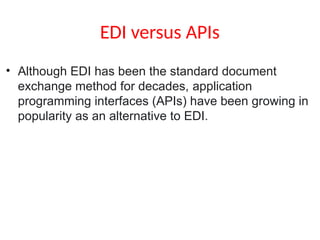
EDI versus APIs
•Although EDI has been the standard document
exchange method for decades, application
programming interfaces (APIs) have been growing in
popularity as an alternative to EDI.
QSPM
Technique designed todetermine the relative
attractiveness of feasible alternative actions
Quantitative Strategic Planning Matrix
41.
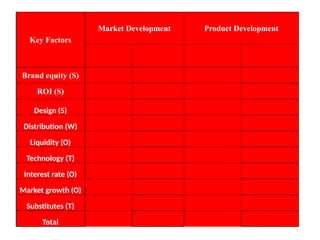
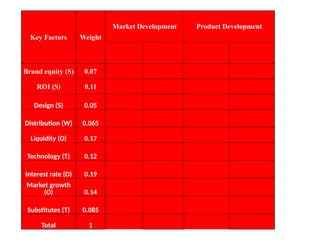
Key Factors
Market DevelopmentProduct Development
Brand equity (S)
ROI (S)
Design (S)
Distribution (W)
Liquidity (O)
Technology (T)
Interest rate (O)
Market growth (O)
Substitutes (T)
Total
42.
Key Factors Weight
MarketDevelopment Product Development
Brand equity (S) 0.07
ROI (S) 0.11
Design (S) 0.05
Distribution (W) 0.065
Liquidity (O) 0.17
Technology (T) 0.12
Interest rate (O) 0.19
Market growth
(O) 0.14
Substitutes (T) 0.085
Total 1
43.
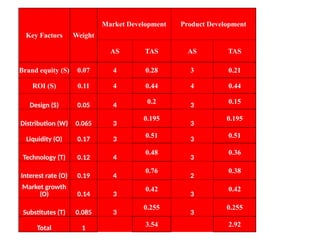
Key Factors Weight
MarketDevelopment Product Development
AS TAS AS TAS
Brand equity (S) 0.07 4 0.28 3 0.21
ROI (S) 0.11 4 0.44 4 0.44
Design (S) 0.05 4
0.2
3
0.15
Distribution (W) 0.065 3
0.195
3
0.195
Liquidity (O) 0.17 3
0.51
3
0.51
Technology (T) 0.12 4
0.48
3
0.36
Interest rate (O) 0.19 4
0.76
2
0.38
Market growth
(O) 0.14 3
0.42
3
0.42
Substitutes (T) 0.085 3
0.255
3
0.255
Total 1 3.54 2.92
44.
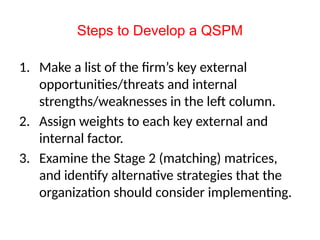
Steps to Developa QSPM
1. Make a list of the firm’s key external
opportunities/threats and internal
strengths/weaknesses in the left column.
2. Assign weights to each key external and
internal factor.
3. Examine the Stage 2 (matching) matrices,
and identify alternative strategies that the
organization should consider implementing.
45.
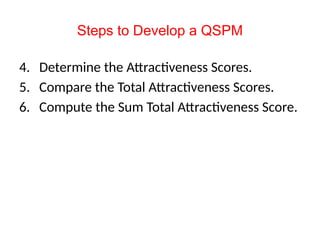
Steps to Developa QSPM
4. Determine the Attractiveness Scores.
5. Compare the Total Attractiveness Scores.
6. Compute the Sum Total Attractiveness Score.
QSPM
Sets of strategiesconsidered simultaneously or
sequentially
Integration of pertinent external & internal factors
in the decision-making process
Advantages
– Less than10% of strategies formulated are
successfully implemented!
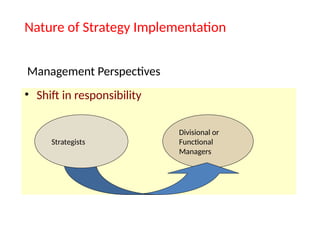
The Nature of Strategy
Implementation
53.
• Market goods& services well
• Raise needed working capital
• Produce technologically sound goods
• Sound information systems
The Nature of Strategy
Implementation
Successful Strategy Implementation
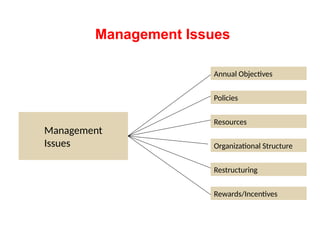
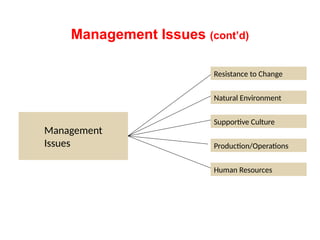
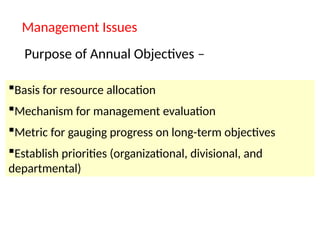
Management Issues
Purpose ofAnnual Objectives –
Basis for resource allocation
Mechanism for management evaluation
Metric for gauging progress on long-term objectives
Establish priorities (organizational, divisional, and
departmental)
57.
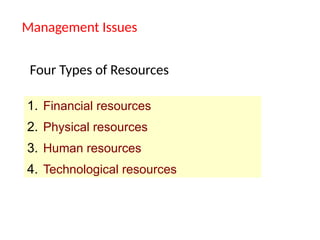
Management Issues
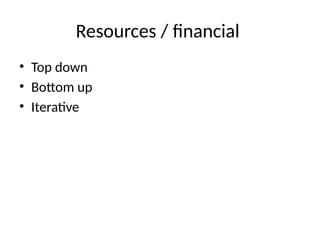
1. Financialresources
2. Physical resources
3. Human resources
4. Technological resources
Four Types of Resources
58.
Management Issues
Conflictnot always “bad”
No conflict may signal apathy
Can energize opposing groups to action
May help managers identify problems
Managing Conflict
Delayering
• Delayering involvesremoving a layer of
management. Within hierarchical structures a
method that can be used to reduce costs is to
remove a layer of management, while expecting
staff to produce the same level of output.
• This can: save the company money on managerial
wages.
62.
Rightsizing
• Rightsizing isthe process of restructuring a company so it
can make a profit more efficiently and meet updated
business objectives.
• Organizations will usually rightsize their business by reducing
their workforce, reorganizing upper management, cutting
costs, and changing job roles.
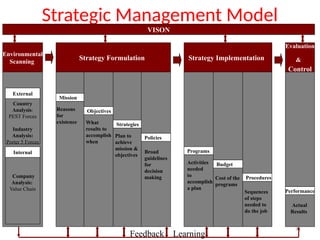
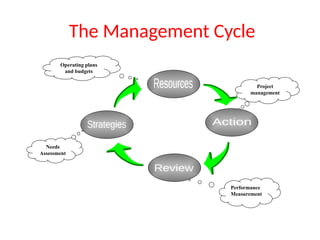
Strategic Management Model
Performance
Actual
Results
Evaluation
&
Control
Programs
Budget
Procedures
Activities
needed
to
accomplish
aplan
Cost of the
programs
Sequences
of steps
needed to
do the job
Objectives
Strategies
What
results to
accomplish
when
Plan to
achieve
mission &
objectives
Broad
guidelines
for
decision
making
Mission
Reasons
for
existence
Environmental
Scanning
Policies
Country
Analysis:
PEST Forces
Industry
Analysis:
Porter 5 Forces
Internal
Company
Analysis:
Value Chain
External
Strategy Formulation Strategy Implementation
Feedback Learning
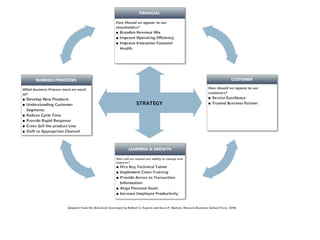
VISON
71
75
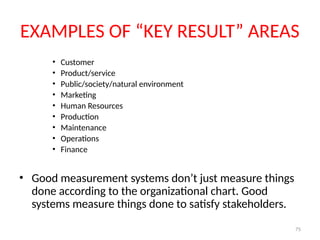
EXAMPLES OF “KEYRESULT” AREAS
• Customer
• Product/service
• Public/society/natural environment
• Marketing
• Human Resources
• Production
• Maintenance
• Operations
• Finance
• Good measurement systems don’t just measure things
done according to the organizational chart. Good
systems measure things done to satisfy stakeholders.
76.
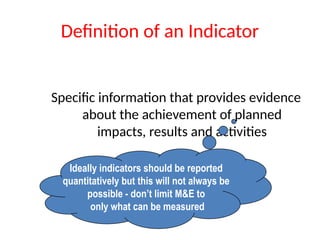
Definition of anIndicator
Specific information that provides evidence
about the achievement of planned
impacts, results and activities
Ideally indicators should be reported
quantitatively but this will not always be
possible - don’t limit M&E to
only what can be measured
77.
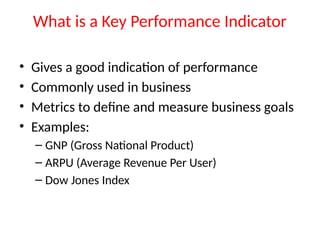
What is aKey Performance Indicator
• Gives a good indication of performance
• Commonly used in business
• Metrics to define and measure business goals
• Examples:
– GNP (Gross National Product)
– ARPU (Average Revenue Per User)
– Dow Jones Index
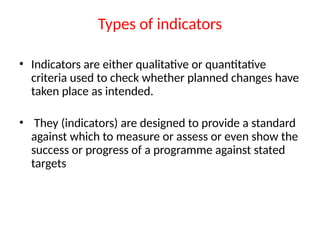
Types of indicators
•Indicators are either qualitative or quantitative
criteria used to check whether planned changes have
taken place as intended.
• They (indicators) are designed to provide a standard
against which to measure or assess or even show the
success or progress of a programme against stated
targets
80.
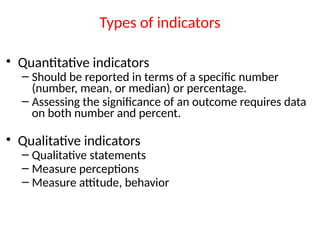
Types of indicators
•Quantitative indicators
– Should be reported in terms of a specific number
(number, mean, or median) or percentage.
– Assessing the significance of an outcome requires data
on both number and percent.
• Qualitative indicators
– Qualitative statements
– Measure perceptions
– Measure attitude, behavior
81.
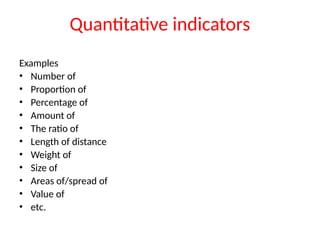
Quantitative indicators
Examples
• Numberof
• Proportion of
• Percentage of
• Amount of
• The ratio of
• Length of distance
• Weight of
• Size of
• Areas of/spread of
• Value of
• etc.
82.
Qualitative Indicators
Examples
• Levelof
• Presence of
• Evidence of
• Availability of
• Quality of
• Accessibility of
• Existence of
• Sustainability of
• Improvement of
• Ability to (e.g. skills)
• Potential of
• etc.