SlideShare a Scribd company logo
1 of 22
Download to read offline
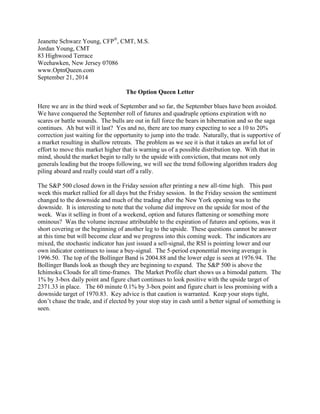
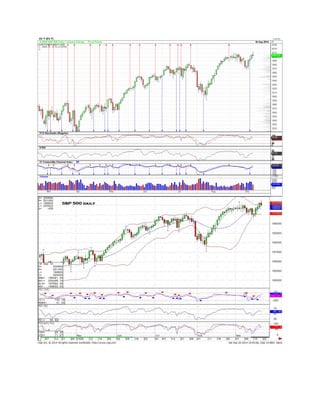
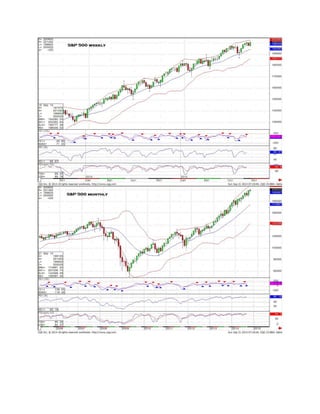
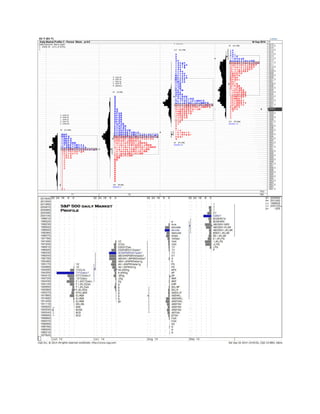
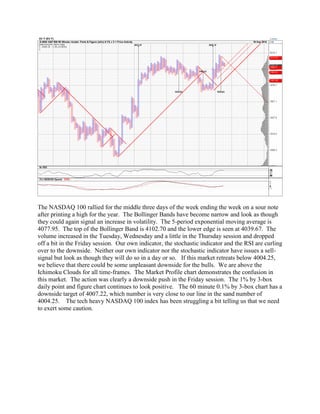
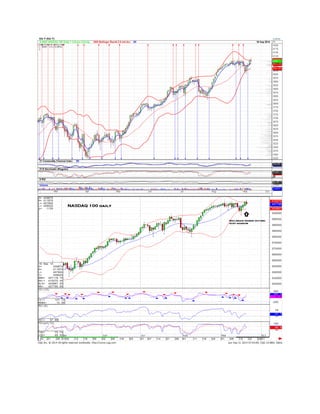
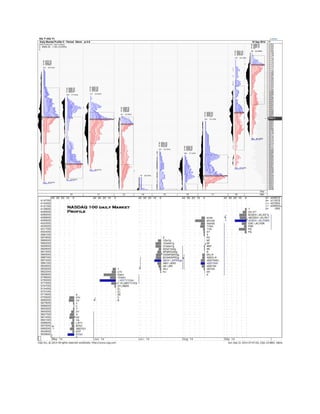
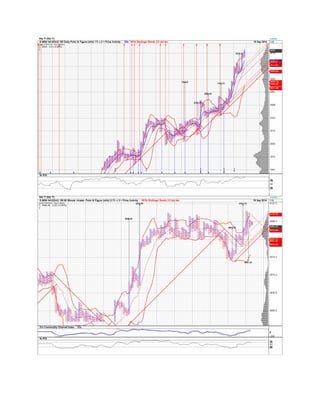
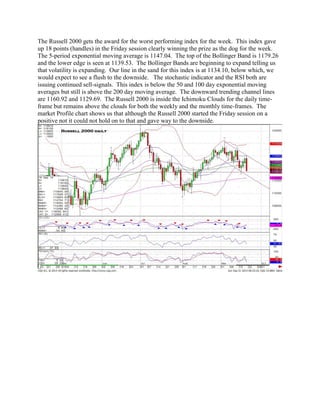
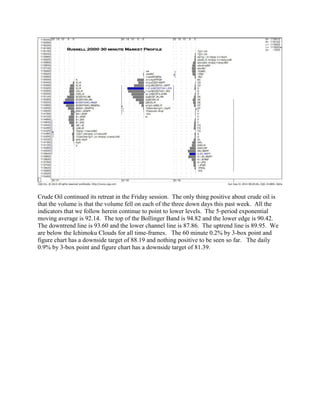
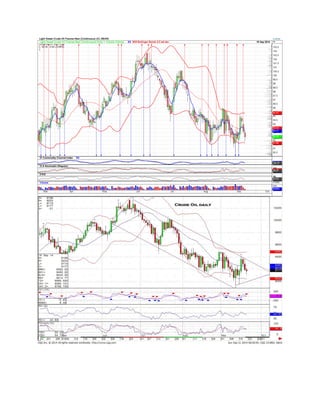
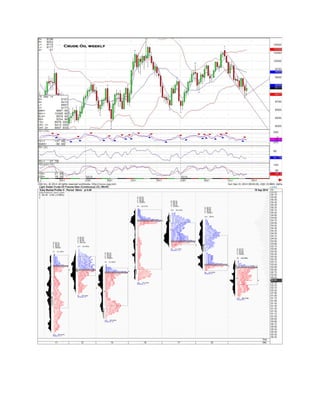
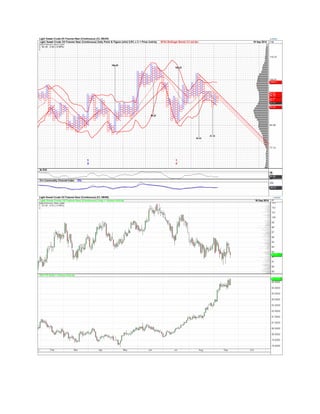
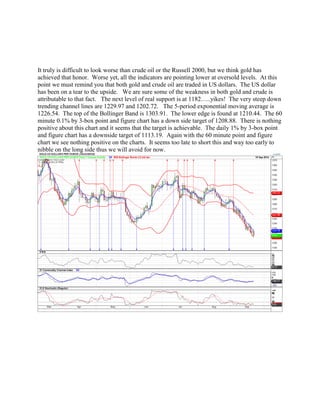
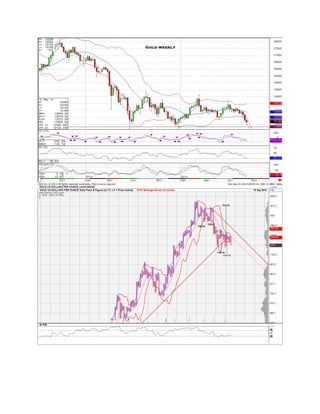
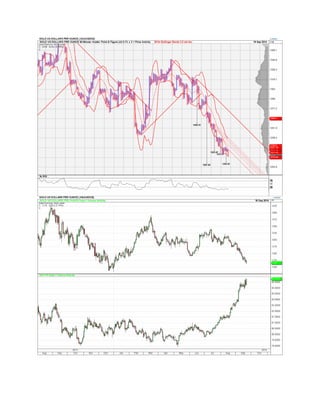
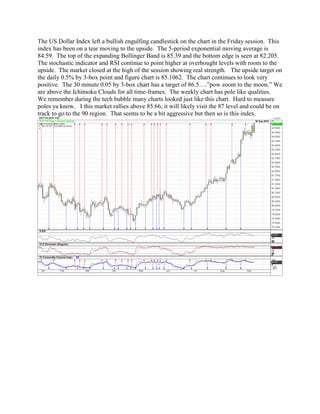
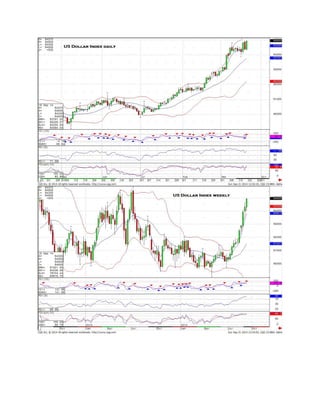
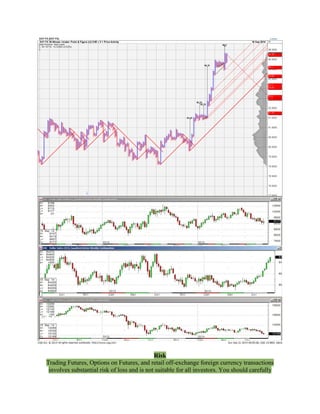
Jeanette Schwarz Young, CFP®, CMT, M.S. 
Jordan Young, CMT 
83 Highwood Terrace 
Weehawken, New Jersey 07086 
www.OptnQueen.com 
September 21, 2014 
The Option Queen Letter 
Here we are in the third week of September and so far, the September blues have been avoided. We have conquered the September roll of futures and quadruple options expiration with no scares or battle wounds. The bulls are out in full force the bears in hibernation and so the saga continues. Ah but will it last? Yes and no, there are too many expecting to see a 10 to 20% correction just waiting for the opportunity to jump into the trade. Naturally, that is supportive of a market resulting in shallow retreats. The problem as we see it is that it takes an awful lot of effort to move this market higher that is warning us of a possible distribution top. With that in mind, should the market begin to rally to the upside with conviction, that means not only generals leading but the troops following, we will see the trend following algorithm traders dog piling aboard and really could start off a rally. 
The S&P 500 closed down in the Friday session after printing a new all-time high. This past week this market rallied for all days but the Friday session. In the Friday session the sentiment changed to the downside and much of the trading after the New York opening was to the downside. It is interesting to note that the volume did improve on the upside for most of the week. Was it selling in front of a weekend, option and futures flattening or something more ominous? Was the volume increase attributable to the expiration of futures and options, was it short covering or the beginning of another leg to the upside. These questions cannot be answer at this time but will become clear and we progress into this coming week. The indicators are mixed, the stochastic indicator has just issued a sell-signal, the RSI is pointing lower and our own indicator continues to issue a buy-signal. The 5-period exponential moving average is 1996.50. The top of the Bollinger Band is 2004.88 and the lower edge is seen at 1976.94. The Bollinger Bands look as though they are beginning to expand. The S&P 500 is above the Ichimoku Clouds for all time-frames. The Market Profile chart shows us a bimodal pattern. The 1% by 3-box daily point and figure chart continues to look positive with the upside target of 2371.33 in place. The 60 minute 0.1% by 3-box point and figure chart is less promising with a downside target of 1970.83. Key advice is that caution is warranted. Keep your stops tight, don’t chase the trade, and if elected by your stop stay in cash until a better signal of something is seen.
The NASDAQ 100 rallied for the middle three days of the week ending the week on a sour note after printing a high for the year. The Bollinger Bands have become narrow and look as though they could again signal an increase in volatility. The 5-period exponential moving average is 4077.95. The top of the Bollinger Band is 4102.70 and the lower edge is seen at 4039.67. The volume increased in the Tuesday, Wednesday and a little in the Thursday session and dropped off a bit in the Friday session. Our own indicator, the stochastic indicator and the RSI are curling over to the downside. Neither our own indicator nor the stochastic indicator have issues a sell- signal but look as though they will do so in a day or so. If this market retreats below 4004.25, we believe that there could be some unpleasant downside for the bulls. We are above the Ichimoku Clouds for all time-frames. The Market Profile chart demonstrates the confusion in this market. The action was clearly a downside push in the Friday session. The 1% by 3-box daily point and figure chart continues to look positive. The 60 minute 0.1% by 3-box chart has a downside target of 4007.22, which number is very close to our line in the sand number of 4004.25. The tech heavy NASDAQ 100 index has been struggling a bit telling us that we need to exert some caution.
The Russell 2000 gets the award for the worst performing index for the week. This index gave up 18 points (handles) in the Friday session clearly winning the prize as the dog for the week. The 5-period exponential moving average is 1147.04. The top of the Bollinger Band is 1179.26 and the lower edge is seen at 1139.53. The Bollinger Bands are beginning to expand telling us that volatility is expanding. Our line in the sand for this index is at 1134.10, below which, we would expect to see a flush to the downside. The stochastic indicator and the RSI both are issuing continued sell-signals. This index is below the 50 and 100 day exponential moving averages but still is above the 200 day moving average. The downward trending channel lines are 1160.92 and 1129.69. The Russell 2000 is inside the Ichimoku Clouds for the daily time- frame but remains above the clouds for both the weekly and the monthly time-frames. The market Profile chart shows us that although the Russell 2000 started the Friday session on a positive not it could not hold on to that and gave way to the downside.
Crude Oil continued its retreat in the Friday session. The only thing positive about crude oil is that the volume is that the volume fell on each of the three down days this past week. All the indicators that we follow herein continue to point to lower levels. The 5-period exponential moving average is 92.14. The top of the Bollinger Band is 94.82 and the lower edge is 90.42. The downtrend line is 93.60 and the lower channel line is 87.86. The uptrend line is 89.95. We are below the Ichimoku Clouds for all time-frames. The 60 minute 0.2% by 3-box point and figure chart has a downside target of 88.19 and nothing positive to be seen so far. The daily 0.9% by 3-box point and figure chart has a downside target of 81.39.
It truly is difficult to look worse than crude oil or the Russell 2000, but we think gold has achieved that honor. Worse yet, all the indicators are pointing lower at oversold levels. At this point we must remind you that both gold and crude oil are traded in US dollars. The US dollar has been on a tear to the upside. We are sure some of the weakness in both gold and crude is attributable to that fact. The next level of real support is at 1182…..yikes! The very steep down trending channel lines are 1229.97 and 1202.72. The 5-period exponential moving average is 1226.54. The top of the Bollinger Band is 1303.91. The lower edge is found at 1210.44. The 60 minute 0.1% by 3-box point and figure chart has a down side target of 1208.88. There is nothing positive about this chart and it seems that the target is achievable. The daily 1% by 3-box point and figure chart has a downside target of 1113.19. Again with the 60 minute point and figure chart we see nothing positive on the charts. It seems too late to short this and way too early to nibble on the long side thus we will avoid for now.
The US Dollar Index left a bullish engulfing candlestick on the chart in the Friday session. This index has been on a tear moving to the upside. The 5-period exponential moving average is 84.59. The top of the expanding Bollinger Band is 85.39 and the bottom edge is seen at 82.205. The stochastic indicator and RSI continue to point higher at overbought levels with room to the upside. The market closed at the high of the session showing real strength. The upside target on the daily 0.5% by 3-box point and figure chart is 85.1062. The chart continues to look very positive. The 30 minute 0.05 by 3-box chart has a target of 86.5….”pow zoom to the moon.” We are above the Ichimoku Clouds for all time-frames. The weekly chart has pole like qualities. We remember during the tech bubble many charts looked just like this chart. Hard to measure poles ya know. I this market rallies above 85.66, it will likely visit the 87 level and could be on track to go to the 90 region. That seems to be a bit aggressive but then so is this index.
Risk Trading Futures, Options on Futures, and retail off-exchange foreign currency transactions involves substantial risk of loss and is not suitable for all investors. You should carefully
consider whether trading is suitable for you in light of your circumstances, knowledge, and financial resources. You may lose all or more of your initial investment.

More Related Content

What's hot

March 15, 2015 with charts
March 15, 2015 with chartsMarch 15, 2015 with charts
March 15, 2015 with chartsScutify
 
April 12, 2015
April 12, 2015April 12, 2015
April 12, 2015Scutify
 
October 18, 2015 with charts
October 18, 2015 with chartsOctober 18, 2015 with charts
October 18, 2015 with chartsScutify
 
January 18, 2015 with charts
January 18, 2015 with chartsJanuary 18, 2015 with charts
January 18, 2015 with chartsScutify
 
March 29, 2015 with charts
March 29, 2015 with chartsMarch 29, 2015 with charts
March 29, 2015 with chartsScutify
 
March 27, 2016.docx with charts
March 27, 2016.docx with chartsMarch 27, 2016.docx with charts
March 27, 2016.docx with chartsScutify
 
November 23, 2014 with charts
November 23, 2014 with chartsNovember 23, 2014 with charts
November 23, 2014 with chartsScutify
 
April 10, 2016
April 10, 2016April 10, 2016
April 10, 2016Scutify
 
April 24, 2016.docx with charts
April 24, 2016.docx with chartsApril 24, 2016.docx with charts
April 24, 2016.docx with chartsScutify
 
April 5, 2015 with charts
April 5, 2015 with chartsApril 5, 2015 with charts
April 5, 2015 with chartsScutify
 
October 19, 2014 with charts
October 19, 2014 with chartsOctober 19, 2014 with charts
October 19, 2014 with chartsScutify
 
Deceember 28,2015 with charts
Deceember 28,2015 with chartsDeceember 28,2015 with charts
Deceember 28,2015 with chartsScutify
 
February 14 2016.docx with charts
February 14 2016.docx with chartsFebruary 14 2016.docx with charts
February 14 2016.docx with chartsScutify
 
March 20, 2016.docx with charts
March 20, 2016.docx    with chartsMarch 20, 2016.docx    with charts
March 20, 2016.docx with chartsScutify
 
June 19, 2016.docx with charts
June 19, 2016.docx with chartsJune 19, 2016.docx with charts
June 19, 2016.docx with chartsScutify
 
December 14, 2015.docx with charts
December 14, 2015.docx with chartsDecember 14, 2015.docx with charts
December 14, 2015.docx with chartsScutify
 
November 22, 2015 with charts
November 22, 2015 with chartsNovember 22, 2015 with charts
November 22, 2015 with chartsScutify
 
May 15, 2016.docx with charts
May 15, 2016.docx with chartsMay 15, 2016.docx with charts
May 15, 2016.docx with chartsScutify
 
April 17, 2016.docx with charts jcy edits
April 17, 2016.docx with charts jcy editsApril 17, 2016.docx with charts jcy edits
April 17, 2016.docx with charts jcy editsScutify
 
May 22, 2016.docx edited
May 22, 2016.docx editedMay 22, 2016.docx edited
May 22, 2016.docx editedScutify
 

What's hot (20)

March 15, 2015 with charts
March 15, 2015 with chartsMarch 15, 2015 with charts
March 15, 2015 with charts
 
April 12, 2015
April 12, 2015April 12, 2015
April 12, 2015
 
October 18, 2015 with charts
October 18, 2015 with chartsOctober 18, 2015 with charts
October 18, 2015 with charts
 
January 18, 2015 with charts
January 18, 2015 with chartsJanuary 18, 2015 with charts
January 18, 2015 with charts
 
March 29, 2015 with charts
March 29, 2015 with chartsMarch 29, 2015 with charts
March 29, 2015 with charts
 
March 27, 2016.docx with charts
March 27, 2016.docx with chartsMarch 27, 2016.docx with charts
March 27, 2016.docx with charts
 
November 23, 2014 with charts
November 23, 2014 with chartsNovember 23, 2014 with charts
November 23, 2014 with charts
 
April 10, 2016
April 10, 2016April 10, 2016
April 10, 2016
 
April 24, 2016.docx with charts
April 24, 2016.docx with chartsApril 24, 2016.docx with charts
April 24, 2016.docx with charts
 
April 5, 2015 with charts
April 5, 2015 with chartsApril 5, 2015 with charts
April 5, 2015 with charts
 
October 19, 2014 with charts
October 19, 2014 with chartsOctober 19, 2014 with charts
October 19, 2014 with charts
 
Deceember 28,2015 with charts
Deceember 28,2015 with chartsDeceember 28,2015 with charts
Deceember 28,2015 with charts
 
February 14 2016.docx with charts
February 14 2016.docx with chartsFebruary 14 2016.docx with charts
February 14 2016.docx with charts
 
March 20, 2016.docx with charts
March 20, 2016.docx    with chartsMarch 20, 2016.docx    with charts
March 20, 2016.docx with charts
 
June 19, 2016.docx with charts
June 19, 2016.docx with chartsJune 19, 2016.docx with charts
June 19, 2016.docx with charts
 
December 14, 2015.docx with charts
December 14, 2015.docx with chartsDecember 14, 2015.docx with charts
December 14, 2015.docx with charts
 
November 22, 2015 with charts
November 22, 2015 with chartsNovember 22, 2015 with charts
November 22, 2015 with charts
 
May 15, 2016.docx with charts
May 15, 2016.docx with chartsMay 15, 2016.docx with charts
May 15, 2016.docx with charts
 
April 17, 2016.docx with charts jcy edits
April 17, 2016.docx with charts jcy editsApril 17, 2016.docx with charts jcy edits
April 17, 2016.docx with charts jcy edits
 
May 22, 2016.docx edited
May 22, 2016.docx editedMay 22, 2016.docx edited
May 22, 2016.docx edited
 

Viewers also liked

Gold weakens on Dollar strength
Gold weakens on Dollar strengthGold weakens on Dollar strength
Gold weakens on Dollar strengthScutify
 
Commsec 2014 Year in Review
Commsec 2014 Year in ReviewCommsec 2014 Year in Review
Commsec 2014 Year in ReviewScutify
 
Europe uneasy, gold and crude fall
Europe uneasy, gold and crude fallEurope uneasy, gold and crude fall
Europe uneasy, gold and crude fallScutify
 
E.I.I. Capital Q3CY2014 Technical Research
E.I.I. Capital Q3CY2014 Technical ResearchE.I.I. Capital Q3CY2014 Technical Research
E.I.I. Capital Q3CY2014 Technical ResearchScutify
 
September 28, 2014 with charts
September 28, 2014 with chartsSeptember 28, 2014 with charts
September 28, 2014 with chartsScutify
 
December 14, 2014 with charts
December 14, 2014 with chartsDecember 14, 2014 with charts
December 14, 2014 with chartsScutify
 
December 29, 2014 with charts
December 29, 2014 with chartsDecember 29, 2014 with charts
December 29, 2014 with chartsScutify
 

Viewers also liked (7)

Gold weakens on Dollar strength
Gold weakens on Dollar strengthGold weakens on Dollar strength
Gold weakens on Dollar strength
 
Commsec 2014 Year in Review
Commsec 2014 Year in ReviewCommsec 2014 Year in Review
Commsec 2014 Year in Review
 
Europe uneasy, gold and crude fall
Europe uneasy, gold and crude fallEurope uneasy, gold and crude fall
Europe uneasy, gold and crude fall
 
E.I.I. Capital Q3CY2014 Technical Research
E.I.I. Capital Q3CY2014 Technical ResearchE.I.I. Capital Q3CY2014 Technical Research
E.I.I. Capital Q3CY2014 Technical Research
 
September 28, 2014 with charts
September 28, 2014 with chartsSeptember 28, 2014 with charts
September 28, 2014 with charts
 
December 14, 2014 with charts
December 14, 2014 with chartsDecember 14, 2014 with charts
December 14, 2014 with charts
 
December 29, 2014 with charts
December 29, 2014 with chartsDecember 29, 2014 with charts
December 29, 2014 with charts
 

Similar to September 21, 2014 with charts

February 1, 2015 with charts
February 1, 2015 with chartsFebruary 1, 2015 with charts
February 1, 2015 with chartsScutify
 
January 24, 2015 with charts
January 24, 2015 with chartsJanuary 24, 2015 with charts
January 24, 2015 with chartsScutify
 
November 2, 2014 with charts
November 2, 2014 with chartsNovember 2, 2014 with charts
November 2, 2014 with chartsScutify
 
January 11, 2015 with charts
January 11, 2015 with chartsJanuary 11, 2015 with charts
January 11, 2015 with chartsScutify
 
July 24, 2016.docx with charts
July 24, 2016.docx with chartsJuly 24, 2016.docx with charts
July 24, 2016.docx with chartsScutify
 
November 9, 2014 with charts
November 9, 2014 with chartsNovember 9, 2014 with charts
November 9, 2014 with chartsScutify
 
January 10, 2016
January 10, 2016January 10, 2016
January 10, 2016Scutify
 
July 10, 2016.docx with charts
July 10, 2016.docx with chartsJuly 10, 2016.docx with charts
July 10, 2016.docx with chartsScutify
 
September 4, 2016.docx with charts
September 4, 2016.docx with chartsSeptember 4, 2016.docx with charts
September 4, 2016.docx with chartsScutify
 
May 1, 2016.docx with charts
May 1, 2016.docx with chartsMay 1, 2016.docx with charts
May 1, 2016.docx with chartsScutify
 
July 2, 2016.docx with charts
July 2, 2016.docx with chartsJuly 2, 2016.docx with charts
July 2, 2016.docx with chartsScutify
 

Similar to September 21, 2014 with charts (11)

February 1, 2015 with charts
February 1, 2015 with chartsFebruary 1, 2015 with charts
February 1, 2015 with charts
 
January 24, 2015 with charts
January 24, 2015 with chartsJanuary 24, 2015 with charts
January 24, 2015 with charts
 
November 2, 2014 with charts
November 2, 2014 with chartsNovember 2, 2014 with charts
November 2, 2014 with charts
 
January 11, 2015 with charts
January 11, 2015 with chartsJanuary 11, 2015 with charts
January 11, 2015 with charts
 
July 24, 2016.docx with charts
July 24, 2016.docx with chartsJuly 24, 2016.docx with charts
July 24, 2016.docx with charts
 
November 9, 2014 with charts
November 9, 2014 with chartsNovember 9, 2014 with charts
November 9, 2014 with charts
 
January 10, 2016
January 10, 2016January 10, 2016
January 10, 2016
 
July 10, 2016.docx with charts
July 10, 2016.docx with chartsJuly 10, 2016.docx with charts
July 10, 2016.docx with charts
 
September 4, 2016.docx with charts
September 4, 2016.docx with chartsSeptember 4, 2016.docx with charts
September 4, 2016.docx with charts
 
May 1, 2016.docx with charts
May 1, 2016.docx with chartsMay 1, 2016.docx with charts
May 1, 2016.docx with charts
 
July 2, 2016.docx with charts
July 2, 2016.docx with chartsJuly 2, 2016.docx with charts
July 2, 2016.docx with charts
 

Recently uploaded

Call Girls Navi Mumbai Just Call 9907093804 Top Class Call Girl Service Avail...
Call Girls Navi Mumbai Just Call 9907093804 Top Class Call Girl Service Avail...Call Girls Navi Mumbai Just Call 9907093804 Top Class Call Girl Service Avail...
Call Girls Navi Mumbai Just Call 9907093804 Top Class Call Girl Service Avail...Dipal Arora
 
Mondelez State of Snacking and Future Trends 2023
Mondelez State of Snacking and Future Trends 2023Mondelez State of Snacking and Future Trends 2023
Mondelez State of Snacking and Future Trends 2023Neil Kimberley
 
Call Girls in Gomti Nagar - 7388211116 - With room Service
Call Girls in Gomti Nagar - 7388211116  - With room ServiceCall Girls in Gomti Nagar - 7388211116  - With room Service
Call Girls in Gomti Nagar - 7388211116 - With room Servicediscovermytutordmt
 
Call Girls Hebbal Just Call 👗 7737669865 👗 Top Class Call Girl Service Bangalore
Call Girls Hebbal Just Call 👗 7737669865 👗 Top Class Call Girl Service BangaloreCall Girls Hebbal Just Call 👗 7737669865 👗 Top Class Call Girl Service Bangalore
Call Girls Hebbal Just Call 👗 7737669865 👗 Top Class Call Girl Service Bangaloreamitlee9823
 
A DAY IN THE LIFE OF A SALESMAN / WOMAN
A DAY IN THE LIFE OF A  SALESMAN / WOMANA DAY IN THE LIFE OF A  SALESMAN / WOMAN
A DAY IN THE LIFE OF A SALESMAN / WOMANIlamathiKannappan
 
Call Girls In Panjim North Goa 9971646499 Genuine Service
Call Girls In Panjim North Goa 9971646499 Genuine ServiceCall Girls In Panjim North Goa 9971646499 Genuine Service
Call Girls In Panjim North Goa 9971646499 Genuine Serviceritikaroy0888
 
FULL ENJOY Call Girls In Majnu Ka Tilla, Delhi Contact Us 8377877756
FULL ENJOY Call Girls In Majnu Ka Tilla, Delhi Contact Us 8377877756FULL ENJOY Call Girls In Majnu Ka Tilla, Delhi Contact Us 8377877756
FULL ENJOY Call Girls In Majnu Ka Tilla, Delhi Contact Us 8377877756dollysharma2066
 
RSA Conference Exhibitor List 2024 - Exhibitors Data
RSA Conference Exhibitor List 2024 - Exhibitors DataRSA Conference Exhibitor List 2024 - Exhibitors Data
RSA Conference Exhibitor List 2024 - Exhibitors DataExhibitors Data
 
M.C Lodges -- Guest House in Jhang.
M.C Lodges --  Guest House in Jhang.M.C Lodges --  Guest House in Jhang.
M.C Lodges -- Guest House in Jhang.Aaiza Hassan
 
B.COM Unit – 4 ( CORPORATE SOCIAL RESPONSIBILITY ( CSR ).pptx
B.COM Unit – 4 ( CORPORATE SOCIAL RESPONSIBILITY ( CSR ).pptxB.COM Unit – 4 ( CORPORATE SOCIAL RESPONSIBILITY ( CSR ).pptx
B.COM Unit – 4 ( CORPORATE SOCIAL RESPONSIBILITY ( CSR ).pptxpriyanshujha201
 
How to Get Started in Social Media for Art League City
How to Get Started in Social Media for Art League CityHow to Get Started in Social Media for Art League City
How to Get Started in Social Media for Art League CityEric T. Tung
 
Insurers' journeys to build a mastery in the IoT usage
Insurers' journeys to build a mastery in the IoT usageInsurers' journeys to build a mastery in the IoT usage
Insurers' journeys to build a mastery in the IoT usageMatteo Carbone
 
Cracking the Cultural Competence Code.pptx
Cracking the Cultural Competence Code.pptxCracking the Cultural Competence Code.pptx
Cracking the Cultural Competence Code.pptxWorkforce Group
 
The Path to Product Excellence: Avoiding Common Pitfalls and Enhancing Commun...
The Path to Product Excellence: Avoiding Common Pitfalls and Enhancing Commun...The Path to Product Excellence: Avoiding Common Pitfalls and Enhancing Commun...
The Path to Product Excellence: Avoiding Common Pitfalls and Enhancing Commun...Aggregage
 
HONOR Veterans Event Keynote by Michael Hawkins
HONOR Veterans Event Keynote by Michael HawkinsHONOR Veterans Event Keynote by Michael Hawkins
HONOR Veterans Event Keynote by Michael HawkinsMichael W. Hawkins
 
VIP Call Girls In Saharaganj ( Lucknow ) 🔝 8923113531 🔝 Cash Payment (COD) 👒
VIP Call Girls In Saharaganj ( Lucknow  ) 🔝 8923113531 🔝  Cash Payment (COD) 👒VIP Call Girls In Saharaganj ( Lucknow  ) 🔝 8923113531 🔝  Cash Payment (COD) 👒
VIP Call Girls In Saharaganj ( Lucknow ) 🔝 8923113531 🔝 Cash Payment (COD) 👒anilsa9823
 
Call Girls Pune Just Call 9907093804 Top Class Call Girl Service Available
Call Girls Pune Just Call 9907093804 Top Class Call Girl Service AvailableCall Girls Pune Just Call 9907093804 Top Class Call Girl Service Available
Call Girls Pune Just Call 9907093804 Top Class Call Girl Service AvailableDipal Arora
 
Regression analysis: Simple Linear Regression Multiple Linear Regression
Regression analysis:  Simple Linear Regression Multiple Linear RegressionRegression analysis:  Simple Linear Regression Multiple Linear Regression
Regression analysis: Simple Linear Regression Multiple Linear RegressionRavindra Nath Shukla
 
7.pdf This presentation captures many uses and the significance of the number...
7.pdf This presentation captures many uses and the significance of the number...7.pdf This presentation captures many uses and the significance of the number...
7.pdf This presentation captures many uses and the significance of the number...Paul Menig
 

Recently uploaded (20)

Call Girls Navi Mumbai Just Call 9907093804 Top Class Call Girl Service Avail...
Call Girls Navi Mumbai Just Call 9907093804 Top Class Call Girl Service Avail...Call Girls Navi Mumbai Just Call 9907093804 Top Class Call Girl Service Avail...
Call Girls Navi Mumbai Just Call 9907093804 Top Class Call Girl Service Avail...
 
Mondelez State of Snacking and Future Trends 2023
Mondelez State of Snacking and Future Trends 2023Mondelez State of Snacking and Future Trends 2023
Mondelez State of Snacking and Future Trends 2023
 
Call Girls in Gomti Nagar - 7388211116 - With room Service
Call Girls in Gomti Nagar - 7388211116  - With room ServiceCall Girls in Gomti Nagar - 7388211116  - With room Service
Call Girls in Gomti Nagar - 7388211116 - With room Service
 
Call Girls Hebbal Just Call 👗 7737669865 👗 Top Class Call Girl Service Bangalore
Call Girls Hebbal Just Call 👗 7737669865 👗 Top Class Call Girl Service BangaloreCall Girls Hebbal Just Call 👗 7737669865 👗 Top Class Call Girl Service Bangalore
Call Girls Hebbal Just Call 👗 7737669865 👗 Top Class Call Girl Service Bangalore
 
A DAY IN THE LIFE OF A SALESMAN / WOMAN
A DAY IN THE LIFE OF A  SALESMAN / WOMANA DAY IN THE LIFE OF A  SALESMAN / WOMAN
A DAY IN THE LIFE OF A SALESMAN / WOMAN
 
Call Girls In Panjim North Goa 9971646499 Genuine Service
Call Girls In Panjim North Goa 9971646499 Genuine ServiceCall Girls In Panjim North Goa 9971646499 Genuine Service
Call Girls In Panjim North Goa 9971646499 Genuine Service
 
FULL ENJOY Call Girls In Majnu Ka Tilla, Delhi Contact Us 8377877756
FULL ENJOY Call Girls In Majnu Ka Tilla, Delhi Contact Us 8377877756FULL ENJOY Call Girls In Majnu Ka Tilla, Delhi Contact Us 8377877756
FULL ENJOY Call Girls In Majnu Ka Tilla, Delhi Contact Us 8377877756
 
RSA Conference Exhibitor List 2024 - Exhibitors Data
RSA Conference Exhibitor List 2024 - Exhibitors DataRSA Conference Exhibitor List 2024 - Exhibitors Data
RSA Conference Exhibitor List 2024 - Exhibitors Data
 
Mifty kit IN Salmiya (+918133066128) Abortion pills IN Salmiyah Cytotec pills
Mifty kit IN Salmiya (+918133066128) Abortion pills IN Salmiyah Cytotec pillsMifty kit IN Salmiya (+918133066128) Abortion pills IN Salmiyah Cytotec pills
Mifty kit IN Salmiya (+918133066128) Abortion pills IN Salmiyah Cytotec pills
 
M.C Lodges -- Guest House in Jhang.
M.C Lodges --  Guest House in Jhang.M.C Lodges --  Guest House in Jhang.
M.C Lodges -- Guest House in Jhang.
 
B.COM Unit – 4 ( CORPORATE SOCIAL RESPONSIBILITY ( CSR ).pptx
B.COM Unit – 4 ( CORPORATE SOCIAL RESPONSIBILITY ( CSR ).pptxB.COM Unit – 4 ( CORPORATE SOCIAL RESPONSIBILITY ( CSR ).pptx
B.COM Unit – 4 ( CORPORATE SOCIAL RESPONSIBILITY ( CSR ).pptx
 
How to Get Started in Social Media for Art League City
How to Get Started in Social Media for Art League CityHow to Get Started in Social Media for Art League City
How to Get Started in Social Media for Art League City
 
Insurers' journeys to build a mastery in the IoT usage
Insurers' journeys to build a mastery in the IoT usageInsurers' journeys to build a mastery in the IoT usage
Insurers' journeys to build a mastery in the IoT usage
 
Cracking the Cultural Competence Code.pptx
Cracking the Cultural Competence Code.pptxCracking the Cultural Competence Code.pptx
Cracking the Cultural Competence Code.pptx
 
The Path to Product Excellence: Avoiding Common Pitfalls and Enhancing Commun...
The Path to Product Excellence: Avoiding Common Pitfalls and Enhancing Commun...The Path to Product Excellence: Avoiding Common Pitfalls and Enhancing Commun...
The Path to Product Excellence: Avoiding Common Pitfalls and Enhancing Commun...
 
HONOR Veterans Event Keynote by Michael Hawkins
HONOR Veterans Event Keynote by Michael HawkinsHONOR Veterans Event Keynote by Michael Hawkins
HONOR Veterans Event Keynote by Michael Hawkins
 
VIP Call Girls In Saharaganj ( Lucknow ) 🔝 8923113531 🔝 Cash Payment (COD) 👒
VIP Call Girls In Saharaganj ( Lucknow  ) 🔝 8923113531 🔝  Cash Payment (COD) 👒VIP Call Girls In Saharaganj ( Lucknow  ) 🔝 8923113531 🔝  Cash Payment (COD) 👒
VIP Call Girls In Saharaganj ( Lucknow ) 🔝 8923113531 🔝 Cash Payment (COD) 👒
 
Call Girls Pune Just Call 9907093804 Top Class Call Girl Service Available
Call Girls Pune Just Call 9907093804 Top Class Call Girl Service AvailableCall Girls Pune Just Call 9907093804 Top Class Call Girl Service Available
Call Girls Pune Just Call 9907093804 Top Class Call Girl Service Available
 
Regression analysis: Simple Linear Regression Multiple Linear Regression
Regression analysis:  Simple Linear Regression Multiple Linear RegressionRegression analysis:  Simple Linear Regression Multiple Linear Regression
Regression analysis: Simple Linear Regression Multiple Linear Regression
 
7.pdf This presentation captures many uses and the significance of the number...
7.pdf This presentation captures many uses and the significance of the number...7.pdf This presentation captures many uses and the significance of the number...
7.pdf This presentation captures many uses and the significance of the number...
 

September 21, 2014 with charts

  • 1. Jeanette Schwarz Young, CFP®, CMT, M.S. Jordan Young, CMT 83 Highwood Terrace Weehawken, New Jersey 07086 www.OptnQueen.com September 21, 2014 The Option Queen Letter Here we are in the third week of September and so far, the September blues have been avoided. We have conquered the September roll of futures and quadruple options expiration with no scares or battle wounds. The bulls are out in full force the bears in hibernation and so the saga continues. Ah but will it last? Yes and no, there are too many expecting to see a 10 to 20% correction just waiting for the opportunity to jump into the trade. Naturally, that is supportive of a market resulting in shallow retreats. The problem as we see it is that it takes an awful lot of effort to move this market higher that is warning us of a possible distribution top. With that in mind, should the market begin to rally to the upside with conviction, that means not only generals leading but the troops following, we will see the trend following algorithm traders dog piling aboard and really could start off a rally. The S&P 500 closed down in the Friday session after printing a new all-time high. This past week this market rallied for all days but the Friday session. In the Friday session the sentiment changed to the downside and much of the trading after the New York opening was to the downside. It is interesting to note that the volume did improve on the upside for most of the week. Was it selling in front of a weekend, option and futures flattening or something more ominous? Was the volume increase attributable to the expiration of futures and options, was it short covering or the beginning of another leg to the upside. These questions cannot be answer at this time but will become clear and we progress into this coming week. The indicators are mixed, the stochastic indicator has just issued a sell-signal, the RSI is pointing lower and our own indicator continues to issue a buy-signal. The 5-period exponential moving average is 1996.50. The top of the Bollinger Band is 2004.88 and the lower edge is seen at 1976.94. The Bollinger Bands look as though they are beginning to expand. The S&P 500 is above the Ichimoku Clouds for all time-frames. The Market Profile chart shows us a bimodal pattern. The 1% by 3-box daily point and figure chart continues to look positive with the upside target of 2371.33 in place. The 60 minute 0.1% by 3-box point and figure chart is less promising with a downside target of 1970.83. Key advice is that caution is warranted. Keep your stops tight, don’t chase the trade, and if elected by your stop stay in cash until a better signal of something is seen.
  • 2.
  • 3.
  • 4.
  • 5. The NASDAQ 100 rallied for the middle three days of the week ending the week on a sour note after printing a high for the year. The Bollinger Bands have become narrow and look as though they could again signal an increase in volatility. The 5-period exponential moving average is 4077.95. The top of the Bollinger Band is 4102.70 and the lower edge is seen at 4039.67. The volume increased in the Tuesday, Wednesday and a little in the Thursday session and dropped off a bit in the Friday session. Our own indicator, the stochastic indicator and the RSI are curling over to the downside. Neither our own indicator nor the stochastic indicator have issues a sell- signal but look as though they will do so in a day or so. If this market retreats below 4004.25, we believe that there could be some unpleasant downside for the bulls. We are above the Ichimoku Clouds for all time-frames. The Market Profile chart demonstrates the confusion in this market. The action was clearly a downside push in the Friday session. The 1% by 3-box daily point and figure chart continues to look positive. The 60 minute 0.1% by 3-box chart has a downside target of 4007.22, which number is very close to our line in the sand number of 4004.25. The tech heavy NASDAQ 100 index has been struggling a bit telling us that we need to exert some caution.
  • 6.
  • 7.
  • 8.
  • 9. The Russell 2000 gets the award for the worst performing index for the week. This index gave up 18 points (handles) in the Friday session clearly winning the prize as the dog for the week. The 5-period exponential moving average is 1147.04. The top of the Bollinger Band is 1179.26 and the lower edge is seen at 1139.53. The Bollinger Bands are beginning to expand telling us that volatility is expanding. Our line in the sand for this index is at 1134.10, below which, we would expect to see a flush to the downside. The stochastic indicator and the RSI both are issuing continued sell-signals. This index is below the 50 and 100 day exponential moving averages but still is above the 200 day moving average. The downward trending channel lines are 1160.92 and 1129.69. The Russell 2000 is inside the Ichimoku Clouds for the daily time- frame but remains above the clouds for both the weekly and the monthly time-frames. The market Profile chart shows us that although the Russell 2000 started the Friday session on a positive not it could not hold on to that and gave way to the downside.
  • 10. Crude Oil continued its retreat in the Friday session. The only thing positive about crude oil is that the volume is that the volume fell on each of the three down days this past week. All the indicators that we follow herein continue to point to lower levels. The 5-period exponential moving average is 92.14. The top of the Bollinger Band is 94.82 and the lower edge is 90.42. The downtrend line is 93.60 and the lower channel line is 87.86. The uptrend line is 89.95. We are below the Ichimoku Clouds for all time-frames. The 60 minute 0.2% by 3-box point and figure chart has a downside target of 88.19 and nothing positive to be seen so far. The daily 0.9% by 3-box point and figure chart has a downside target of 81.39.
  • 11.
  • 12.
  • 13.
  • 14. It truly is difficult to look worse than crude oil or the Russell 2000, but we think gold has achieved that honor. Worse yet, all the indicators are pointing lower at oversold levels. At this point we must remind you that both gold and crude oil are traded in US dollars. The US dollar has been on a tear to the upside. We are sure some of the weakness in both gold and crude is attributable to that fact. The next level of real support is at 1182…..yikes! The very steep down trending channel lines are 1229.97 and 1202.72. The 5-period exponential moving average is 1226.54. The top of the Bollinger Band is 1303.91. The lower edge is found at 1210.44. The 60 minute 0.1% by 3-box point and figure chart has a down side target of 1208.88. There is nothing positive about this chart and it seems that the target is achievable. The daily 1% by 3-box point and figure chart has a downside target of 1113.19. Again with the 60 minute point and figure chart we see nothing positive on the charts. It seems too late to short this and way too early to nibble on the long side thus we will avoid for now.
  • 15.
  • 16.
  • 17. The US Dollar Index left a bullish engulfing candlestick on the chart in the Friday session. This index has been on a tear moving to the upside. The 5-period exponential moving average is 84.59. The top of the expanding Bollinger Band is 85.39 and the bottom edge is seen at 82.205. The stochastic indicator and RSI continue to point higher at overbought levels with room to the upside. The market closed at the high of the session showing real strength. The upside target on the daily 0.5% by 3-box point and figure chart is 85.1062. The chart continues to look very positive. The 30 minute 0.05 by 3-box chart has a target of 86.5….”pow zoom to the moon.” We are above the Ichimoku Clouds for all time-frames. The weekly chart has pole like qualities. We remember during the tech bubble many charts looked just like this chart. Hard to measure poles ya know. I this market rallies above 85.66, it will likely visit the 87 level and could be on track to go to the 90 region. That seems to be a bit aggressive but then so is this index.
  • 18.
  • 19.
  • 20.
  • 21. Risk Trading Futures, Options on Futures, and retail off-exchange foreign currency transactions involves substantial risk of loss and is not suitable for all investors. You should carefully
  • 22. consider whether trading is suitable for you in light of your circumstances, knowledge, and financial resources. You may lose all or more of your initial investment.