Download to read offline
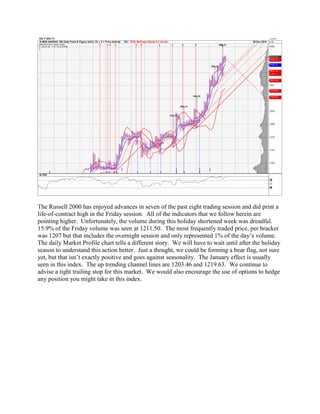
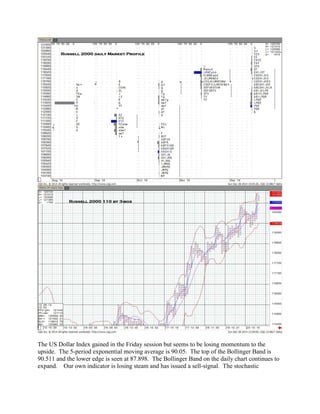
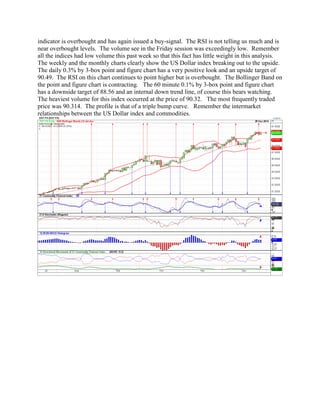
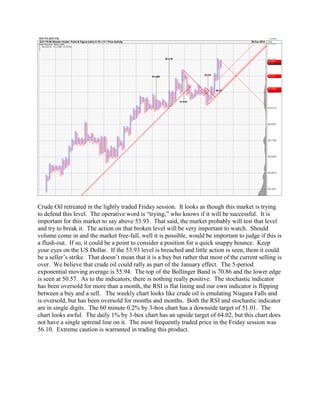

The document discusses the current state of the economy, critiquing the Federal Reserve's policies for favoring banks and corporations over the middle class, leading to a lack of disposable income for average workers. It notes the benefits of lower crude oil prices for consumer spending and warns of potential job losses in the energy sector due to these prices. Financial markets are experiencing low volume and a loss of momentum, suggesting caution in trading strategies while highlighting the importance of monitoring key economic indicators.


