Download to read offline
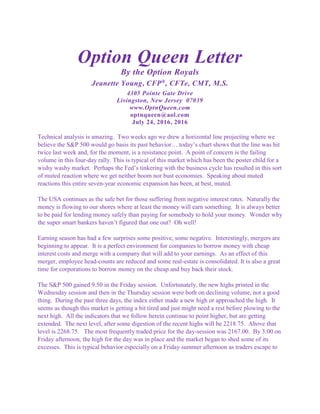
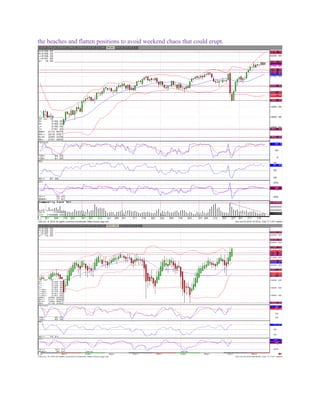
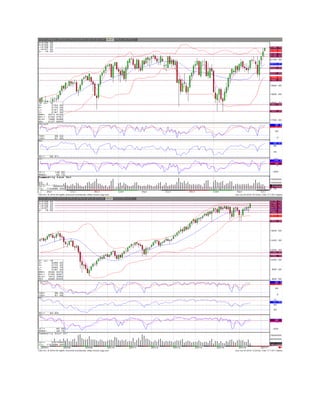
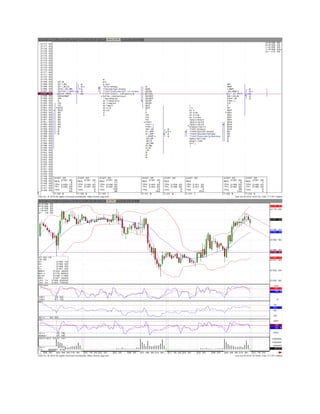
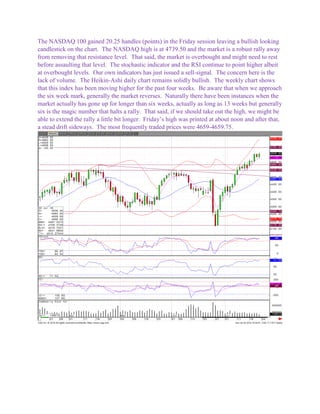
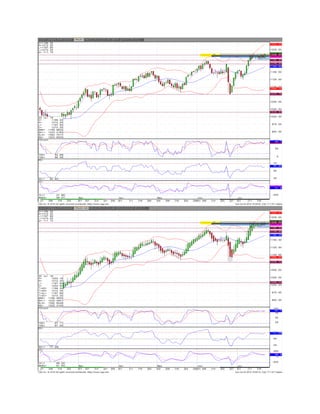
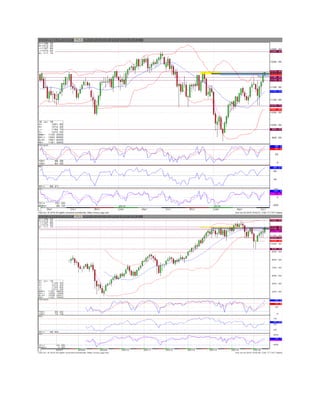
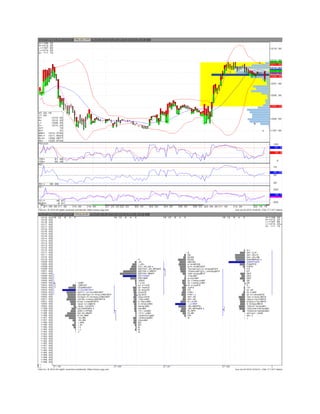
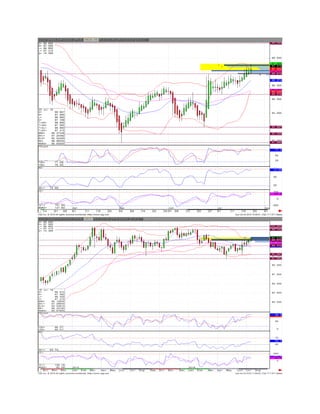
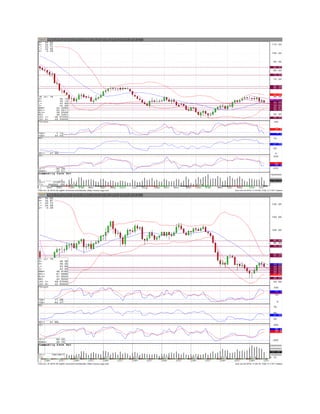
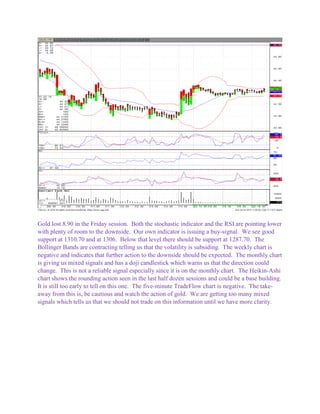

- The S&P 500 hit a resistance level twice last week according to a horizontal line drawn based on past behavior, but volume is declining in the recent four-day rally, which is typical of the wishy-washy market. - Earnings season has had some positive and negative surprises, and mergers are beginning to appear as companies take advantage of cheap borrowing costs. - Most indexes gained on Friday but volume was low on some new highs, a sign the market may need rest before further gains, though indicators still point higher overall. Gold and oil retreated as the dollar rallied.


