The document discusses SemGroup's second quarter 2017 results and HFOTCO acquisition. Key points include:
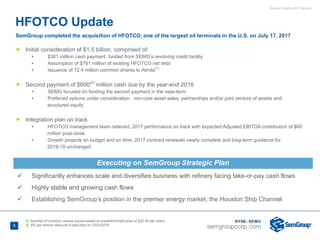
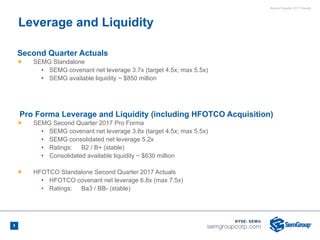
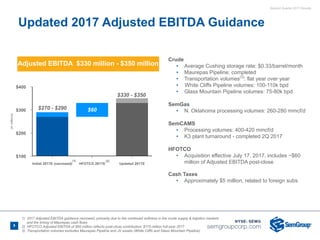
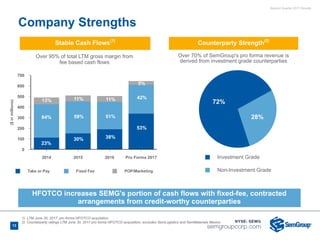
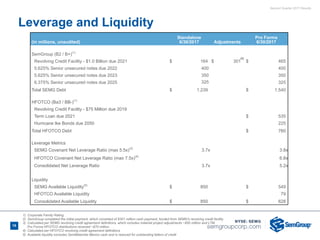
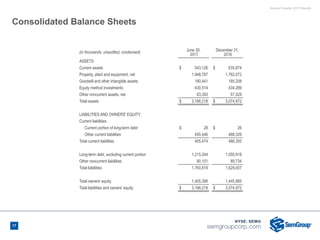
- SemGroup completed its acquisition of HFOTCO in July 2017 for initial consideration of $1.5 billion including cash, debt assumption, and shares issued. A second $600 million cash payment is due by end of 2018.
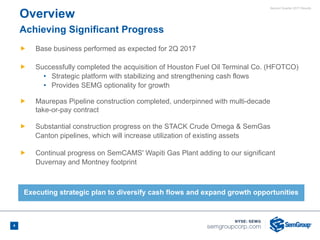
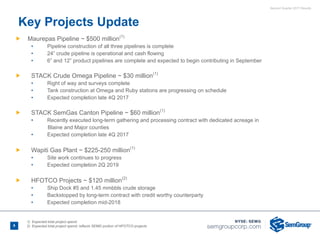
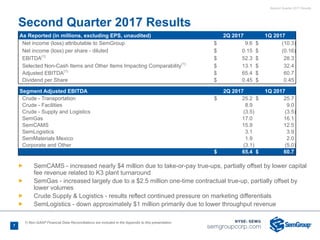
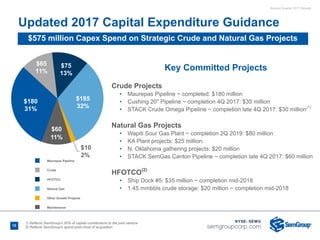
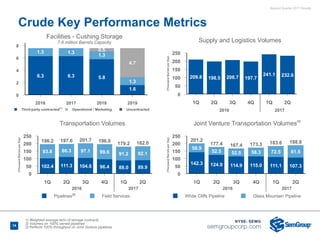
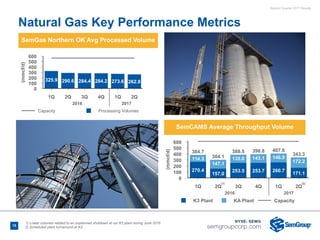
- Base business performed as expected in Q2 2017. Several new pipeline projects were completed or are under construction to expand infrastructure.
- SemGroup is focused on funding the second HFOTCO payment through options like asset sales, partnerships, or equity offerings. Integration of HFOTCO is proceeding as planned.
This document provides an investor presentation for SemGroup's second quarter 2017 results. It discusses SemGroup's non-GAAP financial measure of Adjusted EBITDA, noting that it excludes certain items to increase comparability between reporting periods. It also contains forward-looking statements regarding SemGroup's prospects, financial performance, annual dividend growth, and other matters. Finally, it outlines SemGroup's strategy of transforming into a diversified energy infrastructure company through acquisitions in the Gulf Coast, STACK play, and Duvernay/Montney regions to generate stable cash flows under contracts with investment-grade counterparties.
The document provides an overview of SemGroup's non-GAAP financial measure of Adjusted EBITDA. It explains that Adjusted EBITDA excludes certain non-cash and selected items in order to increase comparability between reporting periods and is used by management for internal analysis. However, readers should be aware that variations in operating results are also caused by numerous other factors not adjusted for. The document also contains forward-looking statements regarding SemGroup's strategic focus and expectations.
This document discusses SemGroup's non-GAAP financial measure of Adjusted EBITDA. It explains that Adjusted EBITDA excludes certain non-cash and other selected items in order to increase comparability between reporting periods. It also notes that SemGroup does not provide guidance for net income due to non-cash items that cannot be accurately forecasted. Additionally, the document contains forward-looking statements regarding SemGroup's prospects, financial performance, annual dividend growth, capital expenditures, and other matters.
- EnLink Midstream reported financial and operational results for the second quarter of 2017, delivering earnings and volume growth. Adjusted EBITDA was $209.7 million, up from $207.6 million in the previous quarter.
- Volume growth across their assets in key basins like the Permian Basin, Central Oklahoma and Louisiana was driven by ongoing drilling and completion activity from producers like Devon Energy.
- Rigs counts have remained consistent in EnLink's core basins, and existing well inventory is expected to support volume growth through 2017 to meet guidance targets.
This document contains an investor presentation for Crestwood Midstream Partners LP and Crestwood Equity Partners LP. The presentation highlights the companies' diversified portfolio of midstream assets across major US basins, including the Bakken, Delaware Basin, PRB Niobrara, and Marcellus. Over 85% of forecasted 2017 EBITDA is supported by take-or-pay or fixed-fee contracts with investment grade customers. The presentation outlines Crestwood's organic growth strategy through 2018-2021 focused on high-return expansion projects around its core assets to drive distributable cash flow per unit growth.
This document provides an overview of SemGroup's non-GAAP financial measures, forward-looking statements, and strategy for creating shareholder value. It discusses SemGroup's stable cash flows derived from long-term contracts and investment-grade counterparties. The presentation also outlines SemGroup's crude oil and natural gas assets located in key North American basins and its strategy to pursue organic growth and strategic acquisitions.
This document provides an investor presentation for SemGroup's second quarter 2017 results. It discusses SemGroup's non-GAAP financial measure of Adjusted EBITDA, noting that it excludes certain items to increase comparability between reporting periods. It also contains forward-looking statements regarding SemGroup's prospects, financial performance, annual dividend growth, and other matters. Finally, it outlines SemGroup's strategy of transforming into a diversified energy infrastructure company through acquisitions in the Gulf Coast, STACK play, and Duvernay/Montney regions to generate stable cash flows under contracts with investment-grade counterparties.
- SemGroup reported a 40% increase in Adjusted EBITDA for the third quarter compared to the second quarter due to the Maurepas Pipeline becoming fully operational and the acquisition of HFOTCO commencing in mid-July.
- SemGroup's strategic focus is on growing EBITDA through increased secure cash flows from core geographic regions like Canada, the Mid-Continent region, and the Gulf Coast.
- SemGroup is making progress on raising the $600 million needed for the second payment for the HFOTCO acquisition, with plans to fully pay by the end of the first quarter of 2018 to capture an early payment discount, including through the sale of its interest in the Glass Mountain Pipeline for $
This document provides an investor presentation for SemGroup's second quarter 2017 results. It discusses SemGroup's non-GAAP financial measure of Adjusted EBITDA, noting that it excludes certain items to increase comparability between reporting periods. It also contains forward-looking statements regarding SemGroup's prospects, financial performance, annual dividend growth, and other matters. Finally, it outlines SemGroup's strategy of transforming into a diversified energy infrastructure company through acquisitions in the Gulf Coast, STACK play, and Duvernay/Montney regions to generate stable cash flows under contracts with investment-grade counterparties.
The document provides an overview of SemGroup's non-GAAP financial measure of Adjusted EBITDA. It explains that Adjusted EBITDA excludes certain non-cash and selected items in order to increase comparability between reporting periods and is used by management for internal analysis. However, readers should be aware that variations in operating results are also caused by numerous other factors not adjusted for. The document also contains forward-looking statements regarding SemGroup's strategic focus and expectations.
This document discusses SemGroup's non-GAAP financial measure of Adjusted EBITDA. It explains that Adjusted EBITDA excludes certain non-cash and other selected items in order to increase comparability between reporting periods. It also notes that SemGroup does not provide guidance for net income due to non-cash items that cannot be accurately forecasted. Additionally, the document contains forward-looking statements regarding SemGroup's prospects, financial performance, annual dividend growth, capital expenditures, and other matters.
- EnLink Midstream reported financial and operational results for the second quarter of 2017, delivering earnings and volume growth. Adjusted EBITDA was $209.7 million, up from $207.6 million in the previous quarter.
- Volume growth across their assets in key basins like the Permian Basin, Central Oklahoma and Louisiana was driven by ongoing drilling and completion activity from producers like Devon Energy.
- Rigs counts have remained consistent in EnLink's core basins, and existing well inventory is expected to support volume growth through 2017 to meet guidance targets.
This document contains an investor presentation for Crestwood Midstream Partners LP and Crestwood Equity Partners LP. The presentation highlights the companies' diversified portfolio of midstream assets across major US basins, including the Bakken, Delaware Basin, PRB Niobrara, and Marcellus. Over 85% of forecasted 2017 EBITDA is supported by take-or-pay or fixed-fee contracts with investment grade customers. The presentation outlines Crestwood's organic growth strategy through 2018-2021 focused on high-return expansion projects around its core assets to drive distributable cash flow per unit growth.
This document provides an overview of SemGroup's non-GAAP financial measures, forward-looking statements, and strategy for creating shareholder value. It discusses SemGroup's stable cash flows derived from long-term contracts and investment-grade counterparties. The presentation also outlines SemGroup's crude oil and natural gas assets located in key North American basins and its strategy to pursue organic growth and strategic acquisitions.
This document provides an investor presentation for SemGroup's second quarter 2017 results. It discusses SemGroup's non-GAAP financial measure of Adjusted EBITDA, noting that it excludes certain items to increase comparability between reporting periods. It also contains forward-looking statements regarding SemGroup's prospects, financial performance, annual dividend growth, and other matters. Finally, it outlines SemGroup's strategy of transforming into a diversified energy infrastructure company through acquisitions in the Gulf Coast, STACK play, and Duvernay/Montney regions to generate stable cash flows under contracts with investment-grade counterparties.
- SemGroup reported a 40% increase in Adjusted EBITDA for the third quarter compared to the second quarter due to the Maurepas Pipeline becoming fully operational and the acquisition of HFOTCO commencing in mid-July.
- SemGroup's strategic focus is on growing EBITDA through increased secure cash flows from core geographic regions like Canada, the Mid-Continent region, and the Gulf Coast.
- SemGroup is making progress on raising the $600 million needed for the second payment for the HFOTCO acquisition, with plans to fully pay by the end of the first quarter of 2018 to capture an early payment discount, including through the sale of its interest in the Glass Mountain Pipeline for $
Sem group announces hfotco acquisition final presentationSemGroupCorporation
SemGroup acquired Houston Fuel Oil Terminal Company (HFOTCO) for $1.5 billion initially, with a second $600 million payment due by end of 2018. HFOTCO owns 330 acres and 16.8 million barrels of storage on the Houston Ship Channel with connections to major pipelines and refineries. The acquisition enhances SemGroup's scale and diversification with take-or-pay contracts from investment-grade customers. Growth projects are expected to increase HFOTCO's adjusted EBITDA to $180-190 million by 2019.
- SemGroup reported third quarter 2016 results with Adjusted EBITDA of $71.3 million, down from $77.7 million in the first quarter of 2016. Net income was a loss of $7.4 million.
- For full year 2016, SemGroup updated capital expenditures guidance to $350 million, a $100 million reduction due to timing of the Maurepas pipeline project.
- SemGroup has a strong balance sheet with $1.1 billion in liquidity and a leverage ratio of 3.0x at the end of the third quarter, within its target leverage of below 4.5x.
SemGroup reported adjusted EBITDA of $60.7 million for the first quarter of 2017, down from $66.2 million in the fourth quarter of 2016. The Crude Facilities segment was down nearly $5 million due to the absence of a take-or-pay adjustment in the prior quarter. SemGroup reaffirmed its 2017 adjusted EBITDA guidance range of $270-310 million and expects its annualized fourth quarter 2017 adjusted EBITDA run rate to be between $325-340 million. Key growth projects including the Maurepas Pipeline and SemGas Canton Pipeline are on track for completion by the end of 2017.
Sem group investor presentation post 4Q and FY 2016 earnings finalSemGroupCorporation
This document discusses SemGroup's non-GAAP financial measure of Adjusted EBITDA and provides context around its use. It notes that Adjusted EBITDA excludes certain non-cash and other selected items in order to increase comparability between reporting periods. It also contains forward-looking statements regarding SemGroup's expectations for future financial performance and growth opportunities.
This document provides an investor presentation for Crestwood Midstream Partners LP and Crestwood Equity Partners LP. It highlights the companies' focus on execution of their growth strategy, commitment to a strong balance sheet and disciplined capital program. Specific projects highlighted include expansion of the Nautilus system in the Delaware Basin, Arrow Debottlenecking phases 1 and 2 in the Bakken, and the Orla processing plant and pipeline. These projects are expected to provide significant incremental annual cash flow of over $120 million by 2021.
This document provides an overview of Jefferies Energy Conference and includes forward-looking statements and notices about the presentation. It discusses EnLink Midstream's 3rd quarter 2016 financial highlights including refining their consolidated adjusted EBITDA guidance range to $760-790 million, achieving approximately $201 million in adjusted EBITDA before non-controlling interest for ENLK in 3Q16, and a debt ratio of approximately 3.75 times. It also includes notices about non-GAAP financial measures used and forward-looking statements.
- SemGroup reported a 40% increase in Adjusted EBITDA for the third quarter compared to the second quarter due to the Maurepas Pipeline becoming fully operational and the acquisition of HFOTCO commencing in mid-July.
- SemGroup's strategic focus is on growing EBITDA through increased secure cash flows from core geographic regions like Canada, the Mid-Continent region, and the Gulf Coast.
- SemGroup is making progress on raising the $600 million needed for the second payment for the HFOTCO acquisition, with plans to fully pay by the end of the first quarter of 2018 to capture an early payment discount, including through the sale of its interest in the Glass Mountain Pipeline for $
1) EnLink Midstream provides guidance for 2017 including adjusted EBITDA of $815-885 million and distributable cash flow of $590-650 million.
2) Capital expenditures are projected to be $590-750 million focused on growth projects in core areas like Central Oklahoma, Delaware Basin, and Louisiana.
3) Volume growth is expected across all segments, especially in Central Oklahoma where volumes are projected to increase 180% year-over-year.
This document provides an overview of SemGroup's non-GAAP financial measures and forward-looking statements. It summarizes SemGroup's 2017 results as a year of transition with the addition of stable refinery-facing assets and geographic diversification. It outlines 2018 as a year of executing the operating budget and strategic plan by streamlining operations and focusing on three high quality areas: Canada, Mid-Continent and Gulf Coast. The document also provides definitions of SemGroup's non-GAAP measures of Adjusted EBITDA and Total Segment Profit, which exclude certain items to improve comparability between reporting periods, and cautions that non-GAAP measures should not be considered in isolation.
This document provides an overview of SemGroup's non-GAAP financial measures, forward-looking statements, and strategic growth plan. It discusses SemGroup's Adjusted EBITDA measure and why certain items are excluded. It also notes key limitations of non-GAAP measures and that management compensates for these limitations. An overview is then provided of SemGroup's crude and natural gas assets, operations, and strategic growth areas. Key performance metrics and asset details are highlighted for SemGroup's crude and natural gas businesses.
This document provides an overview of SemGroup's non-GAAP financial measures and forward-looking statements. It defines Adjusted EBITDA and Total Segment Profit as non-GAAP measures used by management to evaluate performance that exclude certain items for comparability between periods. It also notes the limitations of non-GAAP measures and cautions readers. The document discloses risks to forward-looking statements and provides an overview of SemGroup's midstream assets in key regions.
Sunoco LP is a master limited partnership that operates retail and wholesale fuel and convenience store businesses across more than 30 states. The presentation discusses Sunoco LP's operations, acquisition history since 2014, geographic and business diversity, and financial metrics. It also notes that the partnership is announcing a strategic divestiture of its company-operated convenience stores in the continental US to 7-Eleven.
The document provides an operations report for February 14, 2017. It includes forward-looking statements about guidance, projections, and objectives that involve risks and uncertainties. It also discusses non-GAAP financial measures used by the company such as adjusted EBITDA and distributable cash flow. For 2016, the company delivered on its financial and operational priorities by outperforming its adjusted EBITDA guidance, meeting its capital expenditure targets, and achieving distribution coverage above 1.0x. ENLC also met its cash available for distribution guidance and distribution coverage targets for 2016.
SEMG and RRMS Report 4Q and Full Year ReslutsKiley Roberson
The document provides financial results and guidance for SemGroup Corporation and its subsidiary Rose Rock Midstream for the fourth quarter and full year 2015. Some key points:
- SemGroup adjusted EBITDA increased 6% in 2015 compared to 2014. Rose Rock adjusted EBITDA increased nearly 40%.
- 2016 adjusted EBITDA guidance provided for SemGroup of $270-320 million and for Rose Rock of $165-185 million.
- Capital expenditures of $522 million in 2015 were outlined, and 2016 capital expenditures guidance of $455 million was given.
The document is an investor presentation for SemGroup Corporation and Rose Rock Midstream for the first quarter of 2015. It provides an overview of the companies' operations, including natural gas and crude oil assets. SemGroup plans to invest $775 million in growth projects in 2015, with over 90% focused on expanding its natural gas gathering and processing facilities and crude oil infrastructure and storage assets. The presentation also highlights several new pipeline projects and facility expansions underway.
This investor presentation provides an overview of SemGroup Corporation and Rose Rock Midstream for the second quarter of 2015. It discusses forward-looking statements and non-GAAP financial measures. The presentation then summarizes the two companies' ownership structures and business strategies, focusing on generating quality cash flows through fee-based activities and pursuing organic and acquisition growth opportunities in crude and gas assets. Maps show the companies' assets in key shale basins like the DJ Basin.
- The document provides EnLink Midstream's 3rd quarter 2017 operations report, which summarizes financial and operational results and reaffirms guidance.
- EnLink reported adjusted EBITDA at the high end of guidance for 3Q17, driven by strong volume growth. Organic projects are expected to generate significant cash flow going forward.
- Volumes on gas gathering and processing systems grew substantially in key areas like the Permian Basin and Louisiana year-over-year and quarter-over-quarter.
This document provides an overview of Crestwood Midstream Partners LP and Crestwood Equity Partners LP. It highlights key investor information including recent financial results, growth projects, and commercial contracts. The document summarizes recent execution on projects in various regions, and outlines a backlog of announced growth projects through 2018 that are expected to generate over $30 million in incremental annual cash flow. These projects focus on the Bakken, Delaware Basin, and Marcellus regions.
The document provides an overview of OUTFRONT Media's assets and business model as a REIT. It details the company's primary asset types which include billboards, digital displays, posters, and transit assets. It also summarizes the company's top market locations and timeline of becoming a publicly-traded REIT after its split from CBS Corporation in 2014.
- SemGroup reported adjusted EBITDA of $60.7 million for the first quarter of 2017, down from $66.2 million in the fourth quarter of 2016.
- The Crude Facilities segment was down nearly $5 million due to the absence of a fourth quarter 2016 take-or-pay adjustment.
- SemGroup reaffirmed its 2017 adjusted EBITDA guidance range of $270-310 million and expects an annualized fourth quarter 2017 adjusted EBITDA run rate of $325-340 million.
SemGroup reported fourth quarter and full-year 2017 results. Key highlights include $111 million in Adjusted EBITDA for Q4 and $328 million for the full year. SemGroup also executed several strategic transactions including a $350 million preferred equity raise, selling its interest in Glass Mountain Pipeline for $300 million, and estimated proceeds of $140 million from selling SemMaterials Mexico and SemLogistics assets. SemGroup provided 2018 Adjusted EBITDA guidance of $385-$415 million and capital expenditures guidance of $40 million for maintenance spending.
This document provides an overview of SemGroup's non-GAAP financial measures and forward-looking statements. It discusses how SemGroup uses Adjusted EBITDA and Total Segment Profit to evaluate performance in addition to GAAP measures. It also notes that SemGroup's forward-looking statements are based on current expectations and are subject to risks and uncertainties. The document warns that actual results could differ materially from expectations.
This document provides an overview of SemGroup's non-GAAP financial measures, forward-looking statements, and strategy for creating shareholder value. It discusses SemGroup's stable cash flows derived from long-term contracts and investment-grade counterparties. The presentation also outlines SemGroup's crude oil and natural gas assets located in key North American basins and its strategy to pursue organic growth and strategic acquisitions.
This document summarizes SemGroup's first quarter 2018 earnings conference call. It discusses SemGroup's non-GAAP financial measures of Adjusted EBITDA and Total Segment Profit, which exclude certain items to make performance more comparable between periods. The document also warns that non-GAAP measures have limitations and should not be considered in isolation as substitutes for GAAP measures. Additionally, the document contains forward-looking statements regarding SemGroup's 2018 operating budget, capital expenditures plan, and recent capital raising activities totaling around $800 million.
This document provides a non-GAAP financial measure called Adjusted EBITDA used by SemGroup. It explains that Adjusted EBITDA excludes selected non-cash and other items to increase comparability between reporting periods and is used by management and discussed with investors. However, it has limitations as an analytical tool since it excludes some items affecting the most directly comparable GAAP measure. The document also provides forward-looking statements about SemGroup's prospects, financial performance, growth plans, and managing risks in a lower commodity price environment. It highlights SemGroup's strengths including stable cash flows from contracts and investment-grade counterparties.
The document discusses SemGroup's use of non-GAAP financial measures like Adjusted EBITDA and Total Segment Profit to evaluate financial performance. It defines these measures and explains how they are calculated and why management finds them useful, while also noting their limitations. It also contains forward-looking statements about SemGroup's prospects, financial performance, growth plans and risks.
The document provides an overview of SemGroup's non-GAAP financial measures and forward-looking statements. It discusses Adjusted EBITDA, Cash Available for Dividends, and Total Segment Profit, which are not GAAP measures. It also notes that SemGroup does not provide guidance for net income due to non-cash items that cannot be accurately forecasted. The document contains statements regarding SemGroup's prospects, plans, expectations and outlook that are considered forward-looking under securities laws, and are subject to risks and uncertainties.
The document discusses SemGroup's non-GAAP financial measures of Adjusted EBITDA, Cash Available for Dividends (CAFD) and Total Segment Profit. It explains that Adjusted EBITDA removes certain selected items from net income to improve comparability between periods and includes a list of the types of items generally excluded. CAFD is based on Adjusted EBITDA less certain cash payments to analyze performance after obligations. Total Segment Profit represents revenue less costs and expenses, adjusted for certain items, and is how management assesses segment performance. The measures are used by management and may be presented to investors but have limitations as analytical tools.
The document provides an overview of SemGroup's third quarter 2018 results. Key points include:
- Adjusted EBITDA was $96.4 million for the quarter.
- A quarterly dividend of $0.4725 per share was declared, with dividend coverage of 1.4x.
- Capital expenditures guidance for 2018 was updated to $360 million, up 3% from prior guidance.
- Execution continued on strategic projects in the Gulf Coast, Mid-Continent and Canada expected to drive growth in 2019 and beyond.
The document provides an overview of SemGroup's third quarter 2018 results. Key points include:
- Adjusted EBITDA was $96.4 million for the quarter.
- The company declared a quarterly dividend of $0.4725 per share, with dividend coverage of 1.4x.
- Capital expenditures guidance for 2018 was updated to $360 million, up 3% from prior guidance.
- Several growth projects across the Gulf Coast, Mid-Continent and Canada regions are expected to drive financial growth through 2020 and beyond.
This document summarizes SemGroup's second quarter 2018 earnings conference call. It discusses non-GAAP financial measures used by SemGroup like Adjusted EBITDA, Cash Available for Dividends, and Total Segment Profit. It provides definitions of these terms and notes that they are not substitutes for GAAP measures but are used by management to evaluate performance. The document also contains forward-looking statements about SemGroup's prospects, plans, and financial performance that are based on current expectations and assumptions which involve risks and uncertainties.
This document provides an overview of SemGroup's non-GAAP financial measures and forward-looking statements. It defines Adjusted EBITDA, Cash Available for Dividends, and Total Segment Profit as non-GAAP measures used by management to evaluate performance that exclude certain items affecting comparability between periods. It cautions that non-GAAP measures should not be considered in isolation or as substitutes for GAAP measures. The document also notes that forward-looking statements are subject to risks and uncertainties that could cause actual results to differ materially from expectations.
Sem cams investor presentation master september 2018 finalSemGroupCorporation
The document discusses SemGroup's non-GAAP financial measures and provides forward-looking statements. It includes the following key points:
- SemGroup uses measures like Adjusted EBITDA, Cash Available for Dividends, and Total Segment Profit to evaluate performance, which are not substitutes for GAAP measures.
- Adjusted EBITDA excludes selected non-cash and other items to improve comparability between periods.
- Cash Available for Dividends is based on Adjusted EBITDA less certain cash expenses and capital expenditures.
- Total Segment Profit assesses performance at the segment level and excludes certain items.
- The document cautions that non-GAAP measures have limitations
Sem group earnings presentation 4q & full year-2018_finalSemGroupCorporation
Fourth Quarter and Full-Year 2018 Results Earnings Conference Call
In 3 sentences:
SemGroup reported adjusted EBITDA of $394 million for full-year 2018, an increase from $328 million in 2017. For 2019, SemGroup expects adjusted EBITDA between $420-465 million. SemGroup also provided 2019 capital expenditure guidance of $307 million, with $150 million allocated for growth projects in the U.S. and $230 million for the SemCAMS Midstream joint venture in Canada.
Sem group earnings presentation 4q & full year 2018 finalSemGroupCorporation
Fourth Quarter and Full-Year 2018 Results Earnings Conference Call February 27, 2019
The document discusses SemGroup's non-GAAP financial measures including Adjusted EBITDA, Cash Available for Dividends, and Total Segment Profit which are used to evaluate performance but are not substitutes for GAAP measures. It provides definitions and adjustments for each measure. The document also contains forward-looking statements regarding SemGroup's prospects, financial performance, annual dividend growth, and other matters which are subject to known and unknown risks that could cause actual results to differ.
MPG provided guidance for 2016 that is unchanged from previous estimates:
- Net sales are expected to be approximately $3.1 billion.
- Adjusted EBITDA margin is anticipated to be around 18%.
- Adjusted free cash flow yield is projected to be over 10% of net sales.
First Quarter 2016 Results
- SemGroup reported adjusted EBITDA of $77.7 million for the first quarter of 2016, down slightly from $79.3 million in the fourth quarter of 2015.
- Rose Rock Midstream reported adjusted EBITDA of $49.0 million for the first quarter of 2016, up from $46.6 million in the fourth quarter of 2015.
- SemGroup maintained its 2016 adjusted EBITDA guidance of $270-320 million and Rose Rock Midstream maintained its 2016 adjusted EBITDA guidance of $165-185 million.
SemGroup and Rose Rock 3Q 2015 Earnings PresentationSemGroup
- The company reported third quarter 2015 results and reduced its full year Adjusted EBITDA guidance due to lower expected volumes and foreign currency impacts.
- It increased dividends for the third quarter of 2015 compared to the prior year but maintained full year dividend growth guidance.
- Financial flexibility was maintained with revolving credit available to fund capital projects and potential dropdown transactions from SemGas.
- The company will focus on strategic opportunities while targeting volume maintenance or growth in key asset areas during a low oil price environment.
Similar to Sem group earnings presentation 2q 2017 final (20)
World economy charts case study presented by a Big 4
World economy charts case
World economy charts case study presented by a Big 4
World economy charts case study presented by a Big 4World economy charts case study presented by a Big 4
World economy charts case study presented by a Big 4
World economy charts case study presented by a Big 4World economy charts case study presented by a Big 4World economy charts case study presented by a Big 4World economy charts case study presented by a Big 4World economy charts case study presented by a Big 4World economy charts case study presented by a Big 4World economy charts case study presented by a Big 4World economy charts case study presented by a Big 4World economy charts case study presented by a Big 4World economy charts case study presented by a Big 4World economy charts case study presented by a Big 4World economy charts case study presented by a Big 4World economy charts case study presented by a Big 4World economy charts case study presented by a Big 4study presented by a Big 4
The E-Way Bill revolutionizes logistics by digitizing the documentation of goods transport, ensuring transparency, tax compliance, and streamlined processes. This mandatory, electronic system reduces delays, enhances accountability, and combats tax evasion, benefiting businesses and authorities alike. Embrace the E-Way Bill for efficient, reliable transportation operations.
MUTUAL FUNDS (ICICI Prudential Mutual Fund) BY JAMES RODRIGUESWilliamRodrigues148
Mutual funds are investment vehicles that pool money from multiple investors to purchase a diversified portfolio of stocks, bonds, or other securities. They are managed by professional portfolio managers or investment companies who make investment decisions on behalf of the fund's investors.
Cleades Robinson, a respected leader in Philadelphia's police force, is known for his diplomatic and tactful approach, fostering a strong community rapport.
2. Second Quarter 2017 Results
Non-GAAP Financial Measures
SemGroup’s non-GAAP measure, Adjusted EBITDA, is not a GAAP measure and is not intended to be used in lieu of GAAP presentation of net income (loss),
which is the most closely associated GAAP measure. Adjusted EBITDA represents earnings before interest, taxes, depreciation and amortization, adjusted for
selected items that SemGroup believes impact the comparability of financial results between reporting periods. In addition to non-cash items, we have selected
items for adjustment to EBITDA which management feels decrease the comparability of our results among periods. These items are identified as those which
are generally outside of the results of day to day operations of the business. These items are not considered non-recurring, infrequent or unusual, but do erode
comparability among periods in which they occur with periods in which they do not occur or occur to a greater or lesser degree. Historically, we have selected
items such as gains on the sale of NGL Energy Partners LP common units, costs related to our predecessor’s bankruptcy, significant business development
related costs, significant legal settlements, severance and other similar costs. Management believes these types of items can make comparability of the results
of day to day operations among periods difficult and have chosen to remove these items from our Adjusted EBITDA. We expect to adjust for similar types of
items in the future. Although we present selected items that we consider in evaluating our performance, you should be aware that the items presented do not
represent all items that affect comparability between the periods presented. Variations in our operating results are also caused by changes in volumes, prices,
mechanical interruptions and numerous other factors. We do not adjust for these types of variances.
This measure may be used periodically by management when discussing our financial results with investors and analysts and is presented as management
believes it provides additional information and metrics relative to the performance of our businesses. This non-GAAP financial measure has important limitations
as an analytical tool because it excludes some, but not all, items that affect the most directly comparable GAAP financial measures. You should not consider
non-GAAP measures in isolation or as substitutes for analysis of our results as reported under GAAP. Management compensates for the limitations of our non-
GAAP measures as analytical tools by reviewing the comparable GAAP measures, understanding the differences between the non-GAAP measure and the
most comparable GAAP measure and incorporating this knowledge into its decision-making processes. We believe that investors benefit from having access to
the same financial measures that our management uses in evaluating our operating results. Because all companies do not use identical calculations, our
presentations of non-GAAP measures may be different from similarly titled measures of other companies, thereby diminishing their utility.
SemGroup does not provide guidance for net income, the GAAP financial measure most directly comparable to the non-GAAP financial measure Adjusted
EBITDA, because Net Income includes items such as unrealized gains or losses on derivative activities or similar items which, because of their nature, cannot
be accurately forecasted. We do not expect that such amounts would be significant to Adjusted EBITDA as they are largely non-cash items.
2
3. Second Quarter 2017 Results
Certain matters contained in this Press Release include “forward-looking statements” within the meaning of Section 27A of the Securities Act of 1933, as amended,
and Section 21E of the Securities Exchange Act of 1934, as amended. We make these forward-looking statements in reliance on the safe harbor protections
provided under the Private Securities Litigation Reform Act of 1995.
All statements, other than statements of historical fact, included in this presentation including the prospects of our industry, our anticipated financial performance,
our anticipated annual dividend growth rate, management's plans and objectives for future operations, planned capital expenditures, business prospects, outcome
of regulatory proceedings, market conditions and other matters, may constitute forward-looking statements. Although we believe that the expectations reflected in
these forward-looking statements are reasonable, we cannot assure you that these expectations will prove to be correct. These forward-looking statements are
subject to certain known and unknown risks and uncertainties, as well as assumptions that could cause actual results to differ materially from those reflected in
these forward-looking statements. Factors that might cause actual results to differ include, but are not limited to, our ability to generate sufficient cash flow from
operations to enable us to pay our debt obligations and our current and expected dividends or to fund our other liquidity needs; any sustained reduction in demand
for, or supply of, the petroleum products we gather, transport, process, market and store; the effect of our debt level on our future financial and operating flexibility,
including our ability to obtain additional capital on terms that are favorable to us; our ability to access the debt and equity markets, which will depend on general
market conditions and the credit ratings for our debt obligations and equity; the failure to realize the anticipated benefits of our acquisition of HFOTCO LLC doing
business as Houston Fuel Oil Terminal Company (“HFOTCO”); our ability to pay the second payment related to our HFOTCO acquisition and the consequences of
our failing to do so; the loss of, or a material nonpayment or nonperformance by, any of our key customers; the amount of cash distributions, capital requirements
and performance of our investments and joint ventures; the amount of collateral required to be posted from time to time in our commodity purchase, sale or
derivative transactions; the impact of operational and developmental hazards and unforeseen interruptions; our ability to obtain new sources of supply of petroleum
products; competition from other midstream energy companies; our ability to comply with the covenants contained in our credit agreements, continuing covenant
agreement, and the indentures governing our notes, including requirements under our credit agreements to maintain certain financial ratios; our ability to renew or
replace expiring storage, transportation and related contracts; the overall forward markets for crude oil, natural gas and natural gas liquids; the possibility that the
construction or acquisition of new assets may not result in the corresponding anticipated revenue increases; any future impairment of goodwill resulting from the
loss of customers or business; changes in currency exchange rates; weather and other natural phenomena, including climate conditions; a cyber attack involving
our information systems and related infrastructure, or that of our business associates; the risks and uncertainties of doing business outside of the U.S., including
political and economic instability and changes in local governmental laws, regulations and policies; costs of, or changes in, laws and regulations and our failure to
comply with new or existing laws or regulations, particularly with regard to taxes, safety and protection of the environment; the possibility that our hedging activities
may result in losses or may have a negative impact on our financial results; general economic, market and business conditions; as well as other risk factors
discussed from time to time in our each of our documents and reports filed with the SEC.
Readers are cautioned not to place undue reliance on any forward-looking statements contained in this press release, which reflect management’s opinions only as
of the date hereof. Except as required by law, we undertake no obligation to revise or publicly release the results of any revision to any forward-looking statements.
We use our Investor Relations website and social media outlets as channels of distribution of material company information. Such information is routinely posted
and accessible on our Investor Relations website at ir.semgroupcorp.com.
We are present on Twitter and LinkedIn, follow us at the links below:
SemGroup Twitter and LinkedIn
Forward-Looking Information
3
4. Second Quarter 2017 Results
Achieving Significant Progress
Ñ Base business performed as expected for 2Q 2017
Ñ Successfully completed the acquisition of Houston Fuel Oil Terminal Co. (HFOTCO)
• Strategic platform with stabilizing and strengthening cash flows
• Provides SEMG optionality for growth
Ñ Maurepas Pipeline construction completed, underpinned with multi-decade
take-or-pay contract
Ñ Substantial construction progress on the STACK Crude Omega & SemGas
Canton pipelines, which will increase utilization of existing assets
Ñ Continual progress on SemCAMS' Wapiti Gas Plant adding to our significant
Duvernay and Montney footprint
Executing strategic plan to diversify cash flows and expand growth opportunities
Overview
4
5. Second Quarter 2017 Results
HFOTCO Update
SemGroup completed the acquisition of HFOTCO, one of the largest oil terminals in the U.S. on July 17, 2017
Ñ Initial consideration of $1.5 billion, comprised of:
• $301 million cash payment, funded from SEMG’s revolving credit facility
• Assumption of $761 million of existing HFOTCO net debt
• Issuance of 12.4 million common shares to Alinda(1)
Ñ Second payment of $600(2)
million cash due by the year-end 2018
• SEMG focused on funding the second payment in the near-term
• Preferred options under consideration: non-core asset sales, partnerships and/or joint venture of assets and
structured equity
Ñ Integration plan on track
• HFOTCO management team retained, 2017 performance on track with expected Adjusted EBITDA contribution of $60
million post-close
• Growth projects on budget and on time, 2017 contract renewals nearly complete and long-term guidance for
2018-19 unchanged
ü Significantly enhances scale and diversifies business with refinery facing take-or-pay cash flows
ü Highly stable and growing cash flows
ü Establishing SemGroup’s position in the premier energy market, the Houston Ship Channel
5
1) Number of common shares issued based on predetermined price of $32.30 per share
2) 5% per annum discount if paid prior to 12/31/2018
Executing on SemGroup Strategic Plan
6. Second Quarter 2017 Results
Key Projects Update
Ñ Maurepas Pipeline ~ $500 million(1)
• Pipeline construction of all three pipelines is complete
• 24” crude pipeline is operational and cash flowing
• 6” and 12” product pipelines are complete and expected to begin contributing in September
Ñ STACK Crude Omega Pipeline ~ $30 million(1)
• Right of way and surveys complete
• Tank construction at Omega and Ruby stations are progressing on schedule
• Expected completion late 4Q 2017
Ñ STACK SemGas Canton Pipeline ~ $60 million(1)
• Recently executed long-term gathering and processing contract with dedicated acreage in
Blaine and Major counties
• Expected completion late 4Q 2017
Ñ Wapiti Gas Plant ~ $225-250 million(1)
• Site work continues to progress
• Expected completion 2Q 2019
Ñ HFOTCO Projects ~ $120 million(2)
• Ship Dock #5 and 1.45 mmbbls crude storage
• Backstopped by long-term contract with credit worthy counterparty
• Expected completion mid-2018
6
1) Expected total project spend
2) Expected total project spend; reflects SEMG portion of HFOTCO projects
7. Second Quarter 2017 Results
Ñ SemCAMS - increased nearly $4 million due to take-or-pay true-ups, partially offset by lower capital
fee revenue related to K3 plant turnaround
Ñ SemGas - increased largely due to a $2.5 million one-time contractual true-up, partially offset by
lower volumes
Ñ Crude Supply & Logistics - results reflect continued pressure on marketing differentials
Ñ SemLogistics - down approximately $1 million primarily due to lower throughput revenue
Second Quarter 2017 Results
Segment Adjusted EBITDA 2Q 2017 1Q 2017
Crude - Transportation $ 25.2 $ 25.7
Crude - Facilities 8.9 9.0
Crude - Supply and Logistics (3.5) (3.5)
SemGas 17.0 16.1
SemCAMS 15.9 12.5
SemLogistics 3.1 3.9
SemMaterials Mexico 1.9 2.0
Corporate and Other (3.1) (5.0)
$ 65.4 $ 60.7
As Reported (in millions, excluding EPS, unaudited) 2Q 2017 1Q 2017
Net income (loss) attributable to SemGroup $ 9.6 $ (10.3)
Net income (loss) per share - diluted $ 0.15 $ (0.16)
EBITDA(1)
$ 52.3 $ 28.3
Selected Non-Cash Items and Other Items Impacting Comparability(1)
$ 13.1 $ 32.4
Adjusted EBITDA(1)
$ 65.4 $ 60.7
Dividend per Share $ 0.45 $ 0.45
7
1) Non-GAAP Financial Data Reconciliations are included in the Appendix to this presentation
8. Second Quarter 2017 Results
Second Quarter Actuals
Ñ SEMG Standalone
• SEMG covenant net leverage 3.7x (target 4.5x; max 5.5x)
• SEMG available liquidity ~ $850 million
Pro Forma Leverage and Liquidity (including HFOTCO Acquisition)
Ñ SEMG Second Quarter 2017 Pro Forma
• SEMG covenant net leverage 3.8x (target 4.5x; max 5.5x)
• SEMG consolidated net leverage 5.2x
• Ratings: B2 / B+ (stable)
• Consolidated available liquidity ~ $630 million
Ñ HFOTCO Standalone Second Quarter 2017 Actuals
• HFOTCO covenant net leverage 6.8x (max 7.5x)
• Ratings: Ba3 / BB- (stable)
Leverage and Liquidity
8
9. Second Quarter 2017 Results
Crude
• Average Cushing storage rate: $0.33/barrel/month
• Maurepas Pipeline: completed
• Transportation volumes(3)
: flat year over year
• White Cliffs Pipeline volumes: 100-110k bpd
• Glass Mountain Pipeline volumes: 75-80k bpd
SemGas
• N. Oklahoma processing volumes: 260-280 mmcf/d
SemCAMS
• Processing volumes: 400-420 mmcf/d
• K3 plant turnaround - completed 2Q 2017
HFOTCO
• Acquisition effective July 17, 2017, includes ~$60
million of Adjusted EBITDA post-close
Cash Taxes
• Approximately $5 million, related to foreign subs
Adjusted EBITDA $330 million - $350 million
Updated 2017 Adjusted EBITDA Guidance
9
1) 2017 Adjusted EBITDA guidance narrowed, primarily due to the continued softness in the crude supply & logistics markets
and the timing of Maurepas cash flows
2) HFOTCO Adjusted EBITDA of $60 million reflects post-close contribution; $115 million full-year 2017
3) Transportation volumes excludes Maurepas Pipeline and JV assets (White Cliffs and Glass Mountain Pipeline)
$400
$300
$200
$100
(inmillions)
Initial 2017E (narrowed) HFOTCO 2017E Updated 2017E
$60
$330 - $350
$270 - $290
(2)(1)
10. Second Quarter 2017 Results
Key Committed Projects
Crude Projects
• Maurepas Pipeline ~ completed: $180 million
• Cushing 20" Pipeline ~ completion 4Q 2017: $35 million
• STACK Crude Omega Pipeline ~ completion late 4Q 2017: $30 million(1)
Natural Gas Projects
• Wapiti Sour Gas Plant ~ completion 2Q 2019: $80 million
• KA Plant projects: $25 million
• N. Oklahoma gathering projects: $20 million
• STACK SemGas Canton Pipeline ~ completion late 4Q 2017: $60 million
HFOTCO(2)
• Ship Dock #5: $35 million ~ completion mid-2018
• 1.45 mmbbls crude storage: $20 million ~ completion mid-2018
Updated 2017 Capital Expenditure Guidance
$575 million Capex Spend on Strategic Crude and Natural Gas Projects
10
1) Reflects SemGroup's 50% of capital contributions to the joint venture
2) Reflects SemGroup's spend post-close of acquisition
Maurepas Pipeline
Crude
HFOTCO
Natural Gas
Other Growth Projects
Maintenance
$180
31%
$65
11%
$75
13%
$185
32%
$10
2%
$60
10%11%
11. Second Quarter 2017 Results
Delivering Long-Term Value
11
Ñ Transforming SemGroup from an upstream dependent company to a premier diversified
energy infrastructure company
Ñ Adding growth paths in exciting new areas:
• Houston Ship Channel
◦ Deep water access, pipeline connectivity and world class residual fuel oil terminal
• Mississippi River
◦ 24” crude pipeline connecting St. James to refineries who value crude optionality
• STACK Play
◦ Crude and gas pipelines, backed by investment-grade counterparties and driven by a
robust production environment continuing to develop in the STACK
• Duvernay/Montney
◦ Leveraging SemCAMS' unique and valued high-sulphur gas processing footprint and
pipeline transport capacity
13. Second Quarter 2017 Results
Over 70% of SemGroup's pro forma revenue is
derived from investment grade counterparties
Over 95% of total LTM gross margin from
fee based cash flows
(1) LTM December 31, 2016
(2) Counterparty ratings LTM December 31, 2016; excludes SemLogistics and SemMaterials Mexico
Take or Pay Fixed Fee POP/Marketing
700
600
500
400
300
200
100
0
($inmillions)
2014 2015 2016 Pro Forma 2017 Investment Grade
Non-Investment Grade
72%
28%51%
38%
11%11%
59%
30%
64%
13%
23%
Company Strengths
13
1) LTM June 30, 2017, pro forma HFOTCO acquisition
2) Counterparty ratings LTM June 30, 2017 pro forma HFOTCO acquisition; excludes SemLogistics and SemMaterials Mexico
13
Counterparty Strength(2)
Stable Cash Flows(1)
42%
53%
5%
HFOTCO increases SEMG's portion of cash flows with fixed-fee, contracted
arrangements from credit-worthy counterparties
15. Second Quarter 2017 Results
SemGas Northern OK Avg Processed Volume
SemCAMS Average Throughput Volume
Natural Gas Key Performance Metrics
K3 Plant KA Plant Capacity
600
500
400
300
200
100
0
(mmcf/d)
1Q 2Q 3Q 4Q 1Q 2Q
270.4
157.0
253.5 253.7 260.7
171.1
114.3
384.7
147.1
304.1 135.0
388.5
143.1
396.8
146.9
407.6
172.2
343.3
Capacity Processing Volumes
600
500
400
300
200
100
0
(mmcf/d)
1Q 2Q 3Q 4Q 1Q 2Q
325.9 290.6 284.4 284.2 273.6 262.8
(1)
15
1) Lower volumes related to an unplanned shutdown at our K3 plant during June 2016
2) Scheduled plant turnaround at K3
2016 2017
2016 2017
(2)
16. Second Quarter 2017 Results
Leverage and Liquidity
(in millions, unaudited)
Standalone
6/30/2017 Adjustments
Pro Forma
6/30/2017
SemGroup (B2 / B+)(1)
Revolving Credit Facility - $1.0 Billion due 2021 $ 164 $ 301 $ 465
5.625% Senior unsecured notes due 2022 400 400
5.625% Senior unsecured notes due 2023 350 350
6.375% Senior unsecured notes due 2025 325 325
Total SEMG Debt $ 1,239 $ 1,540
HFOTCO (Ba3 / BB-)(1)
Revolving Credit Facility - $75 Million due 2019
Term Loan due 2021 $ 535
Hurricane Ike Bonds due 2050 225
Total HFOTCO Debt $ 760
Leverage Metrics
SEMG Covenant Net Leverage Ratio (max 5.5x)(3)
3.7x 3.8x
HFOTCO Covenant Net Leverage Ratio (max 7.5x)(4)
6.8x
Consolidated Net Leverage Ratio 3.7x 5.2x
Liquidity
SEMG Available Liquidity(5)
$ 850 $ 549
HFOTCO Available Liquidity 79
Consolidated Available Liquidity $ 850 $ 628
1) Corporate Family Rating
2) SemGroup completed the initial payment, which consisted of $301 million cash payment, funded from SEMG's revolving credit facility
3) Calculated per SEMG revolving credit agreement definitions, which includes material project adjustments ~$50 million and LTM
Pro Forma HFOTCO distributions received ~$70 million
4) Calculated per HFOTCO revolving credit agreement definitions
5) Available liquidity excludes SemMaterials Mexico cash and is reduced for outstanding letters of credit
16
(2)
17. Second Quarter 2017 Results
Consolidated Balance Sheets
(in thousands, unaudited, condensed) June 30,
2017
December 31,
2016
ASSETS
Current assets $ 543,126 $ 635,874
Property, plant and equipment, net 1,948,787 1,762,072
Goodwill and other intangible assets 180,441 185,208
Equity method investments 430,514 434,289
Other noncurrent assets, net 63,350 57,529
Total assets $ 3,166,218 $ 3,074,972
LIABILITIES AND OWNERS' EQUITY
Current liabilities:
Current portion of long-term debt $ 28 $ 26
Other current liabilities 455,446 488,329
Total current liabilities 455,474 488,355
Long-term debt, excluding current portion 1,215,244 1,050,918
Other noncurrent liabilities 90,101 89,734
Total liabilities 1,760,819 1,629,007
Total owners' equity 1,405,399 1,445,965
Total liabilities and owners' equity $ 3,166,218 $ 3,074,972
17
18. Second Quarter 2017 Results
Consolidated Statements of Operations and Comprehensive Income (Loss)
(in thousands, except per share amounts, unaudited, condensed) Three Months Ended Six Months Ended
June 30, March 31, June 30,
2017 2016 2017 2017 2016
Revenues $ 473,089 $ 287,377 $ 456,100 $ 929,189 $ 602,228
Expenses:
Costs of products sold, exclusive of depreciation and amortization shown below 340,107 176,842 348,998 689,105 373,789
Operating 73,346 54,707 52,083 125,429 104,899
General and administrative 26,752 20,775 21,644 48,396 41,835
Depreciation and amortization 25,602 25,055 24,599 50,201 49,106
Loss (gain) on disposal or impairment, net (234) 1,685 2,410 2,176 14,992
Total expenses 465,573 279,064 449,734 915,307 584,621
Earnings from equity method investments 17,753 17,078 17,091 34,844 40,149
Loss on issuance of common units by equity method investee — — — — (41)
Operating income 25,269 25,391 23,457 48,726 57,715
Other expenses, net 12,033 9,944 33,639 45,672 68,566
Income (loss) from continuing operations before income taxes 13,236 15,447 (10,182) 3,054 (10,851)
Income tax expense (benefit) 3,625 4,658 95 3,720 (16,749)
Income (loss) from continuing operations 9,611 10,789 (10,277) (666) 5,898
Loss from discontinued operations, net of income taxes — (2) — — (4)
Net income (loss) 9,611 10,787 (10,277) (666) 5,894
Less: net income attributable to noncontrolling interests — 1,922 — — 10,942
Net income (loss) attributable to SemGroup Corporation 9,611 8,865 (10,277) (666) (5,048)
Other comprehensive income, net of income taxes 8,952 6,591 6,033 14,985 2,482
Comprehensive income (loss) attributable to SemGroup Corporation $ 18,563 $ 15,456 $ (4,244) $ 14,319 $ (2,566)
Net income (loss) per common share:
Basic $ 0.15 $ 0.20 $ (0.16) $ (0.01) $ (0.11)
Diluted $ 0.15 $ 0.19 $ (0.16) $ (0.01) $ (0.11)
Weighted average shares (thousands):
Basic 65,749 45,236 65,692 65,717 44,553
Diluted 66,277 45,647 65,692 65,717 44,553
18
19. Second Quarter 2017 Results
2016 Quarterly Financial Data
Note: Prior quarter amounts above have been restated from the amounts originally reported to correct for an immaterial error identified by management in the fourth
quarter related to an under capitalization of interest on certain capital projects. Previously reported interest expense, included in "other expense, net" above, has
been decreased by $1.4 million, $0.9 million and $2.5 million for the quarters ended March 31, June 30 and September 30, 2016, respectively, with a corresponding
increase to net income. Earnings per basic share was increased by $0.03, $0.02 and $0.05 per share for the quarters ended March 31, June 30 and September 30,
2016, respectively. Capitalized interest recorded for the fourth quarter of 2016 includes an immaterial out of period adjustment of $6.3 million related to under
capitalization of interest in the prior year.
(in thousands, except per share data, unaudited)
First
Quarter
Second
Quarter
Third
Quarter
Fourth
Quarter Total
Total revenues $ 314,851 $ 287,377 $ 327,764 $ 402,172 $ 1,332,164
Loss on disposal or impairment, net 13,307 1,685 1,018 38 16,048
Other operating costs and expenses 292,250 277,379 316,644 381,969 1,268,242
Total expenses 305,557 279,064 317,662 382,007 1,284,290
Earnings from equity method investments 23,071 17,078 15,845 17,763 73,757
Loss on issuance of common units by equity method investee (41) — — — (41)
Operating income 32,324 25,391 25,947 37,928 121,590
Other expenses, net 58,622 9,944 18,684 9,809 97,059
Income (loss) from continuing operations before income taxes (26,298) 15,447 7,263 28,119 24,531
Income tax expense (benefit) (21,407) 4,658 11,898 16,119 11,268
Income (loss) from continuing operations (4,891) 10,789 (4,635) 12,000 13,263
Income (loss) from discontinued operations, net of income taxes (2) (2) 3 — (1)
Net income (loss) (4,893) 10,787 (4,632) 12,000 13,262
Less: net income attributable to noncontrolling interests 9,020 1,922 225 — 11,167
Net income (loss) attributable to SemGroup $ (13,913) $ 8,865 $ (4,857) $ 12,000 $ 2,095
Earnings (loss) per share—basic $ (0.32) $ 0.20 $ (0.09) $ 0.18 $ 0.04
Earnings (loss) per share—diluted $ (0.32) $ 0.19 $ (0.09) $ 0.18 $ 0.04
19
20. Second Quarter 2017 Results
Non-GAAP Adjusted EBITDA Calculation
(in thousands, unaudited) Three Months Ended Six Months Ended
June 30, March 31, June 30,
Reconciliation of net income to Adjusted EBITDA: 2017 2016 2017 2017 2016
Net income (loss) $ 9,611 $ 10,787 $ (10,277) $ (666) $ 5,894
Add: Interest expense 13,477 18,011 13,867 27,344 35,588
Add: Income tax expense (benefit) 3,625 4,658 95 3,720 (16,749)
Add: Depreciation and amortization expense 25,602 25,055 24,599 50,201 49,106
EBITDA 52,315 58,511 28,284 80,599 73,839
Selected Non-Cash Items and
Other Items Impacting Comparability 13,095 9,121 32,383 45,478 71,461
Adjusted EBITDA $ 65,410 $ 67,632 $ 60,667 $ 126,077 $ 145,300
Selected Non-Cash Items and
Other Items Impacting Comparability
Loss (gain) on disposal or impairment, net $ (234) $ 1,685 $ 2,410 $ 2,176 $ 14,992
Loss from discontinued operations, net of income taxes — 2 — — 4
Foreign currency transaction loss (gain) (1,011) 1,543 — (1,011) 3,012
Remove NGL equity earnings including loss on issuance of common
units (6) — (3) (9) (2,191)
Remove loss (gain) on sale or impairment of NGL units — (9,120) — — 30,644
NGL cash distribution — — — — 4,873
M&A transaction related costs 5,453 — — 5,453 —
Employee severance and relocation expense 312 836 558 870 1,095
Unrealized loss (gain) on derivative activities (928) 4,477 27 (901) (71)
Depreciation and amortization included within equity earnings 6,698 7,138 6,712 13,410 13,677
Non-cash equity compensation 2,803 2,560 2,757 5,560 5,426
Loss on early extinguishment of debt 8 — 19,922 19,930 —
Selected Non-Cash items and
Other Items Impacting Comparability $ 13,095 $ 9,121 $ 32,383 $ 45,478 $ 71,461
20 Note: 2Q 2017 cash expense: ~ $18 million interest, ~ $12 million maintenance capex, ~ $2 million income tax
21. Second Quarter 2017 Results
Non-GAAP Financial Data Reconciliations
(in thousands, unaudited) Three Months Ended Six Months Ended
June 30, March 31, June 30,
2017 2016 2017 2017 2016
Net income $ 13,520 $ 11,794 $ 12,242 $ 25,762 $ 31,089
Add: Interest expense (income) (1,470) 193 (1,305) (2,775) 457
Add: Depreciation and amortization expense 6,498 6,174 5,927 12,425 12,034
EBITDA 18,548 18,161 16,864 35,412 43,580
Selected Non-Cash Items and
Other Items Impacting Comparability 6,683 8,954 8,788 15,471 15,560
Adjusted EBITDA $ 25,231 $ 27,115 $ 25,652 $ 50,883 $ 59,140
Selected Non-Cash Items and Other Items Impacting Comparability
Loss (gain) on disposal or impairment, net $ (15) $ 1,714 $ 1,961 $ 1,946 $ 1,781
Employee severance and relocation expense — 102 115 115 102
Depreciation and amortization included within
equity earnings 6,698 7,138 6,712 13,410 13,677
Selected Non-Cash items and
Other Items Impacting Comparability $ 6,683 $ 8,954 $ 8,788 $ 15,471 $ 15,560
Crude - Transportation Segment
21
22. Second Quarter 2017 Results
Non-GAAP Financial Data Reconciliations
(in thousands, unaudited) Three Months Ended Six Months Ended
June 30, March 31, June 30,
2017 2016 2017 2017 2016
Net income $ 6,690 $ 7,450 $ 6,884 $ 13,574 $ 15,155
Add: Interest expense 165 — 134 299 —
Add: Depreciation and amortization expense 2,022 1,921 1,944 3,966 3,803
EBITDA 8,877 9,371 8,962 17,839 18,958
Selected Non-Cash Items and
Other Items Impacting Comparability — 4 54 54 4
Adjusted EBITDA $ 8,877 $ 9,375 $ 9,016 $ 17,893 $ 18,962
Selected Non-Cash Items and Other Items Impacting Comparability
Employee severance expense $ — $ 4 $ 54 $ 54 $ 4
Selected Non-Cash items and
Other Items Impacting Comparability $ — $ 4 $ 54 $ 54 $ 4
Crude - Facilities Segment
22
23. Second Quarter 2017 Results
Non-GAAP Financial Data Reconciliations
(in thousands, unaudited) Three Months Ended Six Months Ended
June 30, March 31, June 30,
2017 2016 2017 2017 2016
Net income (loss) $ (2,941) $ 5,370 $ (3,961) $ (6,902) $ 18,831
Add: Interest expense 327 182 257 584 322
Add: Depreciation and amortization expense 78 40 62 140 80
EBITDA (2,536) 5,592 (3,642) (6,178) 19,233
Selected Non-Cash Items and
Other Items Impacting Comparability (928) 4,477 170 (758) 156
Adjusted EBITDA $ (3,464) $ 10,069 $ (3,472) $ (6,936) $ 19,389
Selected Non-Cash Items and Other Items Impacting Comparability
Loss on disposal or impairment, net $ — $ — $ — $ — $ 227
Employee severance expense — — 143 143 —
Unrealized loss (gain) on derivative activities (928) 4,477 27 (901) (71)
Selected Non-Cash items and
Other Items Impacting Comparability $ (928) $ 4,477 $ 170 $ (758) $ 156
Crude - Supply and Logistics Segment
23
24. Second Quarter 2017 Results
Non-GAAP Financial Data Reconciliations
(in thousands, unaudited) Three Months Ended Six Months Ended
June 30, March 31, June 30,
2017 2016 2017 2017 2016
Net income (loss) $ 4,459 $ (325) $ 3,673 $ 8,132 $ (13,799)
Add: Interest expense 3,096 3,431 3,149 6,245 6,986
Add: Depreciation and amortization expense 9,099 9,198 8,927 18,026 18,125
EBITDA 16,654 12,304 15,749 32,403 11,312
Selected Non-Cash Items and
Other Items Impacting Comparability 347 256 318 665 13,647
Adjusted EBITDA $ 17,001 $ 12,560 $ 16,067 $ 33,068 $ 24,959
Selected Non-Cash Items and Other Items Impacting Comparability
Loss (gain) on disposal or impairment, net $ — $ (1) $ 21 $ 21 $ 13,051
Employee severance expense 45 13 — 45 13
Non-cash equity compensation 302 244 297 599 583
Selected Non-Cash items and
Other Items Impacting Comparability $ 347 $ 256 $ 318 $ 665 $ 13,647
SemGas Segment
24
25. Second Quarter 2017 Results
Non-GAAP Financial Data Reconciliations
(in thousands, unaudited) Three Months Ended Six Months Ended
June 30, March 31, June 30,
2017 2016 2017 2017 2016
Net income $ 6,652 $ 2,325 $ 3,506 $ 10,158 $ 5,601
Add: Interest expense 2,111 1,931 2,162 4,273 3,637
Add: Income tax expense 2,267 451 1,424 3,691 1,416
Add: Depreciation and amortization expense 4,434 4,294 4,496 8,930 8,245
EBITDA 15,464 9,001 11,588 27,052 18,899
Selected Non-Cash Items and
Other Items Impacting Comparability 429 381 932 1,361 764
Adjusted EBITDA $ 15,893 $ 9,382 $ 12,520 $ 28,413 $ 19,663
Selected Non-Cash Items and Other Items Impacting Comparability
Loss on disposal or impairment, net $ — $ — $ 445 $ 445 $ —
Foreign currency transaction loss (gain) (12) (1) 8 (4) 5
Employee severance 1 — — 1 —
Non-cash equity compensation 440 382 479 919 759
Selected Non-Cash items and
Other Items Impacting Comparability $ 429 $ 381 $ 932 $ 1,361 $ 764
SemCAMS Segment
25
26. Second Quarter 2017 Results
Non-GAAP Financial Data Reconciliations
(in thousands, unaudited) Three Months Ended Six Months Ended
June 30, March 31, June 30,
2017 2016 2017 2017 2016
Net income (loss) $ 1,040 $ (1,447) $ 1,285 $ 2,325 $ (1,693)
Add: Interest expense 561 353 522 1,083 729
Add: Income tax expense (benefit) 372 (273) 381 753 (214)
Add: Depreciation and amortization expense 1,901 1,983 1,815 3,716 3,943
EBITDA 3,874 616 4,003 7,877 2,765
Selected Non-Cash Items and
Other Items Impacting Comparability (772) 1,562 (64) (836) 2,249
Adjusted EBITDA $ 3,102 $ 2,178 $ 3,939 $ 7,041 $ 5,014
Selected Non-Cash Items and Other Items Impacting Comparability
Foreign currency transaction (gain) loss $ (914) $ 1,391 $ (259) $ (1,173) $ 1,901
Non-cash equity compensation 142 171 195 337 348
Selected Non-Cash items and
Other Items Impacting Comparability $ (772) $ 1,562 $ (64) $ (836) $ 2,249
SemLogistics Segment
26
27. Second Quarter 2017 Results
Non-GAAP Financial Data Reconciliations
(in thousands, unaudited) Three Months Ended Six Months Ended
June 30, March 31, June 30,
2017 2016 2017 2017 2016
Net income $ 633 $ 1,187 $ 406 $ 1,039 $ 1,883
Add: Income tax expense 525 194 217 742 801
Add: Depreciation and amortization expense 1,022 949 937 1,959 1,890
EBITDA 2,180 2,330 1,560 3,740 4,574
Selected Non-Cash Items and
Other Items Impacting Comparability (281) 244 391 110 614
Adjusted EBITDA $ 1,899 $ 2,574 $ 1,951 $ 3,850 $ 5,188
Selected Non-Cash Items and Other Items Impacting Comparability
Gain on disposal of long-lived assets, net $ (211) $ (28) $ (17) $ (228) $ (67)
Foreign currency transaction (gain) loss (84) 153 252 168 409
Non-cash equity compensation 14 119 156 170 272
Selected Non-Cash items and
Other Items Impacting Comparability $ (281) $ 244 $ 391 $ 110 $ 614
SemMaterials México Segment
27
28. Second Quarter 2017 Results
Non-GAAP Financial Data Reconciliations
(in thousands, unaudited) Three Months Ended Six Months Ended
June 30, March 31, June 30,
2017 2016 2017 2017 2016
Net loss $ (20,442) $ (15,567) $ (34,312) $ (54,754) $ (51,173)
Add: Interest expense 8,687 11,921 8,948 17,635 23,457
Add: Income tax expense (benefit) 461 4,286 (1,927) (1,466) (18,752)
Add: Depreciation and amortization expense 548 496 491 1,039 986
EBITDA (10,746) 1,136 (26,800) (37,546) (45,482)
Selected Non-Cash Items and
Other Items Impacting Comparability 7,617 (6,757) 21,794 29,411 38,467
Adjusted EBITDA $ (3,129) $ (5,621) $ (5,006) $ (8,135) $ (7,015)
Selected Non-Cash Items and Other Items Impacting Comparability
Gain on disposal or impairment, net $ (8) $ — $ — $ (8) $ —
Loss from discontinued operations, net of income taxes — 2 — — 4
Foreign currency transaction (gain) loss (1) — (1) (2) 697
Remove NGL equity earnings including loss on issuance of common
units (6) — (3) (9) (2,191)
Remove loss on impairment or sale of NGL units — (9,120) — — 30,644
NGL cash distribution — — — — 4,873
M&A transaction related costs 5,453 — — 5,453 —
Employee severance and relocation expense 266 717 246 512 976
Non-cash equity compensation 1,905 1,644 1,630 3,535 3,464
Loss on early extinguishment of debt 8 — 19,922 19,930 —
Selected Non-Cash items and
Other Items Impacting Comparability $ 7,617 $ (6,757) $ 21,794 $ 29,411 $ 38,467
Corporate & Other Segment
28
29. Second Quarter 2017 Results
(in thousands, unaudited) Three Months Ended
September 30, 2016
Crude -
Transportation
Crude -
Facilities
Crude -
Supply and
Logistics SemCAMS SemLogistics SemMexico SemGas
Corporate
and Other Consolidated
Net income (loss) $ 13,052 $ 7,697 $ (3,248) $ 5,080 $ 948 $ 1,491 $ 3,750 $ (33,402) $ (4,632)
Add: Interest expense 154 — 186 2,175 456 43 3,367 12,136 18,517
Add: Income tax expense (benefit) — — — 1,573 (601) 349 — 10,577 11,898
Add: Depreciation and amortization expense 6,309 1,982 46 4,239 1,880 932 9,079 455 24,922
EBITDA 19,515 9,679 (3,016) 13,067 2,683 2,815 16,196 (10,234) 50,705
Selected Non-Cash Items and
Other Items Impacting Comparability 8,334 2 6,167 124 686 72 125 5,078 20,588
Adjusted EBITDA $ 27,849 $ 9,681 $ 3,151 $ 13,191 $ 3,369 $ 2,887 $ 16,321 $ (5,156) $ 71,293
Selected Non-Cash Items and Other Items Impacting Comparability
Loss (gain) on disposal of long-lived assets, net $ 1,018 $ — $ — $ — $ — $ — $ — $ — $ 1,018
Foreign currency transaction (gain) loss — — — — 647 30 — (18) 659
Remove NGL equity losses including gain on issuance of common units — — — — — — — 38 38
Employee severance expense 33 2 — 1 — — — 498 534
Unrealized loss on derivative activities — — 6,167 — — — — — 6,167
M&A transaction related costs 3,269 3,269
Depreciation and amortization included within
equity earnings 7,283 — — — — — — — 7,283
Non-cash equity compensation — — — 123 39 42 125 1,291 1,620
Selected Non-Cash Items and
Other Items Impacting Comparability $ 8,334 $ 2 $ 6,167 $ 124 $ 686 $ 72 $ 125 $ 5,078 $ 20,588
Reconciliation of Net Income to Adjusted EBITDA
29