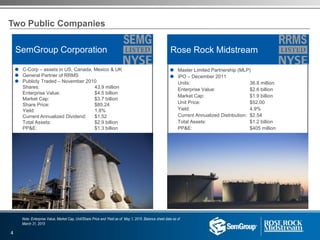
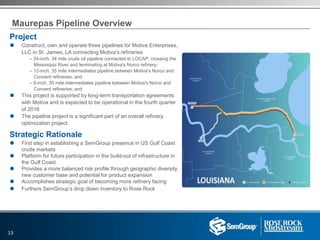
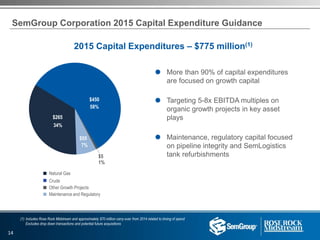
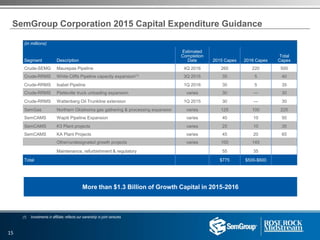
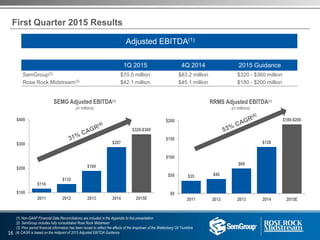
SlideShare a Scribd company logo
Investor Presentation
First Quarter 2015
Forward-looking Information
2
Certain matters contained in this presentation include "forward-looking statements" within the meaning of Section 27A of the Securities Act of 1933, as
amended, and Section 21E of the Securities Exchange Act of 1934, as amended. We make these forward-looking statements in reliance on the safe harbor
protections provided under the Private Securities Litigation Reform Act of 1995.
All statements, other than statements of historical fact, included in this presentation including the prospects of our industry, our anticipated financial
performance, our anticipated annual dividend growth rate, management's plans and objectives for future operations, planned capital expenditures, business
prospects, outcome of regulatory proceedings, market conditions and other matters, may constitute forward-looking statements. Although we believe that the
expectations reflected in these forward-looking statements are reasonable, we cannot assure you that these expectations will prove to be correct. These
forward-looking statements are subject to certain known and unknown risks and uncertainties, as well as assumptions that could cause actual results to differ
materially from those reflected in these forward-looking statements. Factors that might cause actual results to differ include, but are not limited to, our ability to
generate sufficient cash flow from operations to enable us to pay our debt obligations or to fund our other liquidity needs; our ability to comply with the
covenants contained in the instruments governing our indebtedness and to maintain certain financial ratios required by our credit facilities; the effect of our debt
level on our future financial and operating flexibility, including our ability to obtain additional capital; the ability of our subsidiary, Rose Rock Midstream L.P.
(NYSE: RRMS), to make minimum quarterly distributions; the operations of NGL Energy Partners LP (NYSE: NGL), which we do not control; any sustained
reduction in demand for the petroleum products we gather, transport, process and store; our ability to obtain new sources of supply of petroleum products; our
failure to comply with new or existing environmental laws or regulations or cross border laws or regulations; the possibility that the construction or acquisition of
new assets may not result in the corresponding anticipated revenue increases; changes in currency exchange rates; cyber attacks involving our information
systems and related infrastructure; the risks and uncertainties of doing business outside of the U.S., including political and economic instability and changes in
local governmental laws, regulations and policies; and the possibility that our hedging activities may result in losses or may have a negative impact on our
financial results; as well as other risk factors discussed from time to time in each of our documents and reports filed with the SEC.
Readers are cautioned not to place undue reliance on any forward-looking statements contained in this presentation which reflect management's opinions only
as of the date hereof. Except as required by law, we undertake no obligation to revise or publicly release the results of any revision to any forward-looking
statements.
SemGroup and Rose Rock Midstream use their Investor Relations website and social media outlets as channels of distribution of material company
information. Such information is routinely posted and accessible on our Investor Relations websites at ir.semgroupcorp.com and ir.rrmidstream.com.
Both companies are present on Twitter and LinkedIn, follow us at the links below:
SemGroup Twitter and LinkedIn Rose Rock Midstream Twitter and LinkedIn
Non-GAAP Financial Measures
3
SemGroup
Adjusted EBITDA is presented in this presentation for certain periods. Adjusted EBITDA is not a U.S. generally accepted accounting principles (“GAAP”)
measure and is not intended to be used in lieu of a GAAP presentation of net income (loss). Adjusted EBITDA is presented in this presentation because
SemGroup believes it provides additional information with respect to its performance. Adjusted EBITDA represents earnings before interest, taxes, depreciation
and amortization, adjusted for selected items that SemGroup believes impact the comparability of financial results between reporting periods. Although
SemGroup presents selected items that it considers in evaluating its performance, you should also be aware that the items presented do not represent all items
that affect comparability between the periods presented. Variations in SemGroup’s operating results are also caused by changes in volumes, prices, exchange
rates, mechanical interruptions and numerous other factors. These types of variances are not separately identified in this presentation. Because all companies
do not use identical calculations, SemGroup’s presentation of Adjusted EBITDA may be different from similarly titled measures of other companies, thereby
diminishing its utility. Reconciliations of net income (loss) to Adjusted EBITDA for the periods presented are included in the appendix of this presentation.
Rose Rock Midstream
This presentation includes the non-GAAP financial measures of Adjusted gross margin, Adjusted EBITDA and distributable cash flow, which may be used
periodically by management when discussing our financial results with investors and analysts. The appendix of this presentation provides reconciliations of
these non-GAAP financial measures to their most directly comparable financial measures calculated and presented in accordance with GAAP. Adjusted gross
margin, Adjusted EBITDA and distributable cash flow are presented as management believes they provide additional information and metrics relative to the
performance of our business.
Operating income (loss) is the GAAP measure most directly comparable to Adjusted gross margin, net income (loss) and cash provided by (used in) operating
activities are the GAAP measures most directly comparable to Adjusted EBITDA, and net income (loss) is the GAAP measure most directly comparable to
distributable cash flow. Our non-GAAP financial measures should not be considered as alternatives to the most directly comparable GAAP financial measures.
These non-GAAP financial measures have important limitations as analytical tools because they exclude some, but not all, items that affect the most directly
comparable GAAP financial measures. You should not consider Adjusted gross margin, Adjusted EBITDA or distributable cash flow in isolation or as
substitutes for analysis of our results as reported under GAAP. Because Adjusted gross margin, Adjusted EBITDA and distributable cash flow may be defined
differently by other companies in our industry, our definitions of these non-GAAP financial measures may not be comparable to similarly titled measures of
other companies, thereby diminishing their utility.
Management compensates for the limitation of Adjusted gross margin, Adjusted EBITDA and distributable cash flow as analytical tools by reviewing the
comparable GAAP measures, understanding the differences between Adjusted gross margin, Adjusted EBITDA and distributable cash flow, on the one hand,
and operating income (loss), net income (loss) and net cash provided by (used in) operating activities, on the other hand, and incorporating this knowledge into
its decision-making processes. We believe that investors benefit from having access to the same financial measures that our management uses in evaluating
our operating results.
Two Public Companies
Note: Enterprise Value, Market Cap, Unit/Share Price and Yield as of May 1, 2015. Balance sheet data as of
March 31, 2015
 C-Corp – assets in US, Canada, Mexico & UK
 General Partner of RRMS
 Publicly Traded – November 2010
Shares: 43.9 million
Enterprise Value: $4.5 billion
Market Cap: $3.7 billion
Share Price: $85.24
Yield: 1.8%
Current Annualized Dividend: $1.52
Total Assets: $2.9 billion
PP&E: $1.3 billion
 Master Limited Partnership (MLP)
 IPO – December 2011
Units: 36.8 million
Enterprise Value: $2.6 billion
Market Cap: $1.9 billion
Unit Price: $52.00
Yield: 4.9%
Current Annualized Distribution: $2.54
Total Assets: $1.2 billion
PP&E: $405 million
SemGroup Corporation Rose Rock Midstream
4
SemGroup Ownership Structure
Note: NGL Common Units are as of April 23, 2015
5
Business Strategy
Risk Management
Mitigate commodity price exposure
Maintain financial flexibility and utilize
leverage prudently
Quality Cash Flows
Generate consistent earnings and
cash flows
Focus on fee-based activities
Focused Growth
Capitalize on organic growth
opportunities with existing and
new assets
Grow our business through strategic
and accretive asset acquisitions
6
Crude and Gas Assets in Key Growth Areas
7
Crude Business Overview
White Cliffs Pipeline – 51% ownership
 DJ Basin to Cushing, OK
 Two 527-mile, 12-inch pipelines
 150,000 bpd current capacity
 Expanding capacity to approximately 215,000 bpd
– Expected completion 3Q 2015
Wattenberg Oil Trunkline
 75-mile, 12-inch pipeline and storage in DJ Basin
 Transports Noble Energy production to White Cliffs
Platteville Truck Unloading Facility
 16-lane truck unloading facility
 Origin of White Cliffs Pipeline
 230,000 barrels of storage capacity
 4 new truck unloading bays and 100,000 barrels of additional
storage – Expected completion summer 2015
 10 new truck unloading bays – Expected completion 4Q 2015
Tampa Pipeline
 12-mile, 12-inch pipeline from Platteville to Tampa, CO rail
facility
 Constructed a new 5-mile lateral pipeline extension
DJ Basin
8
Crude Business Overview
Cushing Storage
 7.6 million barrels of storage
 86% under long-term fixed fee contracts with first
expiration 2016
 2014 average storage rate of $0.37 per month
 Connectivity to all major inbound/outbound pipelines
Kansas/Oklahoma System
 Approximately 600-mile gathering and transportation
pipeline system
 Currently operating at full capacity
 Connects to third-party pipelines, Kansas and
Oklahoma refineries and Cushing terminal
 620,000 barrels of storage capacity
Oklahoma/Kansas Assets
Field Services
Crude Oil Trucking Fleet
 Fleet of more than 250 crude oil trucks
 Servicing the Bakken, DJ/Niobrara, Eagle Ford,
Granite Wash, Mississippi Lime, Permian, San Juan
and Utica plays
9
Glass Mountain Pipeline – 50% ownership
 215-mile pipeline
 Two laterals – Granite Wash and Mississippi Lime Play join
and terminate in Cushing
 140,000 bpd current capacity
Crude Key Performance Metrics
(1) 100% of storage contract volumes are included in year of contract expiration
(2) Pipeline volumes include KS/OK system, ND transportation and Tampa pipeline
(3) White Cliffs Pipeline is currently owned 51% by RRMS; 100% throughput
(4) Glass Mountain Pipeline is owned 50% by RRMS; average volumes for 1Q 2014 reflects two months operational;
100% throughput
Crude Transportation Volumes
(Thousand Barrels per Day)
Crude Marketing Volumes
(Thousand Barrels per Day)
n Pipeline Volumes(2) n White Cliffs PL(3) n Wattenberg Oil Trunkline n Glass Mountain PL(4)
Crude Cushing Storage
7.6 million Barrels Capacity
6.50 6.00
4.40
2.90
Field Services Transportation Volumes
(Thousand Barrels per Day)
n Contracted(1) n Operational / Marketing n Uncontracted
1.10
1.10
1.10
1.10
3.60
2.10
28.526.6
31.2
35.2
57.1 67.3 64.9 65.2 71.8 65.3
77.4 72.7 74.1 98.5
118.4 139.2
11.0
26.6 28.5
31.2
35.2
45.8
43.7 61.7
61.1
65.2
64.9
0
50
100
150
200
250
300
4Q 1Q 2Q 3Q 4Q 1Q
30.9
42.7 46.1
75.0
85.6 76.8
0.0
30.0
60.0
90.0
4Q 1Q 2Q 3Q 4Q 1Q
48.7 49.6
39.3
51.5
68.7 75.4
0
15
30
45
60
75
4Q 1Q 2Q 3Q 4Q 1Q
6.50 6.00
4.65
3.15
1.10
1.10
1.10
1.10
0.50
1.85
3.35
0.00
2.00
4.00
6.00
8.00
2015 2016 2017 2018
10
2013 2014 2015
2013 2014 2015
2013 2014 2015
70.5
96.6
143.4 156.9 167.7
251.4
315.9
355.9 369.0
0
100
200
300
400
1Q 2Q 3Q 4Q 1Q 2Q 3Q 4Q 1Q
SemGas Areas of Operation Northern Oklahoma Average Processed Volume (mmcf/d)
 Located in liquids rich oil plays
 Four processing facilities - 388 mmcf/d of current capacity
 1,300 miles of gathering lines
 Significant growth in Mississippi Lime Play
– Rose Valley II – 200 mmcf/d capacity – Expected completion mid-2015
SemGas Natural Gas Business
11
2013 2014 2015
SemCAMS Natural Gas Business
SemCAMS Areas of OperationAverage Throughput Volume (mmcf/d)
 Located in:
– Western Canadian Sedimentary Basin – sour gas
– Montney – liquids rich sour gas
– Duvernay – liquids rich sweet gas
 Current operational capacity aproximately 700 mmcf/d
 600 miles of transport and gathering lines
12
213.9
250.3
283.9 272.6 285.8
148.2
274.2
340.1
302.5
162.6
128.5
159.6
146.9
152.6
186.1
138.3
97.9
91.9
0
100
200
300
400
500
1Q 2Q 3Q 4Q 1Q 2Q 3Q 4Q 1Q
2013 2014 2015
n K3 Plant n KA Plant
376.5 378.8
419.5
443.5 438.4
334.3
412.5
438.0
394.4
Maurepas Pipeline Overview
Project
 Construct, own and operate three pipelines for Motiva Enterprises,
LLC in St. James, LA connecting Motiva's refineries
– 24-inch, 34 mile crude oil pipeline connected to LOCAP, crossing the
Mississippi River and terminating at Motiva's Norco refinery;
– 12-inch, 35 mile intermediates pipeline between Motiva's Norco and
Convent refineries; and
– 6-inch, 35 mile intermediates pipeline between Motiva's Norco and
Convent refineries; and
 This project is supported by long-term transportation agreements
with Motiva and is expected to be operational in the fourth quarter
of 2016
 The pipeline project is a significant part of an overall refinery
optimization project
Strategic Rationale
 First step in establishing a SemGroup presence in US Gulf Coast
crude markets
 Platform for future participation in the build-out of infrastructure in
the Gulf Coast
 Provides a more balanced risk profile through geographic diversity,
new customer base and potential for product expansion
 Accomplishes strategic goal of becoming more refinery facing
 Furthers SemGroup’s drop down inventory to Rose Rock
13
$265
$450
$55
58%
34%
7%
SemGroup Corporation 2015 Capital Expenditure Guidance
2015 Capital Expenditures – $775 million(1)
 More than 90% of capital expenditures
are focused on growth capital
 Targeting 5-8x EBITDA multiples on
organic growth projects in key asset
plays
 Maintenance, regulatory capital focused
on pipeline integrity and SemLogistics
tank refurbishments
n Natural Gas
n Crude
n Other Growth Projects
n Maintenance and Regulatory
1%
$5
(1) Includes Rose Rock Midstream and approximately $70 million carry-over from 2014 related to timing of spend
Excludes drop down transactions and potential future acquisitions
14
SemGroup Corporation 2015 Capital Expenditure Guidance
(1) Investments in affiliate; reflects our ownership in joint ventures
More than $1.3 Billion of Growth Capital in 2015-2016
(in millions)
Total
CapexSegment Description
Estimated
Completion
Date 2015 Capex 2016 Capex
Crude-SEMG Maurepas Pipeline 4Q 2016 260 220 500
Crude-RRMS White Cliffs Pipeline capacity expansion(1) 3Q 2015 35 5 40
Crude-RRMS Isabel Pipeline 1Q 2016 30 5 35
Crude-RRMS Platteville truck unloading expansion varies 30 — 30
Crude-RRMS Wattenberg Oil Trunkline extension 1Q 2015 30 — 30
SemGas Northern Oklahoma gas gathering & processing expansion varies 125 100 225
SemCAMS Wapiti Pipeline Expansion varies 40 10 50
SemCAMS K3 Plant projects varies 25 10 35
SemCAMS KA Plant Projects varies 45 20 65
Other/undesignated growth projects varies 100 145
Maintenance, refurbishment & regulatory 55 35
Total $775 $500-$600
15
RRMS Adjusted EBITDA(1)
(in millions)
$116
$135
$189
$287
$320-$360
$100
$200
$300
$400
2011 2012 2013 2014 2015E
$35 $40
$69
$128
$180-$200
$0
$50
$100
$150
$200
2011 2012 2013 2014 2015E
Adjusted EBITDA(1)
1Q 2015 4Q 2014 2015 Guidance
SemGroup(2) $70.0 million $83.2 million $320 - $360 million
Rose Rock Midstream(3) $42.1 million $45.1 million $180 - $200 million
First Quarter 2015 Results
(1) Non-GAAP Financial Data Reconciliations are included in the Appendix to this presentation
(2) SemGroup includes fully consolidated Rose Rock Midstream
(3) Prior period financial information has been recast to reflect the effects of the dropdown of the Wattenberg Oil Trunkline
(4) CAGR is based on the midpoint of 2015 Adjusted EBITDA Guidance
SEMG Adjusted EBITDA(1)
(in millions)
16
SemGroup First Quarter 2015 Results
(1) Non-GAAP Financial Data Reconciliations are included in the Appendix to this presentation
(2) Crude segment includes fully consolidated Rose Rock Midstream
Key Highlights (1Q 2015 vs 4Q 2014)
 Crude decreased $9.2 million
– Primarily related to a reduction in marketing margins, as marketing margins returned to a more normalized position
following an extraordinary fourth quarter, partially offset by increased cash distributions from equity investments
 SemGas decreased $3.1 million
– Higher volumes were offset by lower commodity price realizations
 SemLogistics increased $2.0 million
– Increase due to higher storage demand
 SemCAMS decreased $1.0 million
– Decrease related to lower capital fees and timing of operating expense recoveries
Segment Adjusted EBITDA(1) (in millions, unaudited) 1Q 2015 4Q 2014
Crude(2) $ 41.6 $ 50.8
SemGas 15.1 18.2
SemCAMS 8.4 9.4
SemLogistics 1.0 (1.0)
SemMaterials Mexico 5.3 4.2
SemStream 5.0 5.9
Corporate and Other (6.4) (4.3)
Total Adjusted EBITDA $ 70.0 $ 83.2
17
SemGroup Capitalization & Liquidity
Conservative leverage ratio
provides financial flexibility
Target consolidated Net Debt /
Adjusted EBITDA target of
3.5x or better
Available liquidity to fund
future growth opportunities
Pro Forma
(in millions, unaudited) March 31, 2015 March 31, 2015
SEMG - $500MM Revolver due 2018 $ 66 $ 66
SEMG – 7.500% Senior Notes due 2021 300 300
RRMS - $585MM Revolver due 2018 261 -
RRMS - 5.625% Senior Notes due 2022 400 400
RRMS - 5.625% Senior Notes due 2023 - 350
Total Consolidated Debt $ 1,027 $ 1,116
Owner's Equity 1,262 1,262
Total Book Capitalization $ 2,289 $ 2,378
Consolidated Credit Metrics
Net Debt $ 711 $ 722
Total Debt/Capitalization 45% 47%
Net Debt/Adjusted EBITDA LTM 2.5x 2.5x
Committed Liquidity
Cash and Cash Equivalents $ 316 $ 394
Revolver Availability(1)
SemGroup 430 430
Rose Rock Midstream 307 568
Total Liquidity $ 1,053 $ 1,392
(1) Availability reduced by outstanding letters of credit
18
88%
7%
5%
SemGroup’s Fee-based Business Model
Margin Contribution(1)
n Fixed Fee n Variable Fee n Marketing
Margin Descriptions
Fixed Fee
– Storage fees
– Transportation fees
– Unloading fees
– Gathering and processing fees
Variable Fee
– Gas processing – percent of proceeds
Marketing
– Back-to-back marketing transactions
Fixed Fee Variable Fee Marketing
SemGas(2) 64% 36%
SemCAMS 100%
SemLogistics 100%
SemMaterials Mexico 100%
White Cliffs Pipeline 100%
Rose Rock Midstream(3)(4) 88% 12%
19
(1) LTM March 31, 2015
(2) SemGas 1Q 2015 margin contribution 76% fixed fee, 24% variable fee
(3) Rose Rock Midstream includes White Cliffs cash distributions resulting from 34% ownership for 3 months and 51%
ownership for 9 months
(4) Marketing margin reduced by intercompany trucking expense
$0.2200
$0.2400
$0.2700
$0.3000
$0.3400
$0.3800
$0.1500
$0.2500
$0.3500
$0.4500
$0.5500
4Q 1Q 2Q 3Q 4Q 1Q 4QE
SemGroup Corporation Dividend Growth(1)
Target 30-40% Annual Dividend Growth through 2017
 Current dividend policy is to pass
through the after-tax cash distributions
received from our MLP investments
 Increased first quarter 2015 dividend by
approximately 12% over prior quarter
2013 2014 2015
2015 Target Dividend Growth 50-60% year-over-year
(1) Assumes no further drop downs or acquisitions
20
$0.3625
$0.4025
$0.4650
$0.4950
$0.5350
$0.5750
$0.6200 $0.6350
$0.2500
$0.3500
$0.4500
$0.5500
$0.6500
$0.7500
4Q 4Q 4Q 1Q 2Q 3Q 4Q 1Q 4QE
2015 Target Coverage Ratio 1.1x-1.2x
2015 Target Distribution Growth 15-20% year-over-year
Rose Rock Midstream Distribution Growth(1)
Target 15-20% Annual Distribution Growth through 2017
(1) Assumes no further drop downs or acquisitions
2011 2012 2013 2014 2015
21
APPENDIX
SemGroup Non-GAAP Adjusted EBITDA Calculation
(in thousands, unaudited) Three Months Ended
March 31, December 31,
Reconciliation of net income to Adjusted EBITDA: 2015 2014 2014
Net income $ 5,776 $ 19,738 $ 12,707
Add: Interest expense 14,591 9,227 14,650
Add: Income tax expense 4,742 16,526 12,569
Add: Deprecation and amortization expense 23,734 23,637 27,498
EBITDA 48,843 69,128 67,424
Selected Non-Cash Items and
Other Items Impacting Comparability 21,139 (1,846) 15,783
Adjusted EBITDA $ 69,982 $ 67,282 $ 83,207
Selected Non-Cash Items and
Other Items Impacting Comparability
Loss (gain) on disposal or impairment of long-lived assets, net $ 1,058 $ (58) $ 11,959
Loss (income) from discontinued operations, net of income taxes — 5 (4)
Foreign currency transaction (gain) loss (519) (683) 302
Remove NGL equity earnings including gain on issuance of common units 305 (11,718) (387)
Remove gain on sale of NGL units (7,894) — (7,463)
NGL cash distribution 5,015 5,341 5,942
M&A transaction related costs 10,000 — —
Inventory valuation adjustments including equity method investees 1,187 — 7,781
Employee severance expense — 9 101
Unrealized loss (gain) on derivative activities 2,645 606 (1,078)
Change in fair value of warrants — (980) (10,076)
Depreciation and amortization included within
equity earnings 6,376 3,450 6,404
Bankruptcy related expenses 189 216 317
Charitable contributions — — 81
Recovery of receivables written off at emergence — (364) —
Non-cash equity compensation 2,777 2,330 1,904
Selected Non-Cash items and
Other Items Impacting Comparability $ 21,139 $ (1,846) $ 15,783
23
SemGroup 2015 Adjusted EBITDA Guidance
(1) Guidance is on a cash basis for equity investments in NGL, includes fully consolidated Rose Rock Midstream
(in millions, unaudited) 2015 Guidance(1)
Mid-point
Net income $ 121.5
Add: Interest expense 64.0
Add: Income tax expense 8.0
Add: Depreciation and amortization 109.0
EBITDA $ 302.5
Selected Non-Cash and Other Items Impacting Comparability 37.5
Adjusted EBITDA $ 340.0
Selected Non-Cash and Other Items Impacting Comparability
Depreciation and amortization included within equity earnings 25.0
Non-cash equity compensation 12.5
Selected Non-Cash and Other Items Impacting Comparability $ 37.5
24
Rose Rock Midstream Non-GAAP Financial Data Reconciliations
(in thousands, unaudited) Three Months Ended
March 31, December 31,
2015 2014(1) 2014(1)
Reconciliation of operating income to Adjusted gross margin:
Operating income $ 22,606 $ 18,613 $ 23,244
Add:
Operating expense 20,951 15,215 25,696
General and administrative expense 5,620 3,747 5,033
Depreciation and amortization expense 10,143 11,482 12,882
Less:
Earnings from equity method investments 20,864 11,080 17,718
Non-cash unrealized gain (loss) on derivatives, net (2,531) (606) 965
Adjusted gross margin $ 40,987 $ 38,583 $ 48,172
Reconciliation of net income to Adjusted EBITDA:
Net income $ 14,600 $ 16,226 $ 15,091
Add:
Interest expense 8,006 2,387 8,152
Depreciation and amortization expense 10,143 11,482 12,882
Cash distributions from equity method investments 26,065 13,585 21,687
Inventory valuation adjustment 1,187 — 5,667
Non-cash equity compensation 298 260 238
Loss (gain) on disposal of long-lived assets, net 152 (34) 89
Less:
Earnings from equity method investments 20,864 11,080 17,718
White Cliffs cash distributions attributable to noncontrolling interests — 4,528 —
Impact from derivative instruments:
Total gain (loss) on derivatives, net (644) (807) 16,053
Total realized loss (gain) (cash flow) on derivatives, net (1,887) 201 (15,088)
Non-cash unrealized gain (loss) on derivatives, net (2,531) (606) 965
Adjusted EBITDA $ 42,118 $ 28,904 $ 45,123
Reconciliation of net cash provided by (used in) operating activities to
Adjusted EBITDA:
Net cash provided by (used in) operating activities $ (7,070) $ 18,187 $ 64,823
Less:
Changes in operating assets and liabilities, net (36,508) (10,613) 31,295
White Cliffs cash distributions attributable to noncontrolling interests — 4,528 —
Add:
Interest expense, excluding amortization of debt issuance costs 7,479 2,127 7,626
Distributions from equity method investments in excess of equity in
earnings 5,201 2,505 3,969
Adjusted EBITDA $ 42,118 $ 28,904 $ 45,123
(1) Prior period financial information has been recast to reflect the effects of the dropdown of the Wattenberg Oil Trunkline
25
Rose Rock Midstream 2015 Adjusted EBITDA Guidance
(in millions, unaudited) 2015 Guidance
Mid-point
Net income $ 90.5
Add: Interest expense 37.0
Add: Depreciation and amortization 45.0
EBITDA $ 172.5
Non-Cash and Other Adjustments 17.5
Adjusted EBITDA $ 190.0
Less:
Cash interest expense 34.5
Maintenance capital expenditures 16.0
Distributable cash flow $ 139.5
Non-Cash and Other Adjustments
Earnings from equity method investments $ (92.0)
Distributions from equity method investments (1) 108.0
Non-cash equity compensation 1.5
Non-Cash and Other Adjustments $ 17.5
(1) Distributions from equity method investment includes the cash distributions from White Cliffs and Glass Mountain
attributable to Rose Rock
26
(in thousands, unaudited) Year Ended
December 31, 2014
Crude SemStream SemCAMS SemLogistics SemMexico SemGas
Corporate and
other Consolidated
Net income (loss) $ 57,495 $ 70,632 $ 14,318 $ (10,072) $ 5,900 $ 6,792 $ (93,008) $ 52,057
Add: Interest expense 31,072 (5,140) 13,558 1,528 166 8,570 (710) 49,044
Add: Income tax expense (benefit) — — 3,135 (2,231) 4,053 — 41,556 46,513
Add: Depreciation and amortization expense 40,035 — 14,295 10,005 6,031 26,353 1,678 98,397
EBITDA 128,602 65,492 45,306 (770) 16,150 41,715 (50,484) 246,011
Selected Non-Cash Items and
Other Items Impacting Comparability 28,159 (42,165) 590 (1,083) 621 21,053 34,255 41,430
Adjusted EBITDA $ 156,761 $ 23,327 $ 45,896 $ (1,853) $ 16,771 $ 62,768 $ (16,229) $ 287,441
Selected Non-Cash Items and Other Items Impacting Comparability
Loss (gain) on disposal of long-lived assets, net $ 319 $ — $ (950) $ (2,490) $ (53) $ 20,092 $ 15,674 $ 32,592
Loss (income) from discontinued operations, net of income taxes — — — (1) — — 2 1
Foreign currency transaction (gain) loss — — 42 821 279 — (1,228) (86)
Remove NGL equity earnings including gain on issuance of common
units — (31,363) — — — — — (31,363)
Remove gain on sale of NGL units (34,211) (34,211)
NGL cash distribution — 23,404 — — — — — 23,404
Employee severance expense 9 — 150 — — 41 20 220
Unrealized gain on derivative activities (1,734) — — — — — — (1,734)
Change in fair value of warrants — — — — — — 13,423 13,423
Depreciation and amortization included within
equity earnings 18,992 — — — — — — 18,992
Inventory valuation adjustment including equity method investees 7,781 — — — — — — 7,781
Recovery of receivables written off at emergence — — (664) — — — — (664)
Bankruptcy related expenses — 1 — — — 150 1,159 1,310
Charitable contributions — — — — — — 3,379 3,379
Non-cash equity compensation 2,792 4 2,012 587 395 770 1,826 8,386
Selected Non-Cash Items and
Other Items Impacting Comparability $ 28,159 $ (42,165) $ 590 $ (1,083) $ 621 $ 21,053 $ 34,255 $ 41,430
SemGroup Reconciliation of Net Income to Adjusted EBITDA
27
(in thousands, unaudited) Year Ended
December 31, 2013
Crude SemStream SemCAMS SemLogistics SemMexico SemGas
Corporate and
other Consolidated
Net income (loss) $ 57,228 $ 38,071 $ (3,136) $ (6,769) $ 5,377 $ 14,701 $ (39,660) $ 65,812
Add: Interest expense 14,923 (4,810) 18,928 1,435 188 3,268 (8,790) 25,142
Add: Income tax expense (benefit) — — 6,348 (5,699) 2,589 — (20,492) (17,254)
Add: Depreciation and amortization expense 23,708 — 10,766 9,426 5,991 14,517 2,001 66,409
EBITDA 95,859 33,261 32,906 (1,607) 14,145 32,486 (66,941) 140,109
Selected Non-Cash Items and
Other Items Impacting Comparability 10,764 (15,624) 1,180 111 (722) 1,221 51,979 48,909
Adjusted EBITDA $ 106,623 $ 17,637 $ 34,086 $ (1,496) $ 13,423 $ 33,707 $ (14,962) $ 189,018
Selected Non-Cash Items and Other Items Impacting Comparability
Loss (gain) on disposal of long-lived assets, net $ (56) $ 6 $ — $ — $ (854) $ 665 $ — $ (239)
Income from discontinued operations, net of income taxes — — — — — — (59) (59)
Foreign currency transaction (gain) loss — — (23) (391) (177) — (1,042) (1,633)
Remove NGL equity earnings — (33,996) — — — — — (33,996)
NGL cash distribution — 18,321 — — — — — 18,321
Mid-America Midstream Gas Services acquisition cost — — — — — — 3,600 3,600
Employee severance expense 5 — — — — — 33 38
Unrealized gain on derivative activities (974) — — — — — — (974)
Change in fair value of warrants — — — — — — 46,434 46,434
Depreciation and amortization included within
equity in earnings of White Cliffs 9,520 — — — — — — 9,520
Bankruptcy related expenses — — — — — — 567 567
Non-cash equity compensation 2,269 45 1,203 502 309 556 2,446 7,330
Selected Non-Cash Items and
Other Items Impacting Comparability $ 10,764 $ (15,624) $ 1,180 $ 111 $ (722) $ 1,221 $ 51,979 $ 48,909
SemGroup Reconciliation of Net Income to Adjusted EBITDA
28
(in thousands, unaudited) Year Ended
December 31, 2012
Crude SemStream SemCAMS SemLogistics SemMexico SemGas
Corporate and
other Consolidated
Net income (loss) $ 64,554 $ 4,919 $ 4,097 $ (3,552) $ 1,467 $ (264) $ (39,324) $ 31,897
Add: Interest expense (409) (3,449) 18,727 2,486 314 1,461 (10,228) 8,902
Add: Income tax expense (benefit) — — 720 (7,736) 2,285 — 2,653 (2,078)
Add: Depreciation and amortization expense 12,131 — 10,589 9,780 6,171 7,043 2,496 48,210
EBITDA 76,276 1,470 34,133 978 10,237 8,240 (44,403) 86,931
Selected Non-Cash Items and
Other Items Impacting Comparability 9,532 6,952 50 514 121 629 30,236 48,034
Adjusted EBITDA $ 85,808 $ 8,422 $ 34,183 $ 1,492 $ 10,358 $ 8,869 $ (14,167) $ 134,965
Selected Non-Cash Items and Other Items Impacting Comparability
Loss (gain) on disposal of long-lived assets, net $ (3,501) $ 214 $ — $ — $ (290) $ 46 $ — $ (3,531)
Loss (income) from discontinued operations, net of income taxes — (2,985) — 14 — — 32 (2,939)
Foreign currency transaction (gain) loss — — 26 (370) 190 — 452 298
Remove NGL equity earnings — 403 — — — — — 403
NGL cash distribution — 9,218 — — — — — 9,218
Employee severance expense — — — 159 — — 195 354
Unrealized loss on derivative activities 1,196 — — — — — — 1,196
Change in fair value of warrants — — — — — — 21,310 21,310
Depreciation and amortization included within
equity in earnings of White Cliffs 10,181 — — — — — — 10,181
Defense costs — — — — — — 5,899 5,899
Recovery of receivables written off at emergence — — (858) — — — — (858)
Non-cash equity compensation 1,656 102 882 711 221 583 2,348 6,503
Selected Non-Cash Items and
Other Items Impacting Comparability $ 9,532 $ 6,952 $ 50 $ 514 $ 121 $ 629 $ 30,236 $ 48,034
SemGroup Reconciliation of Net Income to Adjusted EBITDA
29
(in thousands, unaudited) Year Ended
December 31, 2011
Crude SemStream SemCAMS SemLogistics SemMexico SemGas
Corporate and
other Consolidated
Net income (loss) $ 39,241 $ 16,752 $ 2,868 $ (41,440) $ 2,430 $ 6,308 $ (23,347) $ 2,812
Add: Interest expense 3,749 17,152 24,685 1,005 365 2,346 10,836 60,138
Add: Income tax expense (benefit) — — 552 (3,331) 629 — (160) (2,310)
Add: Depreciation and amortization expense 11,379 3,501 10,233 9,271 6,502 5,986 2,951 49,823
EBITDA 54,369 37,405 38,338 (34,495) 9,926 14,640 (9,720) 110,463
Selected Non-Cash Items and
Other Items Impacting Comparability 8,293 (48,513) (2,296) 45,283 57 452 1,806 5,082
Adjusted EBITDA $ 62,662 $ (11,108) $ 36,042 $ 10,788 $ 9,983 $ 15,092 $ (7,914) $ 115,545
Selected Non-Cash Items and Other Items Impacting Comparability
Loss (gain) on disposal of long-lived assets, net $ 64 $ (45,821) $ (8) $ 44,663 $ (200) $ 4 $ 1,599 $ 301
Loss (income) from discontinued operations, net of income taxes (1) — 9,644 — 30 — — (126) 9,548
Foreign currency transaction (gain) loss — 39 (2,674) 88 18 — (921) (3,450)
Employee severance expense — — 3,855 131 — — 388 4,374
Unrealized gain on derivative activities (787) (13,247) — — — — (80) (14,114)
Change in fair value of warrants — — — — — — (5,012) (5,012)
Reversal of allowance on goods and services tax receivable — — (4,144) — — — — (4,144)
Depreciation and amortization included within
equity in earnings of White Cliffs 10,630 — — — — — — 10,630
Defense costs — — — — — — 1,000 1,000
Recovery of receivables written off at emergence (2,692) — — — — — — (2,692)
Non-cash equity compensation 1,078 872 675 371 239 448 4,958 8,641
Selected Non-Cash Items and
Other Items Impacting Comparability $ 8,293 $ (48,513) $ (2,296) $ 45,283 $ 57 $ 452 $ 1,806 $ 5,082
SemGroup Reconciliation of Net Income to Adjusted EBITDA
(1) SemStream Arizona has been reported as a discontinued operation at December 31, 2012.
Prior periods have been recast to conform with the presentation.
30
(in thousands, unaudited) Year Ended
December 31,
2014(1) 2013 2012 2011
Net income $ 62,925 $ 37,515 $ 23,954 $ 23,235
Add:
Interest expense 21,279 8,181 1,912 1,823
Depreciation and amortization expense 40,035 23,708 12,131 11,379
Distributions from equity method investment 66,768 16,999 — —
Inventory valuation adjustment 5,667 — — —
Non-cash equity compensation 943 806 308 —
Loss (gain) on disposal of long-lived assets, net 319 (31) (1) 64
Provision for (recovery of) uncollectible accounts receivable — — — (916)
Less:
Earnings from equity method investment 57,378 17,571 — —
White Cliffs cash distributions attributable to noncontrolling
interests 11,008 — — —
Impact from derivative instruments:
Total gain (loss) on derivatives, net 17,351 (1,593) 149 (386)
Total realized (gain) loss (cash outflow) on derivatives, net (15,730) 2,567 (1,345) 1,173
Non-cash unrealized gain (loss) on derivatives, net 1,621 974 (1,196) 787
Adjusted EBITDA $ 127,929 $ 68,633 $ 39,500 $ 34,798
Rose Rock Reconciliation of Net Income to Adjusted EBITDA
(1) Prior period financial information has been recast to reflect the effects of the dropdown of the Wattenberg Oil Trunkline
31
Rose Rock Reconciliation of Net Cash Provided by Operating Activities to Adjusted EBITDA
(in thousands, unaudited) Year Ended
December 31,
2014(1) 2013 2012 2011
Net cash provided by operating activities $ 111,093 $ 72,528 $ 35,097 $ 51,085
Less:
Changes in operating assets and liabilities, net 1,296 11,265 (2,850) 18,082
White Cliffs cash distributions attributable to noncontrolling interests 11,008 — — —
Add:
Interest expense, excluding amortization of debt issuance costs 19,750 7,370 1,553 1,795
Distributions in excess of equity earnings of affiliates 9,390 — — —
Adjusted EBITDA $ 127,929 $ 68,633 $ 39,500 $ 34,798
(1) Prior period financial information has been recast to reflect the effects of the dropdown of the Wattenberg Oil Trunkline
32

More Related Content

What's hot

Sem group investor presentation february 2017 final
Sem group investor presentation february 2017 finalSem group investor presentation february 2017 final
Sem group investor presentation february 2017 final
SemGroupCorporation
 
Sem group investor presentation august 2017 final
Sem group investor presentation august 2017 finalSem group investor presentation august 2017 final
Sem group investor presentation august 2017 final
SemGroupCorporation
 
Sem group earnings presentation q3 2016 final
Sem group earnings presentation q3 2016 finalSem group earnings presentation q3 2016 final
Sem group earnings presentation q3 2016 final
SemGroupCorporation
 
Sem group earnings presentation 3q 2017 final
Sem group earnings presentation 3q 2017 finalSem group earnings presentation 3q 2017 final
Sem group earnings presentation 3q 2017 final
SemGroupCorporation
 
Sem group investor presentation november 2017 final
Sem group investor presentation november 2017 finalSem group investor presentation november 2017 final
Sem group investor presentation november 2017 final
SemGroupCorporation
 
January 2017 investor presentation final
January 2017 investor presentation finalJanuary 2017 investor presentation final
January 2017 investor presentation final
SemGroupCorporation
 
Sem group earnings presentation 2q 2017 final
Sem group earnings presentation 2q 2017 finalSem group earnings presentation 2q 2017 final
Sem group earnings presentation 2q 2017 final
SemGroupCorporation
 
SemGroup Earnings Presentation First Quarter 2017
SemGroup Earnings Presentation First Quarter 2017 SemGroup Earnings Presentation First Quarter 2017
SemGroup Earnings Presentation First Quarter 2017
SemGroupCorporation
 
Sem group earnings presentation 3q 2017 final
Sem group earnings presentation 3q 2017 finalSem group earnings presentation 3q 2017 final
Sem group earnings presentation 3q 2017 final
SemGroupCorporation
 
Sem group investor presentation march 2018 final
Sem group investor presentation march 2018 finalSem group investor presentation march 2018 final
Sem group investor presentation march 2018 final
SemGroupCorporation
 
Sem group investor presentation may 2018 final
Sem group investor presentation may 2018 finalSem group investor presentation may 2018 final
Sem group investor presentation may 2018 final
SemGroupCorporation
 
Sem group earnings presentation q2 2016 final
Sem group earnings presentation q2 2016 finalSem group earnings presentation q2 2016 final
Sem group earnings presentation q2 2016 final
SemGroupCorporation
 
Sem group earnings presentation 4q and fy 2017 final
Sem group earnings presentation 4q and fy 2017 finalSem group earnings presentation 4q and fy 2017 final
Sem group earnings presentation 4q and fy 2017 final
SemGroupCorporation
 
Crestwood investor deck january 2018
Crestwood investor deck january 2018Crestwood investor deck january 2018
Crestwood investor deck january 2018
CrestwoodCorporate
 
3 q 2016 investor presentation final_hr
3 q 2016 investor presentation final_hr3 q 2016 investor presentation final_hr
3 q 2016 investor presentation final_hr
SemGroupCorporation
 
Hfotco investor tour presentation final web
Hfotco investor tour presentation final webHfotco investor tour presentation final web
Hfotco investor tour presentation final web
SemGroupCorporation
 
Sem group investor presentation august 2018 final
Sem group investor presentation august 2018 finalSem group investor presentation august 2018 final
Sem group investor presentation august 2018 final
SemGroupCorporation
 
SEMG and RRMS Release 4Q 2014 Results
SEMG and RRMS Release 4Q 2014 ResultsSEMG and RRMS Release 4Q 2014 Results
SEMG and RRMS Release 4Q 2014 Results
SemGroup
 
3 q final
3 q final3 q final
3 q final
Metaldyne
 

What's hot (19)

Sem group investor presentation february 2017 final
Sem group investor presentation february 2017 finalSem group investor presentation february 2017 final
Sem group investor presentation february 2017 final
 
Sem group investor presentation august 2017 final
Sem group investor presentation august 2017 finalSem group investor presentation august 2017 final
Sem group investor presentation august 2017 final
 
Sem group earnings presentation q3 2016 final
Sem group earnings presentation q3 2016 finalSem group earnings presentation q3 2016 final
Sem group earnings presentation q3 2016 final
 
Sem group earnings presentation 3q 2017 final
Sem group earnings presentation 3q 2017 finalSem group earnings presentation 3q 2017 final
Sem group earnings presentation 3q 2017 final
 
Sem group investor presentation november 2017 final
Sem group investor presentation november 2017 finalSem group investor presentation november 2017 final
Sem group investor presentation november 2017 final
 
January 2017 investor presentation final
January 2017 investor presentation finalJanuary 2017 investor presentation final
January 2017 investor presentation final
 
Sem group earnings presentation 2q 2017 final
Sem group earnings presentation 2q 2017 finalSem group earnings presentation 2q 2017 final
Sem group earnings presentation 2q 2017 final
 
SemGroup Earnings Presentation First Quarter 2017
SemGroup Earnings Presentation First Quarter 2017 SemGroup Earnings Presentation First Quarter 2017
SemGroup Earnings Presentation First Quarter 2017
 
Sem group earnings presentation 3q 2017 final
Sem group earnings presentation 3q 2017 finalSem group earnings presentation 3q 2017 final
Sem group earnings presentation 3q 2017 final
 
Sem group investor presentation march 2018 final
Sem group investor presentation march 2018 finalSem group investor presentation march 2018 final
Sem group investor presentation march 2018 final
 
Sem group investor presentation may 2018 final
Sem group investor presentation may 2018 finalSem group investor presentation may 2018 final
Sem group investor presentation may 2018 final
 
Sem group earnings presentation q2 2016 final
Sem group earnings presentation q2 2016 finalSem group earnings presentation q2 2016 final
Sem group earnings presentation q2 2016 final
 
Sem group earnings presentation 4q and fy 2017 final
Sem group earnings presentation 4q and fy 2017 finalSem group earnings presentation 4q and fy 2017 final
Sem group earnings presentation 4q and fy 2017 final
 
Crestwood investor deck january 2018
Crestwood investor deck january 2018Crestwood investor deck january 2018
Crestwood investor deck january 2018
 
3 q 2016 investor presentation final_hr
3 q 2016 investor presentation final_hr3 q 2016 investor presentation final_hr
3 q 2016 investor presentation final_hr
 
Hfotco investor tour presentation final web
Hfotco investor tour presentation final webHfotco investor tour presentation final web
Hfotco investor tour presentation final web
 
Sem group investor presentation august 2018 final
Sem group investor presentation august 2018 finalSem group investor presentation august 2018 final
Sem group investor presentation august 2018 final
 
SEMG and RRMS Release 4Q 2014 Results
SEMG and RRMS Release 4Q 2014 ResultsSEMG and RRMS Release 4Q 2014 Results
SEMG and RRMS Release 4Q 2014 Results
 
3 q final
3 q final3 q final
3 q final
 

Similar to 2015 Q1 Investor Presentation

Sem group earnings-presentation-1q-2017-final
Sem group earnings-presentation-1q-2017-finalSem group earnings-presentation-1q-2017-final
Sem group earnings-presentation-1q-2017-final
SemGroupCorporation
 
Sem group investor-presentation-march-2018-final
Sem group investor-presentation-march-2018-finalSem group investor-presentation-march-2018-final
Sem group investor-presentation-march-2018-final
SemGroupCorporation
 
Sem group investor presentation august 2017 final
Sem group investor presentation august 2017 finalSem group investor presentation august 2017 final
Sem group investor presentation august 2017 final
SemGroupCorporation
 
SEMG & RRMS 1Q 2016 Results
SEMG & RRMS 1Q 2016 ResultsSEMG & RRMS 1Q 2016 Results
SEMG & RRMS 1Q 2016 Results
Kiley Roberson
 
SemGroup Q1 2016 Earnings Presentation
SemGroup Q1 2016 Earnings PresentationSemGroup Q1 2016 Earnings Presentation
SemGroup Q1 2016 Earnings Presentation
SemGroupCorporation
 
Sem group earnings presentation 1q 2018 final
Sem group earnings presentation 1q 2018 finalSem group earnings presentation 1q 2018 final
Sem group earnings presentation 1q 2018 final
SemGroupCorporation
 
Sem cams investor presentation master september 2018 final
Sem cams investor presentation master september 2018 finalSem cams investor presentation master september 2018 final
Sem cams investor presentation master september 2018 final
SemGroupCorporation
 
Sem group earnings presentation 3q 2018 final (2)
Sem group earnings presentation 3q 2018 final (2)Sem group earnings presentation 3q 2018 final (2)
Sem group earnings presentation 3q 2018 final (2)
SemGroupCorporation
 
Sem group earnings presentation 3q 2018 final
Sem group earnings presentation 3q 2018 finalSem group earnings presentation 3q 2018 final
Sem group earnings presentation 3q 2018 final
SemGroupCorporation
 
Sem group investor presentation 3q 2018 final
Sem group investor presentation 3q 2018 finalSem group investor presentation 3q 2018 final
Sem group investor presentation 3q 2018 final
SemGroupCorporation
 
Sem group earnings presentation 2q 2018 final
Sem group earnings presentation 2q 2018 finalSem group earnings presentation 2q 2018 final
Sem group earnings presentation 2q 2018 final
SemGroupCorporation
 
Sem group investor presentation september 2018 final
Sem group investor presentation september 2018 finalSem group investor presentation september 2018 final
Sem group investor presentation september 2018 final
SemGroupCorporation
 
3Q-2016-Investor-Presentation_Final_HR
3Q-2016-Investor-Presentation_Final_HR3Q-2016-Investor-Presentation_Final_HR
3Q-2016-Investor-Presentation_Final_HRErick Jimenez
 
January-2017-Investor-Presentation-FINAL
January-2017-Investor-Presentation-FINALJanuary-2017-Investor-Presentation-FINAL
January-2017-Investor-Presentation-FINALErick Jimenez
 
Sem group earnings presentation 4q & full year-2018_final
Sem group earnings presentation 4q & full year-2018_finalSem group earnings presentation 4q & full year-2018_final
Sem group earnings presentation 4q & full year-2018_final
SemGroupCorporation
 

Similar to 2015 Q1 Investor Presentation (15)

Sem group earnings-presentation-1q-2017-final
Sem group earnings-presentation-1q-2017-finalSem group earnings-presentation-1q-2017-final
Sem group earnings-presentation-1q-2017-final
 
Sem group investor-presentation-march-2018-final
Sem group investor-presentation-march-2018-finalSem group investor-presentation-march-2018-final
Sem group investor-presentation-march-2018-final
 
Sem group investor presentation august 2017 final
Sem group investor presentation august 2017 finalSem group investor presentation august 2017 final
Sem group investor presentation august 2017 final
 
SEMG & RRMS 1Q 2016 Results
SEMG & RRMS 1Q 2016 ResultsSEMG & RRMS 1Q 2016 Results
SEMG & RRMS 1Q 2016 Results
 
SemGroup Q1 2016 Earnings Presentation
SemGroup Q1 2016 Earnings PresentationSemGroup Q1 2016 Earnings Presentation
SemGroup Q1 2016 Earnings Presentation
 
Sem group earnings presentation 1q 2018 final
Sem group earnings presentation 1q 2018 finalSem group earnings presentation 1q 2018 final
Sem group earnings presentation 1q 2018 final
 
Sem cams investor presentation master september 2018 final
Sem cams investor presentation master september 2018 finalSem cams investor presentation master september 2018 final
Sem cams investor presentation master september 2018 final
 
Sem group earnings presentation 3q 2018 final (2)
Sem group earnings presentation 3q 2018 final (2)Sem group earnings presentation 3q 2018 final (2)
Sem group earnings presentation 3q 2018 final (2)
 
Sem group earnings presentation 3q 2018 final
Sem group earnings presentation 3q 2018 finalSem group earnings presentation 3q 2018 final
Sem group earnings presentation 3q 2018 final
 
Sem group investor presentation 3q 2018 final
Sem group investor presentation 3q 2018 finalSem group investor presentation 3q 2018 final
Sem group investor presentation 3q 2018 final
 
Sem group earnings presentation 2q 2018 final
Sem group earnings presentation 2q 2018 finalSem group earnings presentation 2q 2018 final
Sem group earnings presentation 2q 2018 final
 
Sem group investor presentation september 2018 final
Sem group investor presentation september 2018 finalSem group investor presentation september 2018 final
Sem group investor presentation september 2018 final
 
3Q-2016-Investor-Presentation_Final_HR
3Q-2016-Investor-Presentation_Final_HR3Q-2016-Investor-Presentation_Final_HR
3Q-2016-Investor-Presentation_Final_HR
 
January-2017-Investor-Presentation-FINAL
January-2017-Investor-Presentation-FINALJanuary-2017-Investor-Presentation-FINAL
January-2017-Investor-Presentation-FINAL
 
Sem group earnings presentation 4q & full year-2018_final
Sem group earnings presentation 4q & full year-2018_finalSem group earnings presentation 4q & full year-2018_final
Sem group earnings presentation 4q & full year-2018_final
 

Recently uploaded

Osisko Gold Royalties Ltd - Corporate Presentation, June 2024
Osisko Gold Royalties Ltd - Corporate Presentation, June 2024Osisko Gold Royalties Ltd - Corporate Presentation, June 2024
Osisko Gold Royalties Ltd - Corporate Presentation, June 2024
Osisko Gold Royalties Ltd
 
一比一原版(UW毕业证)华盛顿大学毕业证成绩单专业办理
一比一原版(UW毕业证)华盛顿大学毕业证成绩单专业办理一比一原版(UW毕业证)华盛顿大学毕业证成绩单专业办理
一比一原版(UW毕业证)华盛顿大学毕业证成绩单专业办理
ybout
 
Snam 2023-27 Industrial Plan - Financial Presentation
Snam 2023-27 Industrial Plan - Financial PresentationSnam 2023-27 Industrial Plan - Financial Presentation
Snam 2023-27 Industrial Plan - Financial Presentation
Valentina Ottini
 
2024-deutsche-bank-global-consumer-conference.pdf
2024-deutsche-bank-global-consumer-conference.pdf2024-deutsche-bank-global-consumer-conference.pdf
2024-deutsche-bank-global-consumer-conference.pdf
Sysco_Investors
 
Osisko Development - Investor Presentation - June 24
Osisko Development - Investor Presentation - June 24Osisko Development - Investor Presentation - June 24
Osisko Development - Investor Presentation - June 24
Philip Rabenok
 
Corporate Presentation Probe June 2024.pdf
Corporate Presentation Probe June 2024.pdfCorporate Presentation Probe June 2024.pdf
Corporate Presentation Probe June 2024.pdf
Probe Gold
 
Collective Mining | Corporate Presentation - June 2024
Collective Mining | Corporate Presentation - June 2024Collective Mining | Corporate Presentation - June 2024
Collective Mining | Corporate Presentation - June 2024
CollectiveMining1
 

Recently uploaded (7)

Osisko Gold Royalties Ltd - Corporate Presentation, June 2024
Osisko Gold Royalties Ltd - Corporate Presentation, June 2024Osisko Gold Royalties Ltd - Corporate Presentation, June 2024
Osisko Gold Royalties Ltd - Corporate Presentation, June 2024
 
一比一原版(UW毕业证)华盛顿大学毕业证成绩单专业办理
一比一原版(UW毕业证)华盛顿大学毕业证成绩单专业办理一比一原版(UW毕业证)华盛顿大学毕业证成绩单专业办理
一比一原版(UW毕业证)华盛顿大学毕业证成绩单专业办理
 
Snam 2023-27 Industrial Plan - Financial Presentation
Snam 2023-27 Industrial Plan - Financial PresentationSnam 2023-27 Industrial Plan - Financial Presentation
Snam 2023-27 Industrial Plan - Financial Presentation
 
2024-deutsche-bank-global-consumer-conference.pdf
2024-deutsche-bank-global-consumer-conference.pdf2024-deutsche-bank-global-consumer-conference.pdf
2024-deutsche-bank-global-consumer-conference.pdf
 
Osisko Development - Investor Presentation - June 24
Osisko Development - Investor Presentation - June 24Osisko Development - Investor Presentation - June 24
Osisko Development - Investor Presentation - June 24
 
Corporate Presentation Probe June 2024.pdf
Corporate Presentation Probe June 2024.pdfCorporate Presentation Probe June 2024.pdf
Corporate Presentation Probe June 2024.pdf
 
Collective Mining | Corporate Presentation - June 2024
Collective Mining | Corporate Presentation - June 2024Collective Mining | Corporate Presentation - June 2024
Collective Mining | Corporate Presentation - June 2024
 

2015 Q1 Investor Presentation

  • 2. Forward-looking Information 2 Certain matters contained in this presentation include "forward-looking statements" within the meaning of Section 27A of the Securities Act of 1933, as amended, and Section 21E of the Securities Exchange Act of 1934, as amended. We make these forward-looking statements in reliance on the safe harbor protections provided under the Private Securities Litigation Reform Act of 1995. All statements, other than statements of historical fact, included in this presentation including the prospects of our industry, our anticipated financial performance, our anticipated annual dividend growth rate, management's plans and objectives for future operations, planned capital expenditures, business prospects, outcome of regulatory proceedings, market conditions and other matters, may constitute forward-looking statements. Although we believe that the expectations reflected in these forward-looking statements are reasonable, we cannot assure you that these expectations will prove to be correct. These forward-looking statements are subject to certain known and unknown risks and uncertainties, as well as assumptions that could cause actual results to differ materially from those reflected in these forward-looking statements. Factors that might cause actual results to differ include, but are not limited to, our ability to generate sufficient cash flow from operations to enable us to pay our debt obligations or to fund our other liquidity needs; our ability to comply with the covenants contained in the instruments governing our indebtedness and to maintain certain financial ratios required by our credit facilities; the effect of our debt level on our future financial and operating flexibility, including our ability to obtain additional capital; the ability of our subsidiary, Rose Rock Midstream L.P. (NYSE: RRMS), to make minimum quarterly distributions; the operations of NGL Energy Partners LP (NYSE: NGL), which we do not control; any sustained reduction in demand for the petroleum products we gather, transport, process and store; our ability to obtain new sources of supply of petroleum products; our failure to comply with new or existing environmental laws or regulations or cross border laws or regulations; the possibility that the construction or acquisition of new assets may not result in the corresponding anticipated revenue increases; changes in currency exchange rates; cyber attacks involving our information systems and related infrastructure; the risks and uncertainties of doing business outside of the U.S., including political and economic instability and changes in local governmental laws, regulations and policies; and the possibility that our hedging activities may result in losses or may have a negative impact on our financial results; as well as other risk factors discussed from time to time in each of our documents and reports filed with the SEC. Readers are cautioned not to place undue reliance on any forward-looking statements contained in this presentation which reflect management's opinions only as of the date hereof. Except as required by law, we undertake no obligation to revise or publicly release the results of any revision to any forward-looking statements. SemGroup and Rose Rock Midstream use their Investor Relations website and social media outlets as channels of distribution of material company information. Such information is routinely posted and accessible on our Investor Relations websites at ir.semgroupcorp.com and ir.rrmidstream.com. Both companies are present on Twitter and LinkedIn, follow us at the links below: SemGroup Twitter and LinkedIn Rose Rock Midstream Twitter and LinkedIn
  • 3. Non-GAAP Financial Measures 3 SemGroup Adjusted EBITDA is presented in this presentation for certain periods. Adjusted EBITDA is not a U.S. generally accepted accounting principles (“GAAP”) measure and is not intended to be used in lieu of a GAAP presentation of net income (loss). Adjusted EBITDA is presented in this presentation because SemGroup believes it provides additional information with respect to its performance. Adjusted EBITDA represents earnings before interest, taxes, depreciation and amortization, adjusted for selected items that SemGroup believes impact the comparability of financial results between reporting periods. Although SemGroup presents selected items that it considers in evaluating its performance, you should also be aware that the items presented do not represent all items that affect comparability between the periods presented. Variations in SemGroup’s operating results are also caused by changes in volumes, prices, exchange rates, mechanical interruptions and numerous other factors. These types of variances are not separately identified in this presentation. Because all companies do not use identical calculations, SemGroup’s presentation of Adjusted EBITDA may be different from similarly titled measures of other companies, thereby diminishing its utility. Reconciliations of net income (loss) to Adjusted EBITDA for the periods presented are included in the appendix of this presentation. Rose Rock Midstream This presentation includes the non-GAAP financial measures of Adjusted gross margin, Adjusted EBITDA and distributable cash flow, which may be used periodically by management when discussing our financial results with investors and analysts. The appendix of this presentation provides reconciliations of these non-GAAP financial measures to their most directly comparable financial measures calculated and presented in accordance with GAAP. Adjusted gross margin, Adjusted EBITDA and distributable cash flow are presented as management believes they provide additional information and metrics relative to the performance of our business. Operating income (loss) is the GAAP measure most directly comparable to Adjusted gross margin, net income (loss) and cash provided by (used in) operating activities are the GAAP measures most directly comparable to Adjusted EBITDA, and net income (loss) is the GAAP measure most directly comparable to distributable cash flow. Our non-GAAP financial measures should not be considered as alternatives to the most directly comparable GAAP financial measures. These non-GAAP financial measures have important limitations as analytical tools because they exclude some, but not all, items that affect the most directly comparable GAAP financial measures. You should not consider Adjusted gross margin, Adjusted EBITDA or distributable cash flow in isolation or as substitutes for analysis of our results as reported under GAAP. Because Adjusted gross margin, Adjusted EBITDA and distributable cash flow may be defined differently by other companies in our industry, our definitions of these non-GAAP financial measures may not be comparable to similarly titled measures of other companies, thereby diminishing their utility. Management compensates for the limitation of Adjusted gross margin, Adjusted EBITDA and distributable cash flow as analytical tools by reviewing the comparable GAAP measures, understanding the differences between Adjusted gross margin, Adjusted EBITDA and distributable cash flow, on the one hand, and operating income (loss), net income (loss) and net cash provided by (used in) operating activities, on the other hand, and incorporating this knowledge into its decision-making processes. We believe that investors benefit from having access to the same financial measures that our management uses in evaluating our operating results.
  • 4. Two Public Companies Note: Enterprise Value, Market Cap, Unit/Share Price and Yield as of May 1, 2015. Balance sheet data as of March 31, 2015  C-Corp – assets in US, Canada, Mexico & UK  General Partner of RRMS  Publicly Traded – November 2010 Shares: 43.9 million Enterprise Value: $4.5 billion Market Cap: $3.7 billion Share Price: $85.24 Yield: 1.8% Current Annualized Dividend: $1.52 Total Assets: $2.9 billion PP&E: $1.3 billion  Master Limited Partnership (MLP)  IPO – December 2011 Units: 36.8 million Enterprise Value: $2.6 billion Market Cap: $1.9 billion Unit Price: $52.00 Yield: 4.9% Current Annualized Distribution: $2.54 Total Assets: $1.2 billion PP&E: $405 million SemGroup Corporation Rose Rock Midstream 4
  • 5. SemGroup Ownership Structure Note: NGL Common Units are as of April 23, 2015 5
  • 6. Business Strategy Risk Management Mitigate commodity price exposure Maintain financial flexibility and utilize leverage prudently Quality Cash Flows Generate consistent earnings and cash flows Focus on fee-based activities Focused Growth Capitalize on organic growth opportunities with existing and new assets Grow our business through strategic and accretive asset acquisitions 6
  • 7. Crude and Gas Assets in Key Growth Areas 7
  • 8. Crude Business Overview White Cliffs Pipeline – 51% ownership  DJ Basin to Cushing, OK  Two 527-mile, 12-inch pipelines  150,000 bpd current capacity  Expanding capacity to approximately 215,000 bpd – Expected completion 3Q 2015 Wattenberg Oil Trunkline  75-mile, 12-inch pipeline and storage in DJ Basin  Transports Noble Energy production to White Cliffs Platteville Truck Unloading Facility  16-lane truck unloading facility  Origin of White Cliffs Pipeline  230,000 barrels of storage capacity  4 new truck unloading bays and 100,000 barrels of additional storage – Expected completion summer 2015  10 new truck unloading bays – Expected completion 4Q 2015 Tampa Pipeline  12-mile, 12-inch pipeline from Platteville to Tampa, CO rail facility  Constructed a new 5-mile lateral pipeline extension DJ Basin 8
  • 9. Crude Business Overview Cushing Storage  7.6 million barrels of storage  86% under long-term fixed fee contracts with first expiration 2016  2014 average storage rate of $0.37 per month  Connectivity to all major inbound/outbound pipelines Kansas/Oklahoma System  Approximately 600-mile gathering and transportation pipeline system  Currently operating at full capacity  Connects to third-party pipelines, Kansas and Oklahoma refineries and Cushing terminal  620,000 barrels of storage capacity Oklahoma/Kansas Assets Field Services Crude Oil Trucking Fleet  Fleet of more than 250 crude oil trucks  Servicing the Bakken, DJ/Niobrara, Eagle Ford, Granite Wash, Mississippi Lime, Permian, San Juan and Utica plays 9 Glass Mountain Pipeline – 50% ownership  215-mile pipeline  Two laterals – Granite Wash and Mississippi Lime Play join and terminate in Cushing  140,000 bpd current capacity
  • 10. Crude Key Performance Metrics (1) 100% of storage contract volumes are included in year of contract expiration (2) Pipeline volumes include KS/OK system, ND transportation and Tampa pipeline (3) White Cliffs Pipeline is currently owned 51% by RRMS; 100% throughput (4) Glass Mountain Pipeline is owned 50% by RRMS; average volumes for 1Q 2014 reflects two months operational; 100% throughput Crude Transportation Volumes (Thousand Barrels per Day) Crude Marketing Volumes (Thousand Barrels per Day) n Pipeline Volumes(2) n White Cliffs PL(3) n Wattenberg Oil Trunkline n Glass Mountain PL(4) Crude Cushing Storage 7.6 million Barrels Capacity 6.50 6.00 4.40 2.90 Field Services Transportation Volumes (Thousand Barrels per Day) n Contracted(1) n Operational / Marketing n Uncontracted 1.10 1.10 1.10 1.10 3.60 2.10 28.526.6 31.2 35.2 57.1 67.3 64.9 65.2 71.8 65.3 77.4 72.7 74.1 98.5 118.4 139.2 11.0 26.6 28.5 31.2 35.2 45.8 43.7 61.7 61.1 65.2 64.9 0 50 100 150 200 250 300 4Q 1Q 2Q 3Q 4Q 1Q 30.9 42.7 46.1 75.0 85.6 76.8 0.0 30.0 60.0 90.0 4Q 1Q 2Q 3Q 4Q 1Q 48.7 49.6 39.3 51.5 68.7 75.4 0 15 30 45 60 75 4Q 1Q 2Q 3Q 4Q 1Q 6.50 6.00 4.65 3.15 1.10 1.10 1.10 1.10 0.50 1.85 3.35 0.00 2.00 4.00 6.00 8.00 2015 2016 2017 2018 10 2013 2014 2015 2013 2014 2015 2013 2014 2015
  • 11. 70.5 96.6 143.4 156.9 167.7 251.4 315.9 355.9 369.0 0 100 200 300 400 1Q 2Q 3Q 4Q 1Q 2Q 3Q 4Q 1Q SemGas Areas of Operation Northern Oklahoma Average Processed Volume (mmcf/d)  Located in liquids rich oil plays  Four processing facilities - 388 mmcf/d of current capacity  1,300 miles of gathering lines  Significant growth in Mississippi Lime Play – Rose Valley II – 200 mmcf/d capacity – Expected completion mid-2015 SemGas Natural Gas Business 11 2013 2014 2015
  • 12. SemCAMS Natural Gas Business SemCAMS Areas of OperationAverage Throughput Volume (mmcf/d)  Located in: – Western Canadian Sedimentary Basin – sour gas – Montney – liquids rich sour gas – Duvernay – liquids rich sweet gas  Current operational capacity aproximately 700 mmcf/d  600 miles of transport and gathering lines 12 213.9 250.3 283.9 272.6 285.8 148.2 274.2 340.1 302.5 162.6 128.5 159.6 146.9 152.6 186.1 138.3 97.9 91.9 0 100 200 300 400 500 1Q 2Q 3Q 4Q 1Q 2Q 3Q 4Q 1Q 2013 2014 2015 n K3 Plant n KA Plant 376.5 378.8 419.5 443.5 438.4 334.3 412.5 438.0 394.4
  • 13. Maurepas Pipeline Overview Project  Construct, own and operate three pipelines for Motiva Enterprises, LLC in St. James, LA connecting Motiva's refineries – 24-inch, 34 mile crude oil pipeline connected to LOCAP, crossing the Mississippi River and terminating at Motiva's Norco refinery; – 12-inch, 35 mile intermediates pipeline between Motiva's Norco and Convent refineries; and – 6-inch, 35 mile intermediates pipeline between Motiva's Norco and Convent refineries; and  This project is supported by long-term transportation agreements with Motiva and is expected to be operational in the fourth quarter of 2016  The pipeline project is a significant part of an overall refinery optimization project Strategic Rationale  First step in establishing a SemGroup presence in US Gulf Coast crude markets  Platform for future participation in the build-out of infrastructure in the Gulf Coast  Provides a more balanced risk profile through geographic diversity, new customer base and potential for product expansion  Accomplishes strategic goal of becoming more refinery facing  Furthers SemGroup’s drop down inventory to Rose Rock 13
  • 14. $265 $450 $55 58% 34% 7% SemGroup Corporation 2015 Capital Expenditure Guidance 2015 Capital Expenditures – $775 million(1)  More than 90% of capital expenditures are focused on growth capital  Targeting 5-8x EBITDA multiples on organic growth projects in key asset plays  Maintenance, regulatory capital focused on pipeline integrity and SemLogistics tank refurbishments n Natural Gas n Crude n Other Growth Projects n Maintenance and Regulatory 1% $5 (1) Includes Rose Rock Midstream and approximately $70 million carry-over from 2014 related to timing of spend Excludes drop down transactions and potential future acquisitions 14
  • 15. SemGroup Corporation 2015 Capital Expenditure Guidance (1) Investments in affiliate; reflects our ownership in joint ventures More than $1.3 Billion of Growth Capital in 2015-2016 (in millions) Total CapexSegment Description Estimated Completion Date 2015 Capex 2016 Capex Crude-SEMG Maurepas Pipeline 4Q 2016 260 220 500 Crude-RRMS White Cliffs Pipeline capacity expansion(1) 3Q 2015 35 5 40 Crude-RRMS Isabel Pipeline 1Q 2016 30 5 35 Crude-RRMS Platteville truck unloading expansion varies 30 — 30 Crude-RRMS Wattenberg Oil Trunkline extension 1Q 2015 30 — 30 SemGas Northern Oklahoma gas gathering & processing expansion varies 125 100 225 SemCAMS Wapiti Pipeline Expansion varies 40 10 50 SemCAMS K3 Plant projects varies 25 10 35 SemCAMS KA Plant Projects varies 45 20 65 Other/undesignated growth projects varies 100 145 Maintenance, refurbishment & regulatory 55 35 Total $775 $500-$600 15
  • 16. RRMS Adjusted EBITDA(1) (in millions) $116 $135 $189 $287 $320-$360 $100 $200 $300 $400 2011 2012 2013 2014 2015E $35 $40 $69 $128 $180-$200 $0 $50 $100 $150 $200 2011 2012 2013 2014 2015E Adjusted EBITDA(1) 1Q 2015 4Q 2014 2015 Guidance SemGroup(2) $70.0 million $83.2 million $320 - $360 million Rose Rock Midstream(3) $42.1 million $45.1 million $180 - $200 million First Quarter 2015 Results (1) Non-GAAP Financial Data Reconciliations are included in the Appendix to this presentation (2) SemGroup includes fully consolidated Rose Rock Midstream (3) Prior period financial information has been recast to reflect the effects of the dropdown of the Wattenberg Oil Trunkline (4) CAGR is based on the midpoint of 2015 Adjusted EBITDA Guidance SEMG Adjusted EBITDA(1) (in millions) 16
  • 17. SemGroup First Quarter 2015 Results (1) Non-GAAP Financial Data Reconciliations are included in the Appendix to this presentation (2) Crude segment includes fully consolidated Rose Rock Midstream Key Highlights (1Q 2015 vs 4Q 2014)  Crude decreased $9.2 million – Primarily related to a reduction in marketing margins, as marketing margins returned to a more normalized position following an extraordinary fourth quarter, partially offset by increased cash distributions from equity investments  SemGas decreased $3.1 million – Higher volumes were offset by lower commodity price realizations  SemLogistics increased $2.0 million – Increase due to higher storage demand  SemCAMS decreased $1.0 million – Decrease related to lower capital fees and timing of operating expense recoveries Segment Adjusted EBITDA(1) (in millions, unaudited) 1Q 2015 4Q 2014 Crude(2) $ 41.6 $ 50.8 SemGas 15.1 18.2 SemCAMS 8.4 9.4 SemLogistics 1.0 (1.0) SemMaterials Mexico 5.3 4.2 SemStream 5.0 5.9 Corporate and Other (6.4) (4.3) Total Adjusted EBITDA $ 70.0 $ 83.2 17
  • 18. SemGroup Capitalization & Liquidity Conservative leverage ratio provides financial flexibility Target consolidated Net Debt / Adjusted EBITDA target of 3.5x or better Available liquidity to fund future growth opportunities Pro Forma (in millions, unaudited) March 31, 2015 March 31, 2015 SEMG - $500MM Revolver due 2018 $ 66 $ 66 SEMG – 7.500% Senior Notes due 2021 300 300 RRMS - $585MM Revolver due 2018 261 - RRMS - 5.625% Senior Notes due 2022 400 400 RRMS - 5.625% Senior Notes due 2023 - 350 Total Consolidated Debt $ 1,027 $ 1,116 Owner's Equity 1,262 1,262 Total Book Capitalization $ 2,289 $ 2,378 Consolidated Credit Metrics Net Debt $ 711 $ 722 Total Debt/Capitalization 45% 47% Net Debt/Adjusted EBITDA LTM 2.5x 2.5x Committed Liquidity Cash and Cash Equivalents $ 316 $ 394 Revolver Availability(1) SemGroup 430 430 Rose Rock Midstream 307 568 Total Liquidity $ 1,053 $ 1,392 (1) Availability reduced by outstanding letters of credit 18
  • 19. 88% 7% 5% SemGroup’s Fee-based Business Model Margin Contribution(1) n Fixed Fee n Variable Fee n Marketing Margin Descriptions Fixed Fee – Storage fees – Transportation fees – Unloading fees – Gathering and processing fees Variable Fee – Gas processing – percent of proceeds Marketing – Back-to-back marketing transactions Fixed Fee Variable Fee Marketing SemGas(2) 64% 36% SemCAMS 100% SemLogistics 100% SemMaterials Mexico 100% White Cliffs Pipeline 100% Rose Rock Midstream(3)(4) 88% 12% 19 (1) LTM March 31, 2015 (2) SemGas 1Q 2015 margin contribution 76% fixed fee, 24% variable fee (3) Rose Rock Midstream includes White Cliffs cash distributions resulting from 34% ownership for 3 months and 51% ownership for 9 months (4) Marketing margin reduced by intercompany trucking expense
  • 20. $0.2200 $0.2400 $0.2700 $0.3000 $0.3400 $0.3800 $0.1500 $0.2500 $0.3500 $0.4500 $0.5500 4Q 1Q 2Q 3Q 4Q 1Q 4QE SemGroup Corporation Dividend Growth(1) Target 30-40% Annual Dividend Growth through 2017  Current dividend policy is to pass through the after-tax cash distributions received from our MLP investments  Increased first quarter 2015 dividend by approximately 12% over prior quarter 2013 2014 2015 2015 Target Dividend Growth 50-60% year-over-year (1) Assumes no further drop downs or acquisitions 20
  • 21. $0.3625 $0.4025 $0.4650 $0.4950 $0.5350 $0.5750 $0.6200 $0.6350 $0.2500 $0.3500 $0.4500 $0.5500 $0.6500 $0.7500 4Q 4Q 4Q 1Q 2Q 3Q 4Q 1Q 4QE 2015 Target Coverage Ratio 1.1x-1.2x 2015 Target Distribution Growth 15-20% year-over-year Rose Rock Midstream Distribution Growth(1) Target 15-20% Annual Distribution Growth through 2017 (1) Assumes no further drop downs or acquisitions 2011 2012 2013 2014 2015 21
  • 23. SemGroup Non-GAAP Adjusted EBITDA Calculation (in thousands, unaudited) Three Months Ended March 31, December 31, Reconciliation of net income to Adjusted EBITDA: 2015 2014 2014 Net income $ 5,776 $ 19,738 $ 12,707 Add: Interest expense 14,591 9,227 14,650 Add: Income tax expense 4,742 16,526 12,569 Add: Deprecation and amortization expense 23,734 23,637 27,498 EBITDA 48,843 69,128 67,424 Selected Non-Cash Items and Other Items Impacting Comparability 21,139 (1,846) 15,783 Adjusted EBITDA $ 69,982 $ 67,282 $ 83,207 Selected Non-Cash Items and Other Items Impacting Comparability Loss (gain) on disposal or impairment of long-lived assets, net $ 1,058 $ (58) $ 11,959 Loss (income) from discontinued operations, net of income taxes — 5 (4) Foreign currency transaction (gain) loss (519) (683) 302 Remove NGL equity earnings including gain on issuance of common units 305 (11,718) (387) Remove gain on sale of NGL units (7,894) — (7,463) NGL cash distribution 5,015 5,341 5,942 M&A transaction related costs 10,000 — — Inventory valuation adjustments including equity method investees 1,187 — 7,781 Employee severance expense — 9 101 Unrealized loss (gain) on derivative activities 2,645 606 (1,078) Change in fair value of warrants — (980) (10,076) Depreciation and amortization included within equity earnings 6,376 3,450 6,404 Bankruptcy related expenses 189 216 317 Charitable contributions — — 81 Recovery of receivables written off at emergence — (364) — Non-cash equity compensation 2,777 2,330 1,904 Selected Non-Cash items and Other Items Impacting Comparability $ 21,139 $ (1,846) $ 15,783 23
  • 24. SemGroup 2015 Adjusted EBITDA Guidance (1) Guidance is on a cash basis for equity investments in NGL, includes fully consolidated Rose Rock Midstream (in millions, unaudited) 2015 Guidance(1) Mid-point Net income $ 121.5 Add: Interest expense 64.0 Add: Income tax expense 8.0 Add: Depreciation and amortization 109.0 EBITDA $ 302.5 Selected Non-Cash and Other Items Impacting Comparability 37.5 Adjusted EBITDA $ 340.0 Selected Non-Cash and Other Items Impacting Comparability Depreciation and amortization included within equity earnings 25.0 Non-cash equity compensation 12.5 Selected Non-Cash and Other Items Impacting Comparability $ 37.5 24
  • 25. Rose Rock Midstream Non-GAAP Financial Data Reconciliations (in thousands, unaudited) Three Months Ended March 31, December 31, 2015 2014(1) 2014(1) Reconciliation of operating income to Adjusted gross margin: Operating income $ 22,606 $ 18,613 $ 23,244 Add: Operating expense 20,951 15,215 25,696 General and administrative expense 5,620 3,747 5,033 Depreciation and amortization expense 10,143 11,482 12,882 Less: Earnings from equity method investments 20,864 11,080 17,718 Non-cash unrealized gain (loss) on derivatives, net (2,531) (606) 965 Adjusted gross margin $ 40,987 $ 38,583 $ 48,172 Reconciliation of net income to Adjusted EBITDA: Net income $ 14,600 $ 16,226 $ 15,091 Add: Interest expense 8,006 2,387 8,152 Depreciation and amortization expense 10,143 11,482 12,882 Cash distributions from equity method investments 26,065 13,585 21,687 Inventory valuation adjustment 1,187 — 5,667 Non-cash equity compensation 298 260 238 Loss (gain) on disposal of long-lived assets, net 152 (34) 89 Less: Earnings from equity method investments 20,864 11,080 17,718 White Cliffs cash distributions attributable to noncontrolling interests — 4,528 — Impact from derivative instruments: Total gain (loss) on derivatives, net (644) (807) 16,053 Total realized loss (gain) (cash flow) on derivatives, net (1,887) 201 (15,088) Non-cash unrealized gain (loss) on derivatives, net (2,531) (606) 965 Adjusted EBITDA $ 42,118 $ 28,904 $ 45,123 Reconciliation of net cash provided by (used in) operating activities to Adjusted EBITDA: Net cash provided by (used in) operating activities $ (7,070) $ 18,187 $ 64,823 Less: Changes in operating assets and liabilities, net (36,508) (10,613) 31,295 White Cliffs cash distributions attributable to noncontrolling interests — 4,528 — Add: Interest expense, excluding amortization of debt issuance costs 7,479 2,127 7,626 Distributions from equity method investments in excess of equity in earnings 5,201 2,505 3,969 Adjusted EBITDA $ 42,118 $ 28,904 $ 45,123 (1) Prior period financial information has been recast to reflect the effects of the dropdown of the Wattenberg Oil Trunkline 25
  • 26. Rose Rock Midstream 2015 Adjusted EBITDA Guidance (in millions, unaudited) 2015 Guidance Mid-point Net income $ 90.5 Add: Interest expense 37.0 Add: Depreciation and amortization 45.0 EBITDA $ 172.5 Non-Cash and Other Adjustments 17.5 Adjusted EBITDA $ 190.0 Less: Cash interest expense 34.5 Maintenance capital expenditures 16.0 Distributable cash flow $ 139.5 Non-Cash and Other Adjustments Earnings from equity method investments $ (92.0) Distributions from equity method investments (1) 108.0 Non-cash equity compensation 1.5 Non-Cash and Other Adjustments $ 17.5 (1) Distributions from equity method investment includes the cash distributions from White Cliffs and Glass Mountain attributable to Rose Rock 26
  • 27. (in thousands, unaudited) Year Ended December 31, 2014 Crude SemStream SemCAMS SemLogistics SemMexico SemGas Corporate and other Consolidated Net income (loss) $ 57,495 $ 70,632 $ 14,318 $ (10,072) $ 5,900 $ 6,792 $ (93,008) $ 52,057 Add: Interest expense 31,072 (5,140) 13,558 1,528 166 8,570 (710) 49,044 Add: Income tax expense (benefit) — — 3,135 (2,231) 4,053 — 41,556 46,513 Add: Depreciation and amortization expense 40,035 — 14,295 10,005 6,031 26,353 1,678 98,397 EBITDA 128,602 65,492 45,306 (770) 16,150 41,715 (50,484) 246,011 Selected Non-Cash Items and Other Items Impacting Comparability 28,159 (42,165) 590 (1,083) 621 21,053 34,255 41,430 Adjusted EBITDA $ 156,761 $ 23,327 $ 45,896 $ (1,853) $ 16,771 $ 62,768 $ (16,229) $ 287,441 Selected Non-Cash Items and Other Items Impacting Comparability Loss (gain) on disposal of long-lived assets, net $ 319 $ — $ (950) $ (2,490) $ (53) $ 20,092 $ 15,674 $ 32,592 Loss (income) from discontinued operations, net of income taxes — — — (1) — — 2 1 Foreign currency transaction (gain) loss — — 42 821 279 — (1,228) (86) Remove NGL equity earnings including gain on issuance of common units — (31,363) — — — — — (31,363) Remove gain on sale of NGL units (34,211) (34,211) NGL cash distribution — 23,404 — — — — — 23,404 Employee severance expense 9 — 150 — — 41 20 220 Unrealized gain on derivative activities (1,734) — — — — — — (1,734) Change in fair value of warrants — — — — — — 13,423 13,423 Depreciation and amortization included within equity earnings 18,992 — — — — — — 18,992 Inventory valuation adjustment including equity method investees 7,781 — — — — — — 7,781 Recovery of receivables written off at emergence — — (664) — — — — (664) Bankruptcy related expenses — 1 — — — 150 1,159 1,310 Charitable contributions — — — — — — 3,379 3,379 Non-cash equity compensation 2,792 4 2,012 587 395 770 1,826 8,386 Selected Non-Cash Items and Other Items Impacting Comparability $ 28,159 $ (42,165) $ 590 $ (1,083) $ 621 $ 21,053 $ 34,255 $ 41,430 SemGroup Reconciliation of Net Income to Adjusted EBITDA 27
  • 28. (in thousands, unaudited) Year Ended December 31, 2013 Crude SemStream SemCAMS SemLogistics SemMexico SemGas Corporate and other Consolidated Net income (loss) $ 57,228 $ 38,071 $ (3,136) $ (6,769) $ 5,377 $ 14,701 $ (39,660) $ 65,812 Add: Interest expense 14,923 (4,810) 18,928 1,435 188 3,268 (8,790) 25,142 Add: Income tax expense (benefit) — — 6,348 (5,699) 2,589 — (20,492) (17,254) Add: Depreciation and amortization expense 23,708 — 10,766 9,426 5,991 14,517 2,001 66,409 EBITDA 95,859 33,261 32,906 (1,607) 14,145 32,486 (66,941) 140,109 Selected Non-Cash Items and Other Items Impacting Comparability 10,764 (15,624) 1,180 111 (722) 1,221 51,979 48,909 Adjusted EBITDA $ 106,623 $ 17,637 $ 34,086 $ (1,496) $ 13,423 $ 33,707 $ (14,962) $ 189,018 Selected Non-Cash Items and Other Items Impacting Comparability Loss (gain) on disposal of long-lived assets, net $ (56) $ 6 $ — $ — $ (854) $ 665 $ — $ (239) Income from discontinued operations, net of income taxes — — — — — — (59) (59) Foreign currency transaction (gain) loss — — (23) (391) (177) — (1,042) (1,633) Remove NGL equity earnings — (33,996) — — — — — (33,996) NGL cash distribution — 18,321 — — — — — 18,321 Mid-America Midstream Gas Services acquisition cost — — — — — — 3,600 3,600 Employee severance expense 5 — — — — — 33 38 Unrealized gain on derivative activities (974) — — — — — — (974) Change in fair value of warrants — — — — — — 46,434 46,434 Depreciation and amortization included within equity in earnings of White Cliffs 9,520 — — — — — — 9,520 Bankruptcy related expenses — — — — — — 567 567 Non-cash equity compensation 2,269 45 1,203 502 309 556 2,446 7,330 Selected Non-Cash Items and Other Items Impacting Comparability $ 10,764 $ (15,624) $ 1,180 $ 111 $ (722) $ 1,221 $ 51,979 $ 48,909 SemGroup Reconciliation of Net Income to Adjusted EBITDA 28
  • 29. (in thousands, unaudited) Year Ended December 31, 2012 Crude SemStream SemCAMS SemLogistics SemMexico SemGas Corporate and other Consolidated Net income (loss) $ 64,554 $ 4,919 $ 4,097 $ (3,552) $ 1,467 $ (264) $ (39,324) $ 31,897 Add: Interest expense (409) (3,449) 18,727 2,486 314 1,461 (10,228) 8,902 Add: Income tax expense (benefit) — — 720 (7,736) 2,285 — 2,653 (2,078) Add: Depreciation and amortization expense 12,131 — 10,589 9,780 6,171 7,043 2,496 48,210 EBITDA 76,276 1,470 34,133 978 10,237 8,240 (44,403) 86,931 Selected Non-Cash Items and Other Items Impacting Comparability 9,532 6,952 50 514 121 629 30,236 48,034 Adjusted EBITDA $ 85,808 $ 8,422 $ 34,183 $ 1,492 $ 10,358 $ 8,869 $ (14,167) $ 134,965 Selected Non-Cash Items and Other Items Impacting Comparability Loss (gain) on disposal of long-lived assets, net $ (3,501) $ 214 $ — $ — $ (290) $ 46 $ — $ (3,531) Loss (income) from discontinued operations, net of income taxes — (2,985) — 14 — — 32 (2,939) Foreign currency transaction (gain) loss — — 26 (370) 190 — 452 298 Remove NGL equity earnings — 403 — — — — — 403 NGL cash distribution — 9,218 — — — — — 9,218 Employee severance expense — — — 159 — — 195 354 Unrealized loss on derivative activities 1,196 — — — — — — 1,196 Change in fair value of warrants — — — — — — 21,310 21,310 Depreciation and amortization included within equity in earnings of White Cliffs 10,181 — — — — — — 10,181 Defense costs — — — — — — 5,899 5,899 Recovery of receivables written off at emergence — — (858) — — — — (858) Non-cash equity compensation 1,656 102 882 711 221 583 2,348 6,503 Selected Non-Cash Items and Other Items Impacting Comparability $ 9,532 $ 6,952 $ 50 $ 514 $ 121 $ 629 $ 30,236 $ 48,034 SemGroup Reconciliation of Net Income to Adjusted EBITDA 29
  • 30. (in thousands, unaudited) Year Ended December 31, 2011 Crude SemStream SemCAMS SemLogistics SemMexico SemGas Corporate and other Consolidated Net income (loss) $ 39,241 $ 16,752 $ 2,868 $ (41,440) $ 2,430 $ 6,308 $ (23,347) $ 2,812 Add: Interest expense 3,749 17,152 24,685 1,005 365 2,346 10,836 60,138 Add: Income tax expense (benefit) — — 552 (3,331) 629 — (160) (2,310) Add: Depreciation and amortization expense 11,379 3,501 10,233 9,271 6,502 5,986 2,951 49,823 EBITDA 54,369 37,405 38,338 (34,495) 9,926 14,640 (9,720) 110,463 Selected Non-Cash Items and Other Items Impacting Comparability 8,293 (48,513) (2,296) 45,283 57 452 1,806 5,082 Adjusted EBITDA $ 62,662 $ (11,108) $ 36,042 $ 10,788 $ 9,983 $ 15,092 $ (7,914) $ 115,545 Selected Non-Cash Items and Other Items Impacting Comparability Loss (gain) on disposal of long-lived assets, net $ 64 $ (45,821) $ (8) $ 44,663 $ (200) $ 4 $ 1,599 $ 301 Loss (income) from discontinued operations, net of income taxes (1) — 9,644 — 30 — — (126) 9,548 Foreign currency transaction (gain) loss — 39 (2,674) 88 18 — (921) (3,450) Employee severance expense — — 3,855 131 — — 388 4,374 Unrealized gain on derivative activities (787) (13,247) — — — — (80) (14,114) Change in fair value of warrants — — — — — — (5,012) (5,012) Reversal of allowance on goods and services tax receivable — — (4,144) — — — — (4,144) Depreciation and amortization included within equity in earnings of White Cliffs 10,630 — — — — — — 10,630 Defense costs — — — — — — 1,000 1,000 Recovery of receivables written off at emergence (2,692) — — — — — — (2,692) Non-cash equity compensation 1,078 872 675 371 239 448 4,958 8,641 Selected Non-Cash Items and Other Items Impacting Comparability $ 8,293 $ (48,513) $ (2,296) $ 45,283 $ 57 $ 452 $ 1,806 $ 5,082 SemGroup Reconciliation of Net Income to Adjusted EBITDA (1) SemStream Arizona has been reported as a discontinued operation at December 31, 2012. Prior periods have been recast to conform with the presentation. 30
  • 31. (in thousands, unaudited) Year Ended December 31, 2014(1) 2013 2012 2011 Net income $ 62,925 $ 37,515 $ 23,954 $ 23,235 Add: Interest expense 21,279 8,181 1,912 1,823 Depreciation and amortization expense 40,035 23,708 12,131 11,379 Distributions from equity method investment 66,768 16,999 — — Inventory valuation adjustment 5,667 — — — Non-cash equity compensation 943 806 308 — Loss (gain) on disposal of long-lived assets, net 319 (31) (1) 64 Provision for (recovery of) uncollectible accounts receivable — — — (916) Less: Earnings from equity method investment 57,378 17,571 — — White Cliffs cash distributions attributable to noncontrolling interests 11,008 — — — Impact from derivative instruments: Total gain (loss) on derivatives, net 17,351 (1,593) 149 (386) Total realized (gain) loss (cash outflow) on derivatives, net (15,730) 2,567 (1,345) 1,173 Non-cash unrealized gain (loss) on derivatives, net 1,621 974 (1,196) 787 Adjusted EBITDA $ 127,929 $ 68,633 $ 39,500 $ 34,798 Rose Rock Reconciliation of Net Income to Adjusted EBITDA (1) Prior period financial information has been recast to reflect the effects of the dropdown of the Wattenberg Oil Trunkline 31
  • 32. Rose Rock Reconciliation of Net Cash Provided by Operating Activities to Adjusted EBITDA (in thousands, unaudited) Year Ended December 31, 2014(1) 2013 2012 2011 Net cash provided by operating activities $ 111,093 $ 72,528 $ 35,097 $ 51,085 Less: Changes in operating assets and liabilities, net 1,296 11,265 (2,850) 18,082 White Cliffs cash distributions attributable to noncontrolling interests 11,008 — — — Add: Interest expense, excluding amortization of debt issuance costs 19,750 7,370 1,553 1,795 Distributions in excess of equity earnings of affiliates 9,390 — — — Adjusted EBITDA $ 127,929 $ 68,633 $ 39,500 $ 34,798 (1) Prior period financial information has been recast to reflect the effects of the dropdown of the Wattenberg Oil Trunkline 32