Download to read offline


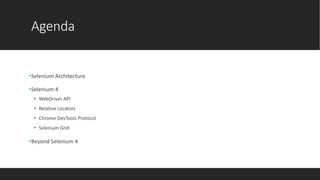

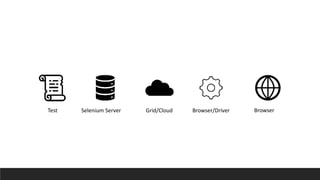
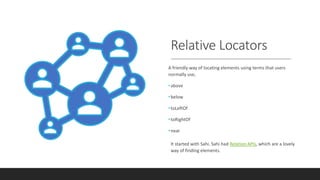
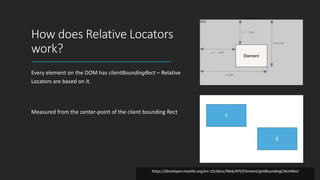

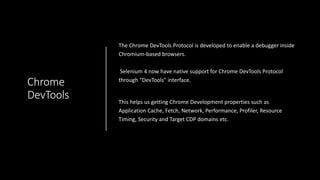


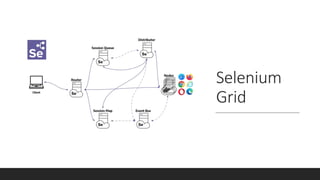

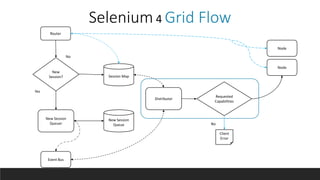

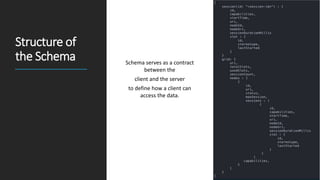


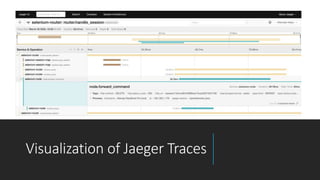


Selenium 4 introduces several new features for browser automation including relative locators, support for the Chrome DevTools Protocol, and observability features for the Selenium Grid. Relative locators allow finding elements using terms like "above", "below", and "to the left/right of" another element. The Chrome DevTools Protocol enables accessing Chrome developer tools domains. Selenium Grid now supports OpenTelemetry for distributed tracing of requests to provide observability. A demo shows visualizing traces in Jaeger. Beyond Selenium 4, future plans include bidirectional APIs and new locator strategies using images and artificial intelligence.


![Selenium 4 with Simon Stewart [Webinar]](https://cdn.slidesharecdn.com/ss_thumbnails/selenium4browserstackwebinar-190702161824-thumbnail.jpg?width=640&height=640&fit=bounds)


![Getting Started with Apache Spark: Big Data Made Simple [Free Meetup]](https://cdn.slidesharecdn.com/ss_thumbnails/apachesparkgettingstarted-260203175547-8361bcc3-thumbnail.jpg?width=640&height=640&fit=bounds)


