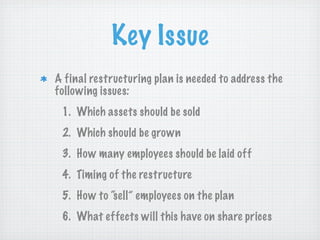
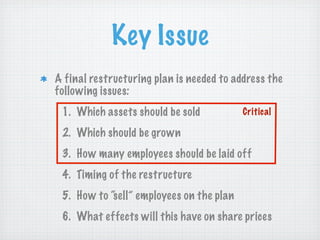
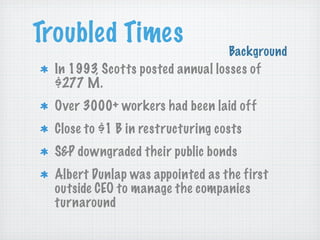
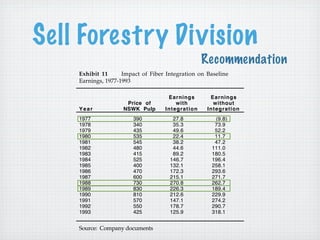
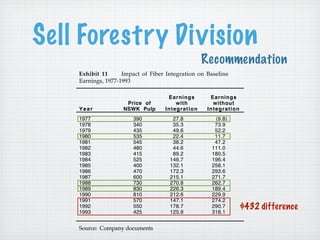
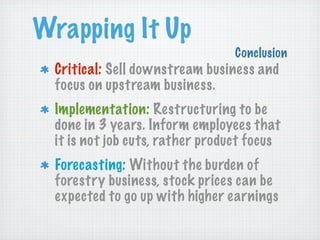
Download as PDF, PPTX
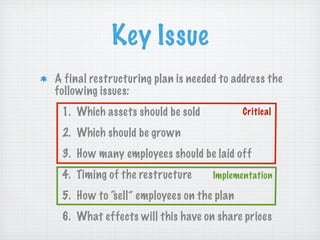
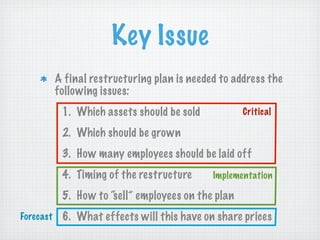


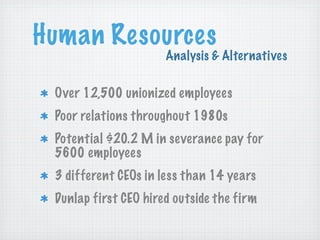
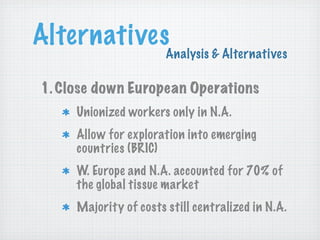
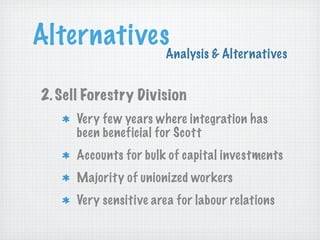
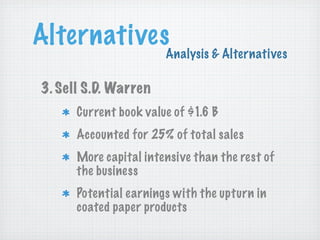

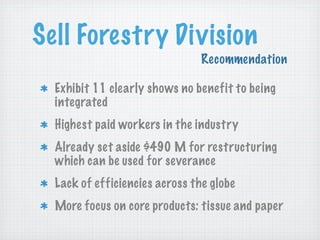
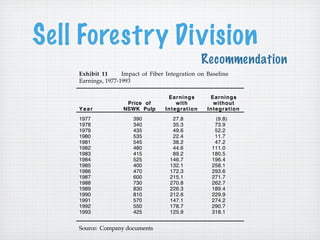

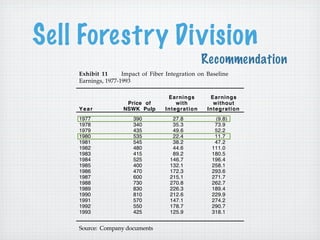
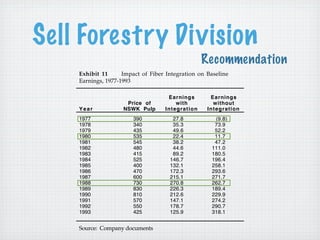


The document discusses a restructuring plan for Scott Paper Company. It identifies key issues to address, including which assets to sell or grow, employee layoffs, and the plan's impact on share prices. The analysis considers alternatives like selling the forestry or S.D. Warren divisions. It is recommended to sell the forestry division as integration has not benefited earnings and it is the highest cost area. The restructure will be implemented over 3 years to focus on tissue and paper products and improve earnings and share prices.


