Download free for 30 days
Sign in
Upload
Language (EN)
Support
Business
Mobile
Social Media
Marketing
Technology
Art & Photos
Career
Design
Education
Presentations & Public Speaking
Government & Nonprofit
Healthcare
Internet
Law
Leadership & Management
Automotive
Engineering
Software
Recruiting & HR
Retail
Sales
Services
Science
Small Business & Entrepreneurship
Food
Environment
Economy & Finance
Data & Analytics
Investor Relations
Sports
Spiritual
News & Politics
Travel
Self Improvement
Real Estate
Entertainment & Humor
Health & Medicine
Devices & Hardware
Lifestyle
Change Language
Language
English
Español
Português
Français
Deutsche
Cancel
Save
Submit search
EN
Uploaded by
nagom47355
PPTX, PDF
28 views
Satisfaction_Framework_Presentation.pptx
Satisfaction framework to determine exit
Data & Analytics
◦
Read more
0
Save
Share
Embed
Embed presentation
Download
Download to read offline
1
/ 4
2
/ 4
3
/ 4
4
/ 4
More Related Content
PPTX
"Predicting Employee Retention: A Data-Driven Approach to Enhancing Workforce...
by
Boston Institute of Analytics
PPTX
Employee Retention Prediction: Enhancing Workforce Stability
by
Boston Institute of Analytics
PPTX
Employee Retention Prediction: Leveraging Data for Workforce Stability
by
Boston Institute of Analytics
PPTX
Employee Retention Strategies power poinr
by
asfandad
PPTX
Data Analytics | Predicting Employee Turnover
by
Megan Evans
PPTX
Predicting Employee Retention Using Data-Driven Insights
by
Boston Institute of Analytics
PPTX
Mastering Employee Retention Strategies: A Guide for Modern Workplaces
by
Boston Institute of Analytics
PDF
Shadowmatch Overview Jun2012
by
Shadowmatch
"Predicting Employee Retention: A Data-Driven Approach to Enhancing Workforce...
by
Boston Institute of Analytics
Employee Retention Prediction: Enhancing Workforce Stability
by
Boston Institute of Analytics
Employee Retention Prediction: Leveraging Data for Workforce Stability
by
Boston Institute of Analytics
Employee Retention Strategies power poinr
by
asfandad
Data Analytics | Predicting Employee Turnover
by
Megan Evans
Predicting Employee Retention Using Data-Driven Insights
by
Boston Institute of Analytics
Mastering Employee Retention Strategies: A Guide for Modern Workplaces
by
Boston Institute of Analytics
Shadowmatch Overview Jun2012
by
Shadowmatch
Similar to Satisfaction_Framework_Presentation.pptx
PDF
Driving the Future of HR with Analytics and Bots
by
Ahmad Areeb Faraz
PDF
Talent Analytics: A Systems Perspective
by
Sharad Verma
PPTX
Predictive modeling project
by
Apoorva Srivastava
PDF
Marketing Brochure
by
scwilsonct2
PPTX
Shadowmatch Overview
by
michelleSM
PDF
Waterhouse - Recovery Prescription: How Assessment Data Can Drive Corporate ...
by
HR Florida State Council, Inc.
PPTX
Employee Attrition Analysis / Churn Prediction
by
Gopinadh Lakkoju
PPTX
realPerform solution overview
by
Abhijit Chatterjee
PPT
5 Diagnosis Worksheet
by
hsplastic
PDF
P 01 advanced_people_analytics_2016_04_03_v11
by
Vishwa Kolla
PPTX
Group1_Amazon_PPT_amazon as an employer case
by
DeepeshYadav73
PDF
Hr analytics project
by
Jatin Saini
PPTX
Portfolio.
by
Asif Monir
PPTX
Performance Reviews That Don’t Suck
by
Synerzip
PPTX
Employee Retension Capstone Project - Neeraj Bubby.pptx
by
Boston Institute of Analytics
PPTX
Group_6_Employee_Attrition (2)
by
Tashi Gunjiyal
PPTX
Group 6 employee_attrition
by
tashig9
PPTX
Group 6 employee_attrition
by
tashig9
PPTX
Mohammad Shaiz Akhtar-POC.pptx
by
ShaizAkhtar1
PPT
Hrp
by
upponis
Driving the Future of HR with Analytics and Bots
by
Ahmad Areeb Faraz
Talent Analytics: A Systems Perspective
by
Sharad Verma
Predictive modeling project
by
Apoorva Srivastava
Marketing Brochure
by
scwilsonct2
Shadowmatch Overview
by
michelleSM
Waterhouse - Recovery Prescription: How Assessment Data Can Drive Corporate ...
by
HR Florida State Council, Inc.
Employee Attrition Analysis / Churn Prediction
by
Gopinadh Lakkoju
realPerform solution overview
by
Abhijit Chatterjee
5 Diagnosis Worksheet
by
hsplastic
P 01 advanced_people_analytics_2016_04_03_v11
by
Vishwa Kolla
Group1_Amazon_PPT_amazon as an employer case
by
DeepeshYadav73
Hr analytics project
by
Jatin Saini
Portfolio.
by
Asif Monir
Performance Reviews That Don’t Suck
by
Synerzip
Employee Retension Capstone Project - Neeraj Bubby.pptx
by
Boston Institute of Analytics
Group_6_Employee_Attrition (2)
by
Tashi Gunjiyal
Group 6 employee_attrition
by
tashig9
Group 6 employee_attrition
by
tashig9
Mohammad Shaiz Akhtar-POC.pptx
by
ShaizAkhtar1
Hrp
by
upponis
Recently uploaded
PPTX
The Archive Fall 2025 Semester Overview by Daisy-Grace Hooper
by
dh24372
PPTX
Update on TIMES Features Maintainer Report
by
IEA-ETSAP
PPTX
Strengths_of_GAMSPy_with_regard_to_TIMES
by
IEA-ETSAP
PPTX
Can AI see like a tourist? An exploration of Vision Language Models for autom...
by
MODUL Technology GmbH
PDF
Modeling Styles of Vernacular Architecture using CIDOC CRM
by
magas4
PDF
Solution Sheet / Objectives management (2026)
by
Optymyze
PDF
Machine Learning Lectures -- Outliers in Data
by
Zahra Sadeghi
PDF
Powering_AI-Ready_MySQL_MyVector_ProxySQL_v3.pptx.pdf
by
Alkin Tezuysal
PDF
Data Processing (2026)
by
Optymyze
PDF
CodeMate_Autonomous_Engineering_Documents.pdf
by
ssuserc287c9
PPTX
normal labor normal labor normal labor normal labor normal labor normal labor...
by
meksbaba1
PPTX
06 Proposal TIMES-TALKS A proposal for an IEA-ETSAP 12 part podcast series
by
IEA-ETSAP
PPTX
Data Collection lessons for grade 5 third quarter
by
LorizaMElwas
PDF
Operations and Data Support Portfolio | Delbert Ross Wanjala Investor Relatio...
by
DelbertRossWanjala
PDF
When Is the Right Time to Telegram Accounts_.pdf
by
3tb3224qp2qbmz9iivnj
PPTX
Recommended Practices for system studies with high shares of wind and solar
by
IEA-ETSAP
PPTX
[DSC Europe 25] Raul Cruz Bonilla - Harnessing GEN AI in Fashion, Luxury and ...
by
DataScienceConferenc1
PPTX
gas chromatograohy by Rasha Ibrahim.pptx
by
ri7061584
PDF
Presentation - Data Migration Strategies: Big Bang vs Phased Migration for Bu...
by
alexmartincaneda
PPTX
[DSC Europe 25] Milos Belcevic - Product Professional's Journey to Full-Stack...
by
DataScienceConferenc1
The Archive Fall 2025 Semester Overview by Daisy-Grace Hooper
by
dh24372
Update on TIMES Features Maintainer Report
by
IEA-ETSAP
Strengths_of_GAMSPy_with_regard_to_TIMES
by
IEA-ETSAP
Can AI see like a tourist? An exploration of Vision Language Models for autom...
by
MODUL Technology GmbH
Modeling Styles of Vernacular Architecture using CIDOC CRM
by
magas4
Solution Sheet / Objectives management (2026)
by
Optymyze
Machine Learning Lectures -- Outliers in Data
by
Zahra Sadeghi
Powering_AI-Ready_MySQL_MyVector_ProxySQL_v3.pptx.pdf
by
Alkin Tezuysal
Data Processing (2026)
by
Optymyze
CodeMate_Autonomous_Engineering_Documents.pdf
by
ssuserc287c9
normal labor normal labor normal labor normal labor normal labor normal labor...
by
meksbaba1
06 Proposal TIMES-TALKS A proposal for an IEA-ETSAP 12 part podcast series
by
IEA-ETSAP
Data Collection lessons for grade 5 third quarter
by
LorizaMElwas
Operations and Data Support Portfolio | Delbert Ross Wanjala Investor Relatio...
by
DelbertRossWanjala
When Is the Right Time to Telegram Accounts_.pdf
by
3tb3224qp2qbmz9iivnj
Recommended Practices for system studies with high shares of wind and solar
by
IEA-ETSAP
[DSC Europe 25] Raul Cruz Bonilla - Harnessing GEN AI in Fashion, Luxury and ...
by
DataScienceConferenc1
gas chromatograohy by Rasha Ibrahim.pptx
by
ri7061584
Presentation - Data Migration Strategies: Big Bang vs Phased Migration for Bu...
by
alexmartincaneda
[DSC Europe 25] Milos Belcevic - Product Professional's Journey to Full-Stack...
by
DataScienceConferenc1
Satisfaction_Framework_Presentation.pptx
1.
USING REGTRESSION TO
PREDICT EXITS
2.
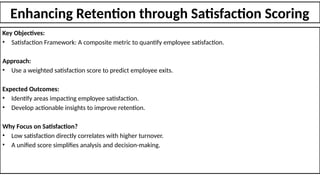
Enhancing Retention through
Satisfaction Scoring Key Objectives: • Satisfaction Framework: A composite metric to quantify employee satisfaction. Approach: • Use a weighted satisfaction score to predict employee exits. Expected Outcomes: • Identify areas impacting employee satisfaction. • Develop actionable insights to improve retention. Why Focus on Satisfaction? • Low satisfaction directly correlates with higher turnover. • A unified score simplifies analysis and decision-making.
3.
Transforming Data into
Numeric Values Key Steps to Compute Satisfaction Score: 1. Identify Key Variables: • Work Environment (e.g., employee feedback, team dynamics). • Compensation (e.g., salary, bonuses, fairness perception). • Growth Opportunities (e.g., promotions, learning opportunities). • Work-Life Balance (e.g., hours worked, flexibility, commute time). • Management (e.g., feedback quality, managerial support). Followed by Data cleaning 2. Normalize Variables: • Convert all Independent variables into Nominal, Ordinal, Interval and Ratio variables • Example: Use Min-Max normalization for numeric fields like salary or hours worked: from sklearn.preprocessing import MinMaxScaler scaler = MinMaxScaler() data[['Salary', 'Hours_Worked']] = scaler.fit_transform(data[['Salary', 'Hours_Worked']]) 3. Combine into Satisfaction Score: • Assign weights to variables based on importance or by analyzing data of exit employees. • Example Formula: (Tentative Independent variables, list can be exhaustive) Satisfaction Score = 0.4 × Job Satisfaction + 0.3 × Salary + 0.2 × Growth Opportunities + 0.1 × Work-Life Balance Outcome: • A single, interpretable numeric metric for satisfaction.
4.
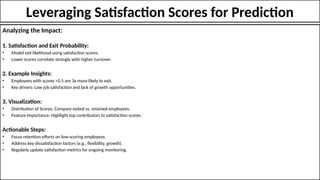
Leveraging Satisfaction Scores
for Prediction Analyzing the Impact: 1. Satisfaction and Exit Probability: • Model exit likelihood using satisfaction scores. • Lower scores correlate strongly with higher turnover. 2. Example Insights: • Employees with scores <0.5 are 3x more likely to exit. • Key drivers: Low job satisfaction and lack of growth opportunities. 3. Visualization: • Distribution of Scores: Compare exited vs. retained employees. • Feature Importance: Highlight top contributors to satisfaction scores. Actionable Steps: • Focus retention efforts on low-scoring employees. • Address key dissatisfaction factors (e.g., flexibility, growth). • Regularly update satisfaction metrics for ongoing monitoring.
Download
![Transforming Data into Numeric Values
Key Steps to Compute Satisfaction Score:
1. Identify Key Variables:
• Work Environment (e.g., employee feedback, team dynamics).
• Compensation (e.g., salary, bonuses, fairness perception).
• Growth Opportunities (e.g., promotions, learning opportunities).
• Work-Life Balance (e.g., hours worked, flexibility, commute time).
• Management (e.g., feedback quality, managerial support).
Followed by Data cleaning
2. Normalize Variables:
• Convert all Independent variables into Nominal, Ordinal, Interval and Ratio variables
• Example: Use Min-Max normalization for numeric fields like salary or hours worked:
from sklearn.preprocessing import MinMaxScaler
scaler = MinMaxScaler()
data[['Salary', 'Hours_Worked']] = scaler.fit_transform(data[['Salary', 'Hours_Worked']])
3. Combine into Satisfaction Score:
• Assign weights to variables based on importance or by analyzing data of exit employees.
• Example Formula: (Tentative Independent variables, list can be exhaustive)
Satisfaction Score = 0.4 × Job Satisfaction + 0.3 × Salary + 0.2 × Growth Opportunities + 0.1 × Work-Life Balance
Outcome:
• A single, interpretable numeric metric for satisfaction.](https://image.slidesharecdn.com/satisfactionframeworkpresentation-250401105728-64666556/85/Satisfaction_Framework_Presentation-pptx-3-320.jpg)


![[DSC Europe 25] Raul Cruz Bonilla - Harnessing GEN AI in Fashion, Luxury and ...](https://cdn.slidesharecdn.com/ss_thumbnails/me7nvup5thwqzwzblbvw-raul-cruz-harnessing-ai-en-luxury-260123083019-32ac5a43-thumbnail.jpg?width=640&height=640&fit=bounds)


![[DSC Europe 25] Milos Belcevic - Product Professional's Journey to Full-Stack...](https://cdn.slidesharecdn.com/ss_thumbnails/1zovd6fgsycdg4wvgvls-milos-belcevic-product-professionals-journey-to-full-stack-product-developer-260123083019-d993120d-thumbnail.jpg?width=640&height=640&fit=bounds)