The document discusses key concepts in sampling and statistics including:
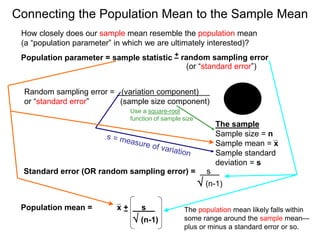
1) We cannot measure entire populations, so we take random samples to understand population parameters like the mean and standard deviation.
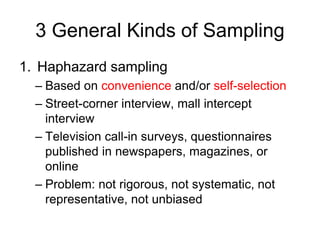
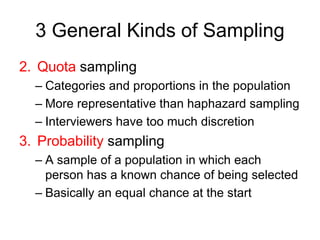
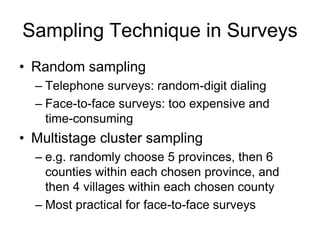
2) There are three main types of sampling: haphazard, quota, and probability sampling which gives all members an equal chance of selection.
3) The sample mean and standard deviation estimate the population mean and standard deviation but may differ, with the population mean falling within a range of the sample mean plus or minus the standard error.