financial management notes4
•
0 likes•171 views

This document contains 15 problems related to risk and return concepts in capital market theory. Problem 1 calculates the total return and percentage return for an investment in shares of L&T. Problem 2 calculates the dividend yield, capital gain percentage, and total share return for an investment based on closing price and dividend information from two years. Problem 3 similarly calculates dividend yield, capital gain percentage, and total percentage return for an investment in shares of Telco. The remaining problems involve calculations related to compound returns, standard deviation, variance, beta, risk premiums, probability distributions, and other capital market concepts.

Recommended
Recommended
More Related Content
What's hot
What's hot (19)
Viewers also liked
Viewers also liked (20)
Similar to financial management notes4
Similar to financial management notes4 (20)
More from Babasab Patil
More from Babasab Patil (20)
Recently uploaded
Recently uploaded (20)
financial management notes4
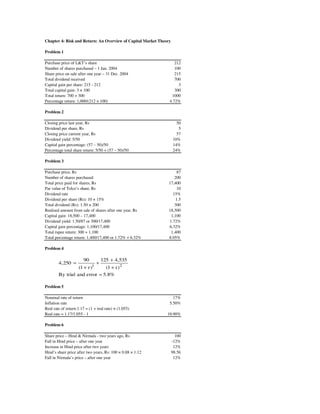
- 1. Chapter 4: Risk and Return: An Overview of Capital Market Theory Problem 1 Purchase price of L&T’s share 212 Number of shares purchased – 1 Jan. 2004 100 Share price on sale after one year – 31 Dec. 2004 215 Total dividend received 700 Capital gain per share: 215 - 212 3 Total capital gain: 3 × 100 300 Total return: 700 + 300 1000 Percentage return: 1,000/(212 × 100) 4.72% Problem 2 Closing price last year, Rs 50 Dividend per share, Rs 5 Closing price current year, Rs 57 Dividend yield: 5/50 10% Capital gain percentage: (57 – 50)/50 14% Percentage total share return: 5/50 + (57 – 50)/50 24% Problem 3 Purchase price, Rs 87 Number of shares purchased 200 Total price paid for shares, Rs 17,400 Par value of Telco’s share, Rs 10 Dividend rate 15% Dividend per share (Rs): 10 × 15% 1.5 Total dividend (Rs): 1.50 × 200 300 Realised amount from sale of shares after one year, Rs 18,500 Capital gain: 18,500 – 17,400 1,100 Dividend yield: 1.50/87 or 300/17,400 1.72% Capital gain percentage: 1,100/17,400 6.32% Total rupee return: 300 + 1,100 1,400 Total percentage return: 1,400/17,400 or 1.72% + 6.32% 8.05% Problem 4 90 125 + 4,535 4, 250 = + (1 + r )1 (1 + r ) 2 By trial and error = 5.8% Problem 5 Nominal rate of return 17% Inflation rate 5.50% Real rate of return:1.17 = (1 + real rate) × (1.055) Real rate = 1.17/1.055 - 1 10.90% Problem 6 Share price – Hind & Nirmala - two years ago, Rs 100 Fall in Hind price – after one year -12% Increase in Hind price after two years 12% Hind’s share price after two years, Rs: 100 × 0.88 × 1.12 98.56 Fall in Nirmala’s price – after one year 12%
- 2. Increase in Nirmala’s price after two years -12% Nirmala’s share price after two years, Rs: 100 × 1.12 × 0.88 98.56 Problem 7 7-year holding period return: (1.153 × 0.945 × 1.173 ×1.25 × 1.168 ×1.095 × 1.288) -1 = 1.63 or 163% 1.63 Compound rate of return: = 7 1.153 × 0.945 × 1.173 × 1.25 × 1.168 × 1.095 × 1.288 − 1 = 1 . 15 or 115 % 1.15 Problem 8 Year Return, r (ri - 9.7%)2 1 5.30% 0.19% 2 15.60% 0.35% 3 -7.30% 2.88% 4 15.00% 0.28% 5 19.80% 1.02% Sum 48.40% 4.73% Average 9.68% Variance 0.0118317 Stdev 0.10877362 10.88% Problem 9 (r i - 12.73%) 2 Year Return, r Prob. r × prob. × Prob Rapid growth 19.50% 0.15 2.93% 0.07% Moderate growth 14.00% 0.55 7.70% 0.01% Recession 7.00% 0.3 2.10% 0.10% Expected return 12.73% Variance 0.18% Stdev 4.20% Problem 10 Expected Square of Return, ER Deviation Deviation Return, Ri Probability, Rip (Ri - ER) (Ri - ER)2 p 20 0.10 2.0 8.1 65.61 18 0.45 8.1 6.1 37.21 8 0.30 2.4 -3.9 15.21 0 0.05 0.0 -11.9 141.61 -6 0.1 -0.6 -17.9 320.41 ER 11.9 å(Ri - ER)2p STDEV, s 66.99 = 8.18 Problem 11 Security X Return Probability p Exp. Return Deviation Sq. Deviation Rx ER = Rxp (Rx - ER) 2 (Rx - ER) 30 0.1 3 19 361 20 0.2 4 9 81 10 0.4 4 -1 1 5 0.2 1 -6 36
- 3. -10 0.1 -1 -21 441 ER 11 å(Rx - ER)2 920 STDEV, s 1 0 4 = 1 0 .2 Security Y Return Probability p Exp. Return Deviation Sq. Deviation Ry ER = Ryp (Ry - ER) (Ry - ER)2 -20 0.05 -1.0 -40.5 1640.25 10 0.25 2.5 -10.5 110.25 20 0.30 6.0 -0.5 0.25 30 0.30 9.0 9.5 90.25 40 0.1 4.0 19.5 380.25 ERy 20.5 2 å(Ry - ER) 2221.25 STDEV, s 1 7 4 .4 5 = 1 3 .2 2 Portfolio of Security XY Probability, Deviation, X Dev. x Prob. Probability, Y X px (Rx - ERx) (Rx - ERx)p py 0.10 19 1.9 0.05 0.20 9 1.8 0.25 0.40 -1 -0.4 0.30 0.20 -6 -1.2 0.30 0.10 -21 -2.1 0.10 Var. X Var. Y Weight X Sq. weight X varx vary wx 2 w x 104 174.75 0.5 0.25 The formula for calculating the standard deviation of portfolio of X and Y securities is as follows: 2 2 2 2 σ p = σ x × w x + σ y × w y + 2 w xw y c o v ar xy = 1 0 4 × 0 .2 5 + 1 7 4 .7 5 × 0 .2 5 + 2 × 0 .5 × 0 .5 × -1 6 .0 3 = 6 1.6 7 = 7 .8 5 Problem 12 Security P Exp. ret Deviation Probability, Return, RP RP x pP (RP - ERP) p 0.3 30 9 13 0.4 20 8 3 0.3 0 0 -17 ER 17 STDEV, σP
- 4. Market portfolio M Return , RM Exp. ret. Deviation Deviation sq. RM x pM (RM - ERM) (RM - ERM)2 -10 -3 -24 576 20 8 6 36 30 9 16 256 ERM 14 varM σM P M Standard 11.87 16.25 deviation Covariance Correlation corrPM = covarPM/sM sP Beta 2 bata = corrPMsPsM / s M Problem 13 Return Share Year portfolio Treasury Bills Risk premium 1 22.50% 11.40% 11.10% 2 -6.80% 9.80% -16.60% 3 26.80% 10.50% 16.30% 4 24.60% 9.90% 14.70% 5 3.20% 9.20% -6.00% 6 15.70% 8.90% 6.80% 7 12.30% 11.20% 1.10% Average 14.04% 10.13% 3.91% Realised premium is based on historical data, and as we can see from the above table, in some years it can be negative. The average risk premium is expected to be positive when a very long period of time, covering various phases of economic cycles, is considered. Problem 14 Return Expected return Economic state Prob. Market Treasury Bills Market Growth 0.2 28.50% 9.70% 5.70% Decline 0.3 -5.00% 9.50% -1.50% Stagnation 0.5 17.90% 9.20% 8.95% Average 13.80% 9.47% 4.38% Problem 15 0 − 20 . 0 S= = − 2 .0 10 . 0 S equal to -2 implies that zero return is positioned 2 standard deviations to the left of the expected value of the probability distributions of possible returns. The probability of being less than 2 standard deviations from the expected value is 0.0228 (see Annexure Table F). This means that there is 2.28% probability that the return will be zero or less. There is about 67% probability that the return would range between 10% and 30%. There is 95% chance that the return will be between zero [20% - 2 × 10%] and 40% [20% + 2 × 10%]. Problem 16 30 . 0 − 22 . 0 S= = 0 . 32 25 . 0 S equal to 0.32 lies to the right of the expected value. From Annexure Table F, we find that there is about 12.6 % probability that the return will be 30% or more.
- 6. Product (Ri - ER)2p 6.56 16.74 4.56 7.08 32.04 66.99 8.18 8.18 Product 2 (Rx - ER) p 36.1 16.2 0.4 7.2
- 7. 44.1 å(Rx - ERx)2p 104 10.20 Product 2 (Ry- ER) p 82.0125 27.5625 0.075 27.075 38.025 2 å(Ry - ER) p 174.75 22 13.22 Covariance Deviation, Y Dev. x Prob. (Rx - ERx)p (Ry - Ery) 2 2 (Ry - Ery) p x (Ry - Ery) p -40.5 -2.03 -3.85 -10.5 -2.63 -4.73 -0.5 -0.15 0.06 9.5 2.85 -3.42 19.5 1.95 -4.10 Covxy -16.03 Weight Y Sq weight Y Cov. XY Var XY SD XY wy 2 covxy varxy sxy wy 0.5 0.25 -16.03 61.67 7.85 Deviation sq. 2 2 (RP - ERP) (RP - ERP) p 169 50.7 9 3.6 289 86.7 varP 141 11.87
- 8. [(RP - ERP) [(RP - ERP) 2 (RM - ERM)] (RM - ERM)]p (RM - ERM) pM 172.8 -312 -93.6 14.4 18 7.2 76.8 -272 -81.6 264 covarPM -168 16.25 -168 -0.871 -0.636 Expected return Risk Treasury Bills premium 1.94% 3.76% 2.85% -4.35% 4.60% 4.35% 3.13% 1.25% ue of the probability distributions of possible returns. xure Table F). This means that there is 2.28% nge between 10% and 30%. There is 95% chance that bout 12.6 % probability that the return will be 30% or more.