Download to read offline

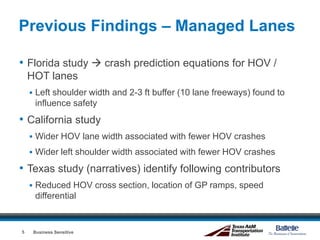
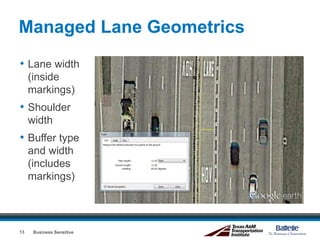
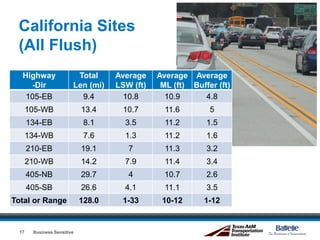
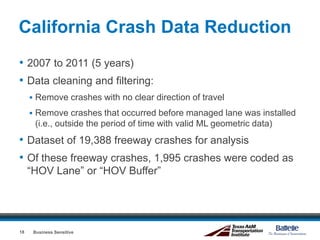
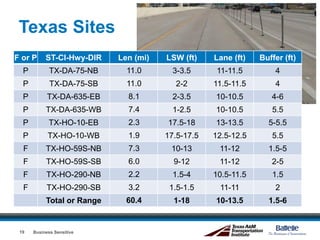
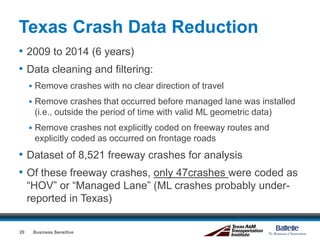
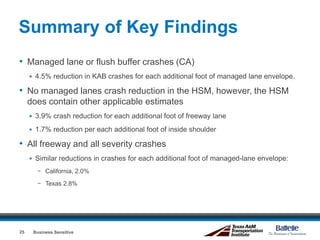

The document evaluates the safety implications of managed lane cross-sectional elements, focusing on lane, buffer, and shoulder widths. Studies from various states including California, Texas, and Florida highlight that reductions in lane and shoulder widths may increase crash rates, while wider dimensions tend to correlate with fewer crashes. The findings underscore the need for careful design and management of freeway lanes to enhance safety.


