S1 relational database pdf
•
1 like•496 views

This document describes how to create a relational database in Microsoft Access with two tables - a Courses table and a Sections table - linked in a one-to-many relationship. It initializes a new database, designs the tables, adds sample data, links the tables, and demonstrates what happens when records are updated, modified, and deleted with and without enforcing referential integrity and cascade options. The key aspects of referential integrity and how it ensures consistency between related tables are explored through examples of adding, modifying, and deleting records with various configuration settings.

More Related Content
Similar to S1 relational database pdf
Similar to S1 relational database pdf (20)
Recently uploaded
Recently uploaded (20)
S1 relational database pdf
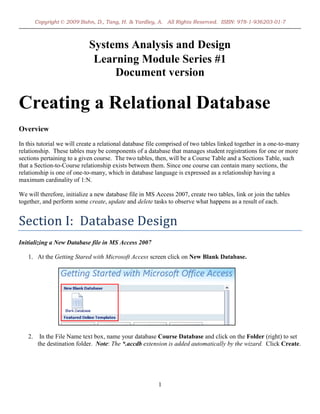
- 1. Copyright © 2009 Bahn, D., Tang, H. & Yardley, A. All Rights Reserved. ISBN: 978-1-936203-01-7 Systems Analysis and Design Learning Module Series #1 Document version Creating a Relational Database Overview In this tutorial we will create a relational database file comprised of two tables linked together in a one-to-many relationship. These tables may be components of a database that manages student registrations for one or more sections pertaining to a given course. The two tables, then, will be a Course Table and a Sections Table, such that a Section-to-Course relationship exists between them. Since one course can contain many sections, the relationship is one of one-to-many, which in database language is expressed as a relationship having a maximum cardinality of 1:N. We will therefore, initialize a new database file in MS Access 2007, create two tables, link or join the tables together, and perform some create, update and delete tasks to observe what happens as a result of each. Section I: Database Design Initializing a New Database file in MS Access 2007 1. At the Getting Stared with Microsoft Access screen click on New Blank Database. 2. In the File Name text box, name your database Course Database and click on the Folder (right) to set the destination folder. Note: The *.accdb extension is added automatically by the wizard. Click Create. 1
- 2. Copyright © 2009 Bahn, D., Tang, H. & Yardley, A. All Rights Reserved. ISBN: 978-1-936203-01-7 3. Under the All Tables pane, right click on Table1 : Table and select Design View from the drop down menu . (In the Save As dialog box, under Table Name, type Course and click OK . 4. (a) Under the Field Name pane, enter column (or field) names as follows: course_ID (primary key), subject, course_title, credits, and grading_method. (b) Under Section tab, under Data Type, click the down-arrow for the course_ID to select Text Notice the yellow key indicating that “course_ID” is the Primary Key. This key is set by default to the first row in the table 5. From the Table Tools palette, select the Create tab, and click on Table. 2
- 3. Copyright © 2009 Bahn, D., Tang, H. & Yardley, A. All Rights Reserved. ISBN: 978-1-936203-01-7 6. Under the All Tables pane, right click on Table1 : Table and select Design View from the drop down menu . (In the Save As dialog box, under Table Name, type Section and click OK . 7. (a) Under the Section tab, under Field Name, enter Field (or column) names as follows: section_ID (primary key), course_ID (foreign key), location, employee_ID, and day_of_week. (b) Under Section tab, under Data Type, click the down-arrow for the section_ID to select Text. 8. On the main File Menu, click the Save button (Highlighted above in red box). 3
- 4. Copyright © 2009 Bahn, D., Tang, H. & Yardley, A. All Rights Reserved. ISBN: 978-1-936203-01-7 9. Right click on the Section tab and select Close All to close all tabs. Click Yes at the confirmation “Do you want to save changes…” dialog box. 4
- 5. Copyright © 2009 Bahn, D., Tang, H. & Yardley, A. All Rights Reserved. ISBN: 978-1-936203-01-7 Section II: Adding Data to the Tables 1. Under All Tables, double-click on Course : Table. Enter the data as shown below. 1. When you are done, right-click on the Course tab and click Save on the drop down menu. 2. Under All Tables, double-click on Section : Table. Enter the data as shown below. 3. When you are done, right-click on the Section tab and click Save on the drop down menu. 5
- 6. Copyright © 2009 Bahn, D., Tang, H. & Yardley, A. All Rights Reserved. ISBN: 978-1-936203-01-7 4. From the Table Tools palette, select the Database Tools tab, and click on Relationships 5. If the Show Table window doesn’t automatically appear, click the Show Table button. 6. Click on course to highlight it, and click the Add button (below left); then click on section to highlight it, and click the Add button (below right). 6
- 7. Copyright © 2009 Bahn, D., Tang, H. & Yardley, A. All Rights Reserved. ISBN: 978-1-936203-01-7 Referential Integrity Referential Integrity in a relational database describes consistency between related tables. In this section, we explore the following: What happens and what it means to relate two tables together without enforcing Referential Integrity What happens and what it means to relate two tables together in a One-to-Many relationship Enforcing Referential Integrity, but without enforcing Cascade Update Related Fields or Cascade Delete Related Records What happens and what it means to relate two tables together in a One-to-Many relationship enforcing Referential Integrity and enforcing Cascade Update Related Fields What happens and what it means to relate two tables together in a One-to-Many relationship enforcing Referential Integrity and enforcing Cascade Delete Related Records Section III: Update, modify and delete observations … (a) Without Referential Integrity Let us examine what happens and what it means to relate two tables together without Enforcing Referential Integrity, i.e. leaving this checkbox unchecked. Important: If you are going to try this “hands-on”… Save a copy of your working database now!!! 7
- 8. Copyright © 2009 Bahn, D., Tang, H. & Yardley, A. All Rights Reserved. ISBN: 978-1-936203-01-7 1. Now, we notice that the “course_ID”, which is the primary key in the Course table can be matched to “course_ID” in the Section table, which can be considered a foreign key in the Section table. Click course_ID in the Course Table and drag it over course_ID in the Section Table. 2. The Edit Relationships window displays. In the Edit Relationships window, confirm that course_ID appears on both sides of the join. Notice the Unchecked “Enforce Referential Integrity” checkbox. 8
- 9. Copyright © 2009 Bahn, D., Tang, H. & Yardley, A. All Rights Reserved. ISBN: 978-1-936203-01-7 3. Click Create. Notice that the join is represented by a simple black line and does not indicate the One-to- Many relationship. 4. In the course table, locate the entry for << course_ID BIO123 >> and click on the blue square of the row to highlight it (see red arrow below). 5. Right-click anywhere on the row and select Delete Record from the drop down menu. 9
- 10. Copyright © 2009 Bahn, D., Tang, H. & Yardley, A. All Rights Reserved. ISBN: 978-1-936203-01-7 6. Notice that top record is now BIO124 and the database warns that You are about to delete 1 record(s). Confirm that you are working on a copy of your database, and click Yes to delete the record. 7. Now open the Section Table in the database. Notice that sections 123-01 and 123-02 still exist in the section table even though the course BIO123 they relate to, no longer exists! Since we did not enforce referential integrity between the coupled tables, there is now an inconsistency between them due to the deletion that took place on the Course Table. (b) With Referential Integrity Let us now examine what happens and what it means to relate two tables together in a One-to-Many relationship with referential integrity, but without enforcing Cascade Update Related Fields or Cascade Delete Related Records. 10
- 11. Copyright © 2009 Bahn, D., Tang, H. & Yardley, A. All Rights Reserved. ISBN: 978-1-936203-01-7 8. Double click on the black line (above) joining the two tables. The Edit Relationships window displays. 9. In the Edit Relationships window, click the drop down arrow under Table/Query and select Course from the drop down menu. 10. Confirm that the relationships appear as shown below and check Enforce Referential Integrity (leaving the other two check boxes unchecked) and click OK. 11. 11
- 12. Copyright © 2009 Bahn, D., Tang, H. & Yardley, A. All Rights Reserved. ISBN: 978-1-936203-01-7 Notice that the black line (below) representing the join between the tables now reflects the One-to-Many relationship between the coupled tables. Theoretically, this relationship is a function of a business rule or another such constraint; one course can have many associated sections, but any given section can only have one associated course. As far as database is concerned, however, this relationship is implemented by the Enforcing of Referential Integrity. The end of the line that connects to the Course Table is now designated with a “1” – indicating that this table is the parent table, which can have many children. The end of the line that connects to the Section Table is designated with “∞” – indicating that this table is the child table, which can only have one parent. Thus, one course can have one or more associated sections, but any given section can only have one associated course. 12. Right-click on the Relationship tab and select Close from the drop down menu. If the “Do you want to save changes to the layout of „Relationships‟?” dialog box appears, click Yes. 13. Try to add (Update) a new row in the Section Table. Click on the next available row in the table, enter the complete row for << Section 600-01 >> as shown below and click Enter. 12
- 13. Copyright © 2009 Bahn, D., Tang, H. & Yardley, A. All Rights Reserved. ISBN: 978-1-936203-01-7 Since << course_ID MKT600 >> does not exist in the Course Table, the DBMS returns the following error: This is because of the Enforce Referential Integrity setting that we applied in step 10. Since there is no record of << course_ID MKT600 >> in the Course table, referential integrity prevents us from adding (Updating) this row in the Section Table until we first add it to the Course table. To put this in plain English: We cannot create a section for a course which does not exist. 14. Click once on the blue square of the row for course_ID BIO123 to highlight it. Then right-click anywhere on the row and select Delete Record from the drop down menu. The DBMS returns the following error: 13
- 14. Copyright © 2009 Bahn, D., Tang, H. & Yardley, A. All Rights Reserved. ISBN: 978-1-936203-01-7 Since the course here (course_ID BIO123) has existing and related sections in the Section Table, (namely, Section 123-01 and Section 123-02) the DBMS must prevent the course from being deleted until all related sections have first been deleted. This is because the “sections” are existence-dependent entities with respect to “courses”. A course may exist without a section, but a section cannot exist without a course. To put this in plain English: We cannot delete a course for which a section exists. 15. In the Course Table, if we try to Modify the record for BIO123, changing it to BIO999 … The DBMS returns the following error: Again since << course_ID BIO123 >> has existing and related sections in the Section Table, the DBMS must prevent the course_ID from being modified until all related sections have first been deleted. (c ) With Cascade Updated Related Fields 14
- 15. Copyright © 2009 Bahn, D., Tang, H. & Yardley, A. All Rights Reserved. ISBN: 978-1-936203-01-7 16. Double click on the black line (above) joining the two tables. The Edit Relationships window displays. 17. In the Edit Relationships window, click the drop down arrow under Table/Query and select Course from the drop down menu. 18. In the Edit Relationships window, confirm that Enforce Referential Integrity is checked, check the Cascade Updated Related Fields check box and click OK. 19. Double-click on the course table to modify the Course Table. Click on the row for <<course_ID BIO123>> and modify it to read BIO999. Right click on the Course Table tab, and select Save from the drop down menu. 15
- 16. Copyright © 2009 Bahn, D., Tang, H. & Yardley, A. All Rights Reserved. ISBN: 978-1-936203-01-7 20. Now click on the Section Table tab. Notice that the records for Section 123-01 and Section 123-02 have been updated under the course_ID column, to reflect their modified associated course BIO999. (d) With Cascade Deleted Related Fields 21. Double click on the black line (above) joining the two tables. The Edit Relationships window displays. 22. In the Edit Relationships window, click the drop down arrow under Table/Query and select Course from the drop down menu. 16
- 17. Copyright © 2009 Bahn, D., Tang, H. & Yardley, A. All Rights Reserved. ISBN: 978-1-936203-01-7 23. In the Edit Relationships window, confirm that Enforce Referential Integrity is checked, check the Cascade Deleted Related Records check box and click OK. (All three may be checked here). 24. Double-click on the course table to modify the Course Table. Click on the blue square to select and highlight the row for << course_ID BIO999 >> right click anywhere on the row and select Delete Record from the drop down menu. Note: This row originally was named BIO123 but was modified to BIO999 in the previous section. 17
- 18. Copyright © 2009 Bahn, D., Tang, H. & Yardley, A. All Rights Reserved. ISBN: 978-1-936203-01-7 25. Click Yes to confirm that want to delete these records… 26. Click on the Section Table tab to notice that Section 123-01 and Sections 123-02 have been deleted. 18
- 19. Copyright © 2009 Bahn, D., Tang, H. & Yardley, A. All Rights Reserved. ISBN: 978-1-936203-01-7 This completes the documentation for Systems Analysis and Design Learning Module Series #1 Document version Creating a Relational Database 19