Download to read offline
![Rudin Center for Transportation, NYU Wagner
12 / 22
“Queens deserves its fair share of blue bikes and we
are here to let it be known, ‘We want bike share!’”
- City Council Member Jimmy Van Bramer
“We view bike sharing as an another important mode of
public transit...We fully intend to...[ensure the systems] are
designed in a way to support existing transportation
networks.”
- John Samuelson, TWU Local 100
Local Attention](https://image.slidesharecdn.com/92310levensonactivatingcomm-141017141514-conversion-gate01/85/RV-2014-Activating-Communities-with-Active-Transportation-13-320.jpg)
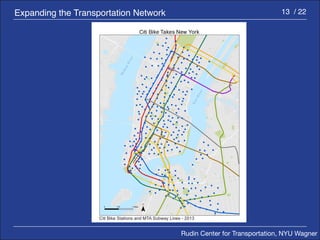
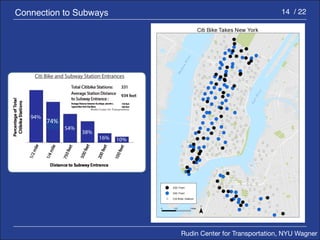
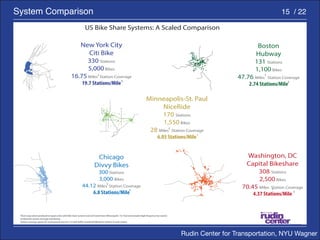

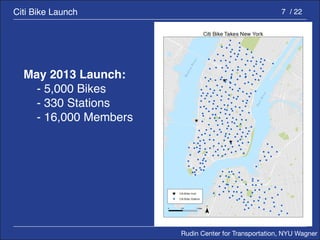
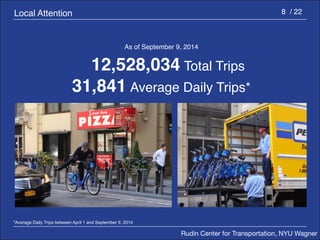
The document discusses the Citi Bike bike sharing system in New York City. It provides details on the planning, launch, expansion, usage, and impact of Citi Bike. Key points include that Citi Bike launched in 2013 with 5,000 bikes and 330 stations, and as of 2014 had over 12.5 million trips taken. The system connects to the subway system and has helped increase bicycling and retail sales in the city. There are ongoing plans to expand Citi Bike to more neighborhoods.


