The document outlines a project plan for constructing a custom home for the Simpsons, featuring a 2,900-square-foot layout with 3 baths and 4 bedrooms, all within a $550,000 budget and a 7-month timeline. It details project scope, objectives, deliverables, milestones, and technical requirements to ensure successful completion while preventing scope creep. Key project management strategies emphasize balancing time, cost, and quality to meet customer satisfaction.


![Controller of the Universe, 2007
found tools and wire, 285 x 405 x 455 cm
Spotlight
100 Harvard Business Review January–February 2011
SPOTLIGHT ON BUSINESS MODEL INNOVATION
1568 JanFeb11 Casadesus-Masanell.indd 1001568 JanFeb11
Casadesus-Masanell.indd 100 12/3/10 3:52:19 PM12/3/10
3:52:19 PM
Joan E. Ricart ([email protected]
edu) is the Carl Schroder
Professor of Strategic Man-
agement and Economics
at IESE Business School in
Barcelona.
Ramon Casadesus-
Masanell ([email protected]
gmail.com) is an associate
professor at Harvard Busi-
ness School in Boston.
How to Design
A Winning
Business Model
Smart companies’ business models generate
cycles that, over time, make them operate
more eff ectively. by Ramon Casadesus-Masanell
and Joan E. Ricart](https://image.slidesharecdn.com/runningheadhousebuildingprojectplan-230125022624-d4343c3d/85/Running-head-HOUSE-BUILDING-PROJECT-PLAN-docx-7-320.jpg)

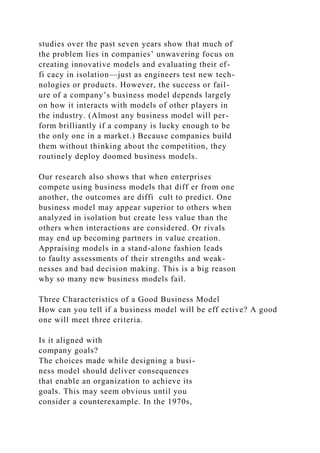
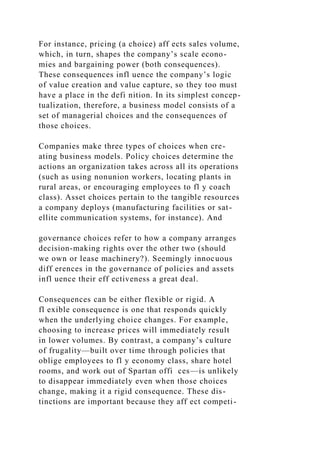
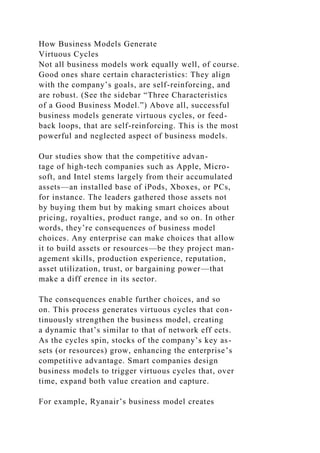
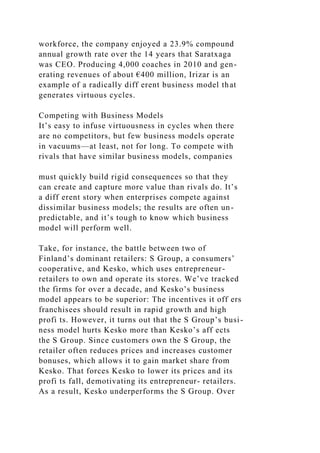


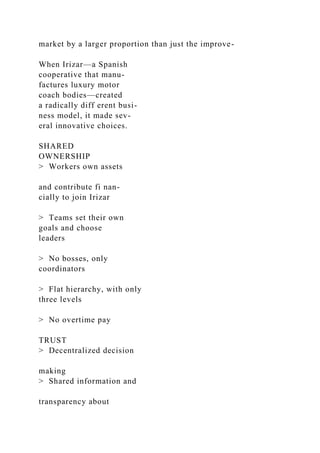
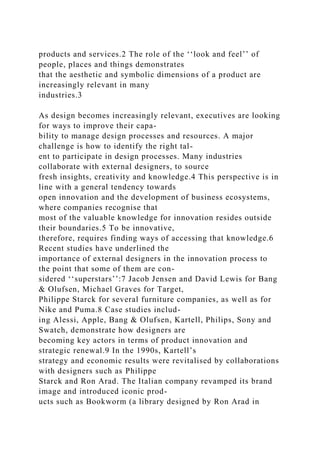
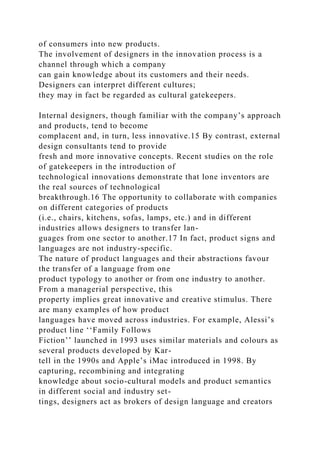

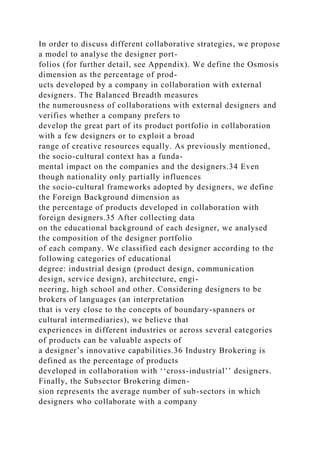
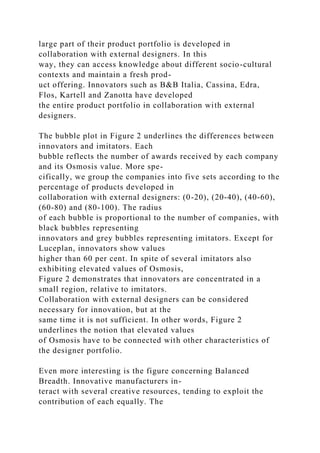
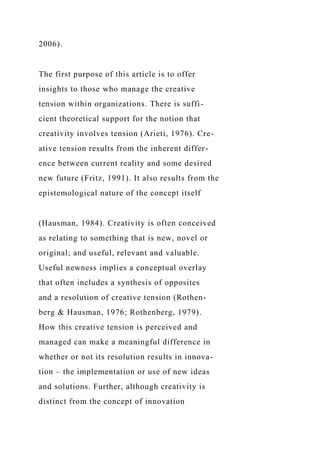
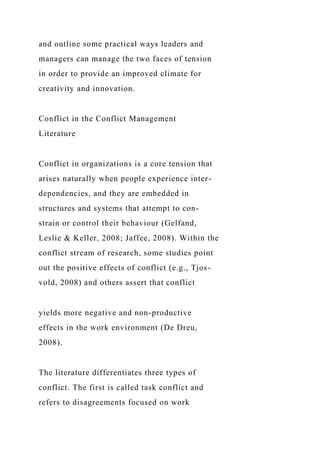
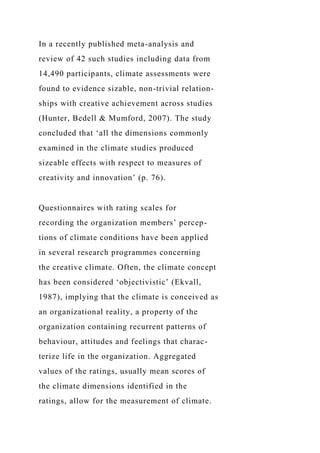
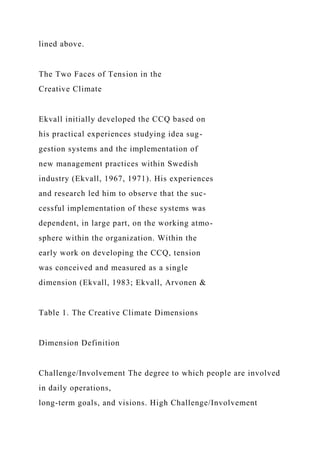
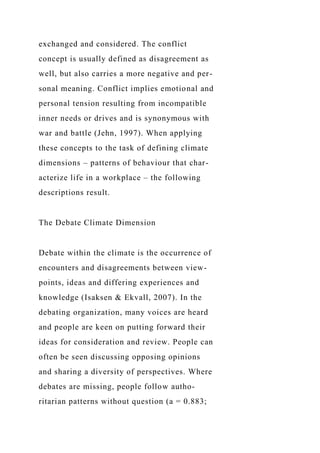
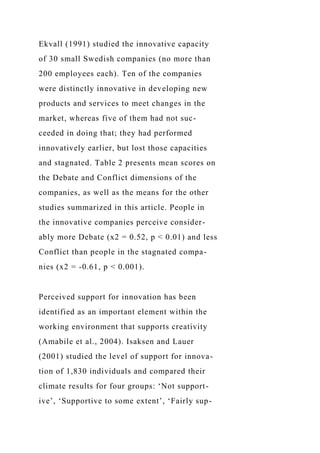
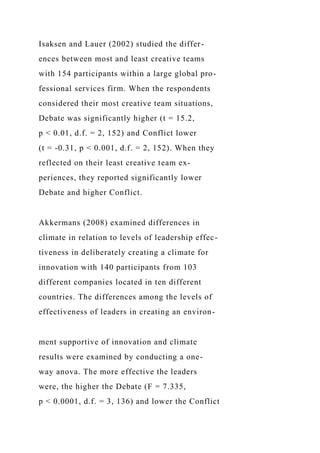
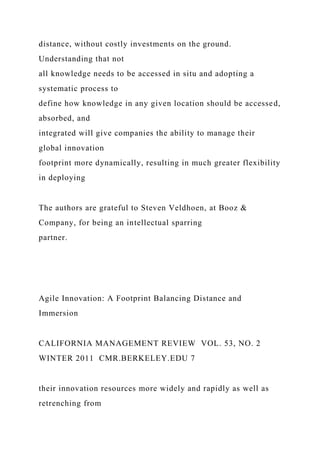
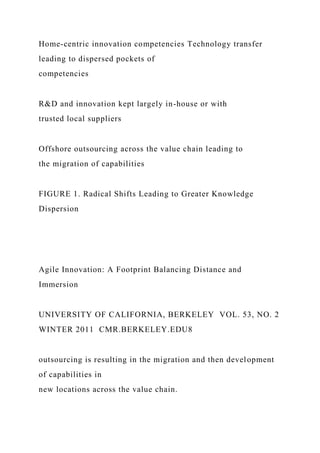
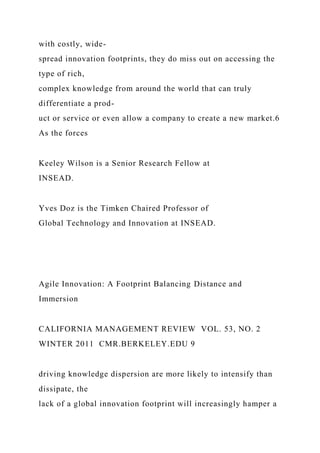
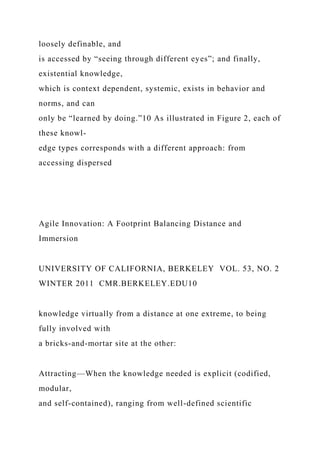
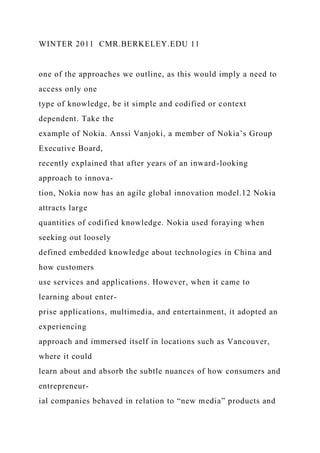
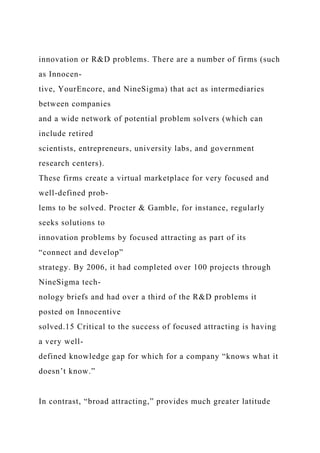
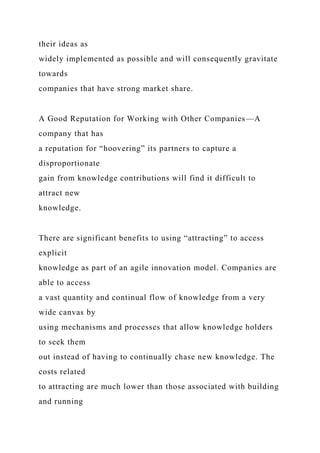
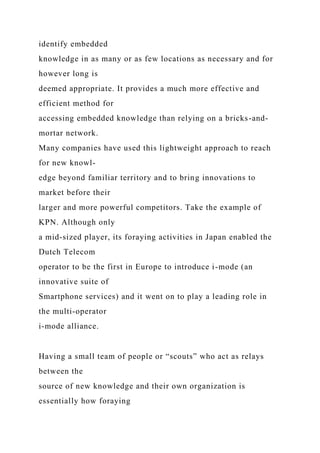
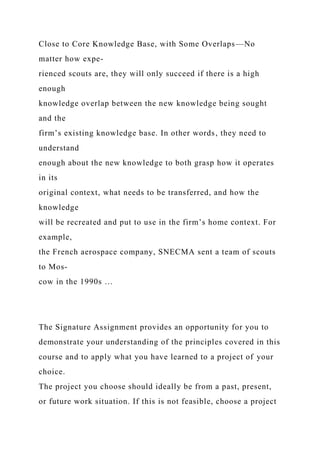
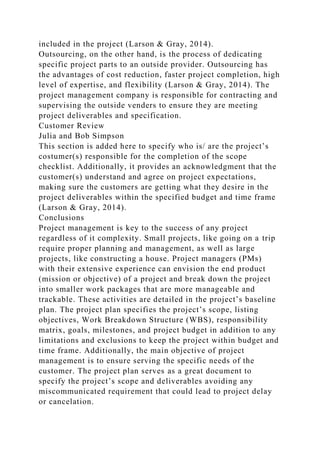
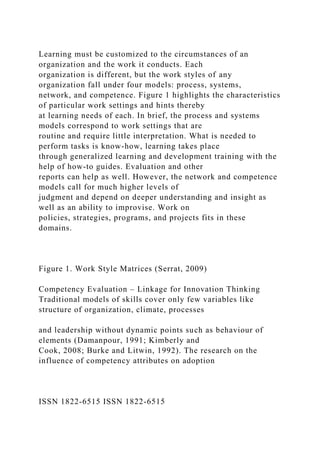
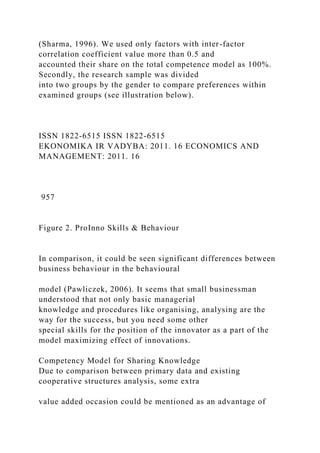
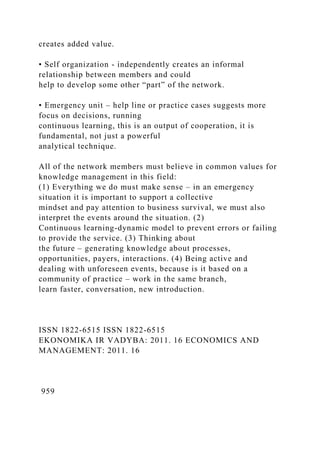
![Table 2. Designer portfolios - t test: Innovators vs. Imitators
Innovators Imitators T df
N 21 77
Osmosis 90.5% 76.6% �2.528* 69.328
Balanced Breadth 0.457 0.313 �2.973** 46.119
Foreign Backgrounda 45.7% 16.0% �4.847*** 89.000
Educational Background 0.716 0.432 �6.059*** 59.291
Industry Brokering 61.9% 51.1% �1.857 59.030
Subsector Brokering 2.234 1.736 �2.115* 96.000
*p < 0,05; **p < 0,01; ***p < 0,001.
a Including 70 imitators; 7 companies also have divisions
outside of Italy.
Long Range Planning, vol 43 2010 129
Figure 2. Osmosis e Innovators vs Imitators [radius is
proportional to the number of companies]
average number of external designers belonging to innovators’
portfolios is impressively higher than
that of the imitators’ portfolios (11.9 vs 4.4). For example,
innovators such as Artemide, Driade,
FontanaArte, Magis and Moroso collaborate with more than 15
freelance designers. Also, consid-
ering the ratio between the number of external designers and
number of products, innovators’
values are significantly higher than imitators’ metrics. As
mentioned in the Appendix, we have con-
sidered the contribution of the Gini dispersion index in the
definition of Balanced Breadth. This is
used to verify whether a company prefers to develop the](https://image.slidesharecdn.com/runningheadhousebuildingprojectplan-230125022624-d4343c3d/85/Running-head-HOUSE-BUILDING-PROJECT-PLAN-docx-48-320.jpg)
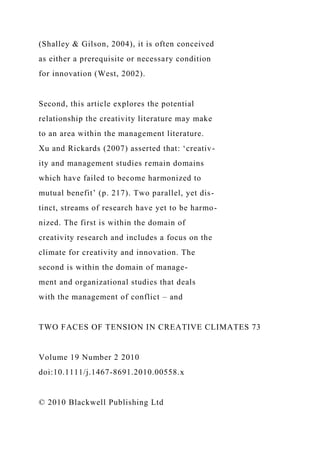
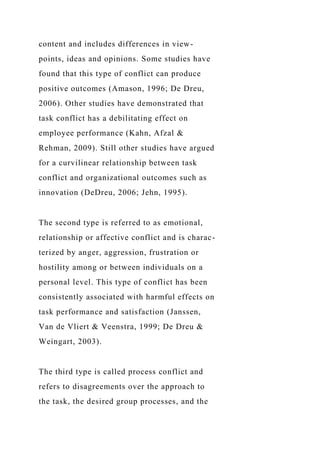
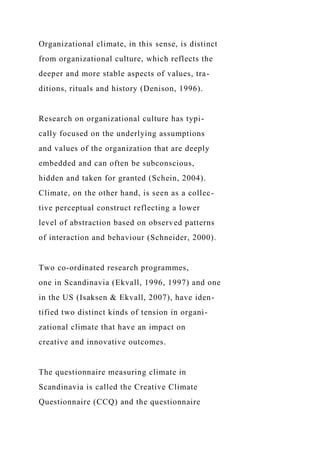
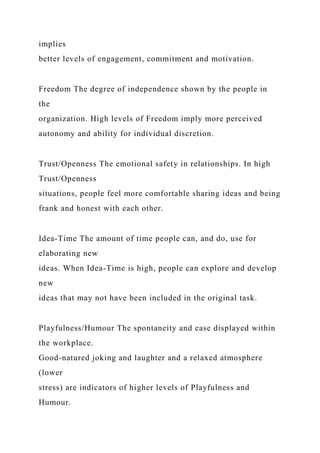
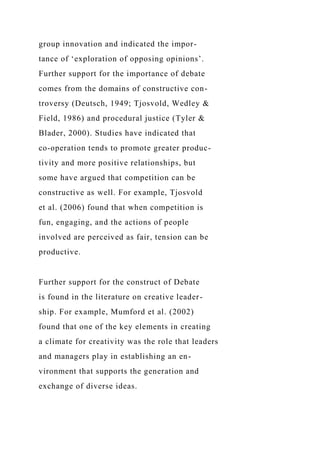
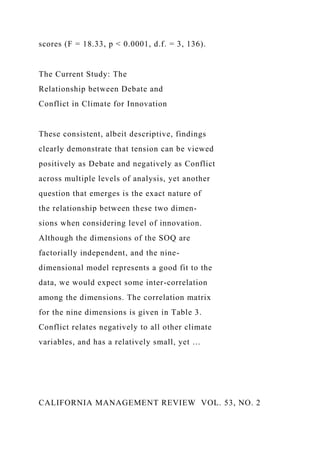
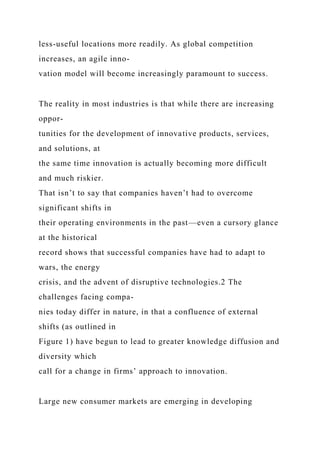
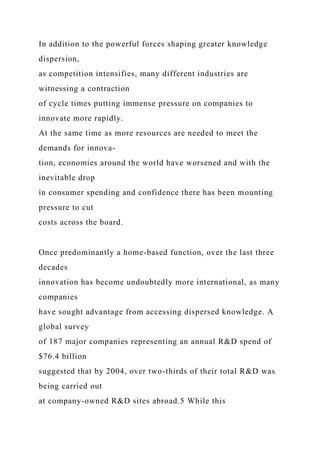
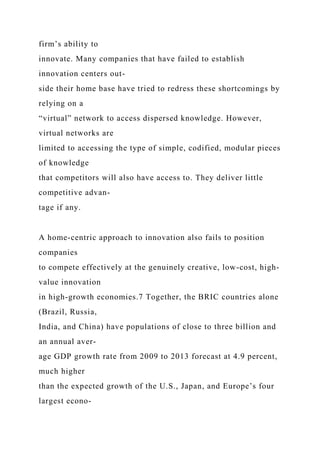
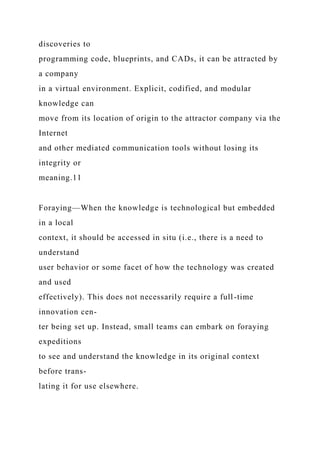
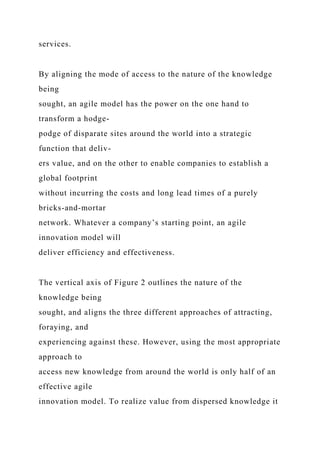
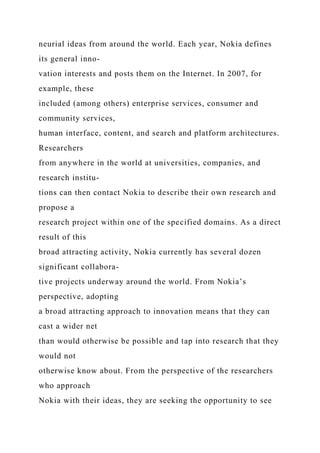
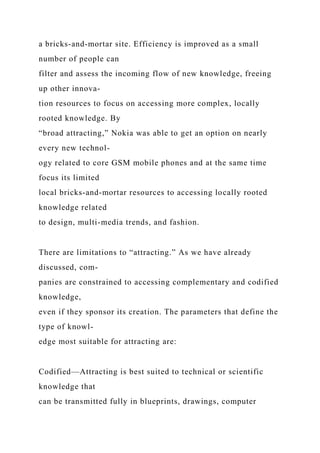
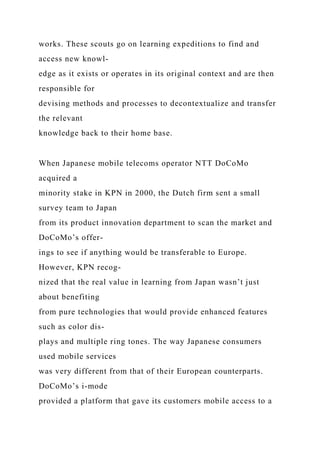
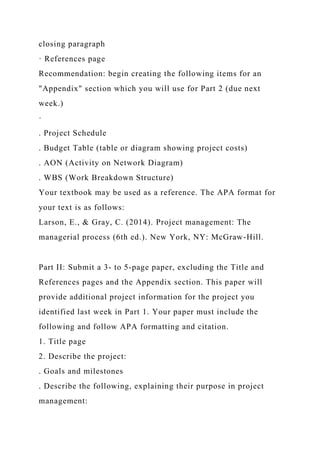
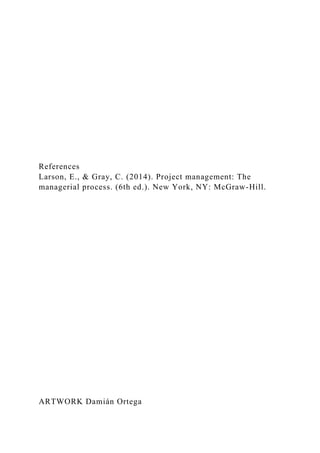
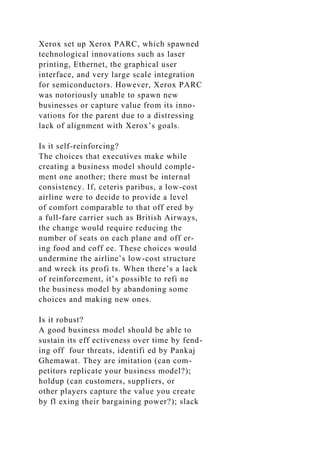
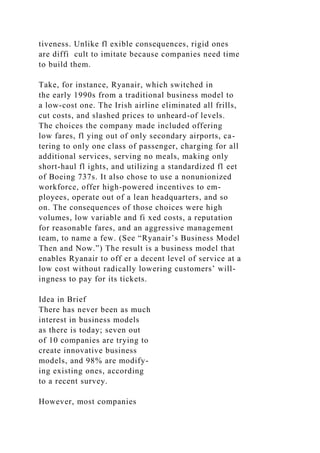
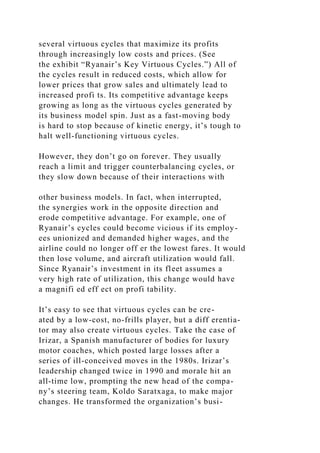
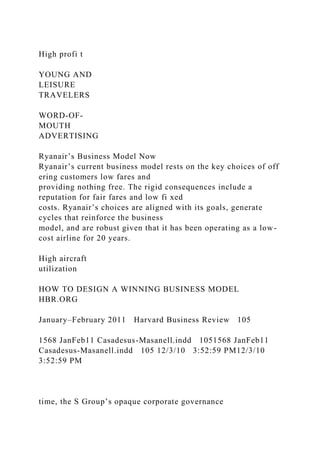
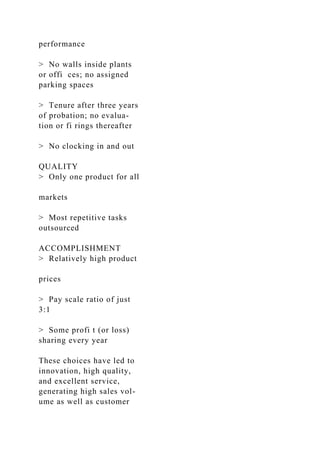
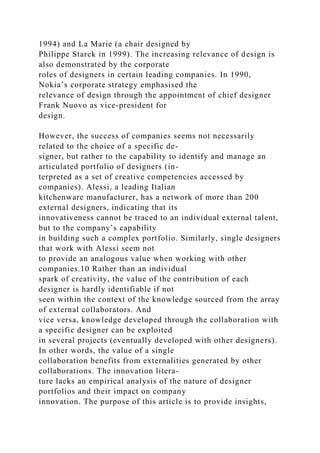
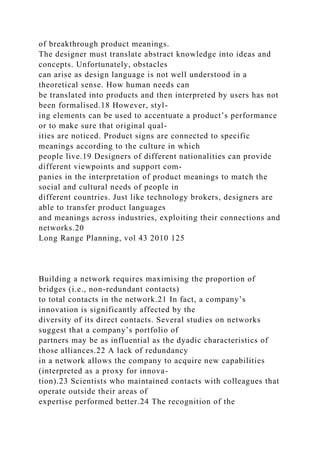
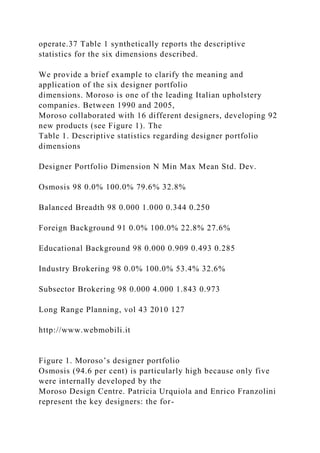
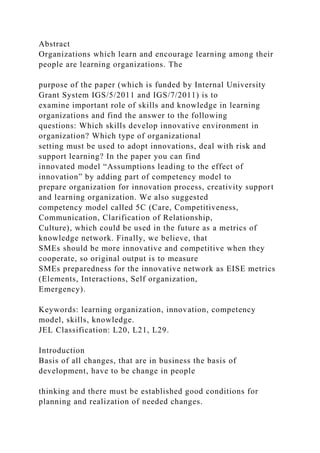
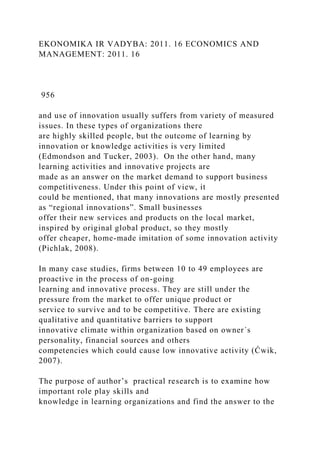
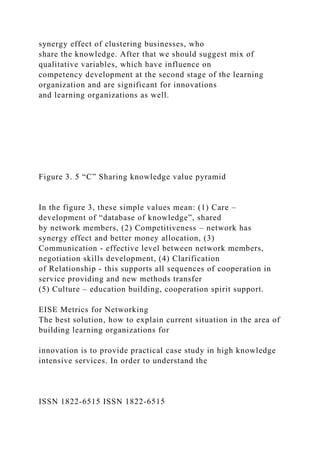
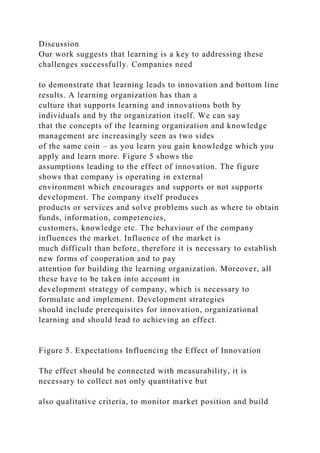
![majority of its product portfolio in col-
laboration with a few designers or to engage with a broad range
of creative resources. Table 2 shows
that innovators’ Balanced Breadth is significantly higher than
that of imitators (0.457 vs 0.313).
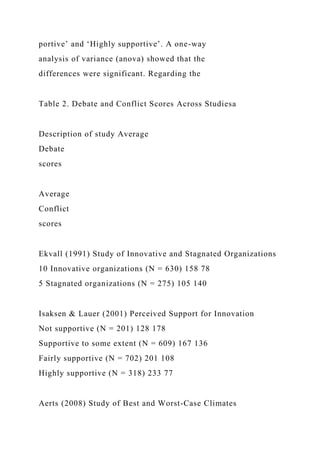
Besides Osmosis and Balanced Breadth, the relationship
between knowledge diversity of creative
collaborators and company innovation is analysed in terms of
Foreign Background, Educational
Background, Subsector Brokering and Industry Brokering (see
Table 2). Innovators tend to develop
about half of their product portfolio in collaboration with
foreign designers (45.7 per cent), while
imitators show significantly lower values (16 per cent) for the
Foreign Background metric. The
empirical results show a curvilinear relationship between
innovation and the percentage of products
developed in collaboration with foreign designers. The bubble
plot for Foreign Background in
Figure 3 shows an inverted U-shaped curve: 42.6 per cent of
innovators belong to the central set
Figure 3. Foreign Background e Innovators vs Imitators [radius
is proportional to the number of
companies]
130 Collaborative Strategies in Design-intensive Industries
(40-60 per cent). Knowledge exchange driven by creative
resources from different countries allows
innovators to access new semantic contexts and to propose
innovations in product sign and mean-
ing. Innovators collaborate with designers from 5.3 different
nations, whereas imitators have a cor-](https://image.slidesharecdn.com/runningheadhousebuildingprojectplan-230125022624-d4343c3d/85/Running-head-HOUSE-BUILDING-PROJECT-PLAN-docx-49-320.jpg)

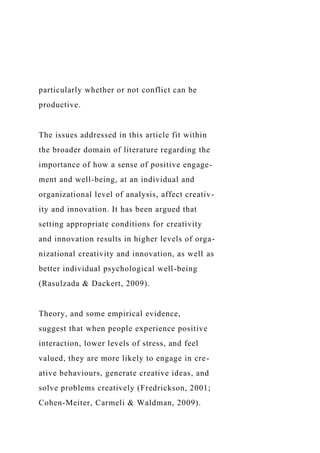
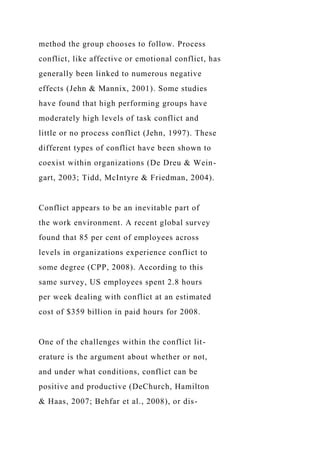
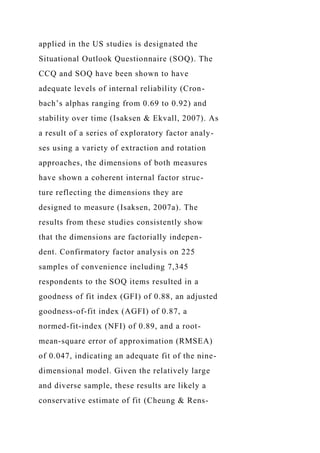
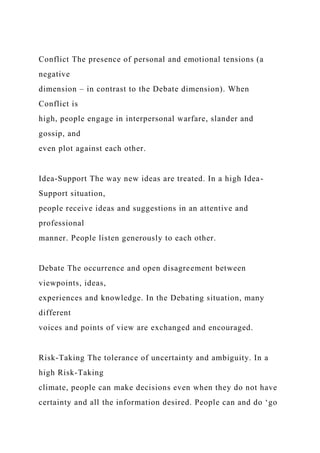
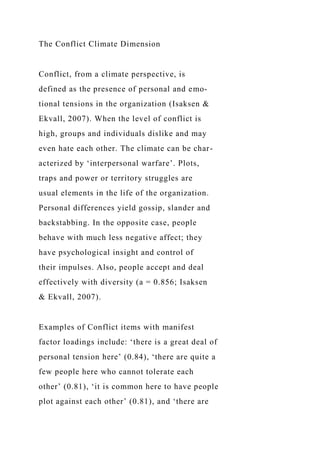
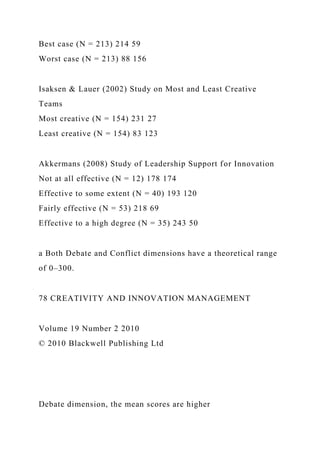
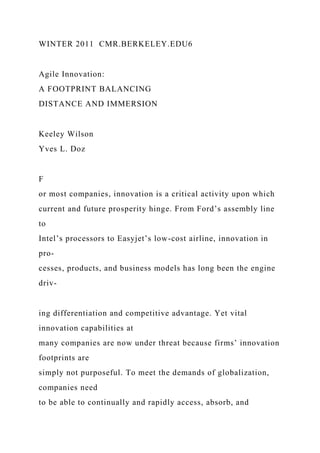
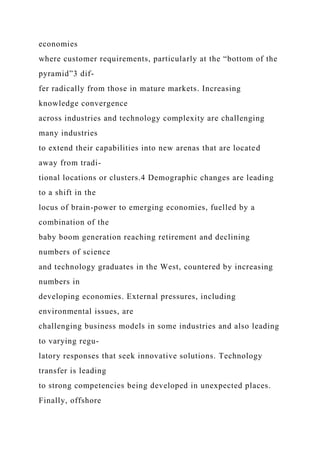
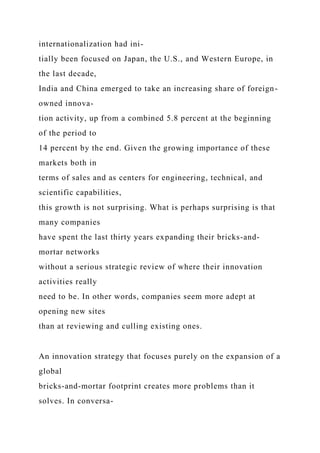
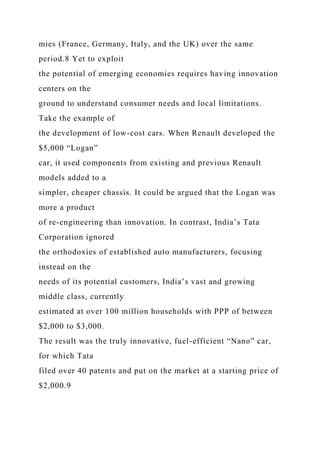
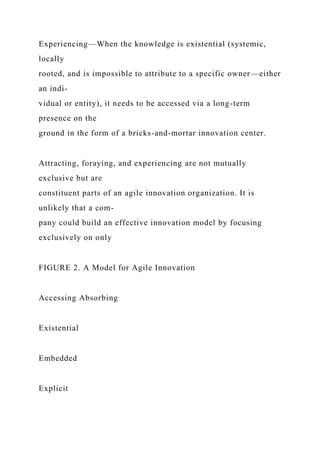
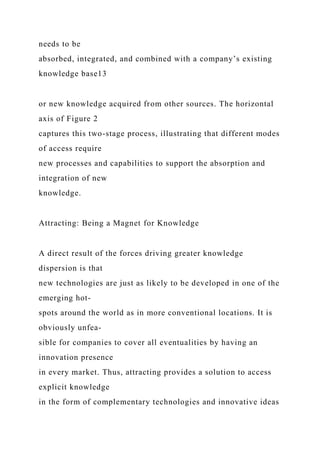
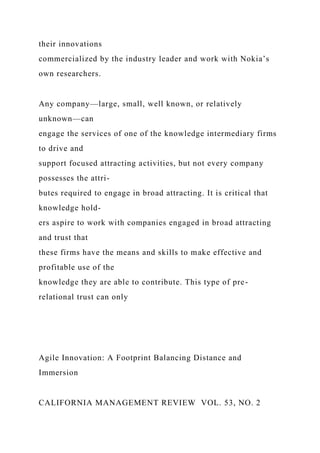
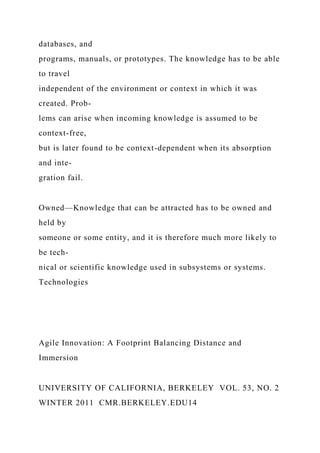
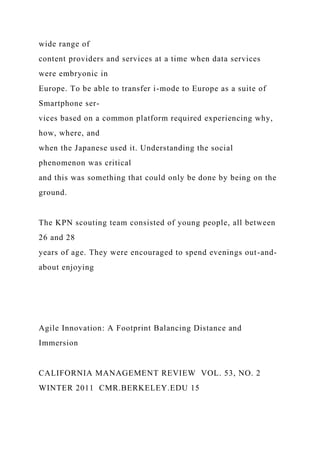
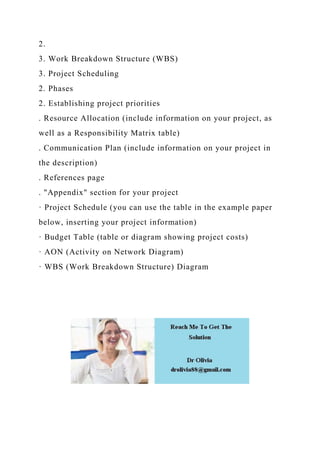
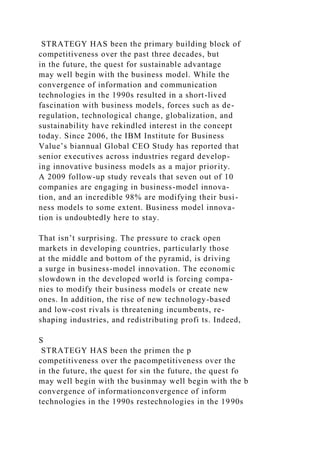
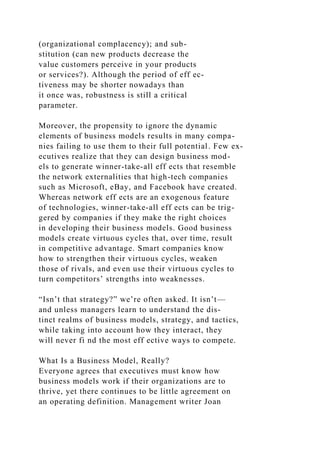
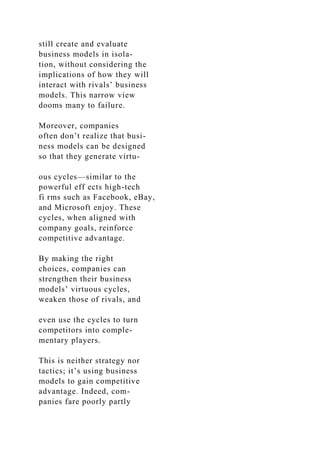
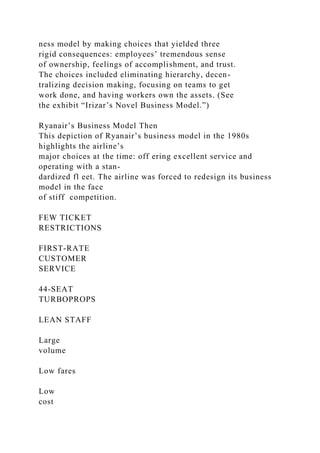
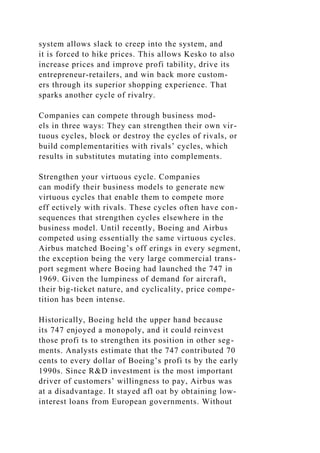
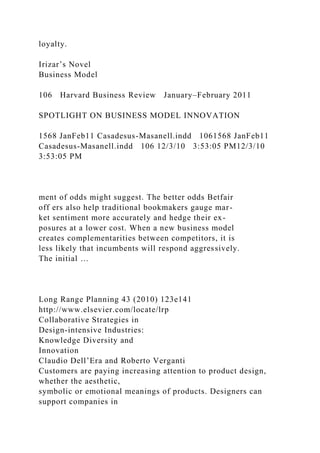
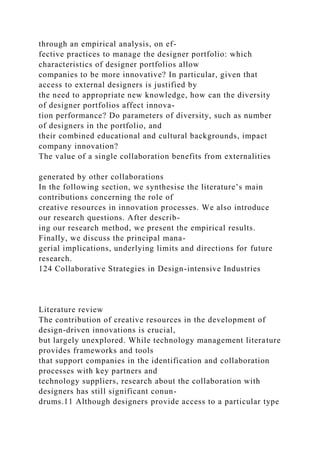
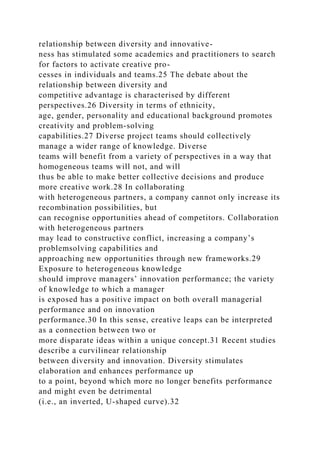
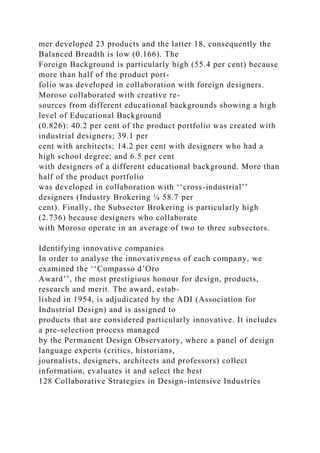
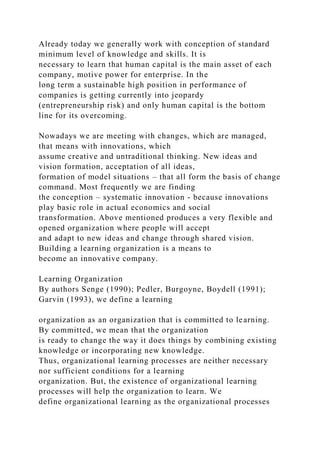
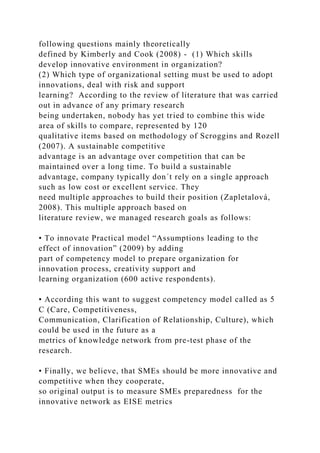
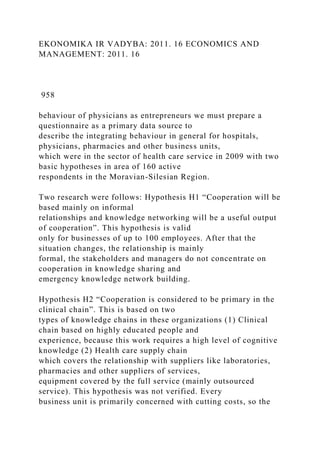
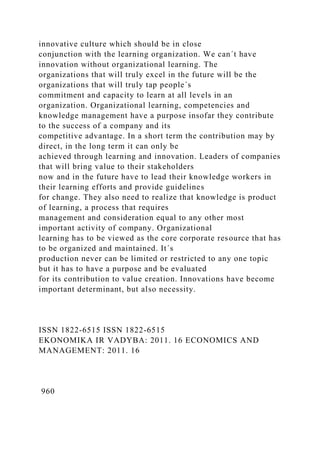
![statistically significant. Figure 5 shows a bubble
plot obtained by grouping the companies into five sets
according to their Industry Brokering values:
(0-20 per cent), (20-40), (40-60), (60-80) and (80-100).
Similarly to Foreign Background also
Industry Brokering shows an inverted U-shaped: innovators are
concentrated in a central set d 47.6
per cent of innovators belongs to the (60-80) group. Few
innovative companies, such as Driade,
Flos and FontanaArte develop more than 80 per cent of their
products in collaboration with
designers who operate across several industries. At the same
time, other innovators, such as B&B
Italia, Foscarini and Luceplan, show values lower than 40 per
cent. Future research could
explore this further by analysing whether specific industries can
significantly …
ISSN 1822-6515 ISSN 1822-6515
EKONOMIKA IR VADYBA: 2011. 16 ECONOMICS AND
MANAGEMENT: 2011. 16
954
COMPETENCIES AND INNOVATION WITHIN LEARNING
ORGANIZATION
Jarmila Šebestová1, Žaneta Rylková2
1Silesian University, Karvina, Czech Republic,
[email protected]
2Silesian University, Karvina, Czech Republic,
[email protected]](https://image.slidesharecdn.com/runningheadhousebuildingprojectplan-230125022624-d4343c3d/85/Running-head-HOUSE-BUILDING-PROJECT-PLAN-docx-51-320.jpg)
![aimed at adding value to the knowledge
acquired and communicated throughout the firm. As such,
organizational learning processes encompass the
acceptance and the assimilation of knowledge. We can say that
organizational learning is the process that
should lead to the building of firm´s competencies and that a
valuable learning experience will lead to firm-
specific, distinctive competencies.
Organizational learning is a strategic process and a learning
organization is the output of this process
that will allow the development of new or regenerated core
competencies and products. Many studies of
learning organizations have attempted to diagnose the
characteristics of learning organization. Although
different authors stress different elements, the characteristics of
the learning organization incorporated in this
study have been proposed important features: open
communications, risk taking, support and recognition for
mailto:[email protected]
ISSN 1822-6515 ISSN 1822-6515
EKONOMIKA IR VADYBA: 2011. 16 ECONOMICS AND
MANAGEMENT: 2011. 16
955
learning, resources to perform the job, teams, rewards for
learning, training and learning environment,
knowledge management.
Innovation and Learning](https://image.slidesharecdn.com/runningheadhousebuildingprojectplan-230125022624-d4343c3d/85/Running-head-HOUSE-BUILDING-PROJECT-PLAN-docx-54-320.jpg)
![Their economical and business importance predestines
developmental tendency and performance growth in
economics of states and companies. In management of
innovation there is purposeful to understand under
innovation a creative human activity, which developed positive
change in structure of entrepreneurial
subjects and which has results in required and expected positive
effect.
Conclusion
The challenge facing managers today is to make the effort
needed to learn some of the new skills and
techniques, and to put in processes that engage their workforce
in programmes of continuous capability
development. Learning should be integrated into the doing, as
part and parcel of everyday work. It should
also be energising, stimulating and fun. Getting the best out of
everybody, including yourself to meet the
challenges ahead. In today´s conditions of uncertainty and rapid
change, many organizations need to reassess
focus and direction quickly, rethink how people work together
and learn for innovation.
References
1. Burke, W. W., Litwin, G. H.: A causal model of
organizational performance and change. “Journal of
Management”,1992, vol.18, pp. 523–545.
2. Ćwik, K.: Elastyczność i innowacyjność a zachowania
strategiczne przedsiębiorstw, „Zarządzanie” No. 5 Prace
Naukowe Akademii Ekonomicznej We Wrocławiu Wydawnictwo
Akademii Ekonomicznej im. Oskara Langego
we Wrocławiu Wrocław 2007 [in Polish].](https://image.slidesharecdn.com/runningheadhousebuildingprojectplan-230125022624-d4343c3d/85/Running-head-HOUSE-BUILDING-PROJECT-PLAN-docx-67-320.jpg)
![3. Damanpour, F.: Organizational innovation: A meta-analysis
of effects of determinants and moderators. “Academy
of Management Journal”, 1991 vol.34, pp.555–590.
4. Edmondson, A. C., Tucker, A. L.: Why hospitals don't learn
from failures: organizational and psychological
dynamics that inhibit system change. “California Management
Review”, 2003 Vol. 45, No. 2. p. 55-72.
5. Henderson R. M., Clark K.C.: Architectural Innovation: the
Reconfiguration of Existing Product Technologies and
the Failure of Established Frims. [in:] Administrative Science
Quarterly, 35.
6. Hurley, R. F., Hult G. T.: Innovation, Market Orientation,
and Organizational Learning: an Integration and
Empirical Examination. [in:] Journal of Marketing, 62.
7. Ilangovan, A., Scroggins, W.A. Rozell, E.J. Managerial
Perspectives on Emotional Intelligence Differences
Between India and the United States: The Development of
Research Propositions. “International journal of
Management” 24/3 , 2007 541-549
8. Kimberly, J.,Cook, J. M. Organizational Measurement and
the Implementation of Innovations in Mental Health
Services. “Administration and Policy in Mental Health and
Mental Health Services Research” ,2008, vol. 35,
pp.11-20.
9. Lehman, W. E. K., Greener, J. M., Simpson, D. : Assessing
organizational readiness for change. “Journal of
Substance Abuse Treatment”, 2002, pp.197–209.
10. McDaniel, R.R., Driebe, D. J. : Complexity Science and
Health Care Management. [in:] John D. Blair, Myron D.](https://image.slidesharecdn.com/runningheadhousebuildingprojectplan-230125022624-d4343c3d/85/Running-head-HOUSE-BUILDING-PROJECT-PLAN-docx-68-320.jpg)
![Fottler and Grant T. Savage, (Eds.) Advances in Health Care
Management, Stamford, CN: JAI Press, 2001, volume
2, pp. 11-36.
11. Pawliczek, A. : Podnikání ve výzkumu a vývoji, inovace a
start-up (spin-off). Distanční studijní opora ke kurzu v
projektu ESF CZ.04.1.03/3.215.1/0103. 87 s. Ostrava, 2006 [in
Czech].
12. Pedler M., Boydell T., Burgoyne P.: Towards the Learning
Company, [in:] Management Education and
Development, Vol.20, No.1, 1989.
13. Pichlak, M.: Finansowe aspekty innowacyjności
przedsiębiorstw w województwie śląskim. „Organizacja i
Zarządzanie”. Kwartalnik Naukowy nr. 2/2008. 5-16 [in Polish].
14. Senge P. M.: The Fifth Discipline: the Art of Organizational
Learning Systems. Currence Doubleday, 1990. ISBN
0-385-26095-4.
15. Serrat, O.: Dimensions of the Learning Organization, 2009
[in:]
http://www.adb.org/Documents/Information/Knowledge-
Solution
s/Dimensions-Learning-Organization.pdf.
16. Sharma, S.: Applied Multivariate Techniques. New York:
John Wiley & Sons, 1996.
17. Tichá I.: Učící se organizace, Alfa Publishing, 2005. ISBN](https://image.slidesharecdn.com/runningheadhousebuildingprojectplan-230125022624-d4343c3d/85/Running-head-HOUSE-BUILDING-PROJECT-PLAN-docx-69-320.jpg)
![80-86851-19-2. [in Czech].
18. Vlček R.: Hodnota pro zákazníka, Management Press, 2002.
ISBN 80-7261-068-6. [in Czech].
19. Zapletalová, Š. : The Influence of Globalization Process on
the Business Management of Entrepreneurial Subjects
in Central and Eastern Europe. “Current Issues of Business and
Law”, 2008. pp. 167-173.
Copyright of Economics & Management is the property of
Kaunas University of Technology, Faculty of
Economics & Management and its content may not be copied or
emailed to multiple sites or posted to a listserv
without the copyright holder's express written permission.
However, users may print, download, or email
articles for individual use.](https://image.slidesharecdn.com/runningheadhousebuildingprojectplan-230125022624-d4343c3d/85/Running-head-HOUSE-BUILDING-PROJECT-PLAN-docx-70-320.jpg)