This is the 2016 edition of the most appreciated and well-known business digest about the macro-economic and industry sectors updates and forecasts for Romania by professional firms. financial institutions and business leaders.
The document is a survey of 6,000 medium-sized companies across 21 European countries regarding the economic outlook and business conditions in Europe. Some key findings from the survey include:
- The majority of companies view their current business climate positively and expect turnover to increase in the coming months, with the most positive outlooks in Turkey, Ireland, and the UK.
- Near-term economic expectations for domestic economies are cautiously optimistic, with 14 countries expecting improvement and 6 expecting declines.
- Companies plan to increase investments and employment in the coming year, though a lack of skilled labor could hamper some growth plans.
- The biggest risks to business are seen as high raw material prices, weak domestic economies,
This document provides an overview of macroeconomic trends and business investment in Europe. It discusses how the recovery is gaining traction across most European economies, but challenges remain like low inflation and lack of credit for small businesses. While austerity has hampered growth, the ECB has implemented stimulus measures to boost lending and exports. Individual countries also need structural reforms. Europe remains attractive for business due to political stability, open trade policies, and a skilled workforce, though emerging markets present more opportunities for growth.
The document is a program for the EuroFinance 11th annual conference on Cash, Treasury & Risk Management in Turkey to be held on April 20-21, 2015 in Istanbul. The conference will feature presentations and discussions on risk management strategies, economic challenges, innovation, digital processes like e-invoicing, and driving sales and profitability. Topics will explore how Turkish businesses can position themselves for future growth in challenging economic conditions.
More than 100 Ecommerce managers from leading brands in the UK took part in the Bearing Partnership Digital Industry Confidence Report 2009 online survey during the spring of 2009. Between them, respondents manage £7.3 billion of Ecommerce revenue, more than 10 per cent of all UK ecommerce sales in 2008. This report looks at how the Head of Ecommerce felt they performed in 2008 as well as their predictions for 2009 with regards to remuneration, performance, and their confidence levels moving forward.
The document provides an overview of the finance industry in Europe. It discusses how Europe has a well-developed financial sector concentrated in major cities like London. The introduction of the euro has made it easier for households and firms to invest across borders. The financial sector in Central and Eastern Europe is growing due to regional economic growth. European banks are among the largest in the world. The document then examines trends in the industry like deregulation, mergers and acquisitions, and the role of the European Union in facilitating cross-border expansion.
This document summarizes the Deloitte Central Europe Top 500 report for 2013. It provides an overview of the key findings of the report, which ranks the largest 500 companies across 18 Central European countries by revenue. The main points are:
- Revenue growth for the Top 500 companies slowed in 2012, with average revenue growth of 3.3% compared to 9.8% in 2011.
- Ukrainian energy company DTEK had the biggest rise in the ranking, moving from 32nd to 7th place due to several acquisitions.
- The consumer business and transportation industry had the most companies represented at 158, but the energy and resources industry generated the most revenue at 42%.
- Poland had the most
The document summarizes key findings from an analysis of the top 500 companies in Central and Eastern Europe in 2016. It finds that while employment grew significantly in the region (+3.9%), overall turnover and profits declined slightly. The automotive industry surpassed oil and gas to become the largest sector. Economic growth in the region remained solid at around 3% despite a slowdown from 2015 levels. Unemployment rates reached record lows across most CEE countries.
While the European M&A market remains depressed compared to pre-financial crisis levels due to weak economic growth and uncertainty in the eurozone, the number of deals has not declined as sharply as the value of deals, suggesting a potential upturn may be approaching. Cash-rich companies are hesitant to pursue large acquisitions given economic instability, but improving stock markets and attractive asset valuations in Europe are drawing some bargain hunters. A sustained recovery in European equity markets and economic growth could help boost confidence for M&A activity in the region in the coming years.
M&A Deals in Eastern European Countries-2013Shiv ognito
This document provides an overview and analysis of mergers and acquisitions (M&A) activity in emerging Europe in 2013. Some of the key points covered include:
- Total M&A deal value in emerging Europe declined slightly from 2012 to 2013, dropping from €138 billion to €112 billion. However, the number of deals only declined slightly, from 2,596 deals in 2012 to 2,555 deals in 2013.
- Russia accounted for over 30% of M&A deals by number and over 60% of total deal value. Poland and Turkey had the second and third highest M&A activity levels by number of deals.
- The mining/oil and gas sector saw the highest M&
This document summarizes views from leaders in the UK hospitality industry who are responsible for over £30 billion in annual sales and 850,000 employees. Key findings include:
1) Consumer confidence is more challenged than last year due to economic uncertainty, security threats, and the upcoming EU referendum. Leaders view the economic outlook as still fragile.
2) While current business performance is positive, leaders are cautiously optimistic due to external factors like terrorism and Brexit. Performance in London differs from other regions of the UK.
3) Top concerns for businesses are security threats, attracting and retaining talent, rising costs like minimum wage increases, and general economic uncertainty. Uncertainty keeps many CEOs awake at night.
The document provides an overview of Jordan's economy in 2014, covering various sectors. It discusses how the economy continued recovering from the global downturn, with growth forecast at 4.5%. The banking sector showed robust performance with rising lending and maintained profits. Large-scale projects in infrastructure, tourism and real estate were expected to drive growth in the construction sector. The industrial sector remained important for GDP and employment. Tourism revenues increased 11.1% and the sector focused on niche markets like wellness and religious travel. Telecoms saw increased smartphone and data use despite tax hikes on voice services in 2013.
Hilton Hotels Corporation is one of the world's leading hotel companies operating hotels across 85 countries. It focuses on managing and franchising hotels rather than owning real estate, allowing it to earn stable revenue streams while avoiding downturns in particular regions. While factors like economic conditions and airfare costs can impact hotel revenues, Hilton targets upscale business travelers who are less affected. Hilton was acquired by the Blackstone Group in 2007 and owns popular brands like Hilton, Waldorf Astoria, and Conrad hotels located in major cities worldwide.
Master Investor Magazine March 2016 - Building Long Term Wealth With Dividend...Maria Psarra
This article discusses the difference between money and wealth in the context of dividend investing. Money is short-term gains that can be quickly lost, while wealth is a lasting abundance that is built over time. The author advocates using dividend income to build long-term wealth by selecting stocks with stable, high dividends and dividend growth, holding them long-term rather than trading frequently, and selling if dividends are cut. Regular dividend payments can provide cushion against market downturns and help accumulate wealth for the future.
The retail sector makes significant contributions to the UK economy. It employs over 3 million people across the country and provides flexible employment opportunities. Retail delivers great value for customers through low prices and innovative business models. It also supports the wider economy by spending £130 billion annually with other sectors and paying £30 billion in taxes. UK retailers have embraced e-commerce, leading the world in online retail spending and sales to international customers. Overall, retail is an important, innovative sector that benefits both consumers and the UK as a whole.
Encuesta sobre acceso a la financiación de las pequeñas y medianas empresas e...Círculo de Empresarios
The document summarizes the results of a survey on the access to finance of small and medium-sized enterprises (SMEs) in the euro area between April and September 2013. It finds that while the percentage of SMEs reporting reduced turnover declined slightly, high percentages continued to report increased costs and reduced profits. SMEs also continued reducing their debt levels. The financial situation varied across countries, with SMEs in Germany and Ireland faring better than those in Italy, Spain and Greece. "Finding customers" remained the most commonly cited concern among SMEs, while "access to finance" was a more significant problem for SMEs in stressed countries like Greece, Spain and Ireland.
Cosuri Craciun.ro sub bagheta Gift Idea va prezinta colectia de cadouri corporate Craciun 2013, ce cuprinde o paleta impresionanta de selectii de produse ale unor brand-uri consacrate, la preturi avantajoase, flexibile si cu discounturi pe masura. Pentru discounturi telefonati la numerele: 0720.866.455 sau 0765.267.646
Studiul, ajuns la cea de-a treia ediție anuală, analizează răspunsurile a 270 de reprezentanţi ai unor companii din diverse industrii din România cu privire la modul în care acestea abordează marketing-ul prin intermediul reţelelor de socializare şi impactul pe care acest tip de marketing îl are în prezent în activitatea lor. Studiul are la bază un chestionar aplicat în perioada 3–20 noiembrie 2015. În raport se analizează răspunsurile a 270 de respondenţi din mediul local de business. Studiul utilizat pentru datele comparative la nivel global este “2015 Social Media Marketing Industry Report – How Marketers Are Using Social Media to Grow Their Businesses”.
Care sunt beneficiile promovării pe platforma YouTube? Cum ne îndeplinim obiectivele de promovare pe YouTube? Cum generăm mai multe view-uri și conversii? Ce unelte pune la dispoziție YouTube?
Prezentare susținută de Denis Murărescu - Google România, pe 29 iunie 2017, în cadrul Școlii Digitale pentru ONG-uri: ONG Online.
Școala Digitală pentru ONG-uri este un program anual creat de Asociația Techsoup pentru a ajuta angajați și voluntarii organizațiilor neguvernamentale din România și Republica Moldova să beneficieze de training profesionist și la îndemână online în utilizarea tehnologiei sau soluțiilor online disponibile lor. Mai multe pe https://ongonline.techsoup.ro/.
This document discusses manipulation through mass media. It defines manipulation and describes techniques used, including propaganda, misinformation, and appealing to non-rational behaviors. It discusses how mass media can influence and manipulate public opinion for various motivations. Public opinion is influenced by elite groups and can be persuaded emotionally. Mass media is an important source of information that shapes public opinion but can also be used to manipulate it for hidden agendas.
Etude PwC "Fit for business" sur les entreprises de l'Eurozone (nov. 2014)PwC France
http://bit.ly/EntreprisesEurozone
Les entreprises de la zone euro ne parviennent pas à transformer les défis financiers et structurels issus de la crise actuelle en opportunités de croissance. Elles sont 20% à penser que la zone euro pourrait s’effondrer, mais sont 36% à n’avoir mis en place aucun plan pour lutter contre la crise persistante de région. Telles sont les conclusions d'une étude menée par le cabinet d’audit et de conseil PwC auprès d’environ 400 dirigeants européens (hors services financiers).
This document provides a summary of the performance of small and medium enterprises (SMEs) in the European Union from 2008 to 2013. Some key points:
- SMEs make up over 20 million enterprises in the EU, with 92% having fewer than 10 employees. However, 1% of all enterprises generate 60% of private sector value.
- The main sectors for SMEs are services, trade, industry, and construction. SME performance varied across EU countries in the economic recovery, with German and Swedish SMEs faring better than those in countries like Ireland, Spain and Portugal.
- Six factors are identified as being important for SMEs to stand out from the competition: having a
Once a year Intrum Justitia conducts a comprehensive survey of payment habits in Europe. Called the European Payment Index (EPI), it is the largest survey of its kind.
The document discusses the need to create a balanced and sustainable economy in the UK that is not overly reliant on any one sector or region. It argues that a "new economy" is required that spreads growth throughout the UK by harnessing entrepreneurship and supporting the mid-market sector. The mid-market, consisting of companies with turnover between £10-300 million, is highlighted as an important driver of the UK economy, employing millions of people. However, these companies are sometimes overlooked by policymakers.
- The document summarizes the key findings of the Entrepreneurship Barometer Romania 2013 survey conducted by EY Romania.
- It found that 88% of Romanian entrepreneurs consider access to funding difficult or very difficult, with young entrepreneurs finding it even more difficult at 90%. Access to funding was seen as worsening over the past year.
- Bank loans, venture capital, and business angels were seen as having the largest potential impact to improve entrepreneurship in Romania through increased access to funding, unlike state aids and crowdfunding.
The Barometer of the Círculos, in this third edition, seeks to contribute to collectively solving the big problems that affect Spain. On this occasion, in addition to presenting the shared vision of the Círculo de Empresarios, the Círculo de Economía and the Círculo de Empresarios Vascos, it has enjoyed the participation –begun in 2015– of the Asociación Valenciana de Empresarios, the Club Financiero Vigo-Círculo de Empresarios de Galicia, and the Institución Futuro de Navarra.
The 2016 Barometer diagnoses the structural situation of the Spanish economy so as to identify the principal competitive strengths and weaknesses of our economic and business surroundings. If in 2015 the survey was more representative geographically and by sectors, this year’s Barometer sampling includes a significant number of small and medium-sized firms, precisely the kind of operations that must become larger and more numerous in Spain.
This analysis of the Spanish economy is complemented by a study of Spain’s position in in the principal international indicators of competitiveness, and for the first time in this edition we provide specific sectorial indicators. We also present the opinions of a broad range of businessmen and presidents of Spanish companies and multinational firms operating in Spain.
Based on the conclusions obtained in this Barometer, we present a body of recommendations about those economic and company areas in which action should be taken by both the Public Administrations and the companies themselves. To this end we present some of the best practices of other countries and of Spain in such areas as youth employment, dual vocational training, intraentrepreneurship, and commitment to growth.
The recommendations of the 2016 Barometer seek to consolidate the financial recovery and shore up growth, which will make it possible to resolve the serious problems that plague Spain. Among them: high levels of unemployment and debt, which affect the sustainability of the Welfare State.
Here at the Círculos, we believe it is necessary to promote a more dynamic and competitive Spain that will generate higher levels of wealth and wellbeing, guarantee equality of opportunities, and allow Spain and its companies to face the challenges of a global society.
As with previous editions, we hope that this 2016 Barometer will generate broad debate in society and help design a longed-for project that will usher in a new period of hope, progress and national structuring.
The document is a survey report by the European Chamber of Commerce in Myanmar (EuroCham) on the business confidence of European companies operating in Myanmar. Some key findings from the survey include:
- Nearly half of European companies started operations in Myanmar after 2011 when the country opened up.
- The sectors with the most European employees are manufacturing, transportation and storage, and construction.
- Over the last year, about a third felt the business environment improved while most felt it stayed the same.
- Regulatory issues and legal uncertainty remain the top challenges for European businesses in Myanmar.
- The main motivation for European companies entering the Myanmar market is opportunities in the domestic market.
This document provides an executive summary and introduction to a report on the top 10 risks and opportunities facing global companies in 2013 and beyond. The summary identifies pricing pressure and cost cutting/profit pressure as the top two risks based on a survey of companies. Emerging market demand growth and innovation are identified as the top two opportunities. The risks and opportunities are grouped into four clusters - cost competitiveness, stakeholder confidence, customer reach, and operational agility. The report aims to help companies benchmark their risks and opportunities and inform strategic decision making.
The document provides an overview of the April 2016 issue of Hotel Business magazine. It discusses the key headlines from the budget announcement and its implications for the hospitality industry. Specifically, it notes that while some measures like business rates relief were welcomed, the industry was disappointed that more wasn't done to reduce the impact of the upcoming national living wage and apprenticeship levy. It also summarizes other news items such as the success of Hotelympia 2016.
This document provides a summary of the World Bank's publications catalog for July-December 2015. It lists the Bank's annual flagship titles including the World Development Report 2016 on the internet for development, Doing Business 2016 which compares business regulations in 189 economies, and Global Economic Prospects, June 2015 which examines global economic trends with a focus on developing countries. The catalog describes the content and topics covered in these flagship reports. It also provides ordering information and lists the Bank's various online publication platforms.
The document discusses the findings of a survey conducted by Bearing Partnership, a digital recruitment firm, on the state of the ecommerce industry in the UK. Some key findings include:
1) The survey respondents, who are ecommerce directors of leading UK brands, manage over 10% of the UK's total ecommerce revenue of £59.8 billion.
2) Most ecommerce companies surveyed (77%) met or exceeded their sales targets for 2008, indicating continued growth and confidence in the industry.
3) While some companies expect to reduce staffing levels in 2009, most will maintain or expand their ecommerce teams, showing commitment to supporting further growth.
4) Nearly half of e
- IATA urges UK and EU leaders to ensure future air connectivity between the two regions remains "safe, secure, efficient and sustainable" despite Brexit.
- IATA warns that airfreight volumes may be affected by lower trade levels resulting from Brexit.
- In the long run, Brexit could reduce UK trade volumes by 10-20% according to OECD estimates, impacting airfreight. However the extent is uncertain as it depends on future trade agreements between the UK and EU as well as other countries.
- It may take years for the UK to negotiate new trade deals and aviation agreements after exiting the EU.
Stop looking out of the window and start looking in the mirror (2014)Tony Mattson
Our economy has a productivity problem. The solution is to address our engagement deficit and I believe that marketers are best placed to lead this.
However, marketing professionals have traditionally concerned themselves with external demand- side growth from customers rather than internal supply-side performance from employees. This has to change.
If marketers can embrace this opportunity, they will not only help themselves in their quests to become the business leaders of tomorrow; they will also improve their organisations’ performance and contribute to the wider health of the UK economy.
Following the triggering of Article 50 on 29 March 2017 starting the negotiating process for the UK to leave the EU, this publication provides an overview of implications facing accountants, including corporate governance, audit, accounting, tax, VAT and employment. The publication also contains the articles I wrote on FX implications (3.2 and 3.3).
The document summarizes that wealth management valuations are at record highs since the financial crisis due to lending growth. However, asset growth is expected to slow from 7% annually to 5% as fees face more pressure. Costs are also expected to rise while one-third of industry profitability could be at risk over the next five years. Wealth managers must consider strategic and tactical options like tapping into unbanked assets to address challenges and remain profitable as the environment becomes more competitive.
How Corporate Image in Ukraine, in times of crisis, can help or hinder global reputation for multi-nationals
By Marcus Stober
Vice President & Country Manager, Mmd Ukraine
European Business Association
Roundtable - November 27th, Kiev
The document is the April 2016 issue of Accounting and Business magazine. It provides summaries of various articles in the issue, including an interview with Marianna Trnavská, the CFO of TV channel Markíza Group in Slovakia, who discusses the challenges of rising through the ranks as a woman. It also previews articles on India's economic success compared to other BRIC nations, billionaires who lost significant fortunes in 2015, and improving gender diversity in the Middle East. The issue encourages members to put themselves forward for the ACCA Council and provides an update on services for members.
iDeal Magazine is a quarterly publication which is specially produced and written with business owners in mind.
iDeal Magazine highlights some of the most recent deals BCMS has completed, offering a real insight into the mechanical and emotional processes involved with selling a business.
The publication also incorporates industry news, business updates as well as other business related information.
Sign up here http://www.bcmscorporate.com/business-sale-news-magazine
Acest
blitz survey are la bază răspunsurile primite de la antreprenorii și oamenii de afaceri care au participat la
conferința Business Evolution organizată de Doingbusiness ro la Suceava în data de 24 aprilie 2024 La conferință
au participat 150 de companii cu cifra de afaceri între 250 mii euro și peste 500 milioane euro Pentru realizarea
cercetării s au colectat răspunsuri la un chestionar alcătuit din 12 întrebări Cele 148 de răspunsuri colectate provin
preponderent de la respondenți din mediul urban Datele demografice sunt detaliate la finalul acestui raport
Acest
blitz survey are la bază răspunsurile primite de la antreprenorii și oamenii de afaceri care au participat la
conferința Business Evolution organizată de Doingbusiness ro la Craiova în data de 3 aprilie 2024 La conferință au
participat 170 de companii cu cifra de afaceri între 250 mii euro și peste 500 milioane euro Pentru realizarea
cercetării s au colectat răspunsuri la un chestionar alcătuit din 12 întrebări Cele 155 de răspunsuri colectate provin
preponderent de la respondenți din mediul urban Datele demografice sunt detaliate la finalul acestui raport
Acest
blitz survey are la bază răspunsurile primite de la antreprenorii și oamenii de afaceri care au participat la
conferința Business Evolution organizată de Doingbusiness ro la Brașov în data de 14 iunie 2023 La conferință au
participat 150 de companii cu cifra de afaceri între 250 mii euro și peste 500 milioane euro Pentru realizarea
cercetării s au colectat răspunsuri la un chestionar alcătuit din 12 întrebări Cele 105 de răspunsuri colectate provin
preponderent de la respondenți din mediul urban Datele demografice sunt detaliate la finalul acestui raport
Acest blitz survey are la bază răspunsurile primite de la antreprenorii și oamenii de afaceri care au participat la conferința Business Evolution organizată de Doingbusiness.ro la Iași în data de 27 septembrie 2023. La conferință au participat 180 de companii cu cifra de afaceri între 250 mii euro și peste 500 milioane euro. Pentru realizarea cercetării s-au colectat răspunsuri la un chestionar alcătuit din 12 întrebări. Cele 165 de răspunsuri colectate provin preponderent de la respondenți din mediul urban. Datele demografice sunt detaliate la finalul acestui raport.
Acest blitz survey are la bază răspunsurile primite de la antreprenorii și oamenii de afaceri care au participat la conferința Business Evolution organizată de Doingbusiness.ro la Constanța în data de 11 octombrie 2023. La conferință au participat 160 de companii cu cifra de afaceri între 250 mii euro și peste 500 milioane euro. Pentru realizarea cercetării s-au colectat răspunsuri la un chestionar alcătuit din 12 întrebări. Cele 135 de răspunsuri colectate provin preponderent de la respondenți din mediul urban. Datele demografice sunt detaliate la final.
Acest studiu sondează percepțiile directorilor de marketing și managerilor din conducerea companiilor din România cu privire la rolul marketingului prin rețelele de socializare în cadrul mixului de marketing. Chestionarul, la care s-au primit 339 de răspunsuri, a fost aplicat în perioada 9 februarie – 11 aprilie 2017. Raportul prezintă și date comparative cu rezultatele studiului global similar realizat de Social Media Examiner.
Studiul privind percepţia managerilor asupra evoluției mediului de afaceri românesc în 2017 are la bază un chestionar care analizează percepţiile a 314 executivi de top provenind din companii cu activitate în diverse industrii. Chestionarul a fost aplicat în perioada 1 februarie – 20 martie 2017. 10% dintre respondenți provin din companii cu cifra de afaceri mai mare de 50 de milioane EUR, 18% din companii cu cifră de afaceri între 10-50 milioane EUR, 47% cu cifra de afaceri între 1-10 milioane EUR și 25% sub 1 milion de EUR cifră de afaceri. 57% dintre respondenți au funcția de CEO/Președinte/Director General.
“Business and economic outlook” is a survey that explores the perceptions of top executives from major companies operating in Romania regarding the business outlook for 2016. This report is based on an online survey of 421 C-suite level executives from companies in various sectors, who provided a perspective on how the domestic business environment is perceived at the beginning of 2016 in Romania. This is an analysis of the split between the aggregated results for Romanian-owned companies and foreign-owned companies operating in Romania.
Acest raport se bazează pe un chestionar administrat online celor 421 executivi din companii care activează în 14 industrii, care ne-au oferit perspectiva lor despre cum percep ei evoluția mediului de afaceri la începutul anului 2016. Aceasta este o analiză partajată în funcție de capitalul majoritar al companiilor respondente companii românești și companii străine care își desfășoară activitatea în România.
Această analiză are la bază răspunsurile primite de la antreprenorii și oamenii de afaceri care au participat la conferința Business-2more-Business organizată de Doingbusiness.ro la Ploiești în data de 18 mai 2016.
La conferință au participat 250 de top executivi de la companii cu cifra de afaceri între 250 mii euro și peste 500 milioane euro. Pe lângă top management, au fost prezenți directori financiari, directori de achiziții, directori de vânzări, marketing, etc.
Această analiză are la bază răspunsurile primite de la antreprenorii și oamenii de afaceri care au participat la conferința Business-2more-Businessorganizată de Doingbusiness.ro la Ploiești în data de 14 aprilie 2016.
La conferință au participat 160 de top executivi de la companii cu cifra de afaceri între 250 mii euro și peste 500 milioane euro. Pe lângă top management, au fost prezenți directori financiari, directori de achiziții, directori de vânzări, marketing, etc.
Pentru realizarea cercetării s-au colectat răspunsuri la un chestionar alcătuit din 15 întrebări. Cele 87 de răspunsuri au fost colectate în martie 2016, ele provenind preponderent de la respondenți din mediul urban cu vârsta între 25 și 55+ ani. Sunt prezentate, de asemenea, rezultatele studiului similar derulat la nivel național, ale celui de la Brașov din 2016, dar și rezultatele de la Iași din anul 2015.
Această analiză are la bază răspunsurile primite de la antreprenorii și oamenii de afaceri care au participat la conferința Business-2more-Business organizată de Doingbusiness.ro la Brașov în data de 10 martie 2016. La conferință au participat 150 de companii cu cifra de afaceri între 250 mii euro și peste 500 milioane euro. Pe lângă top management, au fost prezenți directori financiari, directori de achiziții, directori de vânzări, marketing, etc. Barometrul “Business-2more-business” este o analiză care și-a propus să afle răspunsul oamenilor de afaceri din 10 orașe mari din România în legătură cu nivelul de încredere în evoluția pozitivă a economiei. Cercetarea se va derula pe parcursul anului 2016. Datele demografice sunt detaliate la finalul acestui raport. Vă invităm să descoperiți care sunt rezultatele acestui sondaj, dar mai ales care sunt tendințele identificate de acesta.
The document analyzes responses from 270 Romanian companies regarding their use of social media marketing. Some key findings include:
- 74% of respondents use social networks to promote their company, up from 58% in 2014.
- Facebook remains the most used platform at 92%, followed by LinkedIn at 75% and YouTube at 37%. LinkedIn, YouTube, and Twitter all saw notable growth compared to 2014.
- 91% of respondents believe using social networks gives them a competitive advantage. Marketing, sales, and recruitment remain top benefits.
- The marketing department remains the most common one managing social media activities, though more companies are handling it internally without agencies.
- Most companies spend 1-5 hours per week posting on
“O viziune a creșterii” este un studiu care explorează percepțiile directorilor din marile companii care activează în România în ceea ce privește perspectivele de afaceri pentru anul 2016. În această ediție vom oferi, de asemenea, date comparative cu cercetările similare efectuate la începutul anului 2014 și 2015.
Acest raport realizat de EY se bazează pe un sondaj online la care au răspuns de 421 de directori de la companii din diferite industrii, care au oferit o perspectivă asupra modului în care este perceput mediul de afaceri local la începutul anului 2016.
“A vision for growth” is a survey that explores the perceptions of top executives from major companies operating in Romania regarding the business outlook for 2016. In this edition we also provide comparative data with the similar surveys conducted at the beginning of 2014 and 2015. The results of this survey reflect the responses received to our questionnaire in the period between 26 January and 8 February 2016, from 421 top executives of major companies operating in Romania.
Business to more Business inlocuieste in 2016 seria de evenimente IMM ReSTART.
Pentru al 6-lea an consecutiv, seria de conferinte dedicate managementului si dezvoltarii companiilor, organizate in Bucuresti si alte 10 orase din tara isi continua succesul!
Acestă analiză are la bază răspunsurile primite de la antreprenorii și oamenii de afaceri care au participat la conferințele IMM ReStart organizate de doingbusiness.ro. La aceste conferințe au participat companii cu cifra de afaceri între 0,25 milioane euro și peste 500 milioane euro. Pe lângă top management, au fost în audență directori financiari, directori de achizitii, directori de vânzări, marketing, business development și HR.
La evenimentele doingbusiness.ro au participat in 2015 peste 1900 de oameni de afaceri din Romania, dintre care 70% directori generali, proprietari, asociati si executivi de top.
La doingbusiness.ro oferim solutii dedicate, personalizate, aplicabile imediat in dezvoltarea afacerii tale. Serviciile noastre vor aduce in firma ta un management performant, vanzari eficiente, Marketing, comunicare si PR de calitate, achizitii eficace, managementul riscului, dezvoltarea afacerii tale.
Kompass.com este cea mai precisa baza de date B2B, cuprinzand 5 milioane de companii internationale, 15 milioane de manageri din 68de tari, 5 ani de istoric financiar pentru toate companiile active din Romania.
Best practices for project execution and deliveryCLIVE MINCHIN
A select set of project management best practices to keep your project on-track, on-cost and aligned to scope. Many firms have don't have the necessary skills, diligence, methods and oversight of their projects; this leads to slippage, higher costs and longer timeframes. Often firms have a history of projects that simply failed to move the needle. These best practices will help your firm avoid these pitfalls but they require fortitude to apply.
Top mailing list providers in the USA.pptxJeremyPeirce1
Discover the top mailing list providers in the USA, offering targeted lists, segmentation, and analytics to optimize your marketing campaigns and drive engagement.
Building Your Employer Brand with Social MediaLuanWise
Presented at The Global HR Summit, 6th June 2024
In this keynote, Luan Wise will provide invaluable insights to elevate your employer brand on social media platforms including LinkedIn, Facebook, Instagram, X (formerly Twitter) and TikTok. You'll learn how compelling content can authentically showcase your company culture, values, and employee experiences to support your talent acquisition and retention objectives. Additionally, you'll understand the power of employee advocacy to amplify reach and engagement – helping to position your organization as an employer of choice in today's competitive talent landscape.
Easily Verify Compliance and Security with Binance KYCAny kyc Account
Use our simple KYC verification guide to make sure your Binance account is safe and compliant. Discover the fundamentals, appreciate the significance of KYC, and trade on one of the biggest cryptocurrency exchanges with confidence.
How to Implement a Real Estate CRM SoftwareSalesTown
To implement a CRM for real estate, set clear goals, choose a CRM with key real estate features, and customize it to your needs. Migrate your data, train your team, and use automation to save time. Monitor performance, ensure data security, and use the CRM to enhance marketing. Regularly check its effectiveness to improve your business.
Industrial Tech SW: Category Renewal and CreationChristian Dahlen
Every industrial revolution has created a new set of categories and a new set of players.
Multiple new technologies have emerged, but Samsara and C3.ai are only two companies which have gone public so far.
Manufacturing startups constitute the largest pipeline share of unicorns and IPO candidates in the SF Bay Area, and software startups dominate in Germany.
Navigating the world of forex trading can be challenging, especially for beginners. To help you make an informed decision, we have comprehensively compared the best forex brokers in India for 2024. This article, reviewed by Top Forex Brokers Review, will cover featured award winners, the best forex brokers, featured offers, the best copy trading platforms, the best forex brokers for beginners, the best MetaTrader brokers, and recently updated reviews. We will focus on FP Markets, Black Bull, EightCap, IC Markets, and Octa.
Taurus Zodiac Sign: Unveiling the Traits, Dates, and Horoscope Insights of th...my Pandit
Dive into the steadfast world of the Taurus Zodiac Sign. Discover the grounded, stable, and logical nature of Taurus individuals, and explore their key personality traits, important dates, and horoscope insights. Learn how the determination and patience of the Taurus sign make them the rock-steady achievers and anchors of the zodiac.
The Genesis of BriansClub.cm Famous Dark WEb PlatformSabaaSudozai
BriansClub.cm, a famous platform on the dark web, has become one of the most infamous carding marketplaces, specializing in the sale of stolen credit card data.
Event Report - SAP Sapphire 2024 Orlando - lots of innovation and old challengesHolger Mueller
Holger Mueller of Constellation Research shares his key takeaways from SAP's Sapphire confernece, held in Orlando, June 3rd till 5th 2024, in the Orange Convention Center.
[To download this presentation, visit:
https://www.oeconsulting.com.sg/training-presentations]
This presentation is a curated compilation of PowerPoint diagrams and templates designed to illustrate 20 different digital transformation frameworks and models. These frameworks are based on recent industry trends and best practices, ensuring that the content remains relevant and up-to-date.
Key highlights include Microsoft's Digital Transformation Framework, which focuses on driving innovation and efficiency, and McKinsey's Ten Guiding Principles, which provide strategic insights for successful digital transformation. Additionally, Forrester's framework emphasizes enhancing customer experiences and modernizing IT infrastructure, while IDC's MaturityScape helps assess and develop organizational digital maturity. MIT's framework explores cutting-edge strategies for achieving digital success.
These materials are perfect for enhancing your business or classroom presentations, offering visual aids to supplement your insights. Please note that while comprehensive, these slides are intended as supplementary resources and may not be complete for standalone instructional purposes.
Frameworks/Models included:
Microsoft’s Digital Transformation Framework
McKinsey’s Ten Guiding Principles of Digital Transformation
Forrester’s Digital Transformation Framework
IDC’s Digital Transformation MaturityScape
MIT’s Digital Transformation Framework
Gartner’s Digital Transformation Framework
Accenture’s Digital Strategy & Enterprise Frameworks
Deloitte’s Digital Industrial Transformation Framework
Capgemini’s Digital Transformation Framework
PwC’s Digital Transformation Framework
Cisco’s Digital Transformation Framework
Cognizant’s Digital Transformation Framework
DXC Technology’s Digital Transformation Framework
The BCG Strategy Palette
McKinsey’s Digital Transformation Framework
Digital Transformation Compass
Four Levels of Digital Maturity
Design Thinking Framework
Business Model Canvas
Customer Journey Map
Brian Fitzsimmons on the Business Strategy and Content Flywheel of Barstool S...Neil Horowitz
On episode 272 of the Digital and Social Media Sports Podcast, Neil chatted with Brian Fitzsimmons, Director of Licensing and Business Development for Barstool Sports.
What follows is a collection of snippets from the podcast. To hear the full interview and more, check out the podcast on all podcast platforms and at www.dsmsports.net
IMPACT Silver is a pure silver zinc producer with over $260 million in revenue since 2008 and a large 100% owned 210km Mexico land package - 2024 catalysts includes new 14% grade zinc Plomosas mine and 20,000m of fully funded exploration drilling.
Digital Marketing with a Focus on Sustainabilitysssourabhsharma
Digital Marketing best practices including influencer marketing, content creators, and omnichannel marketing for Sustainable Brands at the Sustainable Cosmetics Summit 2024 in New York
Authentically Social by Corey Perlman - EO Puerto Rico
Romanian Business Digest 2016
1. BUSINESS
Romanian
DIGEST
Romania: The Country
of Business Paradox
Disruption at Work:
Redefining Business Success
Mobility:
A Game Changer
THE NEW
BUSINESS
EQUATION
Sharp Insights
from Business
Leaders
2016
Edited by www.doingbusiness.ro
6. 4 Romanian Business Digest•2016
CONTENT
010 The Economist Intelligence Unit
Outlook for 2016-20
016 The Vienna Institute for International
Economic Studies (wiiw)
wiiw Forecast: Growth Stabilises in the EU
Member States of Central and Eastern Europe
and the Western Balkans
024 KPMG Romania
Minimum Wage Requirements in Europe
and How These Affect Posted Workers
028 UniCredit Bank
Companies Face Difficulties in Capitalizing
on Strong Internal Demand
034 Coface Romania
Romania – The Country of Business Paradox
INSIGHTS FROM
BUSINESS LEADERS
042 EY Romania
Interview with Bogdan Ion,
Country Managing Partner
046 European Bank for Reconstruction
and Development
Interview with Matteo Patrone, Director,
Regional Head, Romania & Bulgaria
By Radu Soviani, Economic Journalist
050 BCR Pensii
Interview with Melania Mirea,
Executive Director
054 EnergoBit
Interview with Carmen Neagu, CEO
058 Constanta Port Administration
Interview with Alexandru Craciun,
Commercial Director
062 Microsoft Romania
Interview with Violeta Luca,
Marketing & Operations Director
MACROECONOMIC
OUTLOOK
7. CONTENT
2016•Romanian Business Digest 5
068 PwC Romania
Redefining Business Success in a Changing World
072 Noerr
Romanian M&A Market. A Real Chance
for Booming
076 BearingPoint Romania
Working Today on the Trends of Tomorrow!
080 European Bank for Reconstruction
and Development
Know How to Support SMEs: EBRD Advice
for Small Businesses in Romania
By Radu Soviani, Economic Journalist
086 EY Romania
Disruption at Work or How Entrepreneurs
Are Driving Job Growth
092 RoCoach
‘High Performance Coaches Do Not Offer
Crutches to Olympic Runners!’
098 EY Romania
Do You Define Your CFO Role?
Or Does It Define You?
104 RetailZoom
Super Is the New Hyper
INSIGHTS FROM
BUSINESS LEADERS
110 SAS Romania
Interview with Daniel Pana, Country Manager
114 Metro Cash & Carry Ukraine
Interview with Adrian Ariciu,
Offer Management Director
118 HL Display
Interview with Alexandru Chiru, Country Manager
122 Nespresso
Interview with Sonia Nastase, Country Manager
126 Nestle Purina
Interview with Diana Bejan,
Country Business Manager
130 DENT ESTET
Interview with Dr. Oana Taban, CEO & Founder
132 The Association of the Turkish SMEs
in Romania
Interview with Nazmi Dogan, President
136 WETEX
Interview with HE Saeed Mohammed Al Tayer,
MD & CEO, DEWA, President and Founder
of WETEX
BUSINESS
TRENDS
8. 6 Romanian Business Digest•2016
EDITORIAL
By the Romanian Business Digest team
Understanding
the Equation
W
hile the Romanian businessmen
and entrepreneurs are trying to
figure out how to make the best
useoftheinternalingredientsandeconomic
tools for their businesses to grow – and this
iswhatRomanianBusinessDigestdefinesas
‘the equation’ – a new series of variables
comes from the international economic
scene. In short: the Brexit.
Do we understand why the majority of
British voters opted to leave the EU? The
best ‘YES’ was motivated by the former
CEO of PIMCO, Mohamed El-Erian
(PIMCO is one of the world’s largest bond
investors managing assets of USD 1.5
trillion). The economist, who coined the
term ‘new normal’ to describe the world
economy after the Great Recession, defines
it as the ‘improbable and unthinkable
turning into realities when Western
economies get stuck in a prolonged period
of low economic growth and worsening
inequality’. And the so defined ‘new normal’
is one of the reasons for the majority of
British voters opting to leave, even if the
process of UK leaving the EU was highly
improbableand,formostoftheeconomists,
unthinkable.
TheunthinkableLEAVEmakesitharderfor
any entrepreneur to define and understand
‘the equation’ because the new situation
acts,asEl-Erianstates,asthenewestleading
indicator for the world economy: while the
EU 27 wants an ‘ever closer Union’, the +1,
UK,istryingtopreservewhatitwaslooking
for, from the very first time, from the EU: a
super free trade arrangement. How the two
parts will negotiate the existence of the no
barrier in terms of trades for the brand new
out-of-EU United Kingdom, will show if
the world economy has the capacity to end
the ‘secular destruction’ we witnessed after
the Great Recession. If it succeeds, we will
witness a jump start of the world economy,
while the alternative means another crisis
favoured by policy mistakes and financial
and democratic accidents.
As a consequence, we now have more
questions than answers regarding this very
complex ‘equation’. So, in a fantastic effort
to define the variables that might impact
the growth of the Romanian economy in
2016 and beyond, the key persons and
CEOsinterviewedexclusivelyforRomanian
Business Digest manage to draft what we
are we going to see in the next period of
time. Some of the managers describe
Romaniaas‘thecountryofbusinessparadox,
where creative destruction is biased more
towards destruction’. You will also find that
the SME sector has not fully recovered after
thecrisisandthatfinancealonecannotmeet
the challenges facing the Romanian
companies. Some managers see that the
Romanian entrepreneurs are now more
mature and understand better what is
required not only to have a stable business,
but to grow it further and that is why, in
their view, Romania is better positioned
than ever in the eyes of the investors. We
have further to see if ‘the new pearl of the
region’ status is just wishful thinking or, in
the new normal, we have the ingredients to
make it real. How can companies navigate
in the new Brexit context in order to
maintain one of the fundamental principles
of the EU – the free movement of workers,
which helps companies move their workers
where their skills are needed? We shall see.
Therearealsosomeuncertaintiesregarding
therecentfiscalexpansionoftheRomanian
economic policy. Will it bring a pro-cyclical
boost of private consumption and wage
increases, while inhibiting the fixed
investments sector or will the economic
expansion, due to booming consumption,
be sustainable in the benefit of the
companies? You’ll find arguments for both
sides. You will also find an unbeatable
conclusion: the Internet of Things for
business is now turning into reality and it
proves to be the most viable solution to
drive innovation within companies.
Sooner or later, the Brexit crisis will be over
(rather later), but the ingredients that lead
to the crisis, subsumed under what we call
‘inequality’, might persist in terms of
income, wealth and opportunity. It is time
for the business elite to turbo charge their
productive views by using technical
innovations, in order to avoid some of the
vulnerabilities in the Romanian economy.
You shall find amongst the pages of
Romanian Business Digest the full answer
for how the Romanian economy can be
more coherent, more confident, and more
inclusive in 2016 and how it can avoid the
mix of mistakes in economic policies and
financial accidents. And that is probably
part of the most complex equation of the
century that we have to solve and
understand.
11. May-June 2014 Romanian Business Digest 11
MACROECONOMIC
OUTLOOK
Patterns and evolution
of the Romanian
economy in the context
of CEE influences and
domestic developments
0 1 0
The Economist Intelligence Unit
Outlook for 2016-20
0 1 6
The Vienna Institute for International
Economic Studies (wiiw)
wiiw Forecast: Growth Stabilises in the EU
Member States of Central and Eastern
Europe and the Western Balkans
0 2 4
KPMG Romania
Minimum Wage Requirements in Europe
and How These Affect Posted Workers
0 2 8
UniCredit Bank
Companies Face Difficulties in Capitalizing
on Strong Internal Demand
0 3 4
Coface Romania
Romania – The Country of Business Paradox
12. 10 Romanian Business Digest•2016
MACROECONOMIC OUTLOOK
SAS® VISUAL ANALYTICS
Picture hidden trends coming into plain sight.
Macroeconomic policy since the 2008-09 global economic crisis has
largely corrected internal and external imbalances, but spending
pressures are building again, as fiscal policy has been relaxed and
structural reforms have been delayed.
Outlook for 2016-20
POLITICAL OUTLOOK
Political stability
Following mass protests and the
resignation in November 2015 of the
government led by Victor Ponta’s Social
Democratic Party (SDP), a technocratic
government led by Dacian Ciolos is in
charge until the parliamentary election in
November 2016. The president, Klaus
Iohannis, elected in November 2014,
effectively imposed a presidential system
of government after the public lost
confidence in the ruling parties. Mr
Ciolos’s inexperienced government,
dependent on the support of SDP
deputies, can do little other than
implement policies agreed by the previous
government. It is essentially a holding
operation until the election.
After 26 years of post-communist
democratic transition, popular
dissatisfaction with the political class runs
deep. The fire on October 30th 2015 at the
Colectiv nightclub in the capital,
Bucharest, which resulted in 64 deaths,
appears to have been a turning-point in
Romania’s post-1989 history. The tragedy
ignited public anger about pervasive
corruption and unaccountable politicians,
and led to large demonstrations in
Bucharest and other towns and cities. The
appointmentofatechnocraticgovernment
was an acknowledgement of the extent of
popular distrust of the political system.
A poll conducted in early 2016 by the
Romanian Institute for Evaluation and
Strategy (IRES) found that 90% of
Romanians have little or no confidence in
political parties. Tainted by corruption and
led by discredited politicians, the main
political parties have little appeal for the
electorate. This was confirmed by the low
turnout of just above 50% in the mayoral,
country and local elections held on June
5th (turnout in Bucharest was only 33%,
and just 24% of the electorate voted for
either of the two major parties), well down
on the 64% recorded in the second round
of the presidential election in 2014.
Traditionally, the countrywide local
election results have been a good guide to
theprobableoutcomeoftheparliamentary
election that is held later in the same year.
TheresultsoftheJune2016localelections
point to the return in November 2016 of a
government headed by the SDP in alliance
with its allies in the National Union for
the Progress of Romania (UNPR) and the
Association of Liberals and Democrats
(ALDE). In the November election
Romania will revert to the parliamentary
electoral system that was in place before
2008, which is effectively proportional
representation at the county level.
Election watch
The parliamentary election in November
2016 will have new rules, following
changes to electoral law in 2015.
The election will be organised as a list-
based system, last utilised in 2004.
The amended electoral law stipulates a
representation norm of 73,000 citizens
per deputy (elected to the Chamber of
Deputies – the lower house of parliament)
and of 168,000 citizens per senator
(elected to the Senate – the upper house).
This will decrease the number of
members of parliament from the 588
elected in 2012 to 466 in 2016. There will
be 308 deputies, plus 18 deputies
representing minorities, and 134 senators.
An additional four deputies and two
senators will be elected by the diaspora.
These two senators will be elected by
postal vote.
The SDP and its allies won an emphatic
victory in the mayoral elections, beating
the centre-right National Liberal Party
(NLP) by 17 percentage points (51% to
34%). The margin was closer in terms of
the popular vote, with the SDP and its
By The Economist Intelligence Unit
13. 2016•Romanian Business Digest 11
SAS® VISUAL ANALYTICS
Picture hidden trends coming into plain sight.
The European Commission monitors Romania’s
progress under the co-operation and
verification mechanism, with a focus on
reforming the judiciary and tackling
corruption.
allies leading the NLP by about 6
percentage points, at 39% to 33%. The
share of the vote for the SDP was in line
with opinion polls conducted in May, but
that for the NLP was down by 5-6
percentage points. The poor performance
of the NLP, which was supported by
roughly 16% of the electorate, indicates
either weariness with the anti-corruption
campaign waged by Mr Iohannis or simply
popular distrust of NLP politicians.
Relations between the president and the
NLP have cooled noticeably since the
elections. With only 4% of the Bucharest
electorate voting for the NLP candidate,
Catalin Predoiu, who was widely expected
to be Mr Iohannis’s nominee for an NLP
premiership, the president may be
tempted to establish a new party and try
to mobilise behind it the support of the
6.2m voters who supported him in the
2014 presidential election.
At 20% of the electorate, support for the
SDP and the UNPR in the local polls was
not particularly strong. However, the SDP
may have benefited politically from the
strong growth of household disposable
incomes, stimulated by tax cuts and wage
increases that the outgoing government
(which was SDP-led) announced in 2015
and which the technocratic government
subsequently implemented. The
disaffected public mood and the lack of
party loyalties among the electorate
(outside of the patronage-dispensing local
party machines that dominated the
mayoral contests) make it very difficult to
predict election outcomes with any degree
of confidence.
International relations
The European Commission monitors
Romania’s progress under the
co-operation and verification mechanism,
with a focus on reforming the judiciary
and tackling corruption. In 2015
corruption became a politically charged
affair, when the then prime minister, Mr
Ponta, was indicted on corruption
charges. In its January 2016 report, the
14. 12 Romanian Business Digest•2016
MACROECONOMIC OUTLOOK
SAS® VISUAL ANALYTICS
Picture hidden trends coming into plain sight.
Commission praised the headway made
by the National Anti-Corruption
Directorate (DNA) in securing the
convictions of prominent politicians and
other public figures charged with
corruption. The DNA indicted 1,250
defendants. However, the Commission
criticised parliament for its lack of respect
for the judiciary and judicial decisions,
and for voting to maintain parliamentary
immunity from prosecution in cases of
alleged corruption. At a meeting in March
2016 EU foreign and European affairs
ministersdecidedtokeeptheco-operation
and verification mechanism in place for
both Romania and Bulgaria.
On May 12th the US officially activated a
land-basedmissileshieldsystemataformer
air base at Deveselu in southern Romania,
prompting sharp recriminations from
Russia, which has said that the system is a
direct threat to it. Now that the system has
become operational, tensions between
Russia and Romania are likely to increase.
In a referendum on June 23rd the UK
voted to leave the EU. This will not have
any immediate negative impact on
Romania. The UK is not a major trading
partner and trading relations will not be
adversely affected in the short term.
However, since the opening of the UK
labour market to Romanians in January
2014, increasing numbers have gone to
work in the UK. Tougher immigration
rules may cap these numbers in future, but
nothing is likely to change in the short
term while the UK negotiates the terms of
its departure. The political repercussions
of Brexit could be more far-reaching,
however, especially if it results in the
evolution of a two-tier EU, with Romania
being consigned to the second tier.
ECONOMIC POLICY
OUTLOOK
Policy trends
Macroeconomic policy since the 2008-09
global economic crisis has largely
corrected internal and external
imbalances, but spending pressures are
building again, as fiscal policy has been
relaxed and structural reforms have been
delayed. Romania’s stand-by arrangement
with the IMF, which had been stalled for
one year after disagreements about the
SDP-led government’s fiscal policies,
expired in September 2015. An IMF
mission visiting Romania in March 2016
for Article IV consultations issued a strong
warning that tax cuts and wage increases
threaten financial stability after 2016.
The government cut the rate of value-
added tax (VAT) on foodstuffs (excluding
alcoholic beverages and tobacco) from
24% to 9% in June 2015. On January 1st
2016 the standard VAT rate fell from 24%
to 20% (it will be reduced to 19% in
January 2017 under the present fiscal
code). On October 27th 2015 the
government adopted an emergency
decree amending the fiscal code, bringing
forward to 2016 several tax cuts planned
for 2017. Among other measures, the tax
on dividends was cut from 16% to 5%, and
VAT on drinkable water was reduced from
20% to 9% from January 2016. From May
1st 2016 the technocratic government
implemented a 19% increase in the
minimum wage. Structural reforms to
improve corporate governance and
efficiency in public enterprises are
unlikely to make much headway until a
new government is formed. The
Economist Intelligence Unit expects some
fiscal moderation later in 2017, but this
will come too late to prevent the fiscal
deficit exceeding EU rules that year (on
the ESA 2010 measure).
Fiscal policy
The consolidated budget recorded a deficit
of 1.5% of GDP in 2015, but this 12 month
total included a deficit of 2.4% of GDP in
the last seven months of the year. The
growth of VAT receipts slowed from an
impressive 17.5% year on year (largely as a
result of a crackdown on VAT evasion) in
the first five months of 2015 to 8.8% in the
last seven months. In 2016 the government
targets a consolidated budget deficit
equivalent to 2.8% of GDP on a cash basis
(equivalent to 2.95% of GDP using the EU’s
ESA 2010 methodology). Budget revenue is
officially projected at Lei231.1bn
(US$55.4bn) in 2016, equivalent to 31.1%
of GDP; expenditure is set at Lei252bn,
equivalent to 33.8% of GDP.
Tax cuts will have a negative effect on
revenue generation, but improvements in
tax collection and absorption of EU
funding in 2015, indicating a better-
functioning central administration,
suggest that there is a chance of meeting
the target. (A recent study by an
accountancy firm, PwC, estimates that
Romania loses about €8.3bn – US$9.2bn –
annually as a result of VAT tax evasion.)
The consolidated government budget
recorded a cumulative five-month deficit
of almost €173m (US$192m; 0.1% of
GDP) in January-May, compared with a
surplus of €1.4bn (0.9% of GDP) in the
year-earlier period. However, the
cumulative deficit is smaller than had
been expected. We forecast a deficit
equivalent to 2.9% on the national
measure (3% on the ESA 2010 measure) in
2016 and 3% of GDP in 2017 (3.2%, ESA
2010), putting Romania in breach of EU
fiscal rules. We expect the next
government to abandon or reverse some
of the planned new tax cuts in 2017 and
to oversee a modest fiscal tightening in
2018toavoidaconsumption-ledexcessive
widening of the external deficit. Over the
medium term we expect fiscal
consolidation to be broadly maintained.
Monetary policy
The National Bank of Romania (NBR, the
central bank) operates an inflation-
targeting regime with a multi-year target
of 2.5% (±1 percentage point). The NBR
began a policy of monetary easing in July
2013, cutting its monetary policy rate by a
cumulative 325 basis points between July
15. 2016•Romanian Business Digest 13
SAS® VISUAL ANALYTICS
Picture hidden trends coming into plain sight.
The appointment of a technocratic government
was an acknowledgement of the extent of
popular distrust of the political system.
2013 and May 2015 in response to a
progressive reduction in inflation, weak
domestic demand, negative credit growth
and a persistent negative output gap. The
central bank has kept the rate at 1.75%
since May 2015. We expect the NBR to
hold the monetary policy rate at 1.75% in
2016, amid general uncertainty about the
fallout from the UK’s decision to leave the
EU, the slow-down in Chinese and
emerging-market growth, and the
relaxation of domestic fiscal policy.
Romania’s monetary policy rate remains
one of the highest in the EU, and compares
with a rate of 0% in the euro zone and 1.5%
in Poland.
The governor of the NBR, Mugur Isarescu,
has said that Romania’s target date of
2019 for joining the euro zone is no longer
feasible, as the country would not be
technically prepared to join the European
exchange-rate mechanism (ERM II) by
June 2016. The government has now
abandoned the 2019 target date for euro
entry and has said that a detailed plan to
join the euro zone will be presented in
2017. We expect euro adoption to be
postponed into the mid-2020s, and
perhaps indefinitely.
ECONOMIC FORECAST
Economic growth
Romania’s real GDP grew by 3.8% in 2015.
The increase in consumer purchasing
power following the cut in VAT on
foodstuffs in June 2015, from 24% to 9%,
was the main stimulus to growth in the
second half of 2015. Consumer demand
was boosted by rising real household
disposable income, owing to increases in
wages, pensions and remittances from
abroad, and rapid growth of new
consumer loans. Final consumption
expenditure by households rose by 5.9%
and contributed 5.6 percentage points to
growth. The other growth stimulus came
from gross fixed investment, which grew
by 7.7% year on year and contributed 1.8
percentage points to growth.
Growth of 4.3% (4.2% seasonally adjusted)
in the first quarter of 2016 was driven by
the rapid growth of retail turnover of 19%
year on year (16.9% seasonally and
working-day adjusted) following the cut
in standard VAT from 24% to 20% on
January 1st. In January-April retail sales
grew by 17.7% year on year (adjusted) and
19.1% unadjusted. Increases in public-
sector wages contributed to an increase in
gross nominal wages of 12.1% year on
year in January-April and an even stronger
rise in real terms given deflation.
Seasonally adjusted industrial output
growth was modest over the first four
months, at 0.7% (driven by 2.5% growth in
manufacturing), and consumer demand is
being partly met by increasing imports.
Tax cuts and wage growth will bolster
household consumption growth in 2016
and 2017, when we forecast real GDP
growth of 4.5% and 3.4% respectively.
Strong domestic demand growth will
compensate for the euro zone growth
slowdown that we forecast in 2017.
Sustaining growth of this magnitude over
the medium term will depend on the
economy’s capacity to respond to the
demand stimulus, which in turn depends
on more rapid progress in implementing
structural reforms. Signs of capacity
constraints in some sectors of industry,
for example in the automotive sector,
suggest the need for deeper structural
reforms to boost labour productivity, and
for increased expenditure on education
and infrastructure rather than on
consumption. The economy is facing
severe labour shortages in some sectors,
notably automotives, with an estimated
2.4m Romanians working abroad. This is
likely to be a disincentive to foreign
investment in the medium and long term.
We forecast average real GDP growth of
3.4% per year in 2018-20.
Better absorption of funding from the EU
would contribute to investment in
infrastructure, boosting export potential
over the long term. Romania has obtained
International assumptions
2015 2016 2017 2018 2019 2020
ECONOMIC GROWTH (%)
US GDP 2.4 1.8 2.2 2.3 1.0 2.1
Euro area GDP 1.6 1.6 1.3 1.5 1.3 1.4
EU28 GDP 1.9 1.7 1.0 1.4 1.3 1.6
World GDP 2.4 2.2 2.4 2.6 2.1 2.5
World trade 2.7 2.9 3.6 3.7 2.8 3.3
INFLATION INDICATORS (% unless otherwise indicated)
US CPI 0.1 1.3 2.2 2.3 1.3 1.7
Euro area CPI 0.0 0.1 1.2 1.5 1.5 1.6
EU28 CPI 0.0 0.2 1.0 1.3 1.4 1.5
Manufactures (measured in US$) -4.6 -1.7 2.6 3.4 4.5 4.3
Oil (Brent; US$/b) 52.4 40.3 52.5 65.0 62.4 61.4
Non-oil commodities
(measured in US$)
-17.3 -5.2 5.7 4.7 -2.9 -1.0
FINANCIAL VARIABLES
US$ 3-month commercial
paper rate (av; %)
0.2 0.5 0.6 1.4 1.5 1.0
€ 3-month rate 0.0 -0.1 -0.1 -0.1 -0.1 0.3
US$:€ (av) 1.11 1.08 1.07 1.12 1.13 1.15
Lei:US$ (av) 4.01 4.15 4.20 4.04 3.97 3.93
Lei:€ (av) 4.44 4.49 4.50 4.50 4.50 4.50
16. 14 Romanian Business Digest•2016
MACROECONOMIC OUTLOOK
a potential €22bn in structural funds from
the EU budget for 2014-20, and is also to
receive €17.5bn in funds for agriculture
during this period, under the common
agricultural policy. However, Romania’s
absorption of EU structural funding is
poor, despite some improvement;
administrative deficiencies and the need
for the government to co-finance projects
will limit prospects for a significant
increase in the absorption rate.
Inflation
A series of tax cuts in 2015-16 has driven
negative annual inflation over the past 12
months. Consumer prices edged up by
0.3% month on month in May, but the
annual inflation rate, as measured by the
consumer price index (CPI), dropped to
-3.5%, from -3.3% in April. Buoyant
consumer demand will drive up inflation
in the second half of 2016, when the
impact of the June 2015 VAT cut is
removed from the CPI. We expect average
deflation of 0.9% and year-end inflation of
1.7% in 2016. In 2017 we expect average
inflation of 3.2% and year-end inflation of
2.8% as the impact of the VAT cuts is
removed from the CPI. We forecast annual
average inflation of 2.4% in 2018-20.
Exchange rates
The leu depreciated in nominal terms by
16.4% on average against the dollar in 2015.
It remained stable against the euro, at
Lei4.4:€1, which represents a depreciation
inrealtermsof0.6%.Theleudepreciatedin
real effective terms by 4% against a trade-
weighted basket of currencies in 2015. We
forecast a milder weakening against the
dollar in 2016, continued relative stability
against the euro and a modest real effective
depreciation against a trade-weighted
currency basket. We expect the leu to
appreciate modestly in real terms over most
of the forecast period, in line with
productivity differentials, as the economic
recovery continues.
External sector
In 2015 the current-account deficit
expanded to US$2bn, equivalent to 1.1%
of GDP, from US$951m in 2014. In
January-April 2016 the current-account
deficit was €1.84bn, compared with a
surplus of €282m in the year-earlier
period. The deterioration in the current-
account balance resulted from a widening
of the primary income deficit from €780m
to €2.5bn and an expansion of the
merchandise trade deficit from €1.8bn to
€2.5bn. As domestic demand fuels import
growth, we forecast a widening of the
deficit to 2.6% of GDP in 2016 and to an
annual average of 3.3% of GDP in 2017-20.
JOAN HOEY
Regional Editor, Europe
The Economist Intelligence Unit, London
joanhoey@eiu.com
Phone: +44 020 7576 8323
AUTHORS
The Economist Intelligence Unit
26 Red Lion Square, London WCIR 4HQ, United Kingdom,
Phone: +44 020 7576 8181, Fax: +44 020 7576 8476,
E-mail: emea@eiu.com; www.eiu.com
Forecast summary (% unless otherwise indicated)
2015a
2016b
2017b
2018b
2019b
2020
Real GDP growth 3.8 4.5 3.4 3.2 3.5 3.5
Industrial production growth 2.8 4.5 4.0 3.7 3.6 3.6
Gross agricultural production growth -4.8 2.0 2.0 4.0 4.0 4.0
Unemployment rate (end-period) 6.8 6.7 6.4 6.2 6.1 5.8
Consumer price inflation (av; national
measure)
-0.6 -0.9 3.2 2.7 2.3 2.2
Consumer price inflation (end-period;
national measure)
-0.9 1.7 2.8 2.2 2.2 2.2
Consumer price inflation (av; EU
harmonised measure)
-0.4 -0.9 3.2 2.7 2.3 2.2
Commercial bank lending rate (av) 6.8 6.0 5.0 4.8 4.9 5.0
Consolidated budget balance
(% of GDP)
-1.5 -2.9 -3.0 -2.4 -1.9 -1.6
Exports of goods fob (US$ bn) 54.5 56.0 61.3 70.7 79.2 88.6
Imports of goods fob (US$ bn) 63.1 66.0 73.4 84.3 94.0 105.1
Current-account balance (US$ bn) -2.0 -4.8 -5.5 -6.6 -7.9 -9.2
Current-account balance (% of GDP) -1.1 -2.6 -2.8 -3.1 -3.4 -3.8
External debt (end-period; US$ bn) 102.6 c 101.3 100.2 103.7 104.1 106.1
Exchange rate Lei:US$ (av) 4.01 4.15 4.20 4.04 3.97 3.93
Exchange rate Lei:US$ (end-period) 4.15 4.17 3.93 4.07 3.68 3.91
Exchange rate Lei:€ (av) 4.44 4.49 4.50 4.50 4.50 4.50
Exchange rate Lei:€ (end-period) 4.52 4.40 4.29 4.58 4.18 4.54
a Actual. b Economist Intelligence Unit forecasts. c Economist Intelligence Unit estimates
17. We help clients to look into the future,
predicting trends up to 30 years ahead
and to inform their biggest investment
decisions.
Prepare for opportunity
www.eiu.com london@eiu.com
18. MACROECONOMIC OUTLOOK
SAS® VISUAL ANALYTICS
Picture hidden trends coming into plain sight.
Fiscal space has widened in several countries, thus granting governments
more room in which to implement and support investments.
wiiw Forecast:
Growth stabilises in the
EU Member States of Central
and Eastern Europe and
the Western Balkans
Peaks and Troughs in 2015
with lasting impacts
The prospects of growth in the euro area
have improved albeit at a slower pace than
previously hoped for. It is based on a mix
of private and public consumption, as well
as investment expansion, supported by a
further easing of the European Central
Bank’s monetary policy and fiscal
relaxation. As a result, demand for
products from new member states
increased and exports expanded. The
recent collapse of all major commodity
prices reflects a lack of demand and an
oversupply in the respective markets with
major impact on both exporters and
importers. Net importers of oil and gas
have lower energy bills, while net-
exporters suffer serious losses of revenues.
The EU Member States in Central and
Eastern Europe (EU-CEE) group registered
its highest rate of economic growth in
2015 since the outbreak of the financial
crisis. In 2016-2017 the group will
By The Vienna Institute for International Economic Studies
Forecast, %
2015 2016 2017 2018
EU-CEE
BG 3.0 2.9 3.0 3.1
HR 1.5 2.0 2.2 2.3
CZ 4.3 2.4 2.6 2.6
EE 1.2 2.0 2.3 2.4
HU 2.9 2.0 2.5 2.9
LV 2.7 2.5 3.0 3.3
LT 1.6 2.8 3.1 3.4
PL 3.6 3.3 3.3 3.4
RO 3.7 4.0 3.2 3.5
SK 3.6 3.0 3.2 3.3
SI 2.9 2.0 2.3 2.8
Western Balkans
AL 2.6 2.9 3.3 3.3
BA 2.3 2.9 2.9 3.0
XK 3.7 3.3 4.2 4.0
MK 3.5 3.4 3.1 3.1
ME 3.4 3.1 2.8 3.5
RS 0.7 1.9 2.3 2.5
Turkey TR 3.3 4.1 3.7 3.5
CIS-3
BY -3.9 -2.0 0.5 1.4
KZ 1.2 0.4 2.0 3.0
RU -3.7 -0.8 0.8 1.8
Ukraine UA -10.5 0.5 1.9 2.4
Table 1: Greens and reds: real GDP growth forecast
Colour scale reflects variation from the minimum (red) to the maximum (green) values.
Source: wiiw Annual Database incorporating national and Eurostat statistics; wiiw forecast.
19. SAS® VISUAL ANALYTICS
Picture hidden trends coming into plain sight.
experience some modest growth
deceleration on account of the recent
consumption boom coming to an end and
a temporary decline in EU transfers (Table
1). Growth will be most robust in Romania
and Poland, given the solid household
consumption in both countries; growth
will also recover in the Baltic States that
have since digested the Russian shock, yet
most other countries will experience some
slowdown on account of the lower volume
of EU transfers. As for 2018, the EU-CEE
countries will pick up some speed thanks
to the inflow of new investments and EU
transfers.
A medium-term investment revival is expected in
most of the CESEE countries in both the public
and private sectors.
Countries in the Western Balkans WB) also
picked up speed in 2015 and will thus
maintain positive growth rates in 2016 and
beyond.Theywillgrowatanaveragerateof
3%, except for Serbia where growth will be
depressed on account of stabilisation.
However unimpressive it may be compared
to their need for catching-up, the average
growth rate in the WB countries (excl.
Serbia) will not lag behind that in the
EU-CEE countries. Turkey will continue
down its modest growth path. It will
maintain its fragile stability, despite
relatively high inflation and a high current
account deficit, while facing increasing
challenges emerging, for instance, from the
war in Syria, the refugee crisis and the loss
of export and tourism revenue owing to the
Russian trade sanctions.
In the CIS, Russia and Belarus will face yet
another year of recession in 2016. Russia
will continue to suffer from low oil prices,
high inflation, currency depreciation,
sanctions and fiscal austerity. As usual,
structural change and institutional
reforms will be slow and half-hearted,
incapable of offsetting the losses. Ukraine’s
economic growth, after the dramatic fall
over the past years, will stabilise as the
20. MACROECONOMIC OUTLOOK
SAS® VISUAL ANALYTICS
Picture hidden trends coming into plain sight.
country will by and large have completed
the adjustment process that was triggered
by the country decoupling from Russia
and the occupied territories. The Russian
annexation of the Crimea and the conflict
in East-Ukraine look set to last. Export
markets lost will not be regained even in
the medium term, nor will the volume of
exports to the EU increase.
The divergence of economic performance
between the EU-CEE and the Western
Balkans plus Turkey on the one hand and
Belarus, Kazakhstan and Russia (CIS-3)
and Ukraine on the other hand will
continue in 2016 and beyond. The
difference between the two large country
groups, however, will not take on more
pronounced dimensions.
Household consumption the
major growth driver, but
investments also revive
The leading role attributed to household
demand is driving economic growth in the
EU-CEE and WB countries in 2016 and
beyond (Figure 1). Deflationary expectations
have not come to the fore; consumers took
advantage of lower prices rather than
postponing consumption in anticipation
of even lower prices. With commodity
prices levelling out, inflation will return to
modestlypositiverates.Populationdecline
and ageing is a widespread problem that
may curtail economic growth. Employers
started to offer higher wages to overcome
labour shortage. Unemployment is on the
decline but still stubbornly high in regions
with competitiveness problems especially
in the WB.
As fiscal consolidation and more rapid
economicgrowthhavebeenachieved,fiscal
space has widened in several countries,
thus granting governments more room in
which to implement and support
investments. Even highly indebted
countriesmanagedtoadoptalessrestrictive
fiscal stance. The CIS-3 and Ukraine are
outliers in this respect as well; they have
started cutting back on expenditures so as
to reduce their fiscal deficits.
In the years to come, exports may well
expand with external demand recovering,
but imports may grow even more rapidly
as consumption and investment expand in
the EU-CEE and WB economies. Thus net
exports will not be a strong driver of
economic growth. Meanwhile, foreign
investors’ income may rise again.
Remittances to the Western Balkan
countries and labour income from abroad
in the EU-CEE countries are increasingly
important sources of current account
revenues. The present relatively low
current account deficits may increase in
the future without major problems in
being financed.
Gross fixed capital formation was the most
significant engine of growth in Albania and
the Czech Republic. In 2015 it contributed
positively to growth also in most other
countries, even if only marginally in
Hungary. Its contribution was negative in
Estonia and Slovenia, which had already
invested a significant portion of their EU
transfers earlier, as well as in Turkey where
increasing economic and political
uncertainties discouraged private investors.
Bulgaria, Croatia and Hungary are expected
to implement more investments in 2017-
2018 than before, still they will remain in
the group of slow-growth countries. In
countries such as Poland, Slovakia and
Romania, which have already attained and
will maintain a GDP growth rate of 3% or
more over the forecast period, the
contributionofgrossfixedcapitalformation
will be stronger, about 0.8-1 pp.
A medium-term investment revival is
expected in most of the CESEE countries
in both the public and private sectors. FDI
has already shown some signs of emerging
from stagnation as shown by the rising
numberofgreen-fieldprojects.Conditions
for sustained private investment growth
have started to improve owing to: (i) falling
input prices in the manufacturing sector
that allow for higher profits; (ii) declining
private sector debt; (iii) shrinking non-
performing loans; (iv) conversion of
foreign currency loans; and (v) increasing
availability of new credits on better terms.
However, a return to the lax banking
practices of the pre-crisis era is unlikely.
Fiscal space for growth
stimulation exists in at least
half of the countries
Fiscal policy is a tool for stimulating
growth and structural change that
governments often leave untapped. In
countries that have adopted the euro or
Figure 1: GDP growth, 2015-2018 and contribution of individual demand
components in percentage points
-4
-2
0
2
4
6
8
BG CZ EE HR HU LT LV PL RO SI SK
Household final consumption Government final consumption
Gross fixed capital formation Change in inventories
Net exports GDP total
Source: wiiw Annual Database incorporating national and Eurostat statistics; wiiw forecast.
21. SAS® VISUAL ANALYTICS
Picture hidden trends coming into plain sight.
pursue a fixed exchange rate regime, fiscal
policyistheonlytooltheycanuse,whereas
other countries may also resort to the use
of monetary policy. In terms of scope,
fiscal policy is often not a matter of choice.
Its use is restricted in countries with high
debts and onerous debt-service burdens or
simply by virtue of EU regulations. In fact,
even countries with high government debt
can shape the structure of their budgets in
order to attain their economic or social
goals instead of being guided by inertia
and vested interests.
In the wake of fiscal consolidation over the
past few years and thanks to faster
economic growth, countries with high
debt and high fiscal deficits have
diminished in number. Assuming we
regard as meaningful the EU limits on
debt(60%ofGDP)andgeneralgovernment
deficits (3% of GDP), Croatia, Serbia,
Albania and Montenegro, the four
countries in the upper left quarter of
Figure 2, faced excessive debt and deficit
levels in 2015. Slovenia, Hungary and
Ukraine, the three countries in the upper
right segment of Figure 2, reported high
debts, but moderate fiscal deficits. The
remaining countries in the lower right
segmentaresafeaslongasGDPisontherise.
Countries with low government debt and
lowdeficitsenjoysomefiscalmanoeuvring
space, but only Romania makes increasing
use thereof. In 2015 Romania still had a
primary surplus, but as of 2016 its course
is set on fiscal expansion, the fiscal
outcome being a general government
deficit of close to 3% of GDP. The deficit in
Bulgaria, Poland and Slovakia came close
to the 3% limit in 2015, half of which was
primary deficit supporting domestic
demand. The Baltic States continue to
produce primary surpluses in periods of
low overall fiscal deficits not warranted by
their debt levels. The Czech Republic
might well have some fiscal manoeuvring
space as well that it could use to good
effect by boosting economic growth via
public spending.
Apart from Romania, Hungary and Poland
are also among those countries whose
governments are actively introducing
novel features in their fiscal systems. In
2016 Hungary will lessen the fiscal burden
on banks, introduce measures to support
private investment via low interest loans
and increase housing grants. Poland’s new
government is about to follow the earlier
example of Hungary by levying extra taxes
on financial institutions and supermarket
chains. Generous social programmes
could be financed by drawing on profits
accruing to the national bank in 2016, an
additional fiscal gap of about 1% of GDP
may open up the following year.
PublicinvestmentintheEU-CEEdepends,
to a considerable extent, on EU transfers,
thus it will go into decline in 2016. General
government gross fixed capital formation
exceeded 5% of GDP in those years when
capital transfers peaked. In Estonia and
Latvia they peaked in 2012, while in the
Czech Republic, Romania and Slovakia
they peaked in 2015. It transpired that the
peak for Romania was lower than in other
countries as the government was unable
to disburse about 20% of the eligible funds
under the 2007-2013 financial framework,
especially those devoted to government-
financed infrastructure projects. High-
disbursement years are usually followed by
a low-transfer year 2016. The exceptions
are Estonia, which is already disbursing
2014-2020 funds, and Croatia, which
joined the EU at a later juncture and has
just started receiving transfers from the
EU budget.
More inflow of EU funds
than of FDI
In 2014-2015 net FDI amounted to only
1.5- 2% of GDP in Poland and Romania
and close to zero in Hungary and Slovakia.
At the same time, the inflow of EU funds
through the capital account amounted to
about 2% of GDP in the Czech Republic,
Poland and Romania, to 3% in Bulgaria
and 4% in Hungary.
The inflow of foreign direct investment
fluctuates greatly from one year to the
next. The number of countries reporting
increases and decreases in 2015 was
almost equal compared to the previous
In Romania, GDP growth will subside
in 2017 after the pro-cyclical boost fazes out.
Figure 2: Fiscal stance of the CESEE countries, 2015
AL
BA
BG
BYCZ
EE
HR
HU
KZ
LT
LV
ME
MK
PL
RO
RS
RU
SI
SK
TR
UA
XK
0
10
20
30
40
50
60
70
80
90
100
-8.0 -6.0 -4.0 -2.0 0.0 2.0
Generalgovernmentgrossdebt,
in%ofGDP
General governmentbalancein%ofGDP
Note: Axes denote the limits included in the EU Excessive Deficit Procedure: for debt 60% of GDP, for deficits 3% of GDP.
Source: wiiw Annual Database incorporating national and Eurostat statistics.
22. MACROECONOMIC OUTLOOK
SAS® VISUAL ANALYTICS
Picture hidden trends coming into plain sight.
year. The typical order of magnitude for
FDI inflows in the EU-CEE countries is
10% of gross fixed capital formation, less
than half of the volume recorded prior to
the financial crisis. Inflows recovered
recently from very low levels in Lithuania
and Slovakia, while Romania reported a
notable increase in 2015. Some WB
countries report much higher inflows per
GFCF than the EU-CEE, the most notable
being Montenegro (86%) and Albania
(31%), but both Kosovo and Bosnia and
Herzegovina are also on the high side.
Those poor countries have a relatively low
level of domestic savings, thus imported
capital takes on greater importance than in
the more affluent countries. Russian FDI
dried up due to recession, the Western
embargoandthedevaluationoftheRouble.
After years of stagnation, the CESEE
countries witnessed an increase in the
number of greenfield FDI projects publicly
announced in 2015: a clear indicator of
investor confidence in a host country. Five
of the EU-CEE destinations and Turkey
hosted more new investment projects
than before, while Poland registered the
same number as in 2014. Russia still boasts
a relatively high and increasing number of
investment projects, especially in the
manufacturing sector. Trade embargo has
stimulated local production while some
long-term investors also stayed. China
ranks second among the investors in new
FDI projects in Russia just behind
Germany. Ukraine has registered only a
few projects of very low value, thus
implying that most of the reported FDI
inflows must have been related either to
take-overs or financial flows that did not
really add to gross fixed capital formation.
A major change compared with the
previous year was the drop in retail
investments: something that was most
probablyduetotheslumpinconsumption.
Owing to the sluggish investment activity
across Europe as a whole, FDI in the
EU-CEE is not expected to become a major
engine of growth in the way it used to be
before the financial crisis. Foreign
companies are still rather reluctant to
invest, although the host countries’
attractiveness persists. Even if the amount
of FDI inflows is not expected to boom,
modest increases in the course of the
overall European recovery are very likely to
occur. Saturation has set in as most
markets have been captured by foreign
banks or retailers. Only Croatia, Romania
and Slovenia have relatively low stocks of
FDI,whichmayyieldfurtheropportunities.
Given that foreign ownership is dominant
in most segments of the EU-CEE
economies, any new FDI will depend
mainly on growth in demand across
Europe. Relocation of capacities will
continue, even if no direct link can be
discerned between the opening of a new
plant in an EU-CEE country and the
closure of capacities in an ‘old’ Member
State (viz. the recent example of the Jaguar
plant in Slovakia). Inflows of new FDI into
shared service and consumer service
centres will continue in those CESEE
countries that offer competitive wages for
high-skill labour (Bulgaria, Romania).
Potentially Ukraine is the most promising
location in the region, given its size and
low wage-levels, provided it manages to
stabilise and improve the legal and other
business conditions.
Summary
In 2016, economic growth is expected to
decelerate somewhat in most of Central
Europe, yet recover in the Baltic States.
The latter economies will digest the
Russian shock and return to a 2-3% GDP
growth rate. Another country displaying
more rapid growth will be Romania that
has introduced fiscal measures that boost
consumption, thus postponing the
slowdown for another year. In other
countries in the region, the end to the
consumption boom and the temporary
decline in EU transfers have given rise to
deceleration. Bulgaria, the Czech Republic,
Hungary and Slovakia will be the countries
most affected by the loss of the EU-funded
engine of growth in 2016. The European
Fund for Strategic Investment (‘Juncker
Plan’) may only marginally be available of
the EU-CEE. As for 2017 and 2018, the
EU-CEE will pick up some speed based on
new investments funded via EU transfers.
Romania will be the only country in which
we expect slower growth in 2017, by
which time the impact of the current tax
cuts will have faded out and fiscal policy
will adopt a course heading towards
stabilisation. The growth differential
between the EU-CEE and the euro area
will narrow in the years to come. The EU
Commission forecast predicted modest
acceleration of GDP growth for the euro
area from 1.6% to 1.8%, while the wiiw
forecast for the EU-CEE average shows a
deceleration from 3.4% in 2015 to 3% in
2016 – and then to 2.9% in 2017. This
implies certain reservations concerning
the transmission of growth from the euro
area and some scepticism about drivers of
longer-term growth in the region.
Country forecasts for the
EU members of Central and
Eastern Europe by wiiw in
Summer 2016
ALBANIA
Given the ongoing weakness of private
consumption, only moderate growth of
investment (largely due to the pipeline
construction) and fiscal consolidation, our
GDP growth forecasts for 2016-2018 have
been revised downwards. Still, GDP
growth above 3% can be expected from
2017 onwards. External demand will
contribute positively to GDP growth, if
international oil prices stabilise at the
recently recovered level.
BELARUS
The economy touched bottom around the
turnoftheyearandthedeclinedecelerated
in the first months of 2016. In April gross
industrial output even registered positive
year-on-year growth. The policy stance
23. SAS® VISUAL ANALYTICS
Picture hidden trends coming into plain sight.
As of 2016, Romania’s course is set on fiscal
expansion, the fiscal outcome being a general
government deficit of close to 3% of GDP.
was tightened on all fronts: incomes,
public finances, and monetary stance. Real
exchange rate depreciation continued,
contributing to an improvement in
international competitiveness. If positive
trends continue, the economy may bottom
outin2017,openingthewayforarecovery
thereafter.
BOSNIA AND HERZEGOVINA
The country is doing better than its two
bigger neighbours, Serbia and Croatia.
Growth of GDP is expected around 3%
this year and is going to stay there in the
medium term. The risks are on the upside
primarily because of the improved
prospects for the neighbouring countries
and in the region. Exports are performing
well and investments too.
BULGARIA
GDP grew by some 3% in the first quarter
of 2016, driven by private consumption
while the pace of exports lost steam. The
upturn in private consumption was
supported by the improved situation in
the labour market with growing
employment and rising real incomes. The
recovery in manufacturing also continued
and was mirrored by improving economic
sentiment in the sector. Most indications
are that modest demand-driven growth
will continue in the short to medium run.
CROATIA
GDP growth, gaining momentum in 2016,
will slightly accelerate over the forecasting
period, up to 2.3% by 2018. Thanks to the
economic recovery, unemployment will
continue to decline. The current account
will remain in surplus, but is expected to
gradually narrow as domestic demand and
consequently imports will strengthen. The
ongoingpoliticalinstabilitymaynegatively
affect the creditworthiness of the country.
CZECH REPUBLIC
Moderate and broadly-based growth will
continue over the period 2016-2018, with
GDP growth averaging some 2.4%. 2017 is
likely to end the management of the
exchange rate. Renewed fiscal
consolidation is not entirely implausible.
ESTONIA
In 2016 a slight upswing of GDP growth to
2% in real terms is expected to be driven by
continuously vibrant household
consumption, while external demand and
investment activity remain stagnant.
Rising goods imports will push the current
account balance once more into deficit.
For 2017 and 2018 we forecast a modest
upswing to 2.3% and 2.4%, respectively.
An expansion of investments will be
facilitated from 2017 onwards by public
outlays co-financed by EU funds.
HUNGARY
First-quarter GDP increased by 0.9%, a
disappointment after the formidable annual
growth in 2015, and a 3.2% expansion in the
previous quarter. This is a combined adverse
effect of outgoing EU co-financed projects, a
setback in the automotive cluster and a
generally unfavourable climate for business
investment. A likely improvement in
industrial and export performance and the
growthstimulatingeffortsofthegovernment
may show effect, lifting the annual GDP
growth to 2% in 2016.
KAZAKHSTAN
The economy continues to suffer from
low oil prices and anaemic demand in its
maintradingpartners.Householddemand
has weakened, too, due to increasing
prices and falling incomes. The exchange
rate of the tenge has stabilised recently,
but the monetary stance remains tight in
light of persisting macro-financial risks. In
2016, the economy will barely grow, by
0.4%; in 2017-2018, as the external
environment improves, growth may speed
up to 2% and 3%, respectively.
KOSOVO
The SAA between the EU and Kosovo
entered into force on 1 April 2016. It is
expected that this will create substantial
investment opportunities. Given the strong
drop in metals prices and export revenues
and an overall dampening effect of
government activities, we expect a
slowdown of GDP growth to about 3.3% for
the whole year 2016. However, if metals
prices rebound and if FDI inflows soar due
to the SAA, a GDP trend growth rate of
around 4% can be expected for both 2017
and 2018.
LATVIA
The protracted downturn in Russia drags
on Latvia’s export performance, while
construction of residential buildings and
public infrastructure is declining in 2016.
However, household consumption is
rising thanks to strong wage growth. The
expected acceleration in economic activity
will only materialise in 2017 driven by
higher public investment. Thus we had to
reduce our GDP growth forecast for 2016-
2018 to 2.5%, 3% and 3.3%, respectively.
LITHUANIA
As wages develop at a steady pace,
household consumption remains the main
engine of GDP growth. Due to the delayed
absorption of EU funds, public investment
is slowing down. Until investment picks up
momentum,GDPgrowthwillbesupported
by rising exports. In 2016 the Lithuanian
economy is expected to grow by 2.8% and
about 3% in the upcoming two years.
MACEDONIA
In the first quarter of this year investment
declined by close to 10% and growth
slowed down to 2%, from 3.7% in 2015.
Private consumption continued to expend
as did public consumption and exports
too. If investment recovers going forward,
GDP may expand by 3.4% as forecasted.
The medium-term growth rate may settle
at closer to 3% rather than 4%. A swift
resolution of the political crisis may push
growth up, however.
MONTENEGRO
Political instability notwithstanding,
24. MACROECONOMIC OUTLOOK
22 Romanian Business Digest•2016
The Vienna Institute for
International Economic Studies (wiiw)
3 Rahlgasse, 1060 Vienna, Phone: +43 1 533 66 10 - 22
Fax: +43 1 533 66 10 - 50
www.wiiw.ac.at
GÁBOR HUNYA
Senior Economist
wiiw
Contact:
hunya@wiiw.ac.at
AUTHOR
growth is hovering somewhat above 3%,
mostly due to investment and exports of
services. This year’s revenue from tourism
is expected to be a record one. The
somewhat improved economic situation
in the neighbouring countries is also
supporting the tourist industry. Inflation
is subdued as in the region. In the medium
run, growth should remain above 3% per
year barring political or financial shocks.
POLAND
Moderate and broadly based growth will
continue over the period 2016-2018, with
GDP growth averaging some 3.2%. The
year 2017 will prove critical for the public
finances unless the increase in social
spending is offset by higher taxation.
ROMANIA
The current economic boom generated by
fiscal stimuli is expected to subside in the
second half of the year. With domestic
demandturningoutstrongerwhileforeign
demand weaker than earlier assumed, we
see no reason to increase the wiiw GDP
forecast of 4.0% for 2016. A marked
deceleration of economic growth, to 3.2%,
is forecasted for 2017, should the 3% fiscal
deficit limit be obeyed.
SLOVAKIA
In the first quarter 2016, GDP rose by 3.4%
year on year, at a slightly slower pace than
in 2015 (3.6%) but still faster than in most
other European countries. As the high
growth rates of gross fixed capital
formation cannot be sustained, we expect
a slight growth decline to 3% for the whole
year 2016. Domestic consumption will be
the main engine of growth for the years to
come. Growth acceleration can expected
with the start of production at the new
Jaguar Land Rover plant from 2018/19
onwards.
SLOVENIA
Despiteasharpcontractionofinvestments,
GDP is expected to grow by about 2% in
2016 and accelerate to close to 3% by
2018. The main drivers of growth will be
the recovery of private consumption as
wellasinvestmentsfuelledbyEUtransfers.
The high current account surpluses are
expected to decline once domestic
demand strengthens.
SERBIA
In the first quarter 2016 GDP grew by
3.5% year on year, but only by 1.6% over
the previous quarter. All components of
GDP contributed to growth – public
consumption by 3.2%, private
consumption by 0.7%, but investment by
7.9% and net exports by almost 3%.
However, the first quarter of 2015 was
quite bad, so growth going forward will
moderate. Looking ahead, recovery should
strengthen somewhat and medium-term
growth of around 3% is realistic.
TURKEY
Turkey’s growth performance was 4.0% in
2015 and will probably rise to 4.1% with
the help of household final consumption
due to the rise in hourly real wages, and
ongoing higher government spending.
Because of a slight rise in oil prices, the
slowdown in gross fixed capital formation
for the last couple of years and weakening
but positive domestic demand, we expect
a deceleration of GDP growth for 2017
and 2018, to 3.7% and 3.5%, respectively.
RUSSIA
The economy is finally bottoming out; the
expected recovery in the second half of
2016 will be weak and fragile. The
outstanding structural reforms are still on
the drawing board and a renewed plunge
of oil prices could cause another slump.
Given the absence of reforms and
modernisation investments, economic
growth will remain sluggish even in the
medium term.
UKRAINE
The economy has probably bottomed out,
as inflationary pressures eased markedly
thanks to exchange rate stabilisation and
fiscal policy became less restrictive. With
the new government in place, a resumption
of the IMF programme looks now almost
certain. However, a visible economic
recovery cannot be expected until at least
next year, with inflation subsiding further,
fiscalpolicybecomingmoreaccommodative
and export re-orientation away from Russia
potentially starting to bear fruit.
25. The Vienna Institute for International Economic Studies – wiiw – is
„ one of the principal centres for research on Central, East and Southeast Europe
„ with more than 35 years of experience in the region
„ an independent and non-profit organization
„ with an international staff
Our expertise
„ Macroeconomic expertise combined with detailed institutional knowledge
„ Cross-country, comparative know-how
„ Proprietary databases on major economic indicators of CEESE countries
We regularly cover
„ The New Member States of the EU: Baltic States, Bulgaria, Czech Republic, Hungary,
Poland, Romania, Slovakia, Slovenia
„ SEE countries: Albania, Bosnia & Herzegovina, Macedonia, Montenegro, Serbia, Turkey
„ The Newly Independent States: Kazakhstan, Russia, Ukraine
Our products and services
„ Regular forecasts of major economic indicators
„ Economic analyses and research on a contract basis
„ Statistical data
„ Policy advice
To find out more about us, visit www.wiiw.ac.at
Wiener Institut für Internationale
Wirtschaftsvergleiche
The Vienna Institute
for International Economic Studies
wiiw
26. 24 Romanian Business Digest•2016
MACROECONOMIC OUTLOOK
SAS® VISUAL ANALYTICS
Picture hidden trends coming into plain sight.
The EU has taken steps to encourage mobility of workers between member states.
Minimum Wage Requirements
in Europe and How These
Affect Posted Workers
F
ree movement of workers is one of
the fundamental principles of the
EU, and brings many benefits. It
helps companies move employees to
where their skills are needed, or to gain
professional experience in another
country. It also makes it much easier for
businesses to hire the best person for the
job, without having to take nationality into
consideration, at least for EU citizens. The
individuals also benefit because they
acquire new skills and knowledge, which
can help them develop their careers, and
can also gain in personal terms from
broadening their cultural horizons. Even
the opportunity for foreign postings can
make an employer more attractive to a
prospective employee. Moreover, national
economies gain too, as free movement of
workers makes it much easier for gaps in
the labour market to be filled, and can help
reduce unemployment in periods of
recession if citizens can seek employment
in other countries.
Currently, mobility within the European
Union is still quite low; well below the
level in other highly integrated areas like
the United States, and well below the level
within individual countries. Language is
an obvious barrier. But it is increasing, for
By KPMG Romania
anumberofreasons,particularlyeconomic
disparities within the European Union.
Fromanemployer’sperspective,anumberof
issues need to be taken into consideration
when posting workers to other member
states. These situations are covered under
theEU’sPostingDirective(96/71EC),which
has recently been complemented by a new
enforcement directive, adopted in 2014, and
which must be transposed into member
states’ legislation by 18 June 2016. The latest
directive does not make new rules, but is
designed to improve the application of
existing ones, by strengthening the rights of
posted workers, making the cross border
provision of services easier and combatting
social dumping. The European Union also
intends to clamp down on undeclared work,
and within member states, tax and labour
authorities have become increasingly
vigilant.
Minimum wage legislation: a
complex issue
One of the most important considerations
for an EU employer considering posting
employees to another member state is the
level of the minimum wage in the
prospective host country.
Most EU member states have some form
of minimum wage legislation, and workers
posted from one member state to another
must be paid at least the minimum wage
in the country they are sent to.
This seems simple and obvious, but in
practiceitisaverycomplexarea.Anumber
of questions need to be asked by any
employer planning to send workers on
postings:
The Directive and the recent
enforcement legislation require
for a set of minimum ‘hard core’
elements to be guaranteed to
posted workers:
➤ Maximum work periods and minimum
rest periods.
➤ Minimum paid annual holidays.
➤ Minimum rates of pay, including overtime
rates.
➤ The conditions of hiring out of workers,
in particular the supply of workers by
temporary employment undertakings.
➤ Health, safety and hygiene at work.
➤ Protectivemeasureswithregardtothe
termsandconditionsofemploymentof
pregnantwomenorwomenwhohaverecently
givenbirth,ofchildrenandofyoungpeople.
➤ Equality of treatment between men and
women, and other provisions.
27. 2016•Romanian Business Digest 25
SAS® VISUAL ANALYTICS
Picture hidden trends coming into plain sight.
National economies gain, as free movement of
workers makes it much easier for gaps in the
labour market to be filled.
Countries where the minimum wage is set at national level: Belgium, Bulgaria, Croatia, Czech Republic, Estonia, France,
Germany, Hungary, Iceland, Ireland, Latvia, Lithuania, Luxembourg, Malta, Netherlands, Poland, Portugal, Romania,Slovakia,
Slovenia, Spain, United Kingdom.
Countries where the minimum wage is set under Collective Bargaining Agreements: Austria, Cyprus, Denmark, Finland,
Greece, Italy, Norway, Switzerland.
Countries where there is no minimum wage: Sweden.
Should the employee’s salary be raised if
he/ she does not earn enough income in
the home country to meet the level of the
minimum wage in the posting country? Or
could the shortfall be met by other forms
of payment?
Could the posted employee be granted
an assignment allowance on top of the
home-country base salary in order to reach
the minimum wage requirement in the
posting country?
Would a bonus be sufficient?
What about per-diems, cost of living
allowances or foreign service premiums?
Can transport and accommodation
allowances be considered part of the
minimum wage?
Of course, the above list can go on with
many more similar questions. The posting
employer will also have to deal with issues
relatingtoitscountry’sdomesticlegislation,
as well as internal policy (if any), such as:
An increase in salary to meet the
minimum wage in the host country could
lead to employment law implications in
the home country (e.g. what happens
upon termination of the assignment and
could the base salary be decreased to the
home-country level after repatriation?).
How can a different increase in salary
for two assignees holding the same
position be justified, when staff are posted
to two different countries with different
levels of minimum wage (e.g. assignment
to Romania and assignment to Germany)?
Different rules
in each country
All EU member states, except Sweden,
have some form of minimum wage
legislation.
There are however two main groups in
terms of policy. Most EU member states
have a national minimum wage for all
workers. In others, different minimum
wages are set by Collective Bargaining
Agreements and can differ based on sector,
industry, worker’s age and professional
Per diem allowance
Daily allowance meant to cover food
and incidental costs while travelling in
connection with one’s work or being
employed at a distance from home.
Cost of living allowance
Amount paid by employers to protect
assignees while on assigment from
increased costs of goods and services
in the host location as compared to
those in the home country.
Foreign service premiums
Assigment-related allowance
Bonuses
Additional compensation given to an
emplyee in the home country above
the normal wage.
Types of payments which have been analysed as to whether they could be
considered as part of the minimum wage:
28. 26 Romanian Business Digest•2016
MACROECONOMIC OUTLOOK
SAS® VISUAL ANALYTICS
Picture hidden trends coming into plain sight.
experience, etc. There are also state
members which have minimum wages for
highly skilled workers, which can be quite
high – currently EUR 4,444 per month in
France. Consequently, it can be important
for an employer planning to send
employees on postings to carefully look at
how the employee’s activity is likely to be
defined in the legislation of the host
country, as well as the implications that
might arise both at the level of the
company and the individual.
Normally a minimum wage is set as a
monthly or hourly rate, and is a gross
figure, before income tax and employees’
social security deductions. However, this
can vary from one state member to
another.
In the state members where the minimum
wages are set by the applicable Bargain
Collective Agreements, the level of the
minimum wage is governed by factors like
worker’s age, professional experience,
industry, etc.
Once the level of the minimum wage that
needs to be reached is known, it is as
important to monitor how often this level
changes. In many state members, the rate
changes annually.
In the Netherlands and France, usually the
level of the minimum wage rises twice a
year, while in others it changes irregularly.
An employer needs to keep close track of
legislation when planning assignments and
to make sure that the correct minimum
wage level is paid to those posted.
The importance of compliance
Aswehaveseen,minimumwagelegislation
is complex and varies widely across the EU.
At the same time, authorities have become
increasingly vigilant about enforcing it,
amid growing political pressure to protect
wage levels within member states.
Employers need to fully understand the
legislation when planning their posting
strategy and once it is in place, since
penalties for non-compliance can be
severe, including in some cases a complete
ban on doing business in the relevant
country. Moreover, the relatively high level
of some minimum wages, particularly for
skilledworkers,meansthatevenemployers
who pay generous salaries in their own
country need to take note, because these
may still be too low to meet the minimum
wage requirement in a country of posting.
Overall, the best policy for employers is to
research this issue thoroughly and seek
the right professional advice when
planning their foreign postings strategy.
In the 22 countries that have a minimum wage established at national level, it
varies between currently EUR 214 in Bulgaria and EUR 1,923 in Luxembourg:
-
500
1.000
1.500
2.000
2.500
Minimum wage in countries where this is set at national level
EUR
18 countries under analysis have reported increases to the minimum wage
level in 2016 as compared to 2015:
COUNTRY
MONTHLY MINIMUM WAGE IN
LOCAL CURRENCY (2015)
MONTHLY MINIMUM WAGE IN
LOCAL CURRENCY (2016)
Bulgaria BGN 380 BGN 420
Croatia HRK 3,029.55 HRK 3,120
Czech Republic CZK 9,200 CZK 9,900
Estonia EUR 390 EUR 430
France EUR 1,457.52 EUR 1,466.65
Hungary HUF 105,000 HUF 111,000
Iceland ISK 245,0001
ISK 260,0002
Ireland EUR 8.65 (hourly rate) EUR 9.15 (hourly rate)
Latvia EUR 360 EUR 370
Lithuania EUR 325 EUR 350
Malta EUR 166.26 (weekly rate) EUR 168.01 (weekly rate)
Netherlands EUR 1,507.80 EUR 1,524.60
Poland PLN 1,750 PLN 1,850
Portugal EUR 505 EUR 530
Romania RON 1,0503
RON 1,2504
Slovakia EUR 380 EUR 405
Spain EUR 648.6 EUR 655.20
United Kingdom GBP 6.70 (hourly rate)5
GBP 7.20 (hourly rate)6
1) As of 1 May 2015; 2) As of 1 May 2016; 3) As of 1 July 2015; 4) As of 1 May 2016; 5) As of 1 October 2015; 6) As of April 2016
29. 2016•Romanian Business Digest 27
Minimum wage survey
In the attempt to ease the employers’
research on the levels of the minimum
wage, KPMG Romania has prepared a
survey on the minimum wage within the
EU/EEA and Switzerland. Beside part of
the information from the survey which is
captured on the previous pages, the
employers which have or intend to post
employees within the EU/EEA or
Switzerland can find in the KPMG survey a
Country by Country Specific section,
where not only the 2015 and 2016 level of
the minimum wage is indicated, but also
other various countries specifics are
provided on this topic.
The KPMG Romania minimum wage
survey can be found at https://home.kpmg.
com/ro/en/home.html.
The best policy for employers is to research the
minimum wage legislation thoroughly and seek
the right professional advice when planning
their foreign postings strategy.
MADALINA RACOVITAN
Partner, Head of People
Services
KPMG in Romania
ALINA PREDESCU
Senior Manager,
Fiscal Consultancy
KPMG in Romania
MEDEEA POPESCU
Assistant Manager,
Fiscal Consultancy
KPMG in Romania
AUTHORS
KPMG Romania
Victoria Business Park, DN1, 69-71 Bucuresti-Ploiesti Road
District 1, Bucharest
Phone:+40 372 377 800, Fax: +40 372 377 700
Email: kpmgro@kpmg.ro
www.kpmg.ro
30. MACROECONOMIC OUTLOOK
SAS® VISUAL ANALYTICS
Picture hidden trends coming into plain sight.
The Romanian consumption grows at the highest pace in the CEE region
Companies Face Difficulties
in Capitalizing on Strong
Internal Demand
I
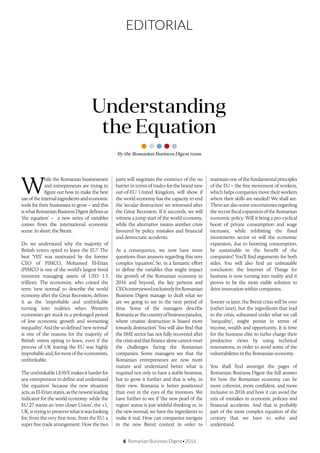
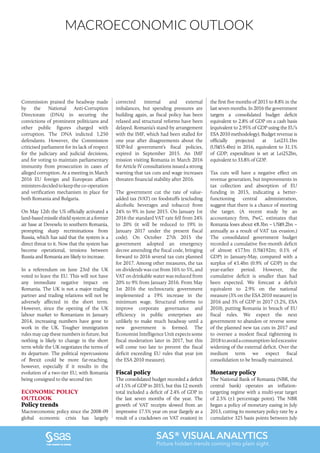
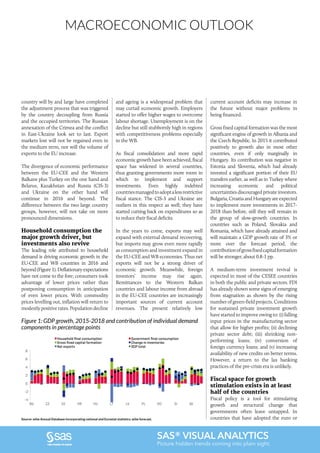
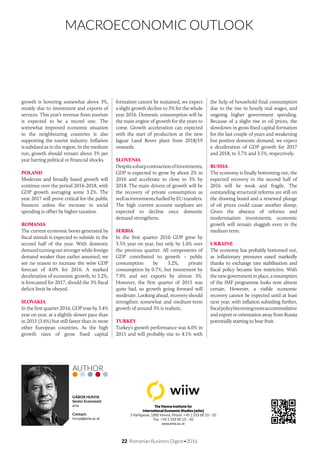
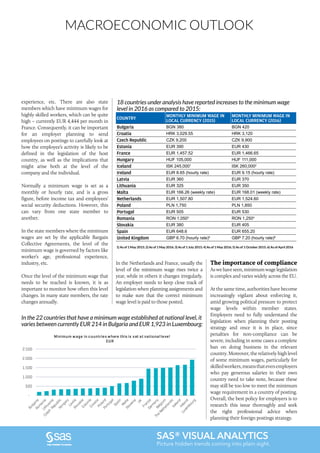
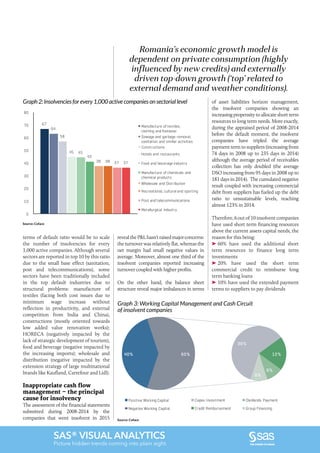
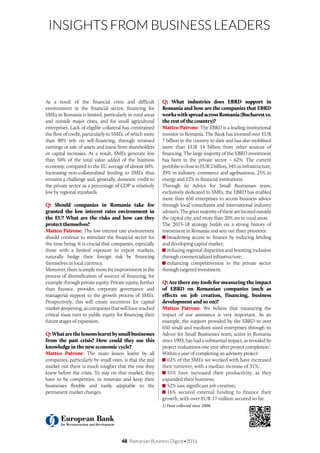
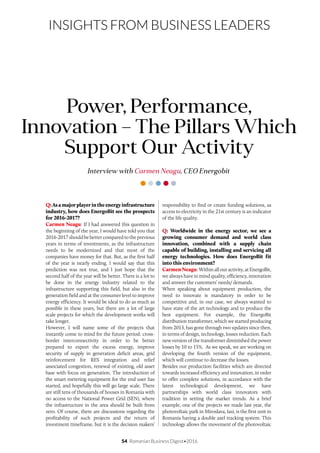
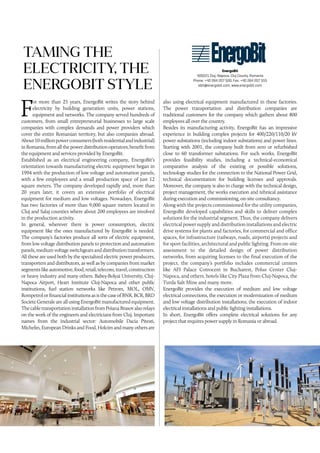
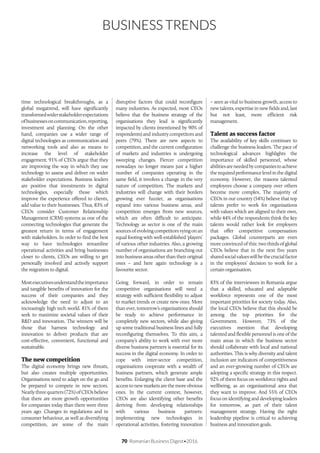
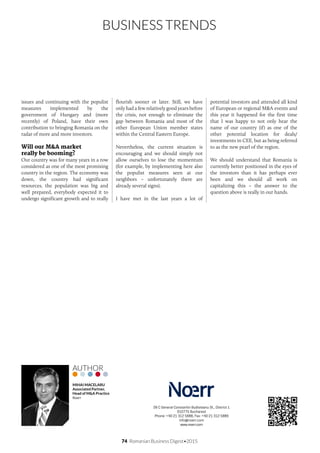
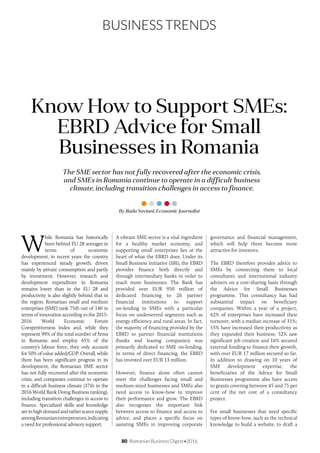
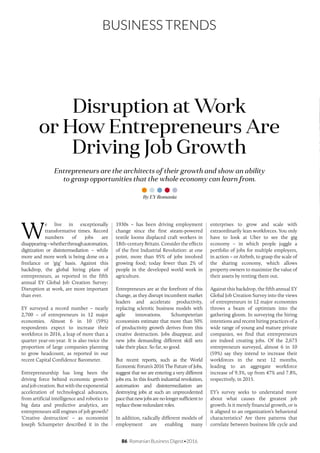
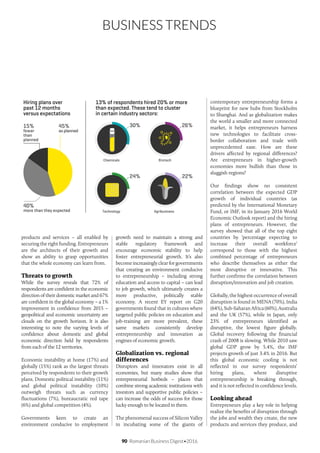
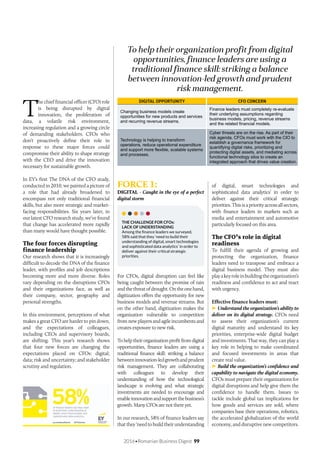
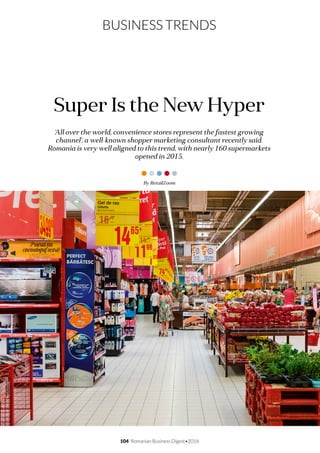
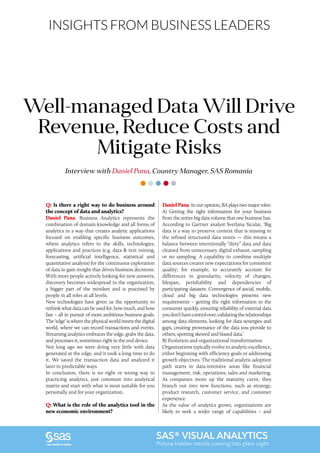
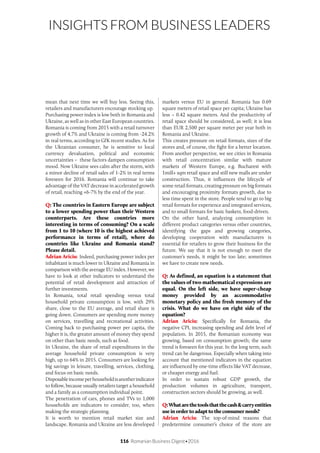
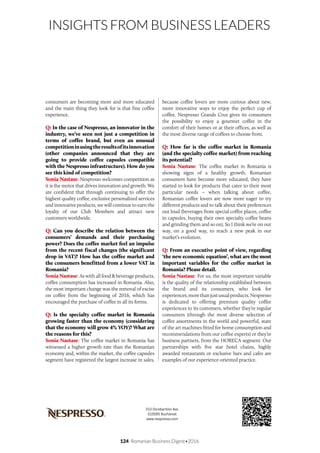
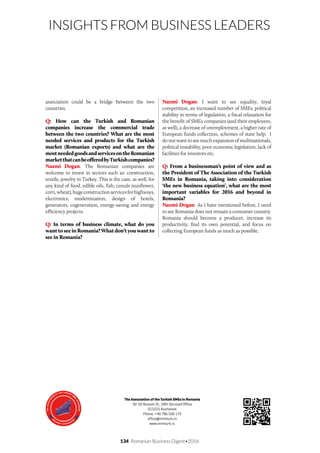
n 2015, the Romanian economy
continued to expand at one of the
highest paces in the region for the
fourth consecutive year, by 3.8% [fig. 1]. In
terms of growth composition, a common
trend emerged in Europe, with private
consumption as a main driver,
compensating for the lower exports on the
back of a slowdown in external demand.
At the same time, investments contributed
positively to the economic expansion,
driven by a pickup in EU fund absorption,
given that 2015 was the last year for
absorbing funds under the 2007-2013
programming period. We expect
investments to slow down as the
absorption of EU funds will temper this
year for all countries, because of the usual
delays at the start of a new programming
period. In Romania, the launch of the
2014-2020 Programme was not accurately
prepared in advance and the country still
finds itself in the preliminary phase of
fulfilling ex-ante conditions.
Additionally, on 23 June, The United
Kingdom held a referendum on EU
membership and the British people voted
to leave the Union. This is an
unprecedented decision, which will
create prolonged uncertainty and will
likely determine companies to postpone
investments while trying to gauge the
By UniCredit Bank
impact. The exit negotiations will be
complexandwilltakearoundtwoyearsafter
the Great Britain formally informs the EU
about its decision. Looking at the medium-
term, the UK’s exit from the EU would affect
Romania through: trade relations, migration
and EU funds, given that UK is a great
contributor to the EU budget. The more
diligent countries might absorb more and
faster, leaving less funds available for the
laggers, among which Romania.
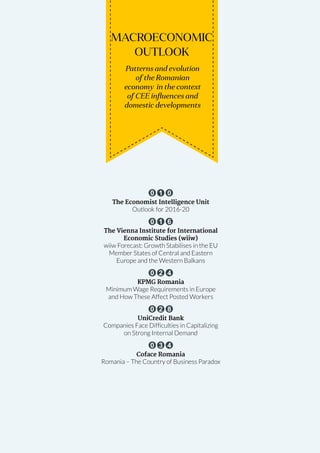
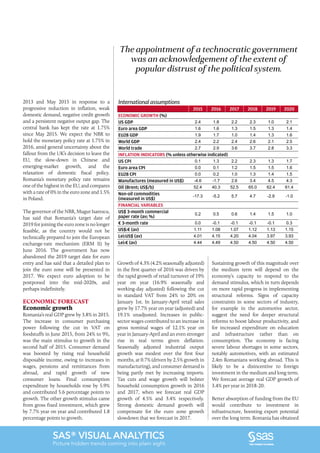
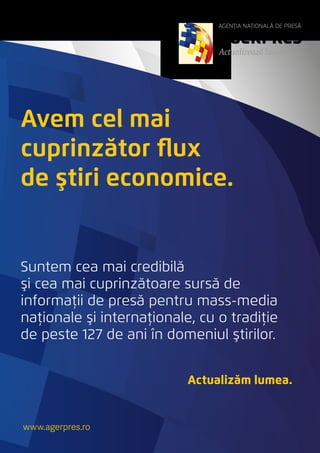
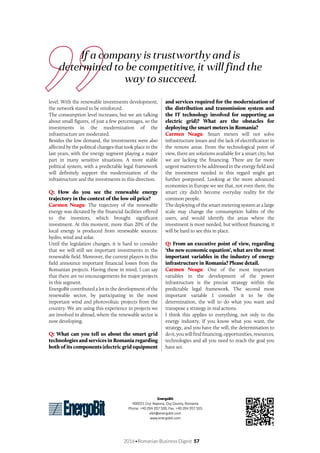
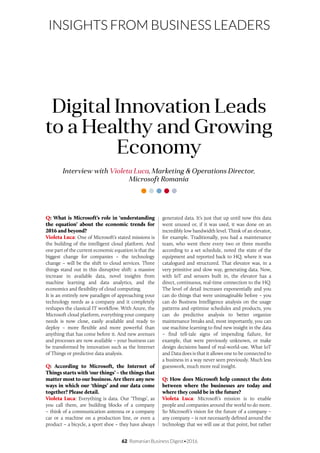
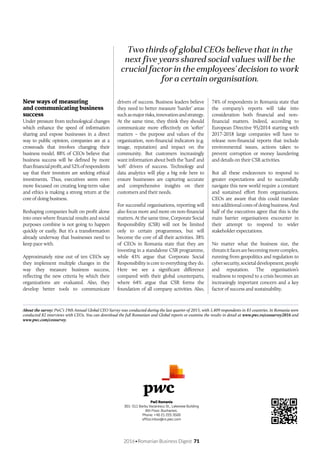
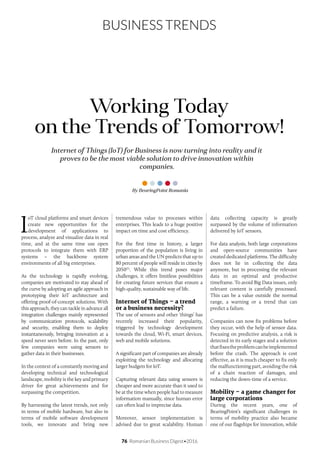
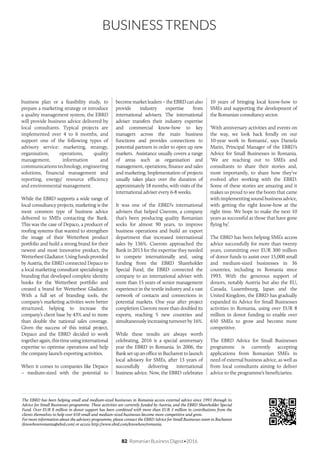
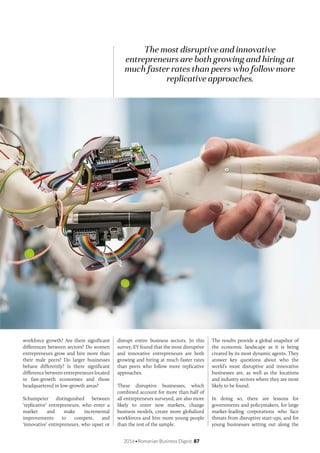
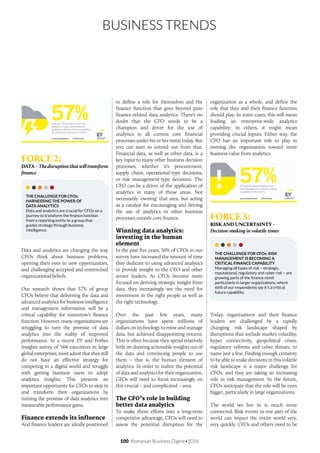
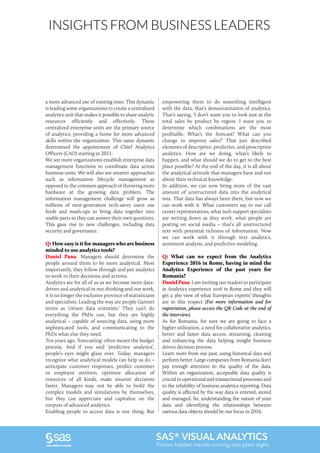
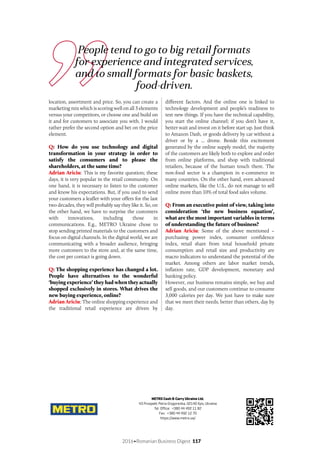
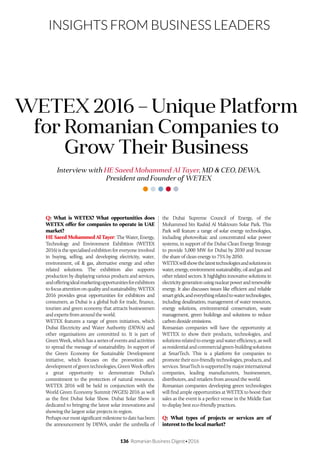
By comparing the growth rates of
consumption among CEE countries, we
see that Romanian consumption has
been growing faster by around 2pp than
any of the other countries in the region
[fig. 2]. This was caused by the fact that
besides the stimuli from which
consumption benefitted throughout the
region (the low inflation following the
collapse of oil prices, wage growth,
consumer confidence and the recovery of
lending), Romanian consumers also
benefitted from: i) several hikes to the
minimum wage to RON 1250 currently
(up almost 40% in comparison to its level
at the end of 2014), ii) salary increases for
[fig. 1] Romania grows above potential and remains a top performer…
Data source: Eurostat, UniCredit Research
-3.0
-2.0
-1.0
0.0
1.0
2.0
3.0
4.0
5.0
BG HU SK CZ PL RO
2012 2013 2014 2015annual growth (%)
31. SAS® VISUAL ANALYTICS
Picture hidden trends coming into plain sight.
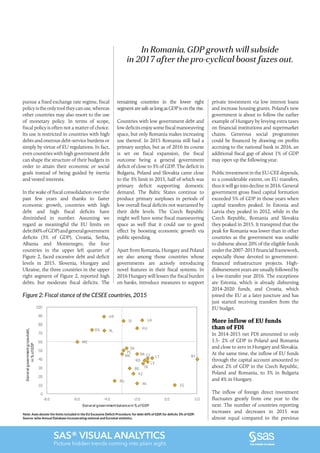
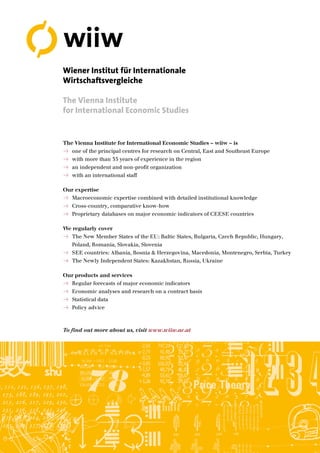
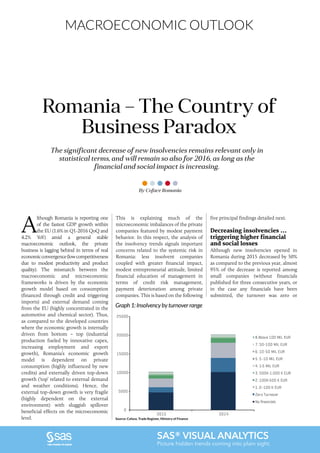
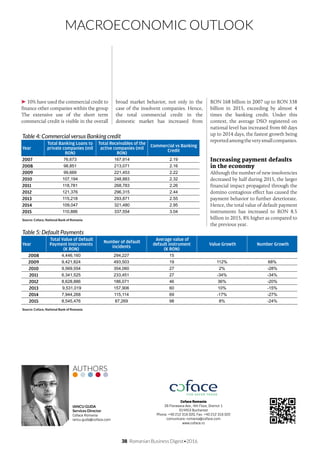
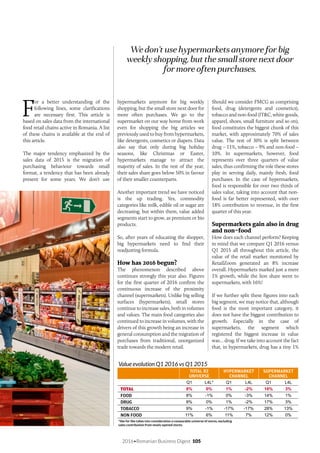
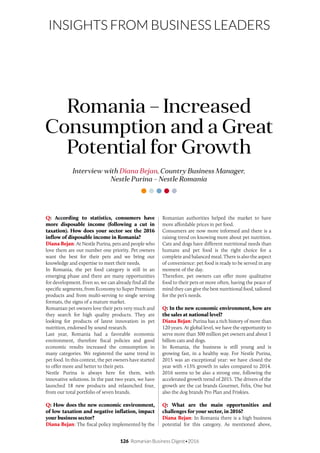
[fig. 2] ...driven by the very strong consumption, supported by both internal
and external factors
Data source: Eurostat, UniCredit Research
We expect consumption to maintain the highest
growth rate in the region throughout 2016. This
should translate into an economic growth rate
above 4% this year.
public sector employees(1)
, iii) fiscal
relaxation through two waves of VAT
cuts(2)
, iv) the recovery of consumer
lending in local currency.
The VAT cuts led to a sharp decline in
prices and increased the purchasing
power of individuals, with wages higher
by around 16% in real terms in the first
five months of 2016 than in the
corresponding period of 2015. As a
consequence, we expect consumption to
maintain the highest growth rate in the
region throughout 2016. In turn, this
should translate into an economic growth
rate above 4% in 2016. However, a
growing share of the additional demand
will be absorbed by imports, which could
result in a slowdown of economic growth
-4.00
-2.00
0.00
2.00
4.00
6.00
8.00
SI SK BG CZ PL HU TR RO
2015 2016F 2017F% annual growth
32. MACROECONOMIC OUTLOOK
SAS® VISUAL ANALYTICS
Picture hidden trends coming into plain sight.
during 2017. Additionally, UK’s decision
will temper growth throughout Europe
and implicitly in Romania as it will lead to
lower investments and to trade frictions
within Europe, depressing the value of
both Romania’s direct exports to the UK
and indirect ones through the eurozone
(whichuseRomanianintermediategoods).
The increasing consumption
of imported goods limits
benefits for local producers
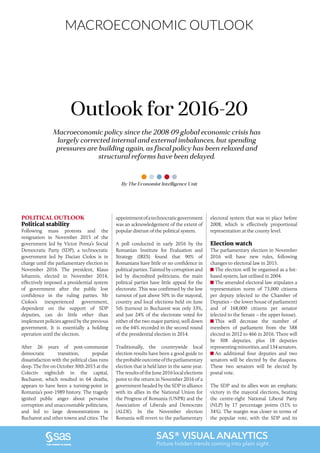
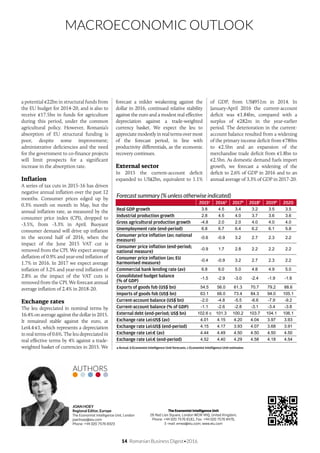
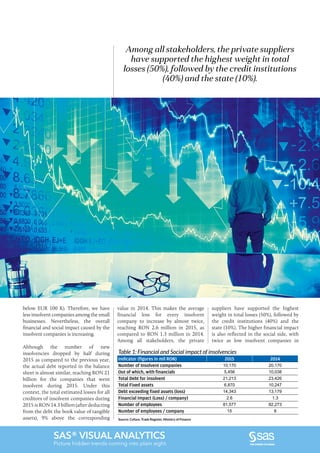
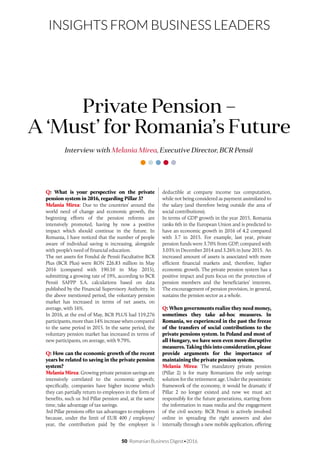
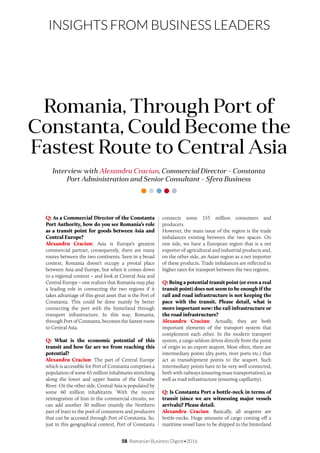
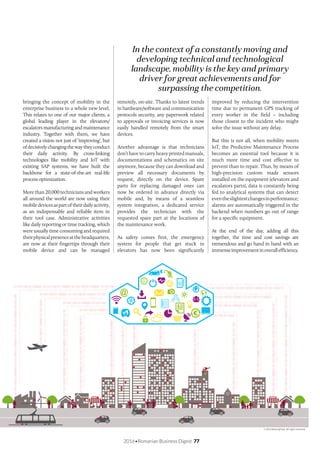
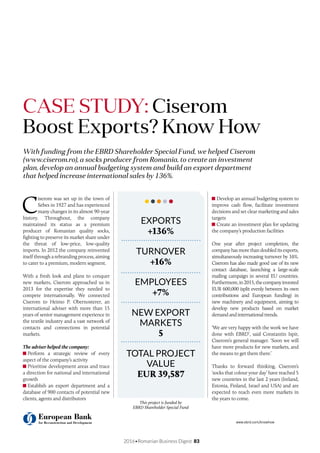
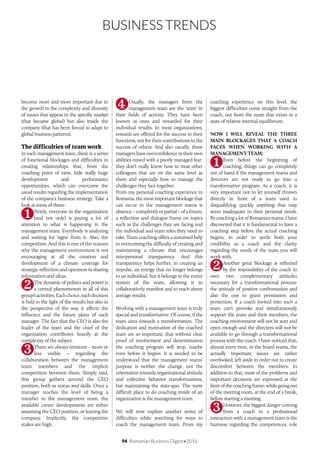
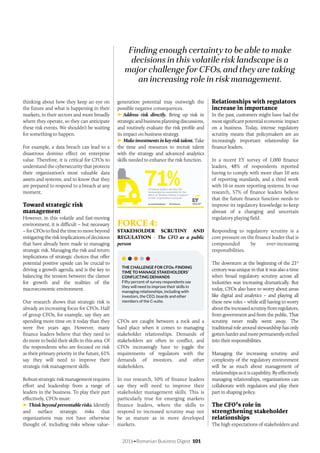
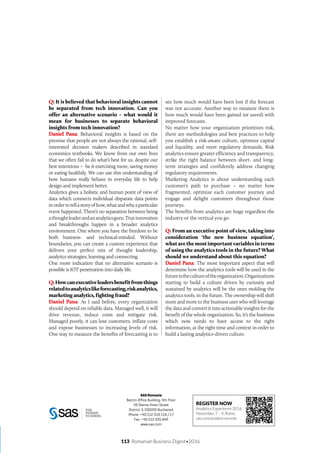
In spite of the booming consumption,
local companies do not reap the full
benefits and depend mostly on external
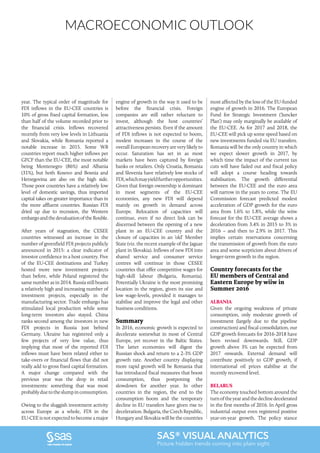
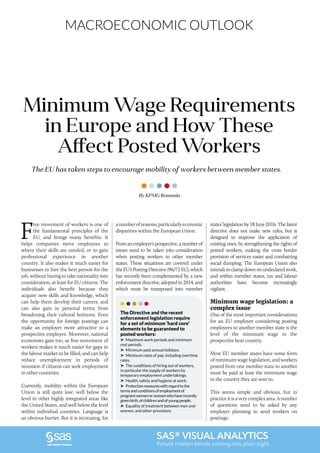
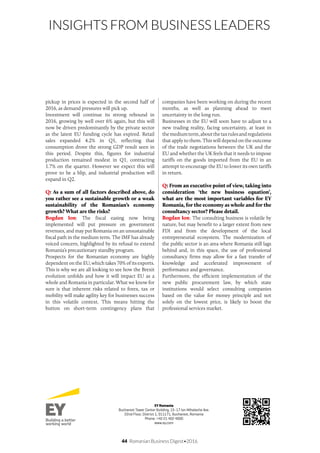
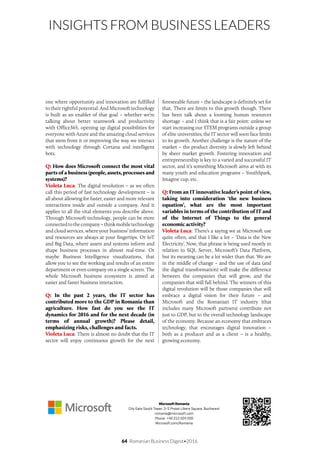
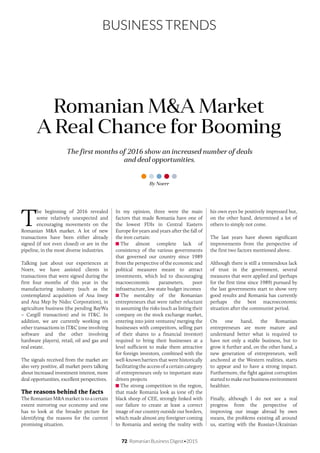
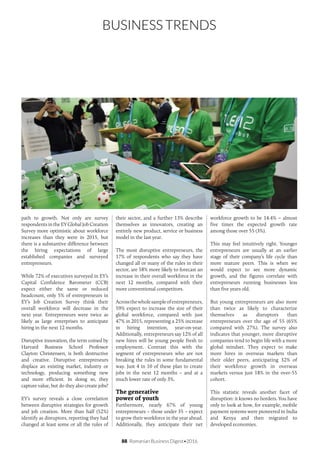
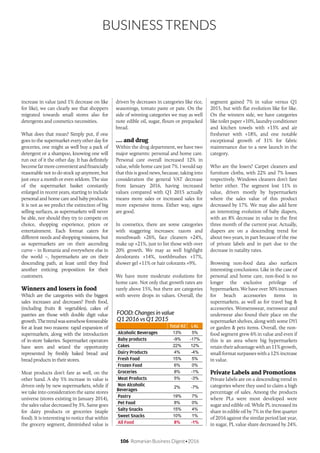
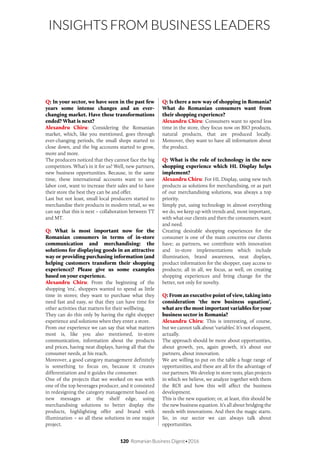
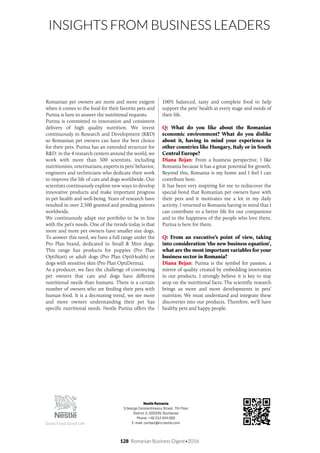
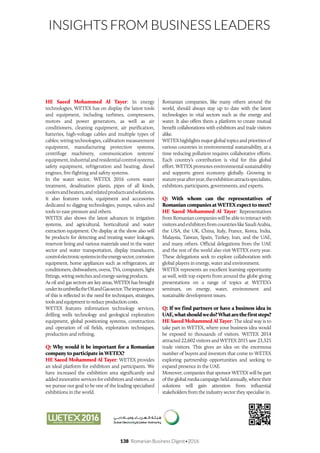
demand. As a consequence, both exports
and industrial production have been
decelerating in line with those of our
main trading partner, Germany [fig. 3],
which accounts for 20% of Romania’s
total exports and imports. Romanian
industrial production slowed down to
only 2% in 2015 from 3.7% in 2014 and
grew by only 0.5%yoy during the first
quarter of 2016. With Brexit around the
corner, we expect the demand for
Romanian exports and thus for the local
industrial production to temper further
during the following years. This is taking
place in a context in which the pressure on
local companies is mounting from various
sources:i)theabove-mentionedminimum
wage hikes pressure fixed costs, ii) the new
Fiscal Code includes no significant fiscal
easing for them and iii) the EUR-RON
exchange rate was the most stable starting
from 2013, in contrast with the remaining
countries in the region which had been
depreciating, making their exports more
appealing. In this context, we saw a
decoupling of wage and productivity
growth, a common trend in the region.
However, in Romania investments
remained at the lowest level in CEE, at
only 60% of their 2008 level, because of
the very low absorption of EU funds and
low public investments. Since the
outburst of the crisis, spending for
investments was the first category of
expenditure to be sacrificed in order to
contain the budget deficit, with negative
impact on the long-term growth potential
of the country. The ambitious fiscal
easing during the following two years is
geared towards consumers and it is
already threatening the budget deficit,
making it clear that unlike other CEE
countries, Romania will not be able to
provide fiscal stimulus to companies and
will be forced to cut public investments in
2017 in order to maximize its chances to
meet the 3% of GDP deficit target.
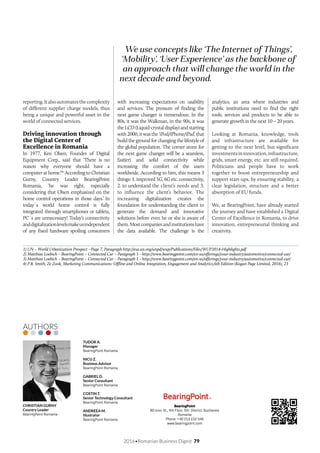
Consequently, companies are on their
own, trying to grab on any opportunity. If
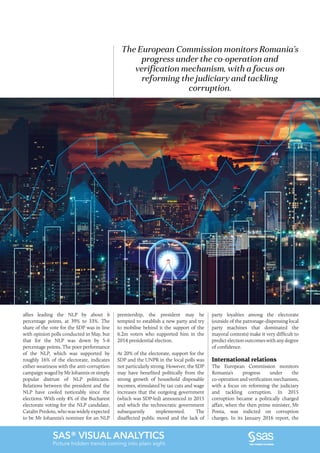
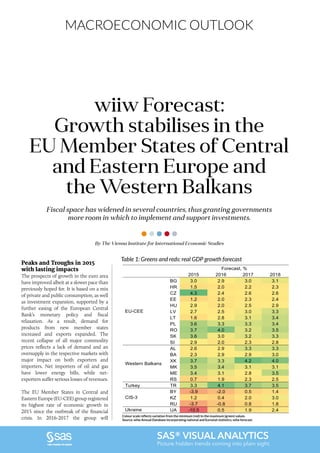
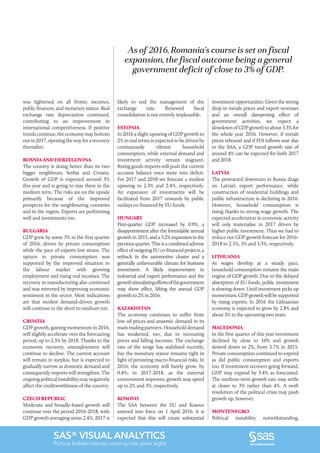
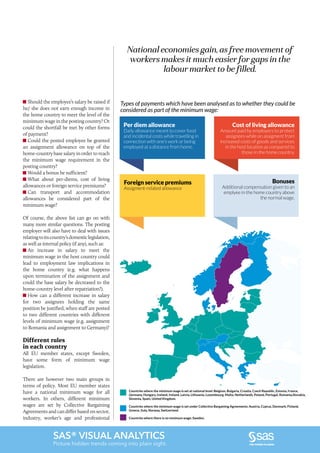
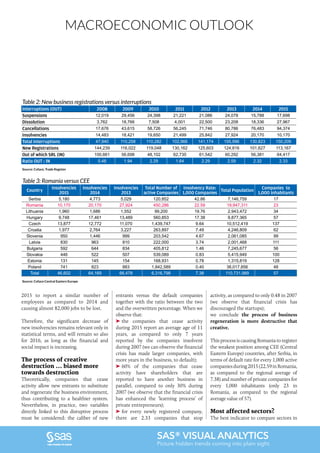
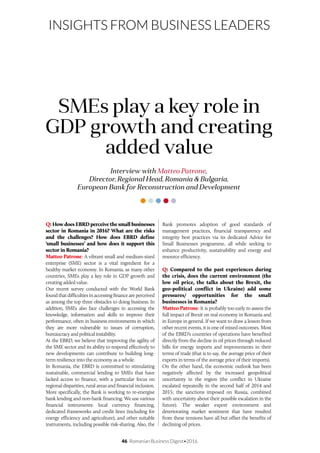
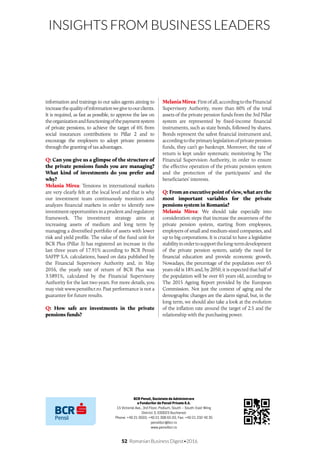
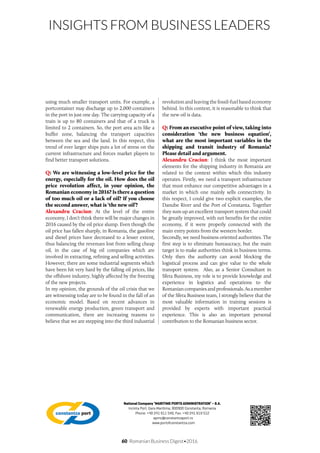
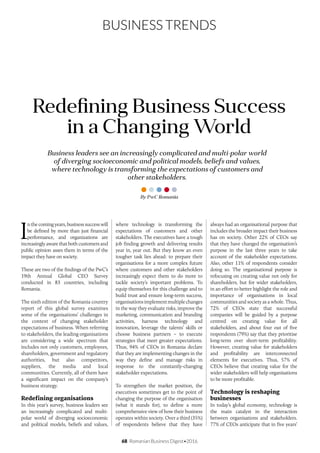
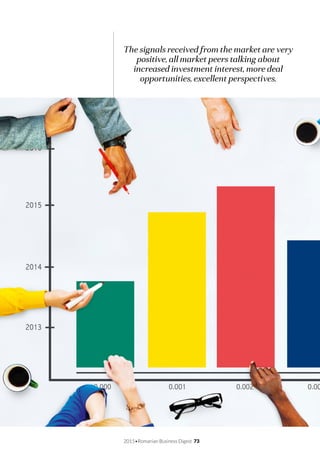
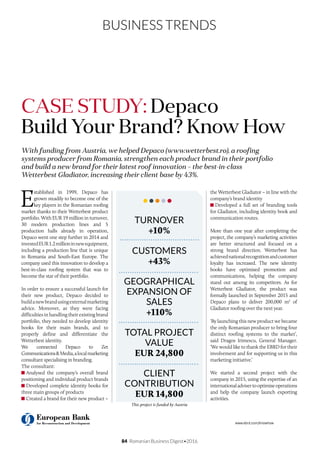
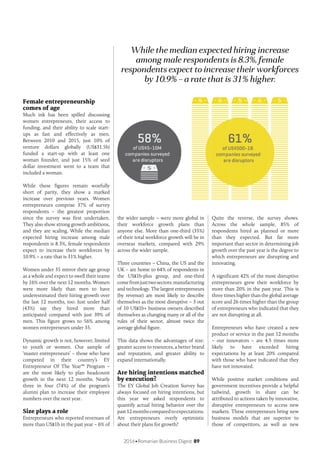
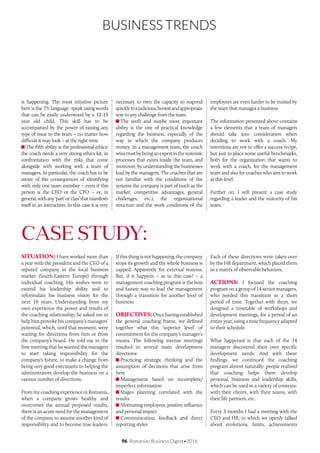
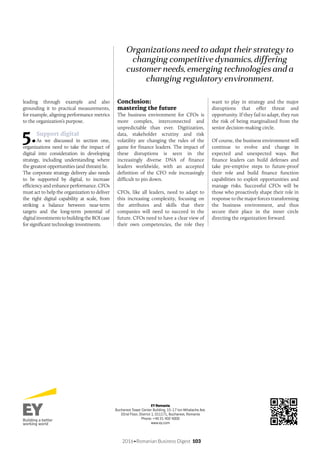
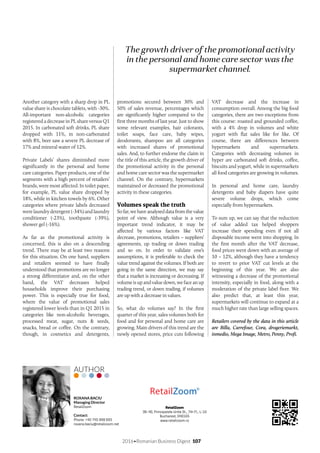
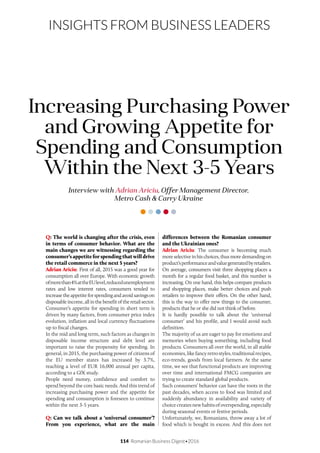
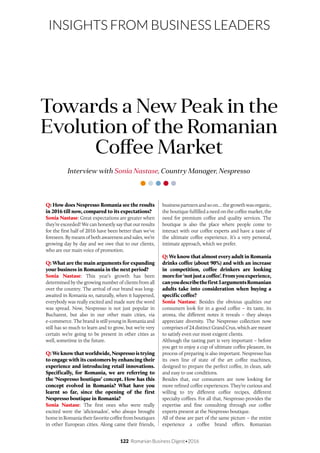
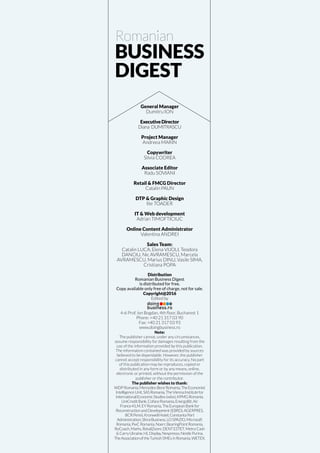
we take a look at the various sectors of
the economy, we notice that those closely
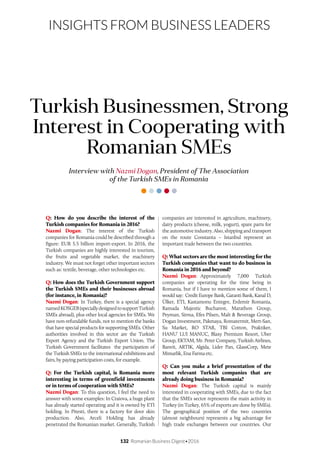
correlated with consumption (such as
retail trade and services) saw their
confidence recovering faster than the
others [fig. 5], dynamic also visible in the
[fig. 3] The Romanian industrial production grows with the region…
Data source: Eurostat, UniCredit Bank Research
-6
-4
-2
0
2
4
6
8
10
12
Jan-12 Jul-12 Jan-13 Jul-13 Jan-14 Jul-14 Jan-15 Jul-15 Jan-16
Germany Romania
3M-moving average, annual growth
[fig. 4]… as local factors fail to offer adequate support to local producers,
but rather boost imports
Data source: NIS, UniCredit Bank Research
-15.0%
-1.0%
-5.0%
0.0%
5.0%
10.0%
15.0%
20.0%
25.0%
Jan-12 Jul-12 Jan-13 Jul-13 Jan-14 Jul-14 Jan-15 Jul-15 Jan-16
Intra EU27 Exports
Intra EU27 Imports
Extra EU27 Exports
Extra EU27 Imports
12M-moving average, annual growth
33. SAS® VISUAL ANALYTICS
Picture hidden trends coming into plain sight.
banks’ exposure through the credit stock
likely due to both higher demand and
better eligibility [fig. 6].
Structural deficiencies of local
companies are also limiting
expansion
AsaparticularityoftheRomanianeconomy,
the wide majority of companies (around
92% of the total) are micro-companies with
up to 9 employees. Consequently, it is
natural for companies to capture only
limited portions of the increasing demand,
with the overall well-being of the sector
lagging behind the households’ recovery. At
the same time, the business partners of
SMEs are usually local companies with
Romanian capital and households (through
retail trade), while corporations rely on
both trade with foreign companies and
local companies with Romanian capital.(3)
Under these circumstances, most of the
SMEs rely on reinvested profits/ asset sales
and loans from mother-banks or capital
increases. Commercial credit is only third
inrankingasapreferredsourceoffinancing
and it was mainly channelled towards
working capital and payments to
distributors (30%), while investments for
development accounted for a meagre 7%.
According to NBR’s Survey, the most
pressing issues for companies are the level
of taxation, fiscal unpredictability, the
competition and finding customers. At the
same time, following several years of losses,
SMEs still have to address eligibility issues,
as only 14% of SMEs applied for and
received a loan, in comparison with a much
higher percentage for corporations (39%).
The most worrisome statistic of NBR’s
survey states that above 90% of the SMEs
did not apply for or had any contact with
EU funds. In our view, these issues should
be addressed with priority and the
government should increase awareness
regarding the benefits and accessibility of
such funding and offer assistance to
SMEs. A first ray of hope came from
public investments in December 2015,
when the government channelled all the
unutilized funds up to the deficit target
towards investments and co-financing
for EU funds, in total amount of RON 17
billion. Accordingly, payments of EU
funds to beneficiaries jumped to 74.2% of
the 2007-2013 allocation (up 21.9pp
compared to end-2014). The effective
payments from the EU totalled only
58.9% of the allocation (up 14pp from the
end of 2014). The difference up to 74.2%
is represented by payments in advance
made by the state to speed up funding
given that 2015 was the last year for
absorption under the 2007-2013
allocation and will be recovered
subsequently from the EC. However, the
overall performance was modest in 2015,
with actual inflows of EU funds to the
state budget lower by RON 3 billion than
planned, despite considerable efforts to
improve absorption at year-end
(December inflows at RON 5.6bn vs.
RON 1 billion on average in the first
Romania will not be able to provide fiscal
stimulus to companies and will be forced to cut
public investments in 2017 in order to maximize
its chances to meet the 3% of GDP deficit target.
[fig. 5] Confidence boosted in the sectors connected to consumption…
Data source: European Commission, UniCredit Bank Research
-50
-40
-30
-20
-10
0
10
20
30
Jan-10 Jan-11 Jan-12 Jan-13 Jan-14 Jan-15 Jan-16
Confidence in industry Confidence in services
Confidence in retail Confidence in constructions
3M-moving average, balance of positive - negative answers
[fig. 6] … with these particular companies taking on more loans
Data source: NBR, UniCredit Bank Research
-10%
-5%
0%
5%
10%
15%
20%
Jan-12 Jul-12 Jan-13 Jul-13 Jan-14 Jul-14 Jan-15 Jul-15 Jan-16
Agriculture Services
Constructions Industry
Households
12M-moving average, annual growth
34. MACROECONOMIC OUTLOOK
SAS® VISUAL ANALYTICS
Picture hidden trends coming into plain sight.
eleven months). As mentioned at the
beginning of the article, the prospects of
absorption are bleak for lagger countries
if the Great Britain leaves the EU,
implying that if Romania does not
improve its framework, it will stand to
lose in front of the top absorbers during
the following years.
Cash-rich companies see little
reason for expansion for the
time being and take on
limited new credit
The very high spending at year-end was
visible in companies’ treasuries as well,
which saw their overnight deposits
expanding by 36%yoy at the end of May.
Moreover, total companies’ deposits
advanced by 18.3%yoy in May. Although
thehighexcessliquiditypushedinterbank
interest rates to new historical lows and
dragged further down customer deposits’
interest rates, this did not discourage the
saving behaviour in the economy.
Given the plentiful liquidity, companies are
not increasing their exposure to bank loans,
in spite of borrowing costs being at all-time
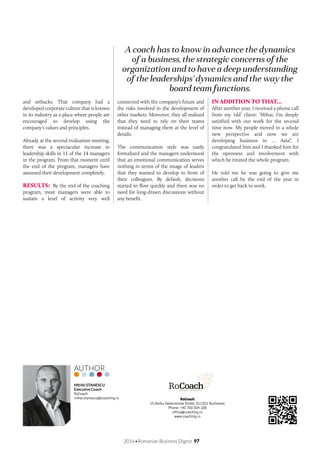
lows. However, there was a visible
improvement in the first four months of
the year, with companies’ new lending
advancingby10.4%yoytoRON10.2billion,
most of which granted in local currency
(65% of the total) [fig. 7]. Consequently, the
RON-denominated loans’ stock touched in
2016 a historical high share of 54% out of
the total credit stock. The development was
mainly supported by the sharp decline in
interest rates of RON-denominated loans,
thus reducing the differential versus FCY-
lending. While the interest rate on new
RON lending to companies was 19.51% at
the end of 2008 vs. 7.63% for FCY-
denominated lending, the two have
decreased to 4.07% and 3.12%, respectively
by April 2016.
After a negative evolution since April 2013
because of lower credit uptake and a
balancesheetclean-upperformedbybanks,
we expect the growth of companies’ loans
stock to come back in positive territory in
2016. This dynamic should also be
supported by the fact that the output gap is
closing in 3Q 2016 and companies could
try to profit as much and as fast as they can
from the increasing local demand.
In our opinion, banks could shift their
focus to SME state guarantees and
financingrelatedtoEUfunds,considering
that the funds under the First Home
programme are limited and that the
Giving-in-payment law subjects banks to
higher risks. The shift could also bring
diversification benefits, given that
households frontloaded mortgage
borrowing during the first four months of
the year in light of the uncertainties
introduced by the changing legislation.
Given the external uncertainties and the
fact that inflationary pressures remain
manageable, we expect no change to the
monetary stance. We expect inflation to
rebound above 0% in August, as the VAT
[fig. 7] New lending to companies starts to rebound…
Data source: NBR, UniCredit Bank Research
70.2
60.3
57.0
49.4
30.2
30.0
32.7
38.0
10.2
0
5
10
15
20
0
10
20
30
40
50
60
70
80
2008
2009
2010
2011
2012
2013
2014
2015
4M2016
Companies' New Lending
New Lending FCY
New Lending LCY
New Lending Interest Rate FCY (rhs)
New Lending Interest Rate LCY (rhs)
RON,bn (%)
[fig. 8] … as the low interest rate environment continues to support
demand for lending
Data source: NIS, NBR, UniCredit Bank Research
-4.0
-2.0
0.0
2.0
4.0
6.0
8.0
Jan-13 Jul-13 Jan-14 Jul-14 Jan-15 Jul-15 Jan-16 Jul-16 Jan-17 Jul-17
Consumer price inflation
Inflation target
Target range
3M ROBOR, average
Forecast
35. 2016•Romanian Business Digest 33
Banks could shift their focus to SME state
guarantees and financing related to EU funds.
cut for food products will exit the base in
mid-2016 and conclude the year around
0.1%, followed by a second jump above
1% in January 2017, when the second
VAT cut will exit the base. However, we
expect inflation to stay below the 2.5%
targeted level in 2016-2017, due to low
imported inflation benefitting from
cheap commodities, falling food prices
and weak inflation in the eurozone.
Consequently, we expect the Central
Bank to keep the policy rate on hold at
1.75% until the end of 2017, leaving
ROBOR rates at depressed levels. This
will translate into low financing costs for
the real economy, supportive for lending
and stimulating companies to continue
the gradual recovery [fig. 8].
Overall, the economic environment
supports growth, as consumption helps
shield from the negative effects of the
slowdown in global trade and the
consequences of the UK leaving the
European Union. At the same time, the
CEE region has recently performed
better than other emerging markets
due to lower sensitivity to the most
pressing problems in the world.
However, the instability of the global
context may take a toll on Romania,
even though the country is exposed
only indirectly to global risks (such as
the Chinese slowdown, the low oil
prices, the volatile financial conditions
in emerging market, the diverging US
and Eurozone economies, the refugee
crisis and the UK’s decision to leave
EU).
1) The salary increases towards the end of 2015 amounted to: 12% for personnel in local public institutions, 25% for personnel in public healthcare and social
assistance, 15% for personnel in education and 10% for all personnel in the public sector excluding healthcare.
2) The VAT rate for food products was cut to 9% as of June 2015. Separately, the general VAT rate was cut from 24% to 20% as of January 2016.
3) All the behaviours and preferences mentioned in this paragraph are according to NBR’s Survey on the access to finance of the non-financial corporations in
Romania, published in June 2016 and based on a survey undertaken in the period October 2015 – March 2016.
UniCredit Bank
1 Expozitiei Ave., District 1, 012101 Bucharest
Phone: +40 212 002 020
office@unicredit.ro
www.unicredit.ro
ANCA ARON
Senior Economist
UniCredit Bank
Contact:
anca.aron@unicredit.ro
Phone: +40 212 001 377
Mobile: +40 734 701 376
AUTHOR
36. MACROECONOMIC OUTLOOK
SAS® VISUAL ANALYTICS
Picture hidden trends coming into plain sight.
The significant decrease of new insolvencies remains relevant only in
statistical terms, and will remain so also for 2016, as long as the
financial and social impact is increasing.
Romania – The Country of
Business Paradox
A
lthough Romania is reporting one
of the fastest GDP growth within
the EU (1.6% in Q1-2016 QoQ and
4.2% YoY) amid a general stable
macroeconomic outlook, the private
business is lagging behind in terms of real
economicconvergence(lowcompetitiveness
due to modest productivity and product
quality). The mismatch between the
macroeconomic and microeconomic
frameworks is driven by the economic
growth model based on consumption
(financed through credit and triggering
imports) and external demand coming
from the EU (highly concentrated in the
automotive and chemical sector). Thus,
as compared to the developed countries
where the economic growth is internally
driven from bottom – top (industrial
production fueled by innovative capex,
increasing employment and export
growth), Romania’s economic growth
model is dependent on private
consumption (highly influenced by new
credits) and externally driven top-down
growth (‘top’ related to external demand
and weather conditions). Hence, the
external top-down growth is very fragile
(highly dependent on the external
environment) with sluggish spillover
beneficial effects on the microeconomic
level.
This is explaining much of the
microeconomic imbalances of the private
companies featured by modest payment
behavior. In this respect, the analysis of
the insolvency trends signals important
concerns related to the systemic risk in
Romania: less insolvent companies
coupled with greater financial impact,
modest entrepreneurial attitude, limited
financial education of management in
terms of credit risk management,
payment deterioration among private
companies. This is based on the following
five principal findings detailed next.
Decreasing insolvencies …
triggering higher financial
and social losses
Although new insolvencies opened in
Romania during 2015 decreased by 50%
as compared to the previous year, almost
95% of the decrease is reported among
small companies (without financials
published for three consecutive years, or
in the case any financials have been
submitted, the turnover was zero or
By Coface Romania
0
5000
10000
15000
20000
25000
2015 2014
8.Above 100 MIL EUR
7. 50-100 MIL EUR
6. 10-50 MIL EUR
5. 5-10 MIL EUR
4. 1-5 MIL EUR
3. 500K-1.000 K EUR
2. 100K-500 K EUR
1. 0-100 K EUR
Zero Turnover
No financials
Graph 1: Insolvency by turnover range
Source: Coface, Trade Register, Ministry of Finance
37. SAS® VISUAL ANALYTICS
Picture hidden trends coming into plain sight.
Among all stakeholders, the private suppliers
have supported the highest weight in total
losses (50%), followed by the credit institutions
(40%) and the state (10%).
below EUR 100 K). Therefore, we have
less insolvent companies among the small
businesses. Nevertheless, the overall
financial and social impact caused by the
insolvent companies is increasing.
Although the number of new
insolvencies dropped by half during
2015 as compared to the previous year,
the actual debt reported in the balance
sheet is almost similar, reaching RON 21
billion for the companies that went
insolvent during 2015. Under this
context, the total estimated losses for all
creditors of insolvent companies during
2015 is RON 14.3 billion (after deducting
from the debt the book value of tangible
assets), 9% above the corresponding
value in 2014. This makes the average
financial loss for every insolvent
company to increase by almost twice,
reaching RON 2.6 million in 2015, as
compared to RON 1.3 million in 2014.
Among all stakeholders, the private
suppliers have supported the highest
weight in total losses (50%), followed by
the credit institutions (40%) and the
state (10%). The higher financial impact
is also reflected in the social side, with
twice as low insolvent companies in
Table 1: Financial and Social impact of insolvencies
Indicator (figures in mil RON) 2015 2014
Number of Insolvent companies 10,170 20,170
Out of which, with financials 5,456 10,038
Total Debt for insolvent 21,213 23,426
Total Fixed assets 6,870 10,247
Debt exceeding fixed assets (loss) 14,343 13,179
Financial Impact (Loss) / company) 2.6 1.3
Number of employees 81,577 82,273
Number of employees / company 15 8
Source: Coface, Trade Register, Ministry of Finance
38. MACROECONOMIC OUTLOOK
SAS® VISUAL ANALYTICS
Picture hidden trends coming into plain sight.
2015 to report a similar number of
employees as compared to 2014 and
causing almost 82,000 jobs to be lost.
Therefore, the significant decrease of
new insolvencies remains relevant only in
statistical terms, and will remain so also
for 2016, as long as the financial and
social impact is increasing.
The process of creative
destruction … biased more
towards destruction
Theoretically, companies that cease
activity allow new entrants to substitute
and regenerate the business environment,
thus contributing to a healthier system.
Nevertheless, in practice, two variables
directly linked to this disruptive process
must be considered: the caliber of new
entrants versus the default companies
together with the ratio between the two
and the overwritten percentage. When we
observe that:
the companies that cease activity
during 2015 report an average age of 11
years, as compared to only 7 years
reported by the companies insolvent
during 2007 (we can observe the financial
crisis has made larger companies, with
more years in the business, to default);
60% of the companies that cease
activity have shareholders that are
reported to have another business in
parallel, compared to only 30% during
2007 (we observe that the financial crisis
has enhanced the ‘learning process’ of
private entrepreneurs);
for every newly registered company,
there are 2.33 companies that stop
activity, as compared to only 0.48 in 2007
(we observe that financial crisis has
discouraged the startups);
we conclude the process of business
regeneration is more destructive that
creative.
This process is causing Romania to register
the weakest position among CEE (Central
Eastern Europe) countries, after Serbia, in
terms of default rate for every 1,000 active
companiesduring2015(22.59inRomania,
as compared to the regional average of
7.38) and number of private companies for
every 1,000 inhabitants (only 23 in
Romania, as compared to the regional
average value of 57).
Most affected sectors?
The best indicator to compare sectors in
Table 2: New business registrations versus interruptions
Interruptions (OUT) 2008 2009 2010 2011 2012 2013 2014 2015
Suspensions 12,019 29,456 24,398 21,221 21,086 24,078 15,788 17,698
Dissolution 3,762 18,766 7,508 4,001 22,500 23,208 18,336 27,967
Cancellations 17,676 43,615 58,726 56,245 71,746 80,786 76,483 94,374
Insolvencies 14,483 18,421 19,650 21,499 25,842 27,924 20,170 10,170
Total Interruptions 47,940 110,258 110,282 102,966 141,174 155,996 130,823 150,209
New Registrations 144,239 116,022 119,048 130,162 125,603 124,816 101,627 113,167
Out of which SRL (IN) 100,661 56,698 48,102 62,735 61,542 60,292 56,381 64,417
Ratio OUT : IN 0.48 1.94 2.29 1.64 2.29 2.59 2.32 2.33
Source: Coface, Trade Register
Table 3: Romania versus CEE
Country
Insolvencies
2015
Insolvencies
2014
Insolvencies
2013
Total Number of
active Companies
Insolvency Rate:
1,000 Companies
Total Population
Companies to
1,000 Inhabitants
Serbia 5,180 4,773 5,029 120,852 42.86 7,146,759 17
Romania 10,170 20,170 27,924 450,286 22.59 19,947,311 23
Lithuania 1,960 1,686 1,552 99,200 19.76 2,943,472 34
Hungary 9,748 17,461 13,489 560,853 17.38 9,877,365 57
Czech 13,877 12,772 11,070 1,439,747 9.64 10,512,419 137
Croatia 1,977 2,764 3,227 263,897 7.49 4,246,809 62
Slovenia 950 1,446 999 203,542 4.67 2,061,085 99
Latvia 830 963 810 222,000 3.74 2,001,468 111
Bulgaria 592 644 834 405,812 1.46 7,245,677 56
Slovakia 446 522 507 539,089 0.83 5,415,949 100
Estonia 131 145 154 168,931 0.78 1,315,819 128
Poland 741 823 883 1,842,589 0.40 38,017,856 48
Total 46,602 64,169 66,478 6,316,798 7.38 110,731,989 57
Source: Coface Central Eastern Europe
39. SAS® VISUAL ANALYTICS
Picture hidden trends coming into plain sight.
Romania’s economic growth model is
dependent on private consumption (highly
influenced by new credits) and externally
driven top-down growth (‘top’ related to
external demand and weather conditions).
terms of default ratio would be to scale
the number of insolvencies for every
1,000 active companies. Although several
sectors are reported in top 10 by this ratio
due to the small base effect (sanitation,
post and telecommunications), some
sectors have been traditionally included
in the top default industries due to
structural problems: manufacture of
textiles (facing both cost issues due to
minimum wage increase without
reflection in productivity, and external
competition from India and China),
constructions (mostly oriented towards
low added value renovation works);
HORECA (negatively impacted by the
lack of strategic development of tourism),
food and beverage (negative impacted by
the increasing imports); wholesale and
distribution (negative impacted by the
extension strategy of large multinational
brands like Kaufland, Carrefour and Lidl).
Inappropriate cash flow
management – the principal
cause for insolvency
The assessment of the financial statements
submitted during 2008-2014 by the
companies that went insolvent in 2015
revealtheP&Lhasn’traisedmajorconcerns:
the turnover was relatively flat, whereas the
net margin had small negative values in
average. Moreover, almost one third of the
insolvent companies reported increasing
turnover coupled with higher profits.
On the other hand, the balance sheet
structure reveal major imbalances in terms
of asset liabilities horizon management,
the insolvent companies showing an
increasing propensity to allocate short term
resources to long term needs. More exactly,
during the appraised period of 2008-2014
before the default moment, the insolvent
companies have tripled the average
payment term to suppliers (increasing from
74 days in 2008 up to 235 days in 2014)
although the average period of receivables
collection has only doubled (the average
DSO increasing from 95 days in 2008 up to
181 days in 2014). The cumulated negative
result coupled with increasing commercial
debt from suppliers has fueled up the debt
ratio to unsustainable levels, reaching
almost 123% in 2014.
Therefore,6outof10insolventcompanies
have used short term financing resources
above the current assets capital needs, the
reason for this being:
60% have used the additional short
term resources to finance long term
investments
20% have used the short term
commercial credit to reimburse long
term banking loans
10% have used the extended payment
terms to suppliers to pay dividends
67
64
58
45 45
42
38 38 37 37
0
10
20
30
40
50
60
70
80
Manufacture of textiles,
clothing and footwear
Sewage and garbage removal;
sanitation and similar activities
Constructions
Hotels and restaurants
Food and beverage industry
Manufacture of chemicals and
chemical products
Wholesale and Distribution
Recreational, cultural and sporting
Post and telecommunications
Metallurgical industry
Graph 2: Insolvencies for every 1,000 active companies on sectorial level
Source: Coface
40%
36%
12%
6%
6%
60%
Positive Working Capital
Negative Working Capital
Capex Investment
Credit Reinbursement
Dividends Payment
Group Financing
Graph 3: Working Capital Management and Cash Circuit
of insolvent companies
Source: Coface
40. MACROECONOMIC OUTLOOK
38 Romanian Business Digest•2016
10% have used the commercial credit to
finance other companies within the group
The extensive use of the short term
commercial credit is visible in the overall
broad market behavior, not only in the
case of the insolvent companies. Hence,
the total commercial credit in the
domestic market has increased from
RON 168 billion in 2007 up to RON 338
billion in 2015, exceeding by almost 4
times the banking credit. Under this
context, the average DSO registered on
national level has increased from 60 days
up to 2014 days, the fastest growth being
reportedamongtheverysmallcompanies.
Increasing payment defaults
in the economy
Although the number of new insolvencies
decreased by half during 2015, the larger
financial impact propagated through the
domino contagious effect has caused the
payment behavior to further deteriorate.
Hence, the total value of default payment
instruments has increased to RON 8.5
billion in 2015, 8% higher as compared to
the previous year.
Table 4: Commercial versus Banking credit
Year
Total Banking Loans to
private companies (mil
RON)
Total Receivables of the
active companies (mil
RON)
Commercial vs Banking
Credit
2007 76,673 167,914 2.19
2008 98,851 213,071 2.16
2009 99,669 221,453 2.22
2010 107,194 248,883 2.32
2011 118,781 268,783 2.26
2012 121,376 296,315 2.44
2013 115,218 293,871 2.55
2014 109,047 321,480 2.95
2015 110,886 337,554 3.04
Source: Coface, National Bank of Romania
Table 5: Default Payments
Year
Total Value of Default
Payment Instruments
(K RON)
Number of default
incidents
Average value of
default instrument
(K RON)
Value Growth Number Growth
2008 4,446,160 294,227 15
2009 9,421,824 493,503 19 112% 68%
2010 9,569,554 354,060 27 2% -28%
2011 6,341,525 233,451 27 -34% -34%
2012 8,628,886 186,071 46 36% -20%
2013 9,531,019 157,906 60 10% -15%
2014 7,944,268 115,114 69 -17% -27%
2015 8,545,476 87,269 98 8% -24%
Source: Coface, National Bank of Romania
IANCU GUDA
Services Director
Coface Romania
iancu.guda@coface.com
AUTHORS
Coface Romania
39 Floreasca Ave., 4th Floor, District 1
014453 Bucharest
Phone: +40 212 316 020, Fax: +40 212 316 022
comunicare-romania@coface.com
www.coface.ro