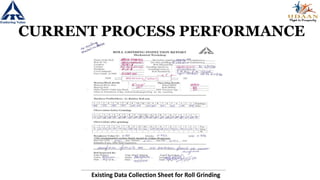
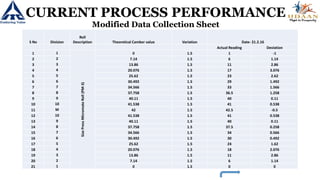
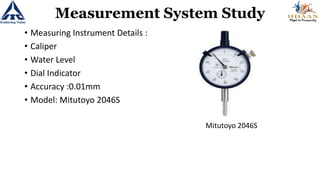
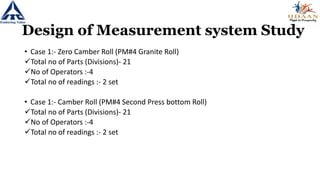
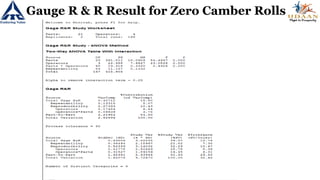
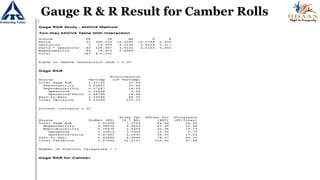
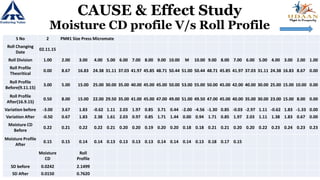
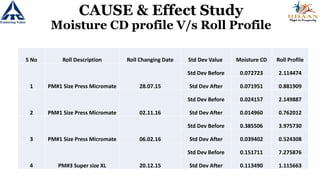
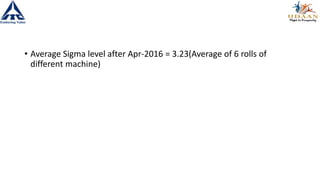
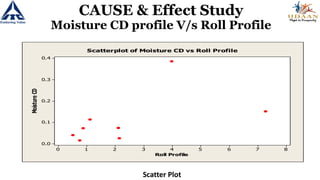
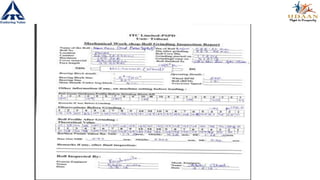
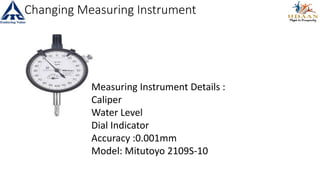
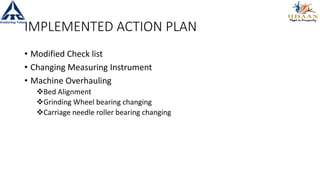
Cp, Cpk Improvement of Roll Crowning
Date:05.08.2016
Detail Of Roll Grinding Machine
Head Stock
Traverse
Cover
Camber
Mechanism
Wheel
Wheel
Motor
Carriage
Roll
Support
Roll
PROJECT SELECTION
Business Case
Problem Statement
Objective
Scope
Benefits
Process Overview
PROJECT CHARTER
General Information
Project Name:
Improvement in Cp, Cpk of Roll Crowning
Project No:
Project Location: Tribeni
Business Case: Reduction in variation of roll profile to avoid non uniform nip loading, nip width & mositure CD
profile in order to maintain product quality.
Project Details
Problem Statement: Profile variation of camber rolls leads to uneven Nip width of press/size rolls, which leads to moisture profile
variation in CD & paper break in the machine.
Goal/Objective: To improve roll crowning from existing level of 2.25 sigma rating (22.5% defects) to 2.65 sigma rating (12%
defects)
Project Scope:Paper Machine Roll
Project Constraints: Existing machine capability.
PROJECT CHARTER
Resources
Sr. No. Name Role in the Project Signature
1 Mohamed Tariq Aziz
Adherence to Timelines & DMAIC methodology and conducting regular meetings, analysis,
Idea generation
Technical inputs, statistical analysis of data, idea evaluation and implementation.
2 Navin Kumar
3 Abhi Ghosh
Baseline for Project
Project Metric(s)/ KPI name: Defects (Roll Profile Reading outside Acceptable range)
Project Metric(s)/ KPI Value at start: Present Defect-22.5%
Criteria for selecting Baseline value: Based on roll profile variation as per Last two years available data
PROJECT CHARTER
Benefits
Bottom line Savings Rs 153523 /- Per Year
Other benefits
1.Improvement in paper qualities
(Controlled Moisture In CD Profile)
2. Reduction in frequency of Roll
Changing
SIPOC Map
SUPPLIER CUSTOMERINPUT PROCESS OUTPUT
ROLL
GRINDING
CROWNED
ROLL
ROLL
Norton
Grindwell
PAPER
MACHINE
DOCUMENTS
PAPER
MACHINE
POWER
GRINDING WHEEL
BEARING
COOLANT
BEARING BRACKET
FIXTURES
FILTER PAPER
SKILL OF OPERATOR
DRIVE SYSTEM
ALIGNMENT
CAMBER MECHANISM
MEASURING INSTRUMENT
Roll Grinding process
Check surface of
bare roll
Changing
Grinding wheel
Bearing/bracket
fixing
Check limit
switches and
other parameters
Roll loading &
coupling in
Grinding m/c
To decide
Speed of Roll,
Wheel and
Traverse
direction
Required camber
setting
Roll face
alignment wrt
m/c bed
Roll surface
checking
before grinding
Feed cut &
Ammeter range
Repeat grinding
process
Reading of roll
surface with
regular
intervals
Dressing of
grinding wheel(if
required)
Final reading to
check with
allowable
tolerance
Unloading of
roll
PROJECT ANALYSIS
• Data Collection Plan
• Data Analysis
• Current Process Parameters Performance (Standard deviation,
Process capability, Sigma Rating)
• Measurement System Study (Gauge R & R)
• Cause & Effect Analysis (Scatter Plot)
DATA COLLECTION & STUDY
Current Process
Performance
Cause & Effect
Study
Measure
ment
System
Study
CURRENT PROCESS PERFORMANCE
Theoretical Camber value for Rolls- Cos 70 curve
CURRENT PROCESS PERFORMANCE
Existing Data Collection Sheet for Roll Grinding
CURRENT PROCESS PERFORMANCE
Modified Data Collection Sheet
S No Divison
Roll
Description
Theoretical Camber
value
Acceptable
Range
1 1
PM1MicroRock
0.00 1.5
2 2 0.00 1.5
3 3 0.00 1.5
4 4 0.00 1.5
5 5 0.00 1.5
6 6 0.00 1.5
7 7 0.00 1.5
8 8 0.00 1.5
9 9 0.00 1.5
10 10 0.00 1.5
11 M 0.00 1.5
12 10 0.00 1.5
13 9 0.00 1.5
14 8 0.00 1.5
15 7 0.00 1.5
16 6 0.00 1.5
17 5 0.00 1.5
18 4 0.00 1.5
19 3 0.00 1.5
20 2 0.00 1.5
21 1 0.00 1.5
S No Divison
Roll
Description
Therotical
Camber value
Acceptable
Range
1 1
SizePressMicromate(Swing)Roll(PM-1)
0 1.5
2 2 8.67 1.5
3 3 16.83 1.5
4 4 24.378 1.5
5 5 31.11 1.5
6 6 37.026 1.5
7 7 41.973 1.5
8 8 45.849 1.5
9 9 48.705 1.5
10 10 50.439 1.5
11 M 51 1.5
12 10 50.439 1.5
13 9 48.705 1.5
14 8 45.849 1.5
15 7 41.973 1.5
16 6 37.026 1.5
17 5 31.11 1.5
18 4 24.378 1.5
19 3 16.83 1.5
20 2 8.67 1.5
21 1 0 1.5
S No Division
Roll
Description Theoretical Camber value Variation Date- 21.2.16
Actual Reading Deviation
1 1
SizePressMicromateRoll(PM-3)
0 1.5 1 -1
2 2 7.14 1.5 6 1.14
3 3 13.86 1.5 11 2.86
4 4 20.076 1.5 17 3.076
5 5 25.62 1.5 23 2.62
6 6 30.492 1.5 29 1.492
7 7 34.566 1.5 33 1.566
8 8 37.758 1.5 36.5 1.258
9 9 40.11 1.5 40 0.11
10 10 41.538 1.5 41 0.538
11 M 42 1.5 42.5 -0.5
12 10 41.538 1.5 41 0.538
13 9 40.11 1.5 40 0.11
14 8 37.758 1.5 37.5 0.258
15 7 34.566 1.5 34 0.566
16 6 30.492 1.5 30 0.492
17 5 25.62 1.5 24 1.62
18 4 20.076 1.5 18 2.076
19 3 13.86 1.5 11 2.86
20 2 7.14 1.5 6 1.14
21 1 0 1.5 0 0
CURRENT PROCESS PERFORMANCE
Modified Data Collection Sheet
CURRENT PROCESS PERFORMANCE
Std Deviation , Sigma Rating, Process Capability
S No Profile Name Of Roll Cover Material Location SD Cp Sigma
Rating
1 Zero Micro rock Micro Rock PM1 0.922 0.542 2.76
2 Zero Marking Press Ventsura II PM1 1.034 0.322 2.06
3 Zero SCC Elaplast Neo Silk PM3 0.900 0.555 2.97
4 Zero Micro Rock(Post Rebuilt) Micro Rock PM3 0.567 0.880 3
5 Zero Elaplast Roll Neo Silk PM4 0.768 0.433 2.75
6 Camber Micro Rock(Pre Rebuilt) Micro Rock PM3 1.544 0.323 2.25
7 Camber Super Size XL PM3 1.521 0.328 2.16
8 Camber Micro mate Micro Mate PM3 1.521 0.328 1.93
9 Camber Micro Mate Micro Mate PM1 1.625 0.307 2.29
10 Camber 2nd Press Top Aquawell PM1 2.974 0.168 1.55
11 Camber 2nd Press Bottom Hard Rubber PM4 3.271 0.102 1.11
Crown:-Avg Cp -0.228 & Sigma Rating-1.9 Plain Roll:- Avg Cp- 0.559 & Sigma Rating-2.7
Measurement System Study
• Measuring Instrument Details :
• Caliper
• Water Level
• Dial Indicator
• Accuracy :0.01mm
• Model: Mitutoyo 2046S
Mitutoyo 2046S
Design of Measurement system Study
• Case 1:- Zero Camber Roll (PM#4 Granite Roll)
Total no of Parts (Divisions)- 21
No of Operators :-4
Total no of readings :- 2 set
• Case 1:- Camber Roll (PM#4 Second Press bottom Roll)
Total no of Parts (Divisions)- 21
No of Operators :-4
Total no of readings :- 2 set
Measurement System Study-Data Collection
Name:- KD1
DS Actual Reading NDS
1 2 3 4 5 6 7 8 9 10 M 10 9 8 7 6 5 4 3 2 1
Theoritical
Value 0.00 14.96 29.04 42.06 53.68 63.89 72.42 79.11 84.04 87.03 88.00 87.03 84.04 79.11 72.42 63.89 53.68 42.06 29.04 14.96 0.00
Actual Value 0.00 14.75 28.00 41.00 51.75 61.00 70.00 76.00 81.00 84.00 85.00 84.00 80.50 75.50 69.00 61.00 51.25 41.00 30.00 16.00 0.50
Variation 0.00 0.21 1.04 1.06 1.93 2.89 2.42 3.11 3.04 3.03 3.00 3.03 3.54 3.61 3.42 2.89 2.43 1.06 -0.96 -1.04 -0.50
Name:- SC1
DS Actual Reading NDS
1 2 3 4 5 6 7 8 9 10 M 10 9 8 7 6 5 4 3 2 1
Theoritical
Value 0.00 14.96 29.04 42.06 53.68 63.89 72.42 79.11 84.04 87.03 88.00 87.03 84.04 79.11 72.42 63.89 53.68 42.06 29.04 14.96 0.00
Actual Value 0.00 15.00 27.00 39.00 50.50 60.00 68.00 75.00 80.00 82.50 83.50 82.00 79.00 74.00 67.50 59.50 51.00 40.00 29.00 15.00 0.00
Variation 0.00 -0.04 2.04 3.06 3.18 3.89 4.42 4.11 4.04 4.53 4.50 5.03 5.04 5.11 4.92 4.39 2.68 2.06 0.04 -0.04 0.00
Name:- MG1
DS Actual Reading NDS
1 2 3 4 5 6 7 8 9 10 M 10 9 8 7 6 5 4 3 2 1
Theoritical
Value 0.00 14.96 29.04 42.06 53.68 63.89 72.42 79.11 84.04 87.03 88.00 87.03 84.04 79.11 72.42 63.89 53.68 42.06 29.04 14.96 0.00
Actual Value 0.00 15.00 28.00 40.25 51.00 62.00 70.00 76.00 81.00 83.00 83.50 82.00 78.00 72.00 65.00 56.00 47.00 36.00 23.00 11.00 -1.00
Variation 0.00 -0.04 1.04 1.81 2.68 1.89 2.42 3.11 3.04 4.03 4.50 5.03 6.04 7.11 7.42 7.89 6.68 6.06 6.04 3.96 1.00
Name:- SD1
DS Actual Reading NDS
1 2 3 4 5 6 7 8 9 10 M 10 9 8 7 6 5 4 3 2 1
Theoritical
Value 0.00 14.96 29.04 42.06 53.68 63.89 72.42 79.11 84.04 87.03 88.00 87.03 84.04 79.11 72.42 63.89 53.68 42.06 29.04 14.96 0.00
Actual Value 0.00 15.00 28.00 40.00 51.00 61.00 69.00 75.00 80.50 83.00 83.75 82.25 82.25 73.50 67.50 60.00 50.00 40.50 26.00 11.00 0.00
Variation 0.00 -0.04 1.04 2.06 2.68 2.89 3.42 4.11 3.54 4.03 4.25 4.78 1.79 5.61 4.92 3.89 3.68 1.56 3.04 3.96 0.00
Gauge R & R Result for Zero Camber Rolls
Gauge R & R Result for Camber Rolls
CAUSE & Effect Study
Moisture CD profile V/s Roll Profile
S No 2 PM#1 Size Press Micromate
Roll Changing
Date
02.11.15
Roll Division 1.00 2.00 3.00 4.00 5.00 6.00 7.00 8.00 9.00 10.00 M 10.00 9.00 8.00 7.00 6.00 5.00 4.00 3.00 2.00 1.00
Roll Profile
Theoritical
0.00 8.67 16.83 24.38 31.11 37.03 41.97 45.85 48.71 50.44 51.00 50.44 48.71 45.85 41.97 37.03 31.11 24.38 16.83 8.67 0.00
Roll Profile
Before(9.11.15)
3.00 5.00 15.00 25.00 30.00 35.00 40.00 45.00 45.00 50.00 53.00 55.00 50.00 45.00 42.00 40.00 30.00 25.00 15.00 10.00 0.00
Roll Profile
After(16.9.15)
0.50 8.00 15.00 22.00 29.50 35.00 41.00 45.00 47.00 49.00 51.00 49.50 47.00 45.00 40.00 35.00 30.00 23.00 15.00 8.00 0.00
Variation before -3.00 3.67 1.83 -0.62 1.11 2.03 1.97 0.85 3.71 0.44 -2.00 -4.56 -1.30 0.85 -0.03 -2.97 1.11 -0.62 1.83 -1.33 0.00
Variation After -0.50 0.67 1.83 2.38 1.61 2.03 0.97 0.85 1.71 1.44 0.00 0.94 1.71 0.85 1.97 2.03 1.11 1.38 1.83 0.67 0.00
Moisture CD
Before
0.22 0.21 0.22 0.22 0.21 0.20 0.20 0.19 0.20 0.20 0.18 0.18 0.21 0.21 0.20 0.20 0.22 0.23 0.24 0.23 0.23
Moisture Profile
After
0.15 0.15 0.14 0.14 0.13 0.13 0.13 0.13 0.14 0.14 0.14 0.13 0.18 0.17 0.15
Moisture
CD
Roll
Profile
SD before 0.0242 2.1499
SD After 0.0150 0.7620
S No Roll Description Roll Changing Date Std Dev Value Moisture CD Roll Profile
1 PM#1 Size Press Micromate 28.07.15
Std Dev Before 0.072723 2.114474
Std Dev After 0.071951 0.881909
2 PM#1 Size Press Micromate 02.11.16
Std Dev Before 0.024157 2.149887
Std Dev After 0.014960 0.762012
3 PM#1 Size Press Micromate 06.02.16
Std Dev Before 0.385506 3.975730
Std Dev After 0.039402 0.524308
4 PM#3 Super size XL 20.12.15
Std Dev Before 0.151711 7.275876
Std Dev After 0.113490 1.115663
CAUSE & Effect Study
Moisture CD profile V/s Roll Profile
• Average Sigma level after Apr-2016 = 3.23(Average of 6 rolls of
different machine)
876543210
0.4
0.3
0.2
0.1
0.0
Roll Profile
MoistureCD
Scatterplot of Moisture CD vs Roll Profile
Scatter Plot
CAUSE & Effect Study
Moisture CD profile V/s Roll Profile
• Based on Collected Data Analysis
• Target Setting
• Action Plan
IMPROVEMENT PLAN
PROPOSED ACTION PLAN
• Modified Check list
• Changing Measuring Instrument
• Workforce Training
• Machine Overhauling
Modified Checklist
S No Divison Roll Description Therotical Camber value Acceptable Range Date:-3.6.16
Divisons Actual Reading Deviation
1 1
PM#12ndPressTopRoll
0 1.5 1 1.00
2 2 28.05 29 0.95
3 3 54.45 55 0.55
4 4 78.87 78 -0.87
5 5 100.65 100 -0.65
6 6 119.79 119 -0.79
7 7 135.795 135 -0.79
8 8 148.335 148 -0.34
9 9 157.575 157 -0.57
10 10 163.185 163 -0.19
11 M 165 166 1.00
12 10 163.185 163 -0.19
13 9 157.575 157 -0.57
14 8 148.335 148 -0.34
15 7 135.795 135 -0.79
16 6 119.79 119 -0.79
17 5 100.65 100 -0.65
18 4 78.87 78 -0.87
19 3 54.45 54 -0.45
20 2 28.05 28 -0.05
21 1 0 0 0.00
Variance 0.44
Std Dev 0.66
Var 0.44
SD 0.66
Cp 0.75
DPMO 0
Sigma Rating 3
Changing Measuring Instrument
Measuring Instrument Details :
Caliper
Water Level
Dial Indicator
Accuracy :0.001mm
Model: Mitutoyo 2109S-10
IMPLEMENTED ACTION PLAN
• Modified Check list
• Changing Measuring Instrument
• Machine Overhauling
Bed Alignment
Grinding Wheel bearing changing
Carriage needle roller bearing changing
PROCESS PERFORMANCE AFTER
IMPROVEMENT ACTION
Crown:-Avg Cp -0.53 & Sigma Rating-2.57 Plain Roll:- Avg Cp- 0.68 & Sigma Rating-2.7
S No Profile Name Of Roll Cover Material Location SD Cp Sigma
Rating
1 Zero SCC Elaplast CI PM4 0.900 0.35 2.97
2 Zero Elaplast Roll Neo Silk PM4 0.25 1.33 4
3 Zero Micro Rock Micro Rock PM3 1.37 0.36 2.01
4 Camber 2nd Press Top Aquawell PM1 0.94 0.53 2.57
Roll grinding Six Sigma project

Roll grinding Six Sigma project

  • 1.
    Cp, Cpk Improvementof Roll Crowning Date:05.08.2016
  • 2.
    Detail Of RollGrinding Machine Head Stock Traverse Cover Camber Mechanism Wheel Wheel Motor Carriage Roll Support Roll
  • 3.
    PROJECT SELECTION Business Case ProblemStatement Objective Scope Benefits Process Overview
  • 4.
    PROJECT CHARTER General Information ProjectName: Improvement in Cp, Cpk of Roll Crowning Project No: Project Location: Tribeni Business Case: Reduction in variation of roll profile to avoid non uniform nip loading, nip width & mositure CD profile in order to maintain product quality. Project Details Problem Statement: Profile variation of camber rolls leads to uneven Nip width of press/size rolls, which leads to moisture profile variation in CD & paper break in the machine. Goal/Objective: To improve roll crowning from existing level of 2.25 sigma rating (22.5% defects) to 2.65 sigma rating (12% defects) Project Scope:Paper Machine Roll Project Constraints: Existing machine capability.
  • 5.
    PROJECT CHARTER Resources Sr. No.Name Role in the Project Signature 1 Mohamed Tariq Aziz Adherence to Timelines & DMAIC methodology and conducting regular meetings, analysis, Idea generation Technical inputs, statistical analysis of data, idea evaluation and implementation. 2 Navin Kumar 3 Abhi Ghosh Baseline for Project Project Metric(s)/ KPI name: Defects (Roll Profile Reading outside Acceptable range) Project Metric(s)/ KPI Value at start: Present Defect-22.5% Criteria for selecting Baseline value: Based on roll profile variation as per Last two years available data
  • 6.
    PROJECT CHARTER Benefits Bottom lineSavings Rs 153523 /- Per Year Other benefits 1.Improvement in paper qualities (Controlled Moisture In CD Profile) 2. Reduction in frequency of Roll Changing
  • 7.
    SIPOC Map SUPPLIER CUSTOMERINPUTPROCESS OUTPUT ROLL GRINDING CROWNED ROLL ROLL Norton Grindwell PAPER MACHINE DOCUMENTS PAPER MACHINE POWER GRINDING WHEEL BEARING COOLANT BEARING BRACKET FIXTURES FILTER PAPER SKILL OF OPERATOR DRIVE SYSTEM ALIGNMENT CAMBER MECHANISM MEASURING INSTRUMENT
  • 8.
    Roll Grinding process Checksurface of bare roll Changing Grinding wheel Bearing/bracket fixing Check limit switches and other parameters Roll loading & coupling in Grinding m/c To decide Speed of Roll, Wheel and Traverse direction Required camber setting Roll face alignment wrt m/c bed Roll surface checking before grinding Feed cut & Ammeter range Repeat grinding process Reading of roll surface with regular intervals Dressing of grinding wheel(if required) Final reading to check with allowable tolerance Unloading of roll
  • 9.
    PROJECT ANALYSIS • DataCollection Plan • Data Analysis • Current Process Parameters Performance (Standard deviation, Process capability, Sigma Rating) • Measurement System Study (Gauge R & R) • Cause & Effect Analysis (Scatter Plot)
  • 10.
    DATA COLLECTION &STUDY Current Process Performance Cause & Effect Study Measure ment System Study
  • 11.
    CURRENT PROCESS PERFORMANCE TheoreticalCamber value for Rolls- Cos 70 curve
  • 12.
    CURRENT PROCESS PERFORMANCE ExistingData Collection Sheet for Roll Grinding
  • 13.
    CURRENT PROCESS PERFORMANCE ModifiedData Collection Sheet S No Divison Roll Description Theoretical Camber value Acceptable Range 1 1 PM1MicroRock 0.00 1.5 2 2 0.00 1.5 3 3 0.00 1.5 4 4 0.00 1.5 5 5 0.00 1.5 6 6 0.00 1.5 7 7 0.00 1.5 8 8 0.00 1.5 9 9 0.00 1.5 10 10 0.00 1.5 11 M 0.00 1.5 12 10 0.00 1.5 13 9 0.00 1.5 14 8 0.00 1.5 15 7 0.00 1.5 16 6 0.00 1.5 17 5 0.00 1.5 18 4 0.00 1.5 19 3 0.00 1.5 20 2 0.00 1.5 21 1 0.00 1.5 S No Divison Roll Description Therotical Camber value Acceptable Range 1 1 SizePressMicromate(Swing)Roll(PM-1) 0 1.5 2 2 8.67 1.5 3 3 16.83 1.5 4 4 24.378 1.5 5 5 31.11 1.5 6 6 37.026 1.5 7 7 41.973 1.5 8 8 45.849 1.5 9 9 48.705 1.5 10 10 50.439 1.5 11 M 51 1.5 12 10 50.439 1.5 13 9 48.705 1.5 14 8 45.849 1.5 15 7 41.973 1.5 16 6 37.026 1.5 17 5 31.11 1.5 18 4 24.378 1.5 19 3 16.83 1.5 20 2 8.67 1.5 21 1 0 1.5
  • 14.
    S No Division Roll DescriptionTheoretical Camber value Variation Date- 21.2.16 Actual Reading Deviation 1 1 SizePressMicromateRoll(PM-3) 0 1.5 1 -1 2 2 7.14 1.5 6 1.14 3 3 13.86 1.5 11 2.86 4 4 20.076 1.5 17 3.076 5 5 25.62 1.5 23 2.62 6 6 30.492 1.5 29 1.492 7 7 34.566 1.5 33 1.566 8 8 37.758 1.5 36.5 1.258 9 9 40.11 1.5 40 0.11 10 10 41.538 1.5 41 0.538 11 M 42 1.5 42.5 -0.5 12 10 41.538 1.5 41 0.538 13 9 40.11 1.5 40 0.11 14 8 37.758 1.5 37.5 0.258 15 7 34.566 1.5 34 0.566 16 6 30.492 1.5 30 0.492 17 5 25.62 1.5 24 1.62 18 4 20.076 1.5 18 2.076 19 3 13.86 1.5 11 2.86 20 2 7.14 1.5 6 1.14 21 1 0 1.5 0 0 CURRENT PROCESS PERFORMANCE Modified Data Collection Sheet
  • 15.
    CURRENT PROCESS PERFORMANCE StdDeviation , Sigma Rating, Process Capability S No Profile Name Of Roll Cover Material Location SD Cp Sigma Rating 1 Zero Micro rock Micro Rock PM1 0.922 0.542 2.76 2 Zero Marking Press Ventsura II PM1 1.034 0.322 2.06 3 Zero SCC Elaplast Neo Silk PM3 0.900 0.555 2.97 4 Zero Micro Rock(Post Rebuilt) Micro Rock PM3 0.567 0.880 3 5 Zero Elaplast Roll Neo Silk PM4 0.768 0.433 2.75 6 Camber Micro Rock(Pre Rebuilt) Micro Rock PM3 1.544 0.323 2.25 7 Camber Super Size XL PM3 1.521 0.328 2.16 8 Camber Micro mate Micro Mate PM3 1.521 0.328 1.93 9 Camber Micro Mate Micro Mate PM1 1.625 0.307 2.29 10 Camber 2nd Press Top Aquawell PM1 2.974 0.168 1.55 11 Camber 2nd Press Bottom Hard Rubber PM4 3.271 0.102 1.11 Crown:-Avg Cp -0.228 & Sigma Rating-1.9 Plain Roll:- Avg Cp- 0.559 & Sigma Rating-2.7
  • 16.
    Measurement System Study •Measuring Instrument Details : • Caliper • Water Level • Dial Indicator • Accuracy :0.01mm • Model: Mitutoyo 2046S Mitutoyo 2046S
  • 17.
    Design of Measurementsystem Study • Case 1:- Zero Camber Roll (PM#4 Granite Roll) Total no of Parts (Divisions)- 21 No of Operators :-4 Total no of readings :- 2 set • Case 1:- Camber Roll (PM#4 Second Press bottom Roll) Total no of Parts (Divisions)- 21 No of Operators :-4 Total no of readings :- 2 set
  • 18.
    Measurement System Study-DataCollection Name:- KD1 DS Actual Reading NDS 1 2 3 4 5 6 7 8 9 10 M 10 9 8 7 6 5 4 3 2 1 Theoritical Value 0.00 14.96 29.04 42.06 53.68 63.89 72.42 79.11 84.04 87.03 88.00 87.03 84.04 79.11 72.42 63.89 53.68 42.06 29.04 14.96 0.00 Actual Value 0.00 14.75 28.00 41.00 51.75 61.00 70.00 76.00 81.00 84.00 85.00 84.00 80.50 75.50 69.00 61.00 51.25 41.00 30.00 16.00 0.50 Variation 0.00 0.21 1.04 1.06 1.93 2.89 2.42 3.11 3.04 3.03 3.00 3.03 3.54 3.61 3.42 2.89 2.43 1.06 -0.96 -1.04 -0.50 Name:- SC1 DS Actual Reading NDS 1 2 3 4 5 6 7 8 9 10 M 10 9 8 7 6 5 4 3 2 1 Theoritical Value 0.00 14.96 29.04 42.06 53.68 63.89 72.42 79.11 84.04 87.03 88.00 87.03 84.04 79.11 72.42 63.89 53.68 42.06 29.04 14.96 0.00 Actual Value 0.00 15.00 27.00 39.00 50.50 60.00 68.00 75.00 80.00 82.50 83.50 82.00 79.00 74.00 67.50 59.50 51.00 40.00 29.00 15.00 0.00 Variation 0.00 -0.04 2.04 3.06 3.18 3.89 4.42 4.11 4.04 4.53 4.50 5.03 5.04 5.11 4.92 4.39 2.68 2.06 0.04 -0.04 0.00 Name:- MG1 DS Actual Reading NDS 1 2 3 4 5 6 7 8 9 10 M 10 9 8 7 6 5 4 3 2 1 Theoritical Value 0.00 14.96 29.04 42.06 53.68 63.89 72.42 79.11 84.04 87.03 88.00 87.03 84.04 79.11 72.42 63.89 53.68 42.06 29.04 14.96 0.00 Actual Value 0.00 15.00 28.00 40.25 51.00 62.00 70.00 76.00 81.00 83.00 83.50 82.00 78.00 72.00 65.00 56.00 47.00 36.00 23.00 11.00 -1.00 Variation 0.00 -0.04 1.04 1.81 2.68 1.89 2.42 3.11 3.04 4.03 4.50 5.03 6.04 7.11 7.42 7.89 6.68 6.06 6.04 3.96 1.00 Name:- SD1 DS Actual Reading NDS 1 2 3 4 5 6 7 8 9 10 M 10 9 8 7 6 5 4 3 2 1 Theoritical Value 0.00 14.96 29.04 42.06 53.68 63.89 72.42 79.11 84.04 87.03 88.00 87.03 84.04 79.11 72.42 63.89 53.68 42.06 29.04 14.96 0.00 Actual Value 0.00 15.00 28.00 40.00 51.00 61.00 69.00 75.00 80.50 83.00 83.75 82.25 82.25 73.50 67.50 60.00 50.00 40.50 26.00 11.00 0.00 Variation 0.00 -0.04 1.04 2.06 2.68 2.89 3.42 4.11 3.54 4.03 4.25 4.78 1.79 5.61 4.92 3.89 3.68 1.56 3.04 3.96 0.00
  • 19.
    Gauge R &R Result for Zero Camber Rolls
  • 20.
    Gauge R &R Result for Zero Camber Rolls
  • 21.
    Gauge R &R Result for Camber Rolls
  • 22.
    Gauge R &R Result for Camber Rolls
  • 23.
    CAUSE & EffectStudy Moisture CD profile V/s Roll Profile S No 2 PM#1 Size Press Micromate Roll Changing Date 02.11.15 Roll Division 1.00 2.00 3.00 4.00 5.00 6.00 7.00 8.00 9.00 10.00 M 10.00 9.00 8.00 7.00 6.00 5.00 4.00 3.00 2.00 1.00 Roll Profile Theoritical 0.00 8.67 16.83 24.38 31.11 37.03 41.97 45.85 48.71 50.44 51.00 50.44 48.71 45.85 41.97 37.03 31.11 24.38 16.83 8.67 0.00 Roll Profile Before(9.11.15) 3.00 5.00 15.00 25.00 30.00 35.00 40.00 45.00 45.00 50.00 53.00 55.00 50.00 45.00 42.00 40.00 30.00 25.00 15.00 10.00 0.00 Roll Profile After(16.9.15) 0.50 8.00 15.00 22.00 29.50 35.00 41.00 45.00 47.00 49.00 51.00 49.50 47.00 45.00 40.00 35.00 30.00 23.00 15.00 8.00 0.00 Variation before -3.00 3.67 1.83 -0.62 1.11 2.03 1.97 0.85 3.71 0.44 -2.00 -4.56 -1.30 0.85 -0.03 -2.97 1.11 -0.62 1.83 -1.33 0.00 Variation After -0.50 0.67 1.83 2.38 1.61 2.03 0.97 0.85 1.71 1.44 0.00 0.94 1.71 0.85 1.97 2.03 1.11 1.38 1.83 0.67 0.00 Moisture CD Before 0.22 0.21 0.22 0.22 0.21 0.20 0.20 0.19 0.20 0.20 0.18 0.18 0.21 0.21 0.20 0.20 0.22 0.23 0.24 0.23 0.23 Moisture Profile After 0.15 0.15 0.14 0.14 0.13 0.13 0.13 0.13 0.14 0.14 0.14 0.13 0.18 0.17 0.15 Moisture CD Roll Profile SD before 0.0242 2.1499 SD After 0.0150 0.7620
  • 24.
    S No RollDescription Roll Changing Date Std Dev Value Moisture CD Roll Profile 1 PM#1 Size Press Micromate 28.07.15 Std Dev Before 0.072723 2.114474 Std Dev After 0.071951 0.881909 2 PM#1 Size Press Micromate 02.11.16 Std Dev Before 0.024157 2.149887 Std Dev After 0.014960 0.762012 3 PM#1 Size Press Micromate 06.02.16 Std Dev Before 0.385506 3.975730 Std Dev After 0.039402 0.524308 4 PM#3 Super size XL 20.12.15 Std Dev Before 0.151711 7.275876 Std Dev After 0.113490 1.115663 CAUSE & Effect Study Moisture CD profile V/s Roll Profile
  • 25.
    • Average Sigmalevel after Apr-2016 = 3.23(Average of 6 rolls of different machine)
  • 26.
    876543210 0.4 0.3 0.2 0.1 0.0 Roll Profile MoistureCD Scatterplot ofMoisture CD vs Roll Profile Scatter Plot CAUSE & Effect Study Moisture CD profile V/s Roll Profile
  • 27.
    • Based onCollected Data Analysis • Target Setting • Action Plan IMPROVEMENT PLAN
  • 28.
    PROPOSED ACTION PLAN •Modified Check list • Changing Measuring Instrument • Workforce Training • Machine Overhauling
  • 29.
    Modified Checklist S NoDivison Roll Description Therotical Camber value Acceptable Range Date:-3.6.16 Divisons Actual Reading Deviation 1 1 PM#12ndPressTopRoll 0 1.5 1 1.00 2 2 28.05 29 0.95 3 3 54.45 55 0.55 4 4 78.87 78 -0.87 5 5 100.65 100 -0.65 6 6 119.79 119 -0.79 7 7 135.795 135 -0.79 8 8 148.335 148 -0.34 9 9 157.575 157 -0.57 10 10 163.185 163 -0.19 11 M 165 166 1.00 12 10 163.185 163 -0.19 13 9 157.575 157 -0.57 14 8 148.335 148 -0.34 15 7 135.795 135 -0.79 16 6 119.79 119 -0.79 17 5 100.65 100 -0.65 18 4 78.87 78 -0.87 19 3 54.45 54 -0.45 20 2 28.05 28 -0.05 21 1 0 0 0.00 Variance 0.44 Std Dev 0.66 Var 0.44 SD 0.66 Cp 0.75 DPMO 0 Sigma Rating 3
  • 31.
    Changing Measuring Instrument MeasuringInstrument Details : Caliper Water Level Dial Indicator Accuracy :0.001mm Model: Mitutoyo 2109S-10
  • 32.
    IMPLEMENTED ACTION PLAN •Modified Check list • Changing Measuring Instrument • Machine Overhauling Bed Alignment Grinding Wheel bearing changing Carriage needle roller bearing changing
  • 33.
    PROCESS PERFORMANCE AFTER IMPROVEMENTACTION Crown:-Avg Cp -0.53 & Sigma Rating-2.57 Plain Roll:- Avg Cp- 0.68 & Sigma Rating-2.7 S No Profile Name Of Roll Cover Material Location SD Cp Sigma Rating 1 Zero SCC Elaplast CI PM4 0.900 0.35 2.97 2 Zero Elaplast Roll Neo Silk PM4 0.25 1.33 4 3 Zero Micro Rock Micro Rock PM3 1.37 0.36 2.01 4 Camber 2nd Press Top Aquawell PM1 0.94 0.53 2.57