The primary productivity of phytoplankton, macroalgae, and seagrasses forms the base of marine ecosystem structuring in aquatic environments. Primary productivity is affected by various environmental factors and ecological processes that usually interact in a complex manner. The rate of primary production usually governs the overall ecosystem health and ecological productivity of a water body, and any observed trends may reveal the occurrence of potential stresses on existing ecosystems. Along the Saudi Gulf coast, primary productivity monitoring may help provide the basis for identifying the potential stressors to the coastal marine environments. Foremost among the considerations is the potential adverse effect of excessive anthropogenic nutrient loadings, which may lead to eutrophication events that can adversely impact on ecosystem health. In addition, high nutrient loads from man-made activities may trigger the excessive growth of some toxic phytoplankton species, potentially resulting in harmful algal blooms (HABs) with serious human health risks and negative economic impacts.
This study is geared towards monitoring the primary productivity levels in selected areas of the Saudi Gulf waters to identify areas of concern as regards hyper-nutrification, ecological disturbance, and potential hot spots for HAB events. Nutrient loadings and the identification of potential HAB organisms will form a special focus of the investigations.
Assessment of the Plankton Biodiversity, Bay of Bengal, Cox's Bazar, BangladeshAbuMusa51
I am Abu Musa. This is my Internship Presentation. This is for partial fulfillment of the 4th-year final examination of the Department of Fisheries, University of Dhaka. This is based on my findings from one month of research on the Coxs Bazar coast. The research is done in the live feed lab of BFRI Cox's Bazar.
SOLVENT EXTRACTION AND ADSORPTION TECHNIQUE FOR THE TREATMENT OF PESTICIDE EF...civej
Solvent extraction and adsorption techniques are effective methods for the removal of pesticides like DDT
and Dicofol from the waste water. Study was conducted using 3 different solvents- Ethylene dichloride
(EDC), Monochlorobenzene (MCB) and Hexane to optimise parameters like effluent to solvent ratio,
agitation speed, agitation time and settling time to attain maximum removal of pesticides by solvent
extraction process. MCB was found to be the best solvent when compared to other two solvents using the
optimised parameters. The activated carbon (8 x30) is an effective adsorbent for the removal of DDT and
Dicofol. The material have good adsorptive capacity and follows Freundlich model. The optimum
adsorbent dose was observed as 2 gm/100ml and optimum contact time needed to reach the equilibrium
was observed as 3 hr. Column study was conducted with the synthetic effluent after solvent extraction.
Combination of solvent extraction process and adsorption technique was very effective for the removal of
Dicofol and DDT with an efficiency of 99 % and 97 % respectively.
ABSTRACT- Comparative toxicity of Nerium indicum latex powder (NILP) was studied against two common predatory and weed fishes of different body size in laboratory condition and cemented and muddy pond. LC50 of NILP for predatory fish Channa punctatus was 2.13 mg/L, 7.80 mg/L and 19.26 mg/L to small size, middle size and large size fish respectively in laboratory condition after 24 h exposure periods. Similar trends were also observed in case of cemented and muddy ponds but doses were 1-4 times higher than laboratory conditions. Similar trend of result was also observed against weed fish Mystus mystus. No further mortality was observed beyond 24 h in all set of experiments suggested fast degradation of the toxicant in water.
Key-words- Toxicity, Fish, Botanicals, Nerium indicum, Piscicidal Activity
Turbidity is one of the major culprits which help microbes present in water and waste water to survive. Also
drastically impact the water treatment efficiency mainly the process of disinfection. Coagulants such as Alum, PAC (Poly Aluminium Chloride), FeCl3 etc, are majorly used for the turbidity removal in water. Among this Alum is the most widely used coagulant in water treatment, because of its proven performance and cost effectiveness. Although alum has a proven track record,
usage of same in drinking water system increases the concentration of Aluminium ion which does not falls under the WHO (World Health Organization) norms of drinking water standards. Hence this study would be an alternate approach for turbidity
reduction in water by using natural coagulants. Different studies in ancient Tamil Literature show Strychnos potatorum Linn or
Nirmali seed act as a best coagulating agent, which in turn helps in removal of turbidity in water. This study was done to evaluate the effectiveness of Strychnos potatorum Linn seed extract in removal of turbidity from the selected water samples. An existing
water softener system of capacity 2 m3
/hr from a Residential Apartment named M/s.Ozone Pavillion was selected with an existing scheme of Alum dosing system, Pressure sand filter, Activated Carbon filter and Softener. In this scheme the Alum dosing was replaced with Strychnos potatorum Linn seed extract dosing and the softener filter was bypassed. Two different water samples
were selected (Bore Well Water and Surface Water) and jar test was performed with the Strychnos potatorum Linn extract to arrive the best suited dose for the turbidity reduction. Here the jar test performed with different concentration of Strychnos potatorum Linn extract starting from 20 mg/l to 60 mg/l and selected the concentration of 60 mg/l as the best suited dose for
turbidity reduction. The selected concentration was used for a pilot plant study in the existing water treatment plant designed by M/s. Green Enviro Polestar. The study showed the turbidity removal efficiency of 40% to 60% and highly emphasizes the usage of Strychnos potatorum Linn seed extract as a natural coagulant in water treatment systems.
Determination of volatile organic compounds in surface water and sediment usi...IOSR Journals
This research presents the development of a methodology for analysing volatile organic compounds in selected zones of Asa River, Kwara State. The liquid-liquid extraction procedure of two organic solvent (Hexane : Dichloromethane) (1:1 v/v) was employed to remove volatile organic compounds from river and sediment samples, for further identification and quantification showed very good recovery and repeatability. The mean recovery percentage range was between 96.7±1.5 - 104.0±1.0 for river samples while 97.3±2.2 - 104.0±1.0 for sediment samples at a fortification level of 0.01 μg/l. In addition, volatile organic compounds were determined by Gas chromatography – mass spectrometry. The limit of quantification was 0.05 μg/l which was below the maximum level allowed by the European council directives for volatile organic compounds (0.5 μg/l).
ABSTRACT- The development of human civilization throughout history has led to growing disruption of the natural
balance and the occurrence of different types of pollution. Environmental pollution with petroleum and petrochemical
products has been recognized as significant and serious problem. Diesel engine oil, which is one of the major products of
crude oil, constitutes a major source of pollution in our environment. Therefore diesel engine oil can enter into the
environment through wrecks of oil tankers carrying diesel oil, cleaning of diesel tanks by merchants, war ships carrying
diesel oil and motor mechanics. In present study the microorganisms utilising petrol and diesel oil as carbon source were
isolated and investigation of their characteristics towards the production of polyhydroxyalkanoates (PHA), which is now a
days well known as biodegradable polymer.
Key Words- Petrol and Diesel oil contamination, Bioremediation, Biodegradable bacterial polymer, Sudan
Black B staining, 16sr RNA sequencing
Chemical characterization of Cinachyrella tarentina: Sponge of Atlantic Moroc...journal ijrtem
ABSTRACT : Currently, marine organisms are a very important source of new molecules in pharmacology and thus in the development of new bioactive products. Sponges, in particular, given their very primitive origin and persistence during evolution, have developed a chemical defense system.The chemical study of Cinachyrella tarentina, marine sponge recognized by its antibacterial and antifungal activity was investigated for the first time in Morocco. The screening of Cinachyrella tarentina revels that it contains different levels of primary and secondary metabolites. The dosage of polyphenols was carried out using the reagent Foulin-Ciocalteu. The antioxidant activity was evaluated by the DPPH test. The fatty acid composition determined by Gas chromatography-mass spectrometry (GC/MS) showed a predominance of palmitic and stearic acids. Furthermore, we found the presence of several sterols which cholesterol and sitosterol are the most abundants. Keywords: Antioxydant activity, Chemical composition, Cinachyrella tarentina, Marine sponge, Polyphenols.
The International Journal of Engineering & Science is aimed at providing a platform for researchers, engineers, scientists, or educators to publish their original research results, to exchange new ideas, to disseminate information in innovative designs, engineering experiences and technological skills. It is also the Journal's objective to promote engineering and technology education. All papers submitted to the Journal will be blind peer-reviewed. Only original articles will be published.
The papers for publication in The International Journal of Engineering& Science are selected through rigorous peer reviews to ensure originality, timeliness, relevance, and readability.
Earliest Galaxies in the JADES Origins Field: Luminosity Function and Cosmic ...Sérgio Sacani
We characterize the earliest galaxy population in the JADES Origins Field (JOF), the deepest
imaging field observed with JWST. We make use of the ancillary Hubble optical images (5 filters
spanning 0.4−0.9µm) and novel JWST images with 14 filters spanning 0.8−5µm, including 7 mediumband filters, and reaching total exposure times of up to 46 hours per filter. We combine all our data
at > 2.3µm to construct an ultradeep image, reaching as deep as ≈ 31.4 AB mag in the stack and
30.3-31.0 AB mag (5σ, r = 0.1” circular aperture) in individual filters. We measure photometric
redshifts and use robust selection criteria to identify a sample of eight galaxy candidates at redshifts
z = 11.5 − 15. These objects show compact half-light radii of R1/2 ∼ 50 − 200pc, stellar masses of
M⋆ ∼ 107−108M⊙, and star-formation rates of SFR ∼ 0.1−1 M⊙ yr−1
. Our search finds no candidates
at 15 < z < 20, placing upper limits at these redshifts. We develop a forward modeling approach to
infer the properties of the evolving luminosity function without binning in redshift or luminosity that
marginalizes over the photometric redshift uncertainty of our candidate galaxies and incorporates the
impact of non-detections. We find a z = 12 luminosity function in good agreement with prior results,
and that the luminosity function normalization and UV luminosity density decline by a factor of ∼ 2.5
from z = 12 to z = 14. We discuss the possible implications of our results in the context of theoretical
models for evolution of the dark matter halo mass function.
Nutraceutical market, scope and growth: Herbal drug technologyLokesh Patil
As consumer awareness of health and wellness rises, the nutraceutical market—which includes goods like functional meals, drinks, and dietary supplements that provide health advantages beyond basic nutrition—is growing significantly. As healthcare expenses rise, the population ages, and people want natural and preventative health solutions more and more, this industry is increasing quickly. Further driving market expansion are product formulation innovations and the use of cutting-edge technology for customized nutrition. With its worldwide reach, the nutraceutical industry is expected to keep growing and provide significant chances for research and investment in a number of categories, including vitamins, minerals, probiotics, and herbal supplements.
Slide 1: Title Slide
Extrachromosomal Inheritance
Slide 2: Introduction to Extrachromosomal Inheritance
Definition: Extrachromosomal inheritance refers to the transmission of genetic material that is not found within the nucleus.
Key Components: Involves genes located in mitochondria, chloroplasts, and plasmids.
Slide 3: Mitochondrial Inheritance
Mitochondria: Organelles responsible for energy production.
Mitochondrial DNA (mtDNA): Circular DNA molecule found in mitochondria.
Inheritance Pattern: Maternally inherited, meaning it is passed from mothers to all their offspring.
Diseases: Examples include Leber’s hereditary optic neuropathy (LHON) and mitochondrial myopathy.
Slide 4: Chloroplast Inheritance
Chloroplasts: Organelles responsible for photosynthesis in plants.
Chloroplast DNA (cpDNA): Circular DNA molecule found in chloroplasts.
Inheritance Pattern: Often maternally inherited in most plants, but can vary in some species.
Examples: Variegation in plants, where leaf color patterns are determined by chloroplast DNA.
Slide 5: Plasmid Inheritance
Plasmids: Small, circular DNA molecules found in bacteria and some eukaryotes.
Features: Can carry antibiotic resistance genes and can be transferred between cells through processes like conjugation.
Significance: Important in biotechnology for gene cloning and genetic engineering.
Slide 6: Mechanisms of Extrachromosomal Inheritance
Non-Mendelian Patterns: Do not follow Mendel’s laws of inheritance.
Cytoplasmic Segregation: During cell division, organelles like mitochondria and chloroplasts are randomly distributed to daughter cells.
Heteroplasmy: Presence of more than one type of organellar genome within a cell, leading to variation in expression.
Slide 7: Examples of Extrachromosomal Inheritance
Four O’clock Plant (Mirabilis jalapa): Shows variegated leaves due to different cpDNA in leaf cells.
Petite Mutants in Yeast: Result from mutations in mitochondrial DNA affecting respiration.
Slide 8: Importance of Extrachromosomal Inheritance
Evolution: Provides insight into the evolution of eukaryotic cells.
Medicine: Understanding mitochondrial inheritance helps in diagnosing and treating mitochondrial diseases.
Agriculture: Chloroplast inheritance can be used in plant breeding and genetic modification.
Slide 9: Recent Research and Advances
Gene Editing: Techniques like CRISPR-Cas9 are being used to edit mitochondrial and chloroplast DNA.
Therapies: Development of mitochondrial replacement therapy (MRT) for preventing mitochondrial diseases.
Slide 10: Conclusion
Summary: Extrachromosomal inheritance involves the transmission of genetic material outside the nucleus and plays a crucial role in genetics, medicine, and biotechnology.
Future Directions: Continued research and technological advancements hold promise for new treatments and applications.
Slide 11: Questions and Discussion
Invite Audience: Open the floor for any questions or further discussion on the topic.
Richard's entangled aventures in wonderlandRichard Gill
Since the loophole-free Bell experiments of 2020 and the Nobel prizes in physics of 2022, critics of Bell's work have retreated to the fortress of super-determinism. Now, super-determinism is a derogatory word - it just means "determinism". Palmer, Hance and Hossenfelder argue that quantum mechanics and determinism are not incompatible, using a sophisticated mathematical construction based on a subtle thinning of allowed states and measurements in quantum mechanics, such that what is left appears to make Bell's argument fail, without altering the empirical predictions of quantum mechanics. I think however that it is a smoke screen, and the slogan "lost in math" comes to my mind. I will discuss some other recent disproofs of Bell's theorem using the language of causality based on causal graphs. Causal thinking is also central to law and justice. I will mention surprising connections to my work on serial killer nurse cases, in particular the Dutch case of Lucia de Berk and the current UK case of Lucy Letby.
THE IMPORTANCE OF MARTIAN ATMOSPHERE SAMPLE RETURN.Sérgio Sacani
The return of a sample of near-surface atmosphere from Mars would facilitate answers to several first-order science questions surrounding the formation and evolution of the planet. One of the important aspects of terrestrial planet formation in general is the role that primary atmospheres played in influencing the chemistry and structure of the planets and their antecedents. Studies of the martian atmosphere can be used to investigate the role of a primary atmosphere in its history. Atmosphere samples would also inform our understanding of the near-surface chemistry of the planet, and ultimately the prospects for life. High-precision isotopic analyses of constituent gases are needed to address these questions, requiring that the analyses are made on returned samples rather than in situ.
A brief information about the SCOP protein database used in bioinformatics.
The Structural Classification of Proteins (SCOP) database is a comprehensive and authoritative resource for the structural and evolutionary relationships of proteins. It provides a detailed and curated classification of protein structures, grouping them into families, superfamilies, and folds based on their structural and sequence similarities.
Introduction:
RNA interference (RNAi) or Post-Transcriptional Gene Silencing (PTGS) is an important biological process for modulating eukaryotic gene expression.
It is highly conserved process of posttranscriptional gene silencing by which double stranded RNA (dsRNA) causes sequence-specific degradation of mRNA sequences.
dsRNA-induced gene silencing (RNAi) is reported in a wide range of eukaryotes ranging from worms, insects, mammals and plants.
This process mediates resistance to both endogenous parasitic and exogenous pathogenic nucleic acids, and regulates the expression of protein-coding genes.
What are small ncRNAs?
micro RNA (miRNA)
short interfering RNA (siRNA)
Properties of small non-coding RNA:
Involved in silencing mRNA transcripts.
Called “small” because they are usually only about 21-24 nucleotides long.
Synthesized by first cutting up longer precursor sequences (like the 61nt one that Lee discovered).
Silence an mRNA by base pairing with some sequence on the mRNA.
Discovery of siRNA?
The first small RNA:
In 1993 Rosalind Lee (Victor Ambros lab) was studying a non- coding gene in C. elegans, lin-4, that was involved in silencing of another gene, lin-14, at the appropriate time in the
development of the worm C. elegans.
Two small transcripts of lin-4 (22nt and 61nt) were found to be complementary to a sequence in the 3' UTR of lin-14.
Because lin-4 encoded no protein, she deduced that it must be these transcripts that are causing the silencing by RNA-RNA interactions.
Types of RNAi ( non coding RNA)
MiRNA
Length (23-25 nt)
Trans acting
Binds with target MRNA in mismatch
Translation inhibition
Si RNA
Length 21 nt.
Cis acting
Bind with target Mrna in perfect complementary sequence
Piwi-RNA
Length ; 25 to 36 nt.
Expressed in Germ Cells
Regulates trnasposomes activity
MECHANISM OF RNAI:
First the double-stranded RNA teams up with a protein complex named Dicer, which cuts the long RNA into short pieces.
Then another protein complex called RISC (RNA-induced silencing complex) discards one of the two RNA strands.
The RISC-docked, single-stranded RNA then pairs with the homologous mRNA and destroys it.
THE RISC COMPLEX:
RISC is large(>500kD) RNA multi- protein Binding complex which triggers MRNA degradation in response to MRNA
Unwinding of double stranded Si RNA by ATP independent Helicase
Active component of RISC is Ago proteins( ENDONUCLEASE) which cleave target MRNA.
DICER: endonuclease (RNase Family III)
Argonaute: Central Component of the RNA-Induced Silencing Complex (RISC)
One strand of the dsRNA produced by Dicer is retained in the RISC complex in association with Argonaute
ARGONAUTE PROTEIN :
1.PAZ(PIWI/Argonaute/ Zwille)- Recognition of target MRNA
2.PIWI (p-element induced wimpy Testis)- breaks Phosphodiester bond of mRNA.)RNAse H activity.
MiRNA:
The Double-stranded RNAs are naturally produced in eukaryotic cells during development, and they have a key role in regulating gene expression .
Observation of Io’s Resurfacing via Plume Deposition Using Ground-based Adapt...Sérgio Sacani
Since volcanic activity was first discovered on Io from Voyager images in 1979, changes
on Io’s surface have been monitored from both spacecraft and ground-based telescopes.
Here, we present the highest spatial resolution images of Io ever obtained from a groundbased telescope. These images, acquired by the SHARK-VIS instrument on the Large
Binocular Telescope, show evidence of a major resurfacing event on Io’s trailing hemisphere. When compared to the most recent spacecraft images, the SHARK-VIS images
show that a plume deposit from a powerful eruption at Pillan Patera has covered part
of the long-lived Pele plume deposit. Although this type of resurfacing event may be common on Io, few have been detected due to the rarity of spacecraft visits and the previously low spatial resolution available from Earth-based telescopes. The SHARK-VIS instrument ushers in a new era of high resolution imaging of Io’s surface using adaptive
optics at visible wavelengths.
Richard's aventures in two entangled wonderlandsRichard Gill
Since the loophole-free Bell experiments of 2020 and the Nobel prizes in physics of 2022, critics of Bell's work have retreated to the fortress of super-determinism. Now, super-determinism is a derogatory word - it just means "determinism". Palmer, Hance and Hossenfelder argue that quantum mechanics and determinism are not incompatible, using a sophisticated mathematical construction based on a subtle thinning of allowed states and measurements in quantum mechanics, such that what is left appears to make Bell's argument fail, without altering the empirical predictions of quantum mechanics. I think however that it is a smoke screen, and the slogan "lost in math" comes to my mind. I will discuss some other recent disproofs of Bell's theorem using the language of causality based on causal graphs. Causal thinking is also central to law and justice. I will mention surprising connections to my work on serial killer nurse cases, in particular the Dutch case of Lucia de Berk and the current UK case of Lucy Letby.
2. Resumen-Abstract
En el presente estudio se ha puesto en marcha una metodología analítica para la determinación
de compuestos antifloculantes en muestras de agua procedentes de distintos puertos de la isla
de Gran Canaria. Para la extracción de los analitos se ha utilizado la extracción en fase sólida
(SPE) con cartuchos Envirelut Pesticide. Posteriormente el extracto ha sido analizado mediante
cromatografía líquida de alta resolución acoplada a un detector de absorbancia UV (HPLC-DAD).
Las desviaciones standard relativas (RSDs) del método desarrollado son inferiores al 12 %
para todos los compuestos en estudio. Las recuperaciones obtenidas son satisfactorias (superiores
al 85%) y los límites de detección (LODs) hallados varian entre 0.007-0.4 µg/L. Finalmente el
método ha sido aplicado a muestras de agua de mar procedente de diferentes puertos de la isla
de Gran Canaria.
In order to study the concentration levels of the most important booster biocides in different
ports of Gran Canaria island (Canary Islands), an analytical procedure was developed. The
analytes studied were extracted form water samples by solid-phase extraction with an Envirelut
Pesticide cartridge. After optimization of the extraction procedure, the biocides in the extract
were directly determined by high performance liquid chromatography with diode array detector
(HPLC-DAD).
The relative standard deviations (RSDs) of the developed procedure were lesser than 12 %
for all studied compounds. Satisfactory recoveries (higher than 85 %) were obtained, and the
limits of detection (LODs) varied between 0.007-0.4 µg/L for all antifouling agents. The method
was applied to the analysis of seawater samples from ports and marinas of G.C. island.
Keywords: Solid Phase Extraction, Antifouling booster biocides,4-Chloro-3-methylphenol, Diu-
ron, Chlorothalonil, Dichlofluanid, TCMTB, Thiram,Irgarol 1051, Gran Canaria Island, seawa-
ter, HPLC.
2
3. 1 Introduction
The function of antifouling paints is to avoid the growth of biofouling. The term biofouling make
reference to the undesirable accumulation of microorganisms, plants and animals on artificial
surfaces immersed in sea water. This accumulation causes some problems like major frictional
resistance, deterioration of the coating, etc. with the consequent economic loss [1].
In the decade of 1970, Tributiltyn (TBT) was introduced in ship paint industry with a high
efficiency. However, TBT can be considered as a persistent and toxic compound. TBT shows
high toxicity in non target species like bivalves and gastropods, some of them of commercial
interest, and slowly degradation in the environment with a half life in sediments of the order of
months or even years [2]. Due to this, legislation in European Union (EU) countries prohibited
the use of TBT-based paints in vessels < 25 m. in length [3]. More recently International Marine
Organization (IMO) has banned make use of this kind of paints in ships independently of length,
from 2003, and the hulls with TBT-based paints will has forbidden to enter in EU ports and
harbours from 2008 [4].
Consequently, paint manufactures have developed new products having less environmental
impact. These compounds are known like booster biocides, and are added to cooper oxides-
based paints to improve the efficiency [5]. Moreover, these compounds inhibit photosynthesis
and therefore are growth inhibitors of freshwater and marine algae [6].
Some of these compounds are frequently found in marine water samples at great concentra-
tions, and their toxicological effect has been tested in non target species [7,8]. For this reason,
the concentrations of these new biocides need to be monitored in order to assess to risks to the
environment.
One of the mayor problems with environmental samples is that conventional analytical techni-
ques are seldom sufficient in terms of sensitivity, selectivity and reliability. Of fact, obtaining
reliable data depends on the whole analytical procedure. Sample preparation includes several
steps of which the most time-consuming and labor-consuming are extraction and clean-up of the
extracts.
For the isolation of these antifouling from seawater samples different pre-treatment methods
have been used, like Liquid-Liquid Extraction (LLE) [9] or Solid Phase Extraction (SPE) both
3
4. in on [10–12] and off-line mode [13, 14], Solid Phase Microextraction (SPME) [15–18], Solvent
Microextraction [19] or by means of the use of Immunosorbents [20]. But due to the necessity of
to obtain a great preconcentration and relative low time consuming analysis, the most frequent
extractions for monitoring these compounds in sea water are SPE [21–25] and LLE [26–28].
In this work, we developed a method to evaluate the presence of seven booster biocides
currently used in antifouling paints, in marina and harbour waters of Gran Canaria island (Spain)
by SPE and HPLC-DAD.
For that purpose, we have optimized all conditions that affecting the extraction procedure by
extracting the selected target compounds from spiked water samples. Finally, the method was
tested for analysis of real water samples from different Gran Canaria island ports.
4
5. 2 Experimental
2.1 Reagents
Booster biocides under study (Table 1, numbers identify the compounds in the tables and figures)
were purchased from Dr. Ehrenstorfer (Germany) with purity in all cases greater than 98 %.
Stock standard solutions were prepared at 1 g/L of each analyte in methanol and stored at 4oC.
Number Compound Retention Time (min.) λabs. (nm.)
1 Thiram 3.3 260
2 4-Chloro-3-methylphenol 6.7 280
3 Diuron 7.1 248
4 TCMTB (Busan) 8.9 280
5 Chlorothalonil 10.3 230
6 Diclofluanid 11.2 230
7 Irgarol 1051 12.4 230
Table 1: Peak identification numbers, retention times and absorbance wavelengths for the ana-
lytes under study.
SPE cartridges (6 mL) employed in this study were: Sep-Pak Vac C18 (500 mg) and Oasis
HLB (200 mg) from Waters (Madrid, Spain), Mega BE-FL (1 g), Envirelut pesticide (500 mg)
and Bond Elut-ENV (500 mg) from Varian (Madrid, Spain).
Methanol HPLC grade was obtained from Panreac Química S.A. (Barcelona, Spain) and
bidestilled water from Milli-Q purification unit (Millipore, USA).
2.2 Apparatus
The chromatograph system consists if a Varian pump fitted with a Varian Autosampler 410 with
volume selector, a Column Valve Module with an internal oven and Varian PDA Detector. The
System, acquisition and processing of a data were controlled by Star software 6.5 version (Varian
Inc., Madrid, Spain). The stationary-phase column was a Waters Nova-Pak C18 150 mm × 3.9
mm (4 µm of particle size) and ChromGuard C18 precolumn from Varian. The column was
5
6. placed in the column module and thermostated at 30 ± 0.2oC.
For SPE process was used a Vac Elut 20 SPE Manifold coupled a Sartorius vacuum pump.
2.3 Sampling
Seawater employed for optimization of the methodology was collected from Melenara beach, in
the East of Gran Canaria island. Extractions over blank sample were carried out to check the
ausence of analytes under study.
Sea water samples were collected from different ports and marinas around of Gran Canaria
island. The samples were taken to 1 m of depth, then they were placed in 2.5 L amber glass
bottles and stored at 4oC in the dark until extraction. Duplicate field samples were taken at
each location and were filtered through 0.65 µm Durapore membrane (Millipore, USA).
2.4 Solid Phase Extraction Procedure
100 mL of sea water sample were spiked with a concentration of 50 µg/L of each analyte,
except Dichlofluanid (150 µg/L). The spiked samples were then shaken in order to ensure the
homogenous distribution of analytes in the matrix and then they were allowed to equilibrate for
10 min. prior to extraction. The cartridges were conditioned with 3 × 5 mL of methanol follows
by 3 × 5 mL of bidistilled water. Subsequently the samples were passed through cartridges with a
flow not greater than 12 mL/min. To remove the salts and other no target substances retained on
the cartridges, a wash step was employed with an optimized composition (methanol / water) and
then the samples were dried under vacuum during 5 min. To extract the analytes, an optimized
volume of methanol was added and passed through the sorbent at low flow, approximately 1
mL/min.
2.5 Liquid-Liquid Extraction
For liquid-liquid extraction method, 1 L of sea water coming from Melenara’s beach (previously
analyzed to ensure the absence of analytes) was passed through of a filter of 0.65 µm pore
size. Then it was spiked with the analytes to obtain a final concentration of 0.6 µg/L except
6
7. Dichlofluanid (2.4 µg/L). Finally was vigorously shaken and let it stand for 10 min. to ensure a
homogenous distribution.
LLE was performed as follows: 1 L spiked sample was introduced in a 2 L separatory funnel,
and was sequentially extracted with Dichloromethane (2 × 50mL), with a time of repose of 5
min. Subsequently combined extracts were dried and concentrated by a rotavapor, firstly in a
200 mL round bottom flask to approximately 5 mL and then the extract was passed to 10 mL
round bottom flask where was completely dried. Finally the analytes were redissolved in 1 mL
of methanol.
2.6 Chromatography Analysis
The analysis of extracted samples was carried out with high performance liquid chromatography
with diode array detection (HPLC-DAD). 30 µL of sample was injected into chromatography
system, and the absorbance was measured at maximum wavelength of each analyte. The retention
times and wavelengths of analytes employed for their measurement are showed in Table 1. The
mobile phase was methanol (50%) and bidistilled water (50%) for 3 min. up to proportion of
80% methanol-20% water for 14 min. at flow-rate 1 mL/min. A prudential time (5 min.) was
employed to equilibrate the system and come back to initial conditions of gradient elution.
In real samples, to ensure the presence of the booster biocides, it was accomplished on the
basis of their retention times and by comparison between the absorbance spectra in the sample
and in the standards solutions.
The corresponding calibration curves were done in a concentration range between 0.05 and
4 µg/L. A linear relationship was obtained between peak areas and the analyte concentrations,
with high correlation coefficients (R2>0.99).
7
8. 3 Results and Discussion
3.1 Solid Phase Extraction Optimization
Solid Phase Extraction is widely employed in environmental analysis. The basis of this extrac-
tion method is the selective retention of analytes from liquid samples over a solid sorbent and
subsequent desorption with organic solvents.
The optimization of the extraction procedure include the type of the sorbent, sample volume,
composition and volume of washed solution and volume of desorption.
For these studies we chose select conditions: 100 mL of seawater spiked samples, and 5 mL
of methanol for desorption.
3.1.1 Type of Sorbent
The first parameter that was optimized was the type of cartridge. In this case, we have used five
different cartridges: Sep-Pak Vac C18 (500 mg),Bond Elut-ENV (500 mg), Mega BE-FL (1 g),
Oasis HLB (200 mg) and Envirelut pesticide (500 mg).
The results obtained (as peak areas) over the different SPE cartridge are shown in Figure
1 where it is observed that the efficiency of the extraction changes with the type of sorbent.
Among types cartridge considered, C18 and Envirelut Pesticide provided higher responses for all
compounds. Bond Elut-Env was not effective to retention of Thiram and TCMTB.
3.1.2 Wash Step Composition
Before desorption, a study was done for cleaning the SPE cartridge. When no wash step was
employed, the salt retained in the cartridge was dragged on the desorption step and it was
necessary to filter the solution. For the optimization of this step, we used 5 mL of wash solution
with different water/methanol composition.
In Figure 2 we can see that the peak areas obtained decreases when for any methanol con-
centration used. The most satisfactory recoveries for all the compounds were achieved using only
bidestilled water.
8
9. 0
1
2
3
x 10
5
Thiram
0
1
2
3
x 10
5
Cresol
0
2
4
6
8
x 10
5
Diuron
0
0.5
1
1.5
2
x 10
5
TCMTB
0
5
10
x 10
5
Chlorothalonil
0
5
10
x 10
4
Dichlofluanid
0
5
10
x 10
5
Irgarol 1051
Peak
Area
Sep−Pak Vac C18
Bond Elut−ENV
Mega BE−FL
Oasis (HLB)
Envirelut Pesticide
Figure 1: Comparison of peak areas obtained for extraction with different cartridges. A volume
of 100 mL of seawater sample with 50 µg/L of each analyte except Dichlofluanid with 150 µg/L
and 5 mL of methanol to desorption were employed.
Finally a wash step with 2 × 5 mL of bidestilled water was chosen in order to ensure the
elimination of salts.
3.1.3 Desorption Volume
The desorption volume is an important factor in the SPE process. The desorption volume
employed must be sufficient to ensure the total extraction of analytes, but not so higher than
the time used in the desorption and posterior drying of the sample will be high. Normally with
polymeric sorbents low volumes are used but with other types like Graphitized Carbon Black
(GCB) it is necessary more desorption volumes due to its great adsorbing properties [29].
The solvent used for desorption was methanol. Firstly, it was compared the normalized
peaks areas obtained for extractions with 2.5 mL and 2 × 2.5 mL (Table 2). It is observed that
9
10. 0
1
2
3
4
x 10
5
Thiram
0
1
2
3
4
x 10
5
Cresol
0
5
10
x 10
5
Diuron
0
1
2
3
x 10
5
TCMTB
0
5
10
15
x 10
5
Chlorothalonil
0
0.5
1
1.5
2
x 10
5
Dichlofluanid
0
5
10
15
x 10
5
Irgarol 1051
Peak
Area
No Wash
0% Methanol
5% Methanol
10% Methanol
15% Methanol
20% Methanol
Figure 2: Peak areas obtained for extraction of 100 mL of sea water samples spiked with 50 µg/L
for each analyte and 150 µg/L for Dichlofluanid, using different methanol proportion in wash
step.
similar results are obtained and therefore desorption of analytes is effective with 2.5 mL for all
compounds. For evaluation of required volume, the elution was carried out with 1, 1.5, 2 and
2.5 mL of methanol. In Figure 3 we can see that a volume of 1 mL was sufficient to desorb
the target of analytes from SPE cartridge. With 1 mL desorption volume, the drying step can
be avoided. This fact provides us great advantages: the time of extraction process is lower and
prevents some compounds losses; for example TCMTB present a high vapour pressure and could
degraded [30].
3.1.4 Sample Volume
In some case, the sample volume may be a important parameter for efficient extraction due to
the breakthrough volume of the cartridge.
10
11. Compound 1 × 2.5 mL 2 × 2.5 mL
Thiram 1532518 1431988
4-Chloro-3-methylphenol 1260464 1089570
Diuron 3140201 2977145
TCMTB 869994 790188
Chlorothalonil 5272106 5016663
Dichlofluanid 657185 535433
Irgarol 1051 4875729 4668835
Table 2: Normalized peaks areas for the extraction of 100 mL of sea water sample spiked with
50 µg/L and 150 µg/L for Dichlofluanid. Data are the mean of two measurements.
Different sample volumes of 100, 500, 800 and 1000 mL were spiked with 500 µL of standard
solution with a concentration of 10000 µg/L for each analyte and 30000 µg/L for Dichlofluanid.
The results of this study are shown in Figure 4, where it can be seen that comparable areas were
obtained for the majority of compounds, except for 4-Chloro-3-methylphenol, where, the peak
area increased with the volume of seawater. This can be due to a major efficient retention of low
concentration of this analyte.
In order to obtain a great preconcentration as is possible, a volume of 1000 mL was chosen
for extraction procedure.
3.2 Analytical Paramenters
Analytical parameters for SPE-HPLC procedure were obtained by analysis of different spiked
seawater samples with booster biocides mixture on the range from 50 to 1000 µg/L, except for
Dichlofluanid on the range 800 to 4000 µg/L. Linear relationship were found between peaks area
and analyte concentrations, with high correlation coefficients, higher than 0.995 for all analytes
except Dichlofluanid (R2=0.992). In the optimum conditions recovery levels higher than 85 %
were obtained for all biocides, except in the case of Dichlofluanid (68%) (Table 3).
Figure 5. shows a typical chromatogram obtain for extraction of a spiked sample. At the
same time in Figure 6. is represented a chromatogram at λabs=248 nm. of a real sample coming
11
12. 0
0.5
1
1.5
2
x 10
6
Thiram
0
0.5
1
1.5
2
x 10
6
4−Chloro−3−methylphenol
0
1
2
3
4
x 10
6
Diuron
0
2
4
6
8
x 10
5
TCMTB
0
2
4
6
x 10
6
Chlorothalonil
0
2
4
6
8
x 10
5
Dichlofluanid
0
2
4
6
x 10
6
Irgarol 1051
Peak
Area
1 mL
1.5 mL
2 mL
2.5 mL
Figure 3: Normalized peak areas obtained with Envirelut pesticide cartridge for different analytes
under study. A volume of 100 mL of sea water sample with 50 µg/L of each analyte except
Dichlofluanid with 150 µg/l was employed.
from Puerto Rico marina (SW). In this figure also has been represented the absorbance spectra
of the standard (dashed blue line) and real sample (black line).
The precision of the method was determinate by reproducibility studies expressed like relative
standard deviation (% RSD). For this purpose, six spiked samples were analysed with optimized
conditions. The results are summarized in Table 3. In all cases the reproducibilities are below
of 10%, only Dichlofluanid shows a slowly superior reproducibility with 10.84%.
Limits of detection (LODs) for 1000 mL of sea water sample, expressed like three times the
noise of each compound [31] were calculated and are showed in Table 3. It can be observed that
LODs varied between 0.007 for TCMTB and 0.075 µg/L except for Dichlofluanid that showed
a higher value (0.451 µg/L). These LOD are suitable for determinate the presence of booster
biocides in real samples coming from Spanish coast, where can found concentrations over 0.1
12
13. 0
5
10
15
x 10
5
Thiram
0
5
10
15
x 10
5
4−Chloro−3−methylphenol
0
1
2
3
4
x 10
6
Diuron
0
2
4
6
8
x 10
5
TCMTB
0
2
4
6
x 10
6
Chlorothalonil
0
1
2
3
x 10
5
Dichlofluanid
0
2
4
6
x 10
6
Irgarol 1051
Peak
Area
100 mL
500 mL
800 mL
1000 mL
Figure 4: Peaks areas obtained for different volumes of sea water samples. A volume of 1 mL of
methanol was employed for desortion of analytes.
µg/L, principally for Diuron and Irgarol 1051 [22].
In order to demonstrate the validity of the previously optimized method, it was compared
with a conventional method, in this case Liquid-Liquid Extraction. A water sample of 1000 mL
containing the seven booster biocides at a concentration of 0.6 µg/L and 2.4 µg/L was analyzed
using Liquid-Liquid Extraction procedure [27,32] and HPLC-DAD determination. Figure 7 shows
the results obtained, the results obtained for Chlorothalonil and Irgarol 1051 are similar in both
procedures, however in the cases of Diuron and Dichlofluanid higher recoveries are obtained using
SPE methodology. Finally we have note that Thiram, 4-Chloro-3-methylphenol and TCMTB
could not be determined using LLE due to losses during evaporation step.
13
14. Compound Linear Range a(µg/L) Recovery (%) R.S.D.b(%) L.O.D.a,c (µg/L)
Thiram 0.1-1.00 96 6.59 0.022
4-Chloro-3-methylphenol 0.1-1.00 103 5.35 0.075
Diuron 0.05-1.00 101 3.49 0.038
TCMTB 0.1-0.80 85 4.70 0.007
Chlorothalonil 0.1-0.80 92 5.90 0.010
Dichlofluanid 0.8-4.00 68 10.8 0.415
Irgarol 1051 0.05-1.00 93 3.75 0.031
a
Factor of preconcentration:1000
b
Relative Standard Deviation
c
Limit of Detection
Table 3: Analytical Paramenters
Figure 5: Chromatogram obtained for extraction of 100 mL of sea water spiked with a concen-
tration of 3.5 µg/L for all compounds except Dichlofluanid, with 14 µg/L (λabs=230 nm.). 1:
Thiram, 2: 4-Chloro-3-methylphenol, 3: Diuron, 4: TCMTB, 5: Chlorothalonil, 6: Dichlofluanid,
7: Irgarol 1051 and A: Dichlofluanid degradation product.
14
15. 0 5 10 15
0
5
10
x 10
−3
Time (min)
Absorbance
(AU)
220 260 300 340
Absorbance Spectra of Diuron
220 260 300 340
Absorbance Spectra of Irgarol 1051
Figure 6: Chromatogram obtained by extraction of 1000 mL of a real seawater sample from
Puerto Rico marina (point C2, λabs=248 nm). In small boxes it is shown the absorbance spectra
of real sample (black line) and standards (dashed blue line).
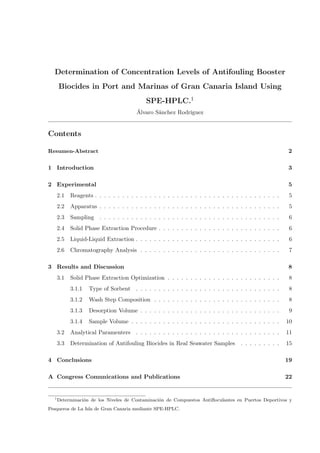
3.3 Determination of Antifouling Biocides in Real Seawater Samples
The method developed was utilized for determination of the analytes under study in real samples
coming from different ports and marinas of Gran Canaria Island.
Canary Islands are a Spanish archipelago; it is localized in Northwest of African continent,
between 27.37 oN, 18.10 oW and 29.25 oN, 13.20 oW. The archipelago is a significant point
in the commercial ship routes between America, Africa and Europe; the marine traffic passes
principally by major islands (Gran Canaria and Tenerife), being the port of Las Palmas of Gran
Canaria one of most important. Also there is a great tourist activity. In Gran Canaria, the
marinas are fundamentally localized in the South of the island.
Figure 8 shows the different points where were collected the samples. Within of area A (NE),
is the port of Las Palmas of Gran Canaria and two marinas: 1-Club Náutico, which are under
construction with low activity and 2- Muelle Deportivo, which are the most important marina in
the island and present high yachting and sailing activity. The point B (SW) is Mogán dock with
two zones, first (right of map) as marina and second as fishery harbour. The point C (SW) is
Puerto Rico marina with high yachting and sporting activity associated to tourism and D (SSW)
15
16. Diuron Clorothalonil Dichlofluanid Irgarol 1051
0
40
80
120
Recovery
(%)
Solid Phase Extraction
Liquid−Liquid Extraction
Figure 7: Recoveries obtained for four of booster biocides under study by optimized solid phase
extraction and conventional liquid-liquid extraction.
is the Arguineguin fishery harbour.
Table 4 shows the results obtained for the different points analyzed. Diuron was the com-
pound most frequently found, with concentrations in the range from 0.04 to 0.1 µg/L. Its common
presence in water samples can be due to its extensive use and very low degradation [33]. Irgarol
1051 was detected only in the marina of Puerto Rico. Both Diuron and Irgarol 1051 are photo-
synthesis inhibitor and shown toxicological effects in non target species like invertebrates [8] and
macrophytes [7].
16
17. Sample Diuron(µg/l)a Irgarol 1051(µg/l)a
A10 0.045 ± 0.003b -
B1 0.049 ± 0.001b -
B2 0.0050 ± 0.001b -
B3 0.069 ± 0.001 -
B4 0.097 ± 0.003 -
C1 0.045 ± 0.001b 0.033 ± 0.001b
C2 0.078 ± 0.001 0.033 ± 0.003b
C3 - 0.046 ± 0.001b
C4 0.044 ± 0.002b -
C5 0.060 ± 0.001 -
D1 0.071 ± 0.003 -
D2 0.100 ± 0.004 -
a
Mean of two determinations ± Standard Deviation.
b
Approximate concentrations, between limit of detection and limit of quantifica-
tion.
Table 4: Real samples taken from Gran Canaria Island.
17
19. 4 Conclusions
An analytical method for the determination of booster biocides in seawater samples was optimized
and developed. The proposed method includes SPE and HPLC-DAD detection and offers a
combination of sensitivity and simplicity when is compared with other conventional sample-
preparation methods.
The developed method was successfully applied to various aqueous samples obtained from
different ports and marinas of Gran Canaria island.
Acknowledments
This study was funded by the Spanish Ministry of Education and Science Project No.
CTM2006/06503. Thanks to Las Palmas Port Authority, Puerto Rico and Mogán Port mana-
gement for the support. Also to Cabildo Insular de Gran Canaria and Spanish Ministry of
Education and Science for the research grant to Álvaro Sánchez Rodríguez.
References
[1] Yebra, D. M.; Kiil, S. and Dam-Johansen, K., Prog. Org. Coat., 2004, 50, 75–104.
[2] Hoch, M., Appl. Geochem., 2001, 16, 719–743.
[3] Evans, S. M.; Birchenough, A. C. and Brancato, M. S., Mar. Pollut. Bull., 2000, 40, 204–
211.
[4] CE; European directive 782/2003, 2003.
[5] Voulvoulis, N.; Scrimsshaw, M. D. and Lester, J. N., Appl. Organomet. Chem., 1999, 13,
135–143.
[6] Okamura, H.; Watanabe, T.; Aoyama, I. and Hasobe, M., Chemosphere, 2002, 46, 945–951.
[7] Lambert, S. J.; Thomas, K. V. and Davy, A. J., Chemosphere, 2006, 63, 734–743.
[8] Manzo, S.; Buono, S. and Cremisini, C., Arch. Environ. Con. Tox., 2006, 51, 61–68.
19
20. [9] Voulvoulis, N.; Scrimshaw, M. D. and Lester, J. N., Chromatographia, 1999, 50, 353–357.
[10] Ferrer, I. and Barceló, D., J. Chromatogr. A, 1999, 854, 197–206.
[11] Pocurrull, E.; Brossa, L.; Borrull, F. and Marcé, R. M., J. Chromatogr. A, 2000, 885,
361–368.
[12] Gimeno, R. A.; Aguilar, C.; Marcé, R. M. and Borrull, F., J. Chromatogr. A, 2001, 915,
139–147.
[13] Steen, R. J. C. A.; Leonards, P. E. G.; Brinkman, U. A. T. and Cofino, W. P., J. Chromatogr.
A, 1997, 766, 153–158.
[14] Gatidou, G.; Kortrikla, A.; Thomaidis, S. and Lekkas, T. D., Anal. Chim. Acta, 2005, 528,
89–99.
[15] Peñalver, A.; Pocurull, E.; Borrull, F. and Marcé, R. M., J. Chromatogr. A, 1999, 839,
253–260.
[16] Lambropoulou, D. A.; Konstantinou, I. K. and Albanis, T. A., J. Chromatogr. A, 2000, 893,
143–156.
[17] Lambropoulou, D. A.; Sakkas, V. A. and Albanis, T. A., J. Chromatogr. A, 2002, 952,
215–227.
[18] Lambropoulou, D. A.; Sakkas, V. A. and Albanis, T. A., Anal. Chim. Acta, 2002, 468,
171–180.
[19] Lambropoulou, D. A. and Albanis, T. A., J. Chromatogr. A, 2004, 1049, 17–23.
[20] Ferrer, I.; Hennion, M. and Barceló, D., Anal. Chem., 1997, 69, 4508–4514.
[21] Thomas, K. V.; Fileman, T. W.; Readman, J. W. and Waldock, M. J., Mar. Pollut. Bull.,
2001, 42, 677–688.
[22] Martínez, K.; Ferrer, I.; Hernando, D.; Fernández-Alba, A. R.; Marcé, R. M.; Borrull, F.
and Barceló, D., Environ. Technol., 2001, 22, 543–552.
20
21. [23] Hamwijk, C.; Schouten, A.; Foekema, E. M.; Ravensberg, J. C.; Collombon, M. T.; Sshmidt,
K. and Kugler, M., Chemosphere, 2005, 60, 1316–1324.
[24] Landa, G. D.; Ansanelli, G.; Ciccoli, R. and Cremisini, C., Mar. Pollut. Bull., 2006, 52,
1541–1546.
[25] Guitart, C.; Sheppard, A.; Frickers, T.; Price, A. R. G. and Readman, J. W., Mar. Pollut.
Bull., 2007, 54, 226–232.
[26] Voulvoulis, N.; Scrimshaw, M. D. and Lester, J. N., Mar. Pollut. Bull., 2000, 40, 938–946.
[27] Cresswell, T.; Richards, J. P.; Glegg, G. A. and Readman, J. W., Mar. Pollut. Bull., 2006,
52, 1169–1175.
[28] Gardinali, P. R.; Plasencia, M.; Mack, S. and Poppell, C., Mar. Pollut. Bull., 2002, 44,
781–788.
[29] Martínez, K.; Ferrer, I. and Barceló, D., J. Chromatogr. A, 2000, 879, 27–37.
[30] Albanis, T. A.; Baart, A.; Barceló, D.; Boon, J.; Brunori, C.; Fent, K.; Fernández-Alba,
A. R.; van Hattum, B.; Hernando, M. D.; Ipolyi, I.; Konstantinou, I. K.; Massanisso, P.;
Mezcua, M.; Mieno, H.; Morabito, R.; Okamura, H.; Omae, I.; Readman, J. W.; Sakkas,
V. A.; Voulvoulis, N. and Yamada., H., The Handbook of Environmental Chemistry- 5.0
Antifouling Paint Biocides, Springer, New York, 2006.
[31] Lindsay, S., High Performance Liquid Chromatography, Wiley, New York, 1992.
[32] Hall, L. W.; Killen, W. D.; Gardinali, R. D. A. P. R. and Balcomb, R., Mar. Pollut. Bull.,
2005, 50, 668–681.
[33] Thomas, K. V.; McHugh, M. and Waldock, M., Sci. Total Environ., 2002, 293, 117–127.
21
22. A Congress Comunications and Publications
1. OPTIMIZATION OF A METHOD FOR DETERMINATION OF ANTIFOULING
PAINT BOOSTER BIOCIDES IN MARINE WATER SAMPLES.
International Symposium in Marine Sciences 2007 (ISMS 2007)
March 2007. Valencia.
2. AN APPROACH OF THE LEVELS OF CONTAMINATION BY THE PRESENCE
OF ANTIFOULING BOOSTER BIOCIDES IN MARINE WATER SAMPLES CO-
MING FROM PORTS AND MARINAS OF GRAN CANARIA ISLAND.
IX Internacional Symposium on Analytical Methodology in Environmental Field.
October 2007. Mallorca.
3. DETERMINATION OF CONCENTRATION LEVELS OF ANTIFOULING BOOSTER
BIOCIDES IN THE PORT AND MARINAS OF GRAN CANARIA ISLAND USING
SPE-HPLC.
Marine Pollution Bulletin (SUBMITTED)