Download to read offline
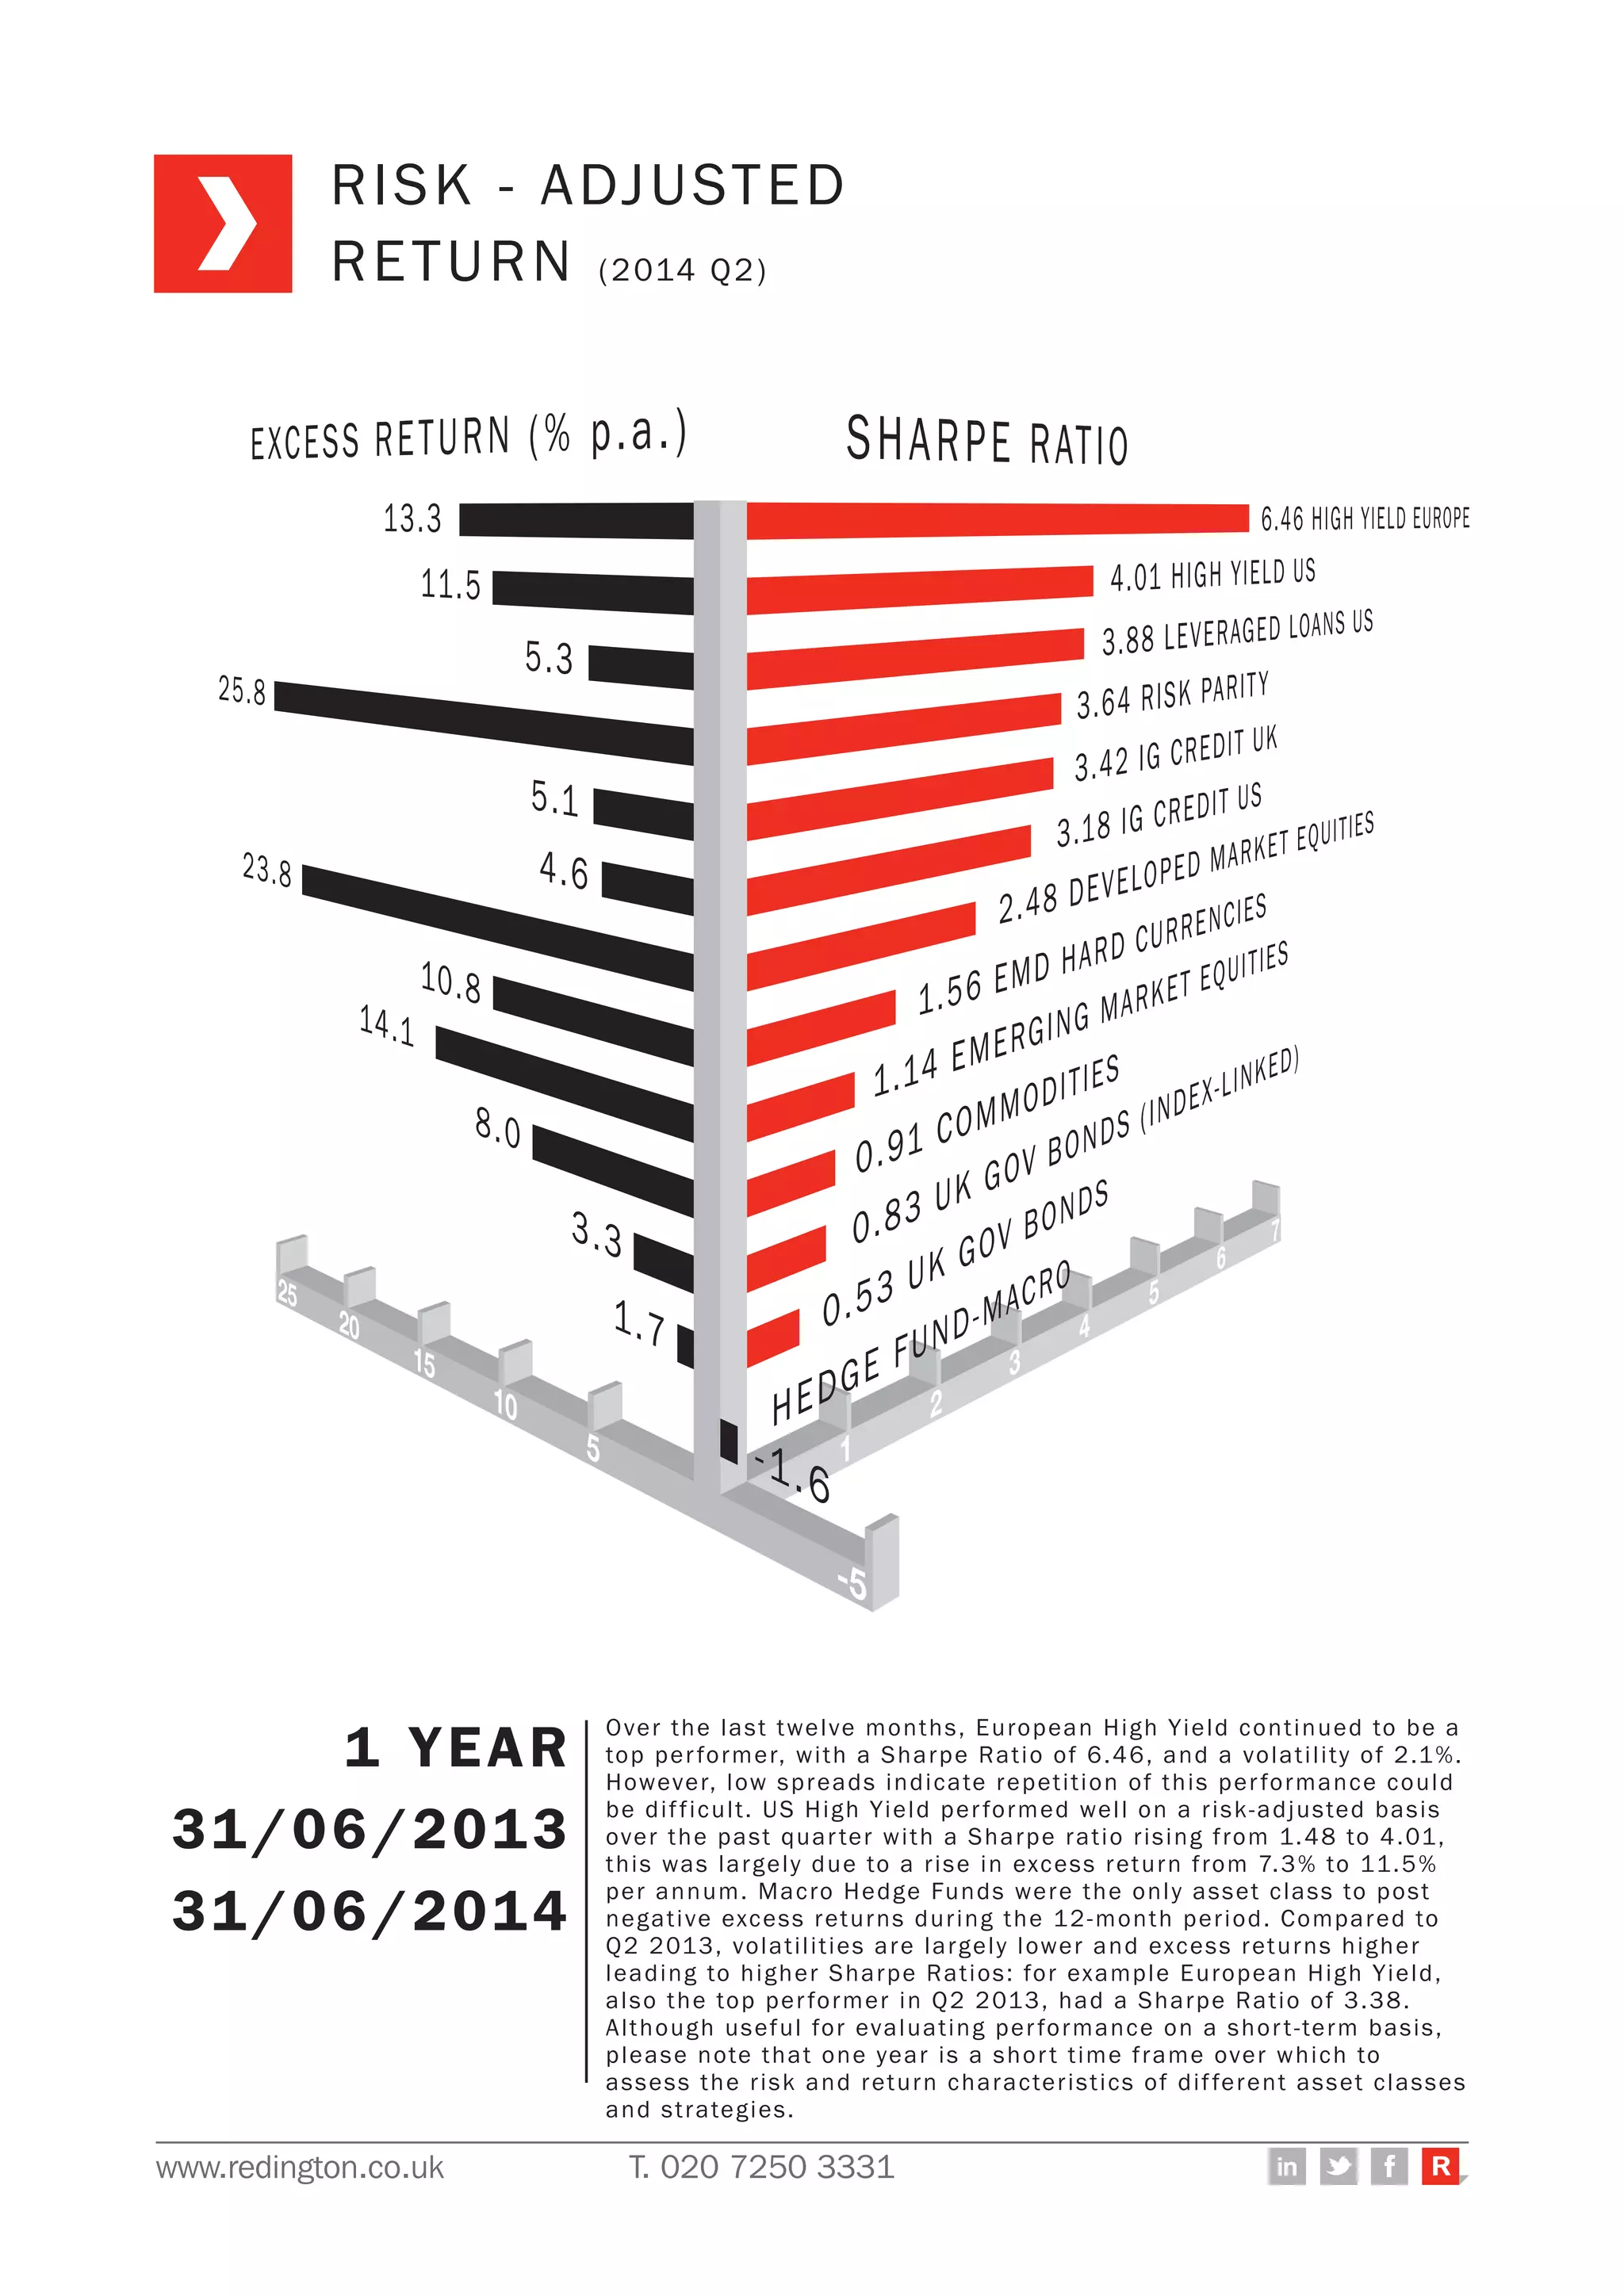
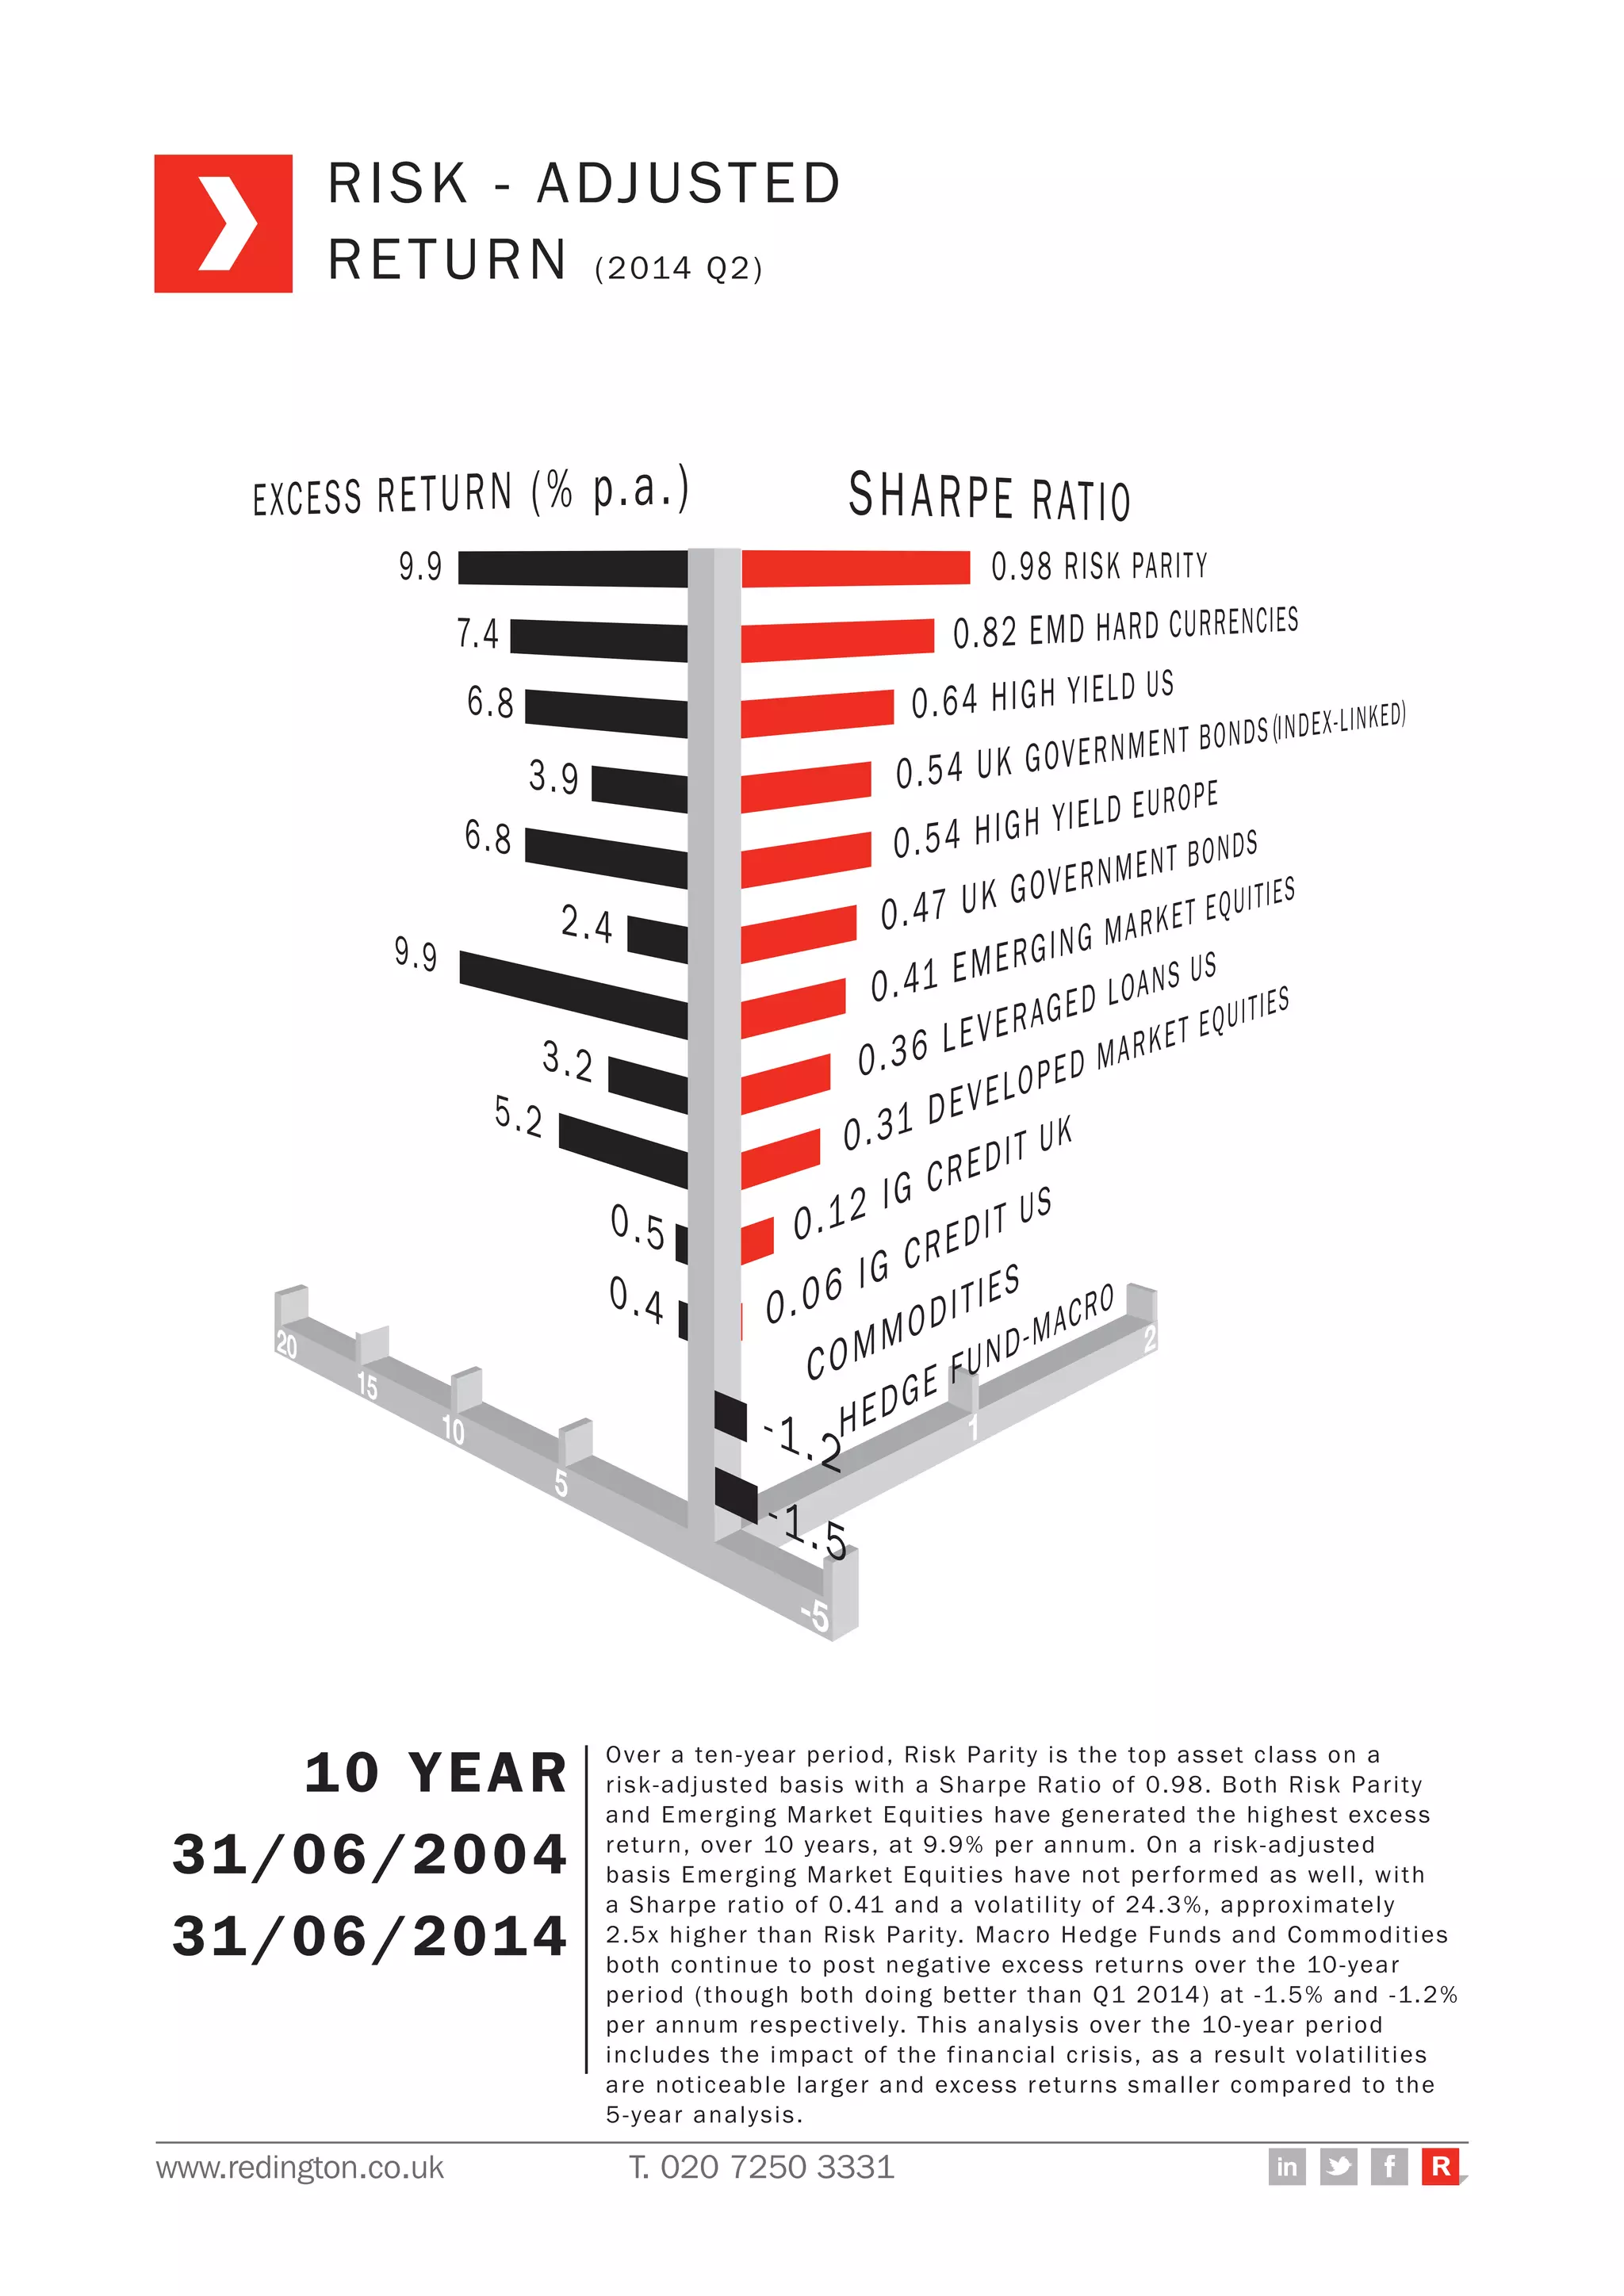
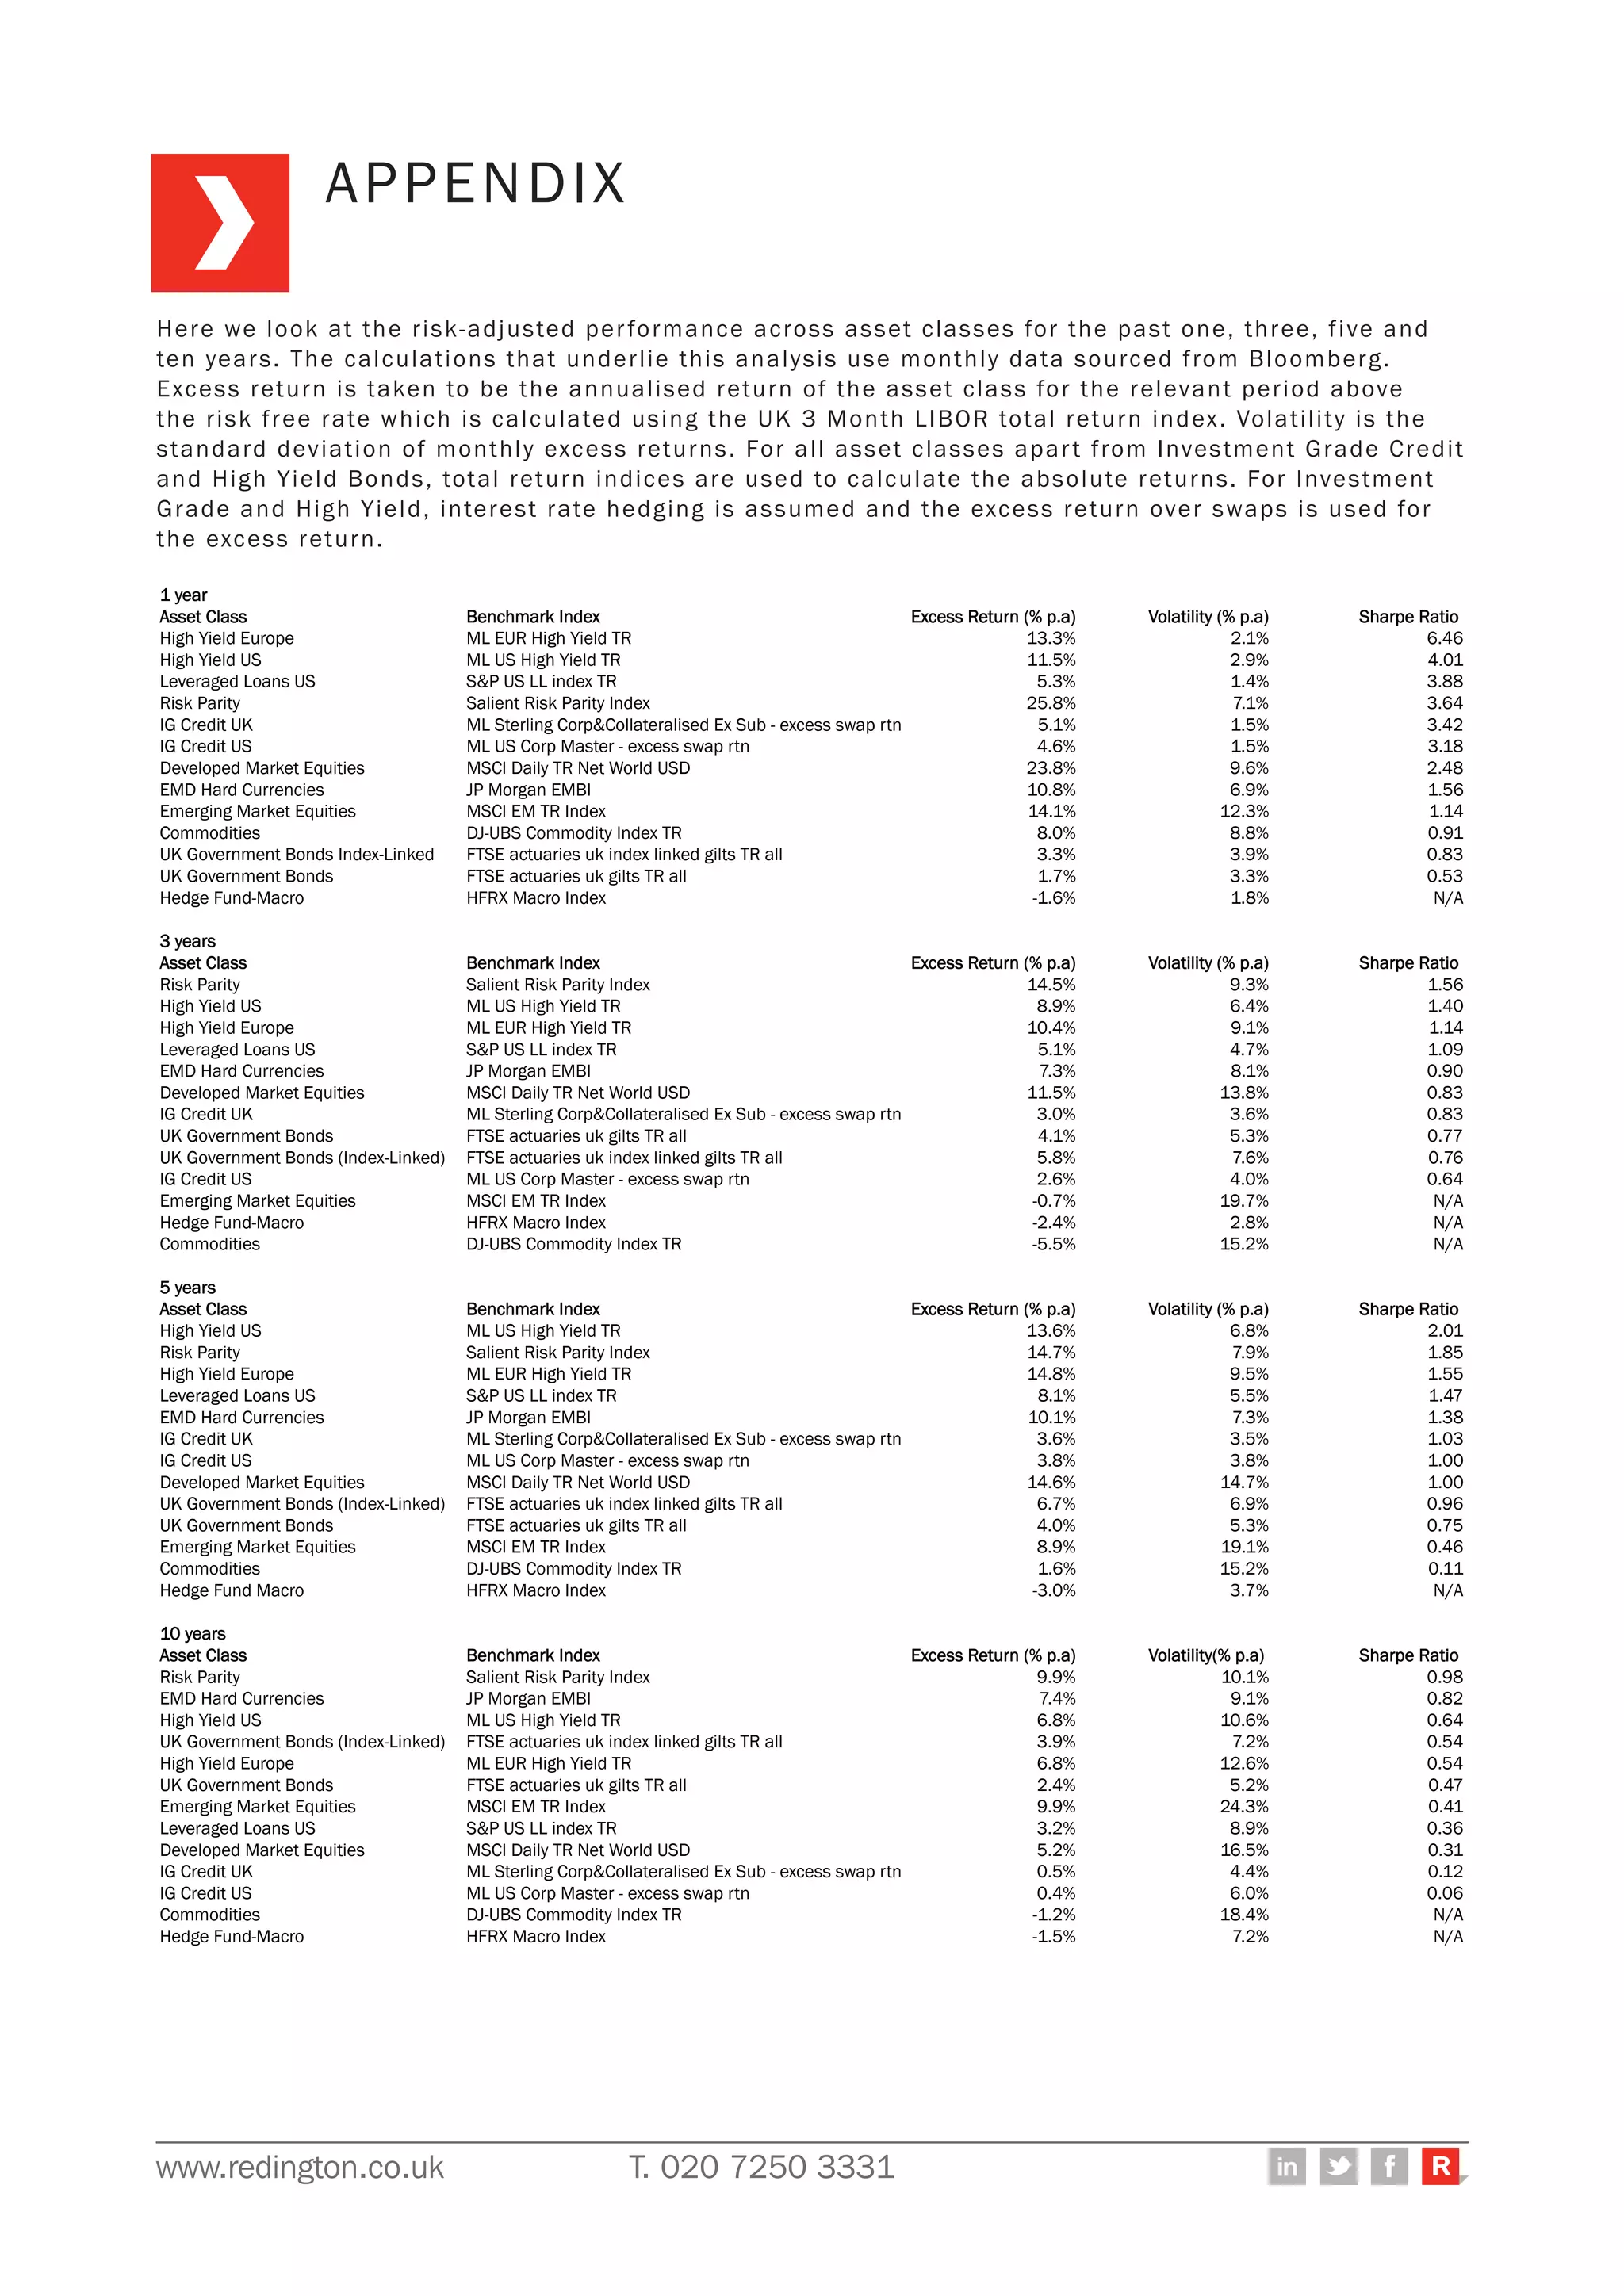


Over various time periods from 1 to 10 years, the document analyzes the risk-adjusted performance of various asset classes using metrics like Sharpe Ratio, excess return, and volatility. For the past 1 year, European High Yield had the highest Sharpe Ratio of 6.46, while Macro Hedge Funds were the only asset class to post negative excess returns. Over 10 years, Risk Parity had the highest Sharpe Ratio of 0.98, while both Risk Parity and Emerging Market Equities generated the highest excess return of 9.9% per annum.


