Download to read offline


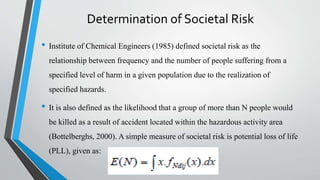


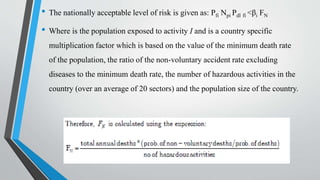
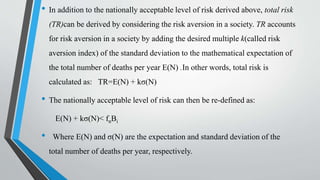


This document discusses frameworks for determining acceptable levels of risk from a societal and individual perspective. It presents a case study analyzing pipeline failures in Nigeria. The following key points are made: 1. A model is proposed that considers cost-benefit analysis and voluntariness of risk to determine acceptable individual and societal risk levels. 2. The model is applied to pipeline failures in Nigeria, finding an acceptable individual risk level of 1x10⁻⁶ and societal risk level of no more than 450 deaths per year. 3. A sensitivity analysis shows that population increases around pipelines require lower failure probabilities to maintain acceptable risk levels.


