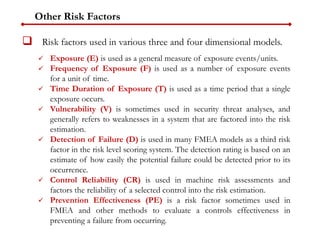
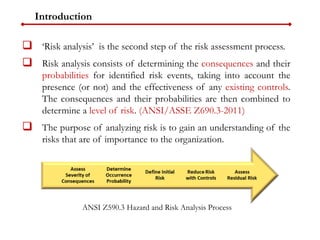
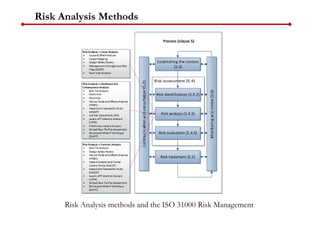
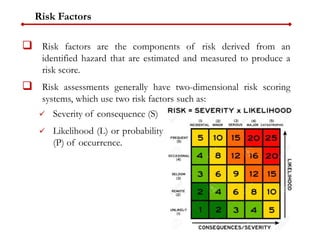
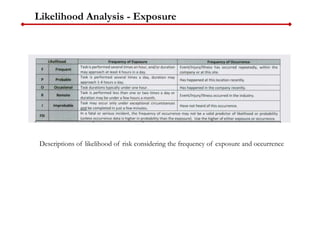
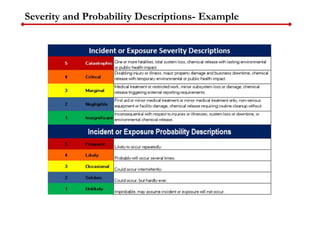
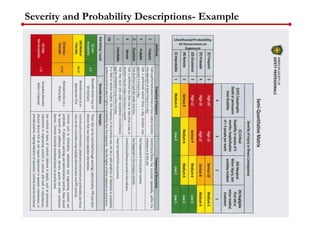
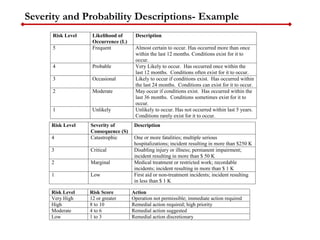
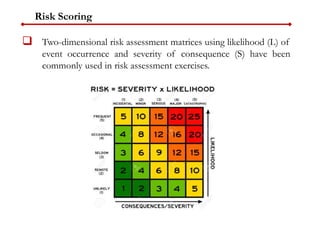
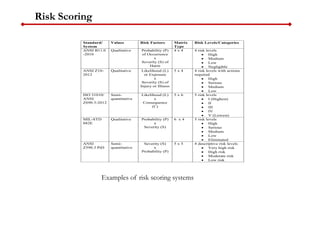
Program Objectives
In light of industrialization trends across the globe, new hazards are constantly introduced in many workplaces. This program aims to provide Young Safety Professionals (YSPs) from diverse backgrounds with the requisite skill to address the health and safety hazards in the modern workplace.
2. Introduction
‘Risk analysis’ is the second step of the risk assessment process.
Risk analysis consists of determining the consequences and their
probabilities for identified risk events, taking into account the
presence (or not) and the effectiveness of any existing controls.
The consequences and their probabilities are then combined to
determine a level of risk. (ANSI/ASSE Z690.3-2011)
The purpose of analyzing risk is to gain an understanding of the
risks that are of importance to the organization.
ANSI Z590.3 Hazard and Risk Analysis Process
4. Risk Factors
Risk factors are the components of risk derived from an
identified hazard that are estimated and measured to produce a
risk score.
Risk assessments generally have two-dimensional risk scoring
systems, which use two risk factors such as:
Severity of consequence (S)
Likelihood (L) or probability
(P) of occurrence.
5. Other Risk Factors
Risk factors used in various three and four dimensional models.
Exposure (E) is used as a general measure of exposure events/units.
Frequency of Exposure (F) is used as a number of exposure events
for a unit of time.
Time Duration of Exposure (T) is used as a time period that a single
exposure occurs.
Vulnerability (V) is sometimes used in security threat analyses, and
generally refers to weaknesses in a system that are factored into the risk
estimation.
Detection of Failure (D) is used in many FMEA models as a third risk
factor in the risk level scoring system. The detection rating is based on an
estimate of how easily the potential failure could be detected prior to its
occurrence.
Control Reliability (CR) is used in machine risk assessments and
factors the reliability of a selected control into the risk estimation.
Prevention Effectiveness (PE) is a risk factor sometimes used in
FMEA and other methods to evaluate a controls effectiveness in
preventing a failure from occurring.
6. Consequence Analysis
Consequences are the results, outcomes or losses of an event
caused by a hazard(s).
Consequences most often refer to the damage or harm caused to
people, assets/property or the environment.
The assessment team determines the nature and type of
consequences that could result for exposure to a particular
hazard or event.
A single hazard or event may produce a number of impacts with
various magnitudes (levels of severity), and could affect multiple
assets or stakeholders.
The assessment’s context determines the types of consequence
analyzed and stakeholders affected.
Risk should be evaluated for the worst credible case rather than worst
conceivable risk.
7. Consequence Analysis
Consequences are the results, outcomes or losses of an event
caused by a hazard(s).
As a primary risk factor, the ‘severity levels’ of consequences to
be used in an assessment must be determined upfront, during the
development of the context. This will include the types of
consequences and levels of severity.
It is important that severity categories are clearly defined so that
consequences can be consistently ranked or scored by the risk
assessment team. Severity Category Injury/Illness Levels Financial Loss Levels
Catastrophic (4) Fatality(s) or permanent total
disability
More than $1M
Critical (3) Hospitalizations, permanent-
partial or temporary disability
in excess of three months
$100K - $1M
Marginal (2) Recordable Injury/Illness,
minor injury, lost workday
incident
$10K - $100K
Negligible (1) First Aid or minor medical
treatment
$0 - $10K
An example of risk severity
categories with descriptions
9. Consequence Analysis
N.B. For Quantitative Risk Assessment (QRA), there is a different
approach for consequence analysis. See the following resources for
more information:
https://www.dnvgl.com/Images/Introduction%20to%20Consequence%20
Modelling%20presentation%20slides_tcm8-86022.pdf
https://www.epa.gov/cameo/aloha-software
https://arshadahmad.files.wordpress.com/2016/09/raam-p7l2aloha.pdf
https://arshadahmad.wordpress.com/process-safety/quantitative-risk-
assessment/
https://arshadahmad.wordpress.com/mkkh1213-risk-assessment-accident-
modeling/
https://www.icheme.org/media/1557/a5-leaflet-flyer-
4pp_consequenciesmodellingtechniques_web.pdf
10. Likelihood Analysis
Determining probability or likelihood generally involves:
1. a review of relevant historical data to identify events or
situations which have occurred;
2. predictive type techniques such as fault tree analysis and
event tree analysis and;
3. a structured systematic process guided by a qualified,
knowledgeable expert(s).
Any available data used should be relevant to the focus of the
assessment.
11. Likelihood Analysis
Descriptions of likelihood of risk
Risk Level Likelihood of
Occurrence (L)
Description
5 Frequent Almost certain to occur. Has occurred more than once
within the last 12 months. Conditions exist for it to
occur.
4 Probable Very Likely to occur. Has occurred once within the
last 12 months. Conditions often exist for it to occur.
3 Occasional Likely to occur if conditions exist. Has occurred within
the last 24 months. Conditions can exist for it to occur.
2 Moderate May occur if conditions exist. Has occurred within the
last 36 months. Conditions sometimes exist for it to
occur.
1 Unlikely Unlikely to occur. Has not occurred within last 5 years.
Conditions rarely exist for it to occur.
Category description Time Period Frequency
Improbable Century Every 100 Years or more
Remote Decade Every 10 – 100 years
Occasional Annually Every 1 – 10 years
Probable Monthly Every 1 – 12 months
Frequent Weekly Every 1 – 4 weeks
12. Likelihood Analysis - Exposure
Where historical data shows a very low frequency of occurrence,
it may be difficult to properly estimate probability. Therefore, it
may be necessary to consider exposure frequency, time, and duration to
a certain hazard or event in the likelihood analysis.
Exposure is an indication of the extent to which the organization
is subject to the consequences based of the amount of exposure
in numbers.
Exposure can be measured as the frequency of an event or
exposure, its duration, and/or the assets exposed to risk.
Some of the variables for exposure might include:
the number of employees or people exposed
how frequent an activity is performed
the miles driven or number of vehicles used in transportation
the number of customers or products for a product risk assessment
the number of locations or facilities for a property risk assessment
13. Likelihood Analysis - Exposure
Descriptions of likelihood of risk considering the frequency of exposure and occurrence
16. Severity and Probability Descriptions- Example
Risk Level Likelihood of
Occurrence (L)
Description
5 Frequent Almost certain to occur. Has occurred more than once
within the last 12 months. Conditions exist for it to
occur.
4 Probable Very Likely to occur. Has occurred once within the
last 12 months. Conditions often exist for it to occur.
3 Occasional Likely to occur if conditions exist. Has occurred within
the last 24 months. Conditions can exist for it to occur.
2 Moderate May occur if conditions exist. Has occurred within the
last 36 months. Conditions sometimes exist for it to
occur.
1 Unlikely Unlikely to occur. Has not occurred within last 5 years.
Conditions rarely exist for it to occur.
Risk Level Severity of
Consequence (S)
Description
4 Catastrophic One or more fatalities; multiple serious
hospitalizations; incident resulting in more than $250 K
3 Critical Disabling injury or illness; permanent impairment;
incident resulting in more than $ 50 K
2 Marginal Medical treatment or restricted work; recordable
incidents; incident resulting in more than $ 1 K
1 Low First aid or non-treatment incidents; incident resulting
in less than $ 1 K
Risk Level Risk Score Action
Very High 12 or greater Operation not permissible; immediate action required
High 8 to 10 Remedial action required; high priority
Moderate 4 to 6 Remedial action suggested
Low 1 to 3 Remedial action discretionary
17. Assessment of Controls
The adequacy and effectiveness of existing control measures
greatly affect the level of risk and must be assessed.
This assessment of controls should include determining the type
of controls for each specific risk, and a judgment of their
effectiveness based on the Hierarchy of Controls.
Risk Formula
Severity x (Likelihood x Protection Factor) = Risk
Protection Factor (PF) Multiplier
Elimination 0.1
Substitution 0.4
Engineering - Multiple 0.6
Engineering - Single 0.7
Warning 0.8
Administrative 0.9
PPE 0.95
No Controls 1
Example of controls’ protection factor
19. Risk Scoring
Two-dimensional risk assessment matrices using likelihood (L) of
event occurrence and severity of consequence (S) have been
commonly used in risk assessment exercises.
20. Risk Scoring
Standard/
System
Values Risk Factors Matrix
Type
Risk Levels/Categories
ANSI B11.0
-2010
Qualitative Probability (P)
of Occurrence
x
Severity (S) of
Harm
4 x 4 4 risk levels
High
Medium
Low
Negligible
ANSI Z10-
2012
Qualitative Likelihood (L)
or Exposure
x
Severity (S) of
Injury or Illness
5 x 4 4 risk levels with actions
required
High
Serious
Medium
Low
ISO 31010/
ANSI
Z690.3-2012
Semi-
quantitative
Likelihood (L)
x
Consequence
(C)
5 x 6 5 risk levels
I (Highest)
II
III
IV
V (Lowest)
MIL-STD
882E
Qualitative Probability (P)
x
Severity (S)
6 x 4 5 risk levels
High
Serious
Medium
Low
Eliminated
ANSI
Z590.3 PtD
Semi-
quantitative
Severity (S)
x
Probability (P)
5 x 5 4 descriptive risk levels
Very high risk
High risk
Moderate risk
Low risk
Examples of risk scoring systems
21. Risk Scoring
Risk scoring systems with three or four risk factors are becoming
more common, adding a third or fourth factor such as failure
detectability, control effectiveness, vulnerability or other.
When three or more risk factors are used, a risk priority number
(RPN) is produced.
To more accurately score risk levels, Manuele proposes that
severity receive a 50% weighting to reflect the impact severity has
on incident outcomes. In the following equation, the rating for
occurrence probability and rating for frequency of exposure are
added together and then multiplied with severity.
Severity x (Probability + Frequency of Exposure) = Risk
Risk Priority Number = Severity x Likelihood x Detection