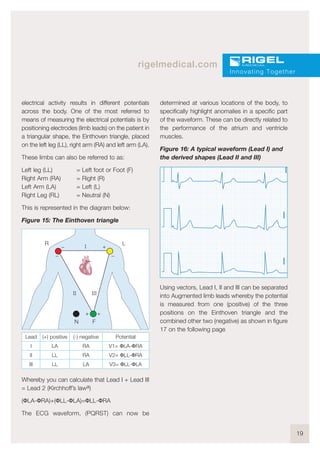
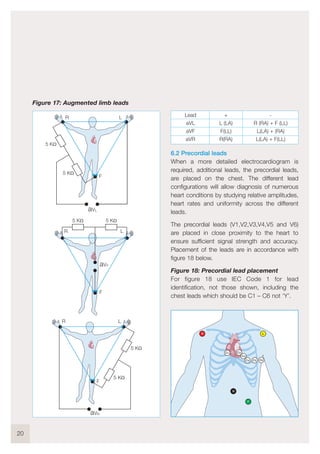
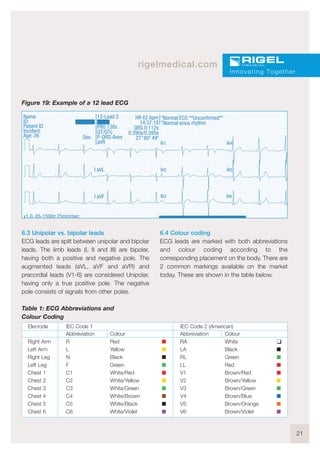
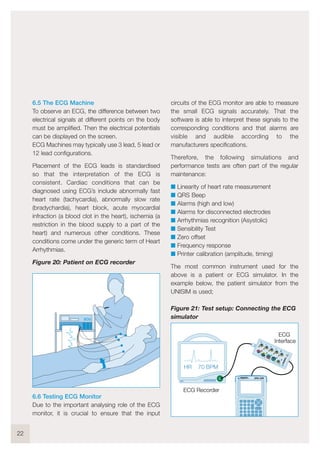
Downloaded 19 times

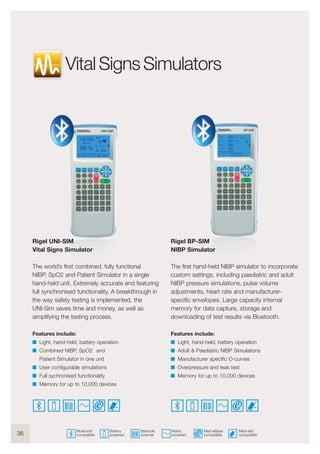
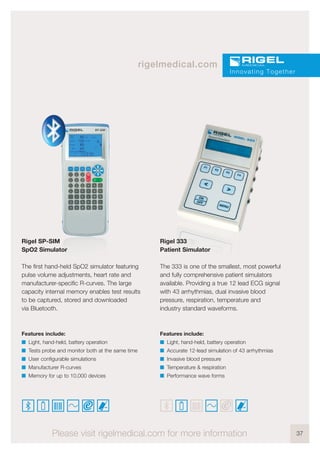
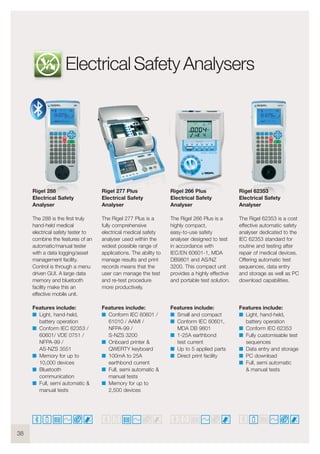
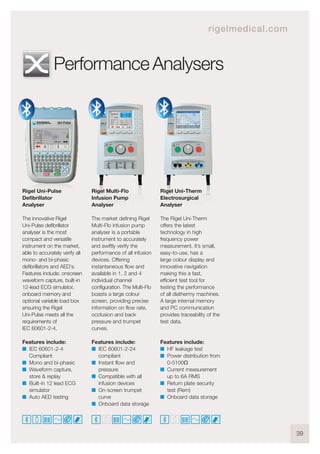


The document provides an introduction and guidelines for testing vital signs monitoring equipment. It describes the physiology of the respiratory system and circulation. It then discusses testing various vital signs monitoring functions, including non-invasive blood pressure (NIBP), invasive blood pressure (IBP), pulse oximetry (SpO2), electrocardiography (ECG), respiration, and temperature. The guidelines provide information on test setup and procedures for evaluating the accuracy, alarms, sensitivity and other performance characteristics of the monitoring equipment. Regular performance testing is recommended to ensure the equipment continues to provide accurate vital sign measurements.


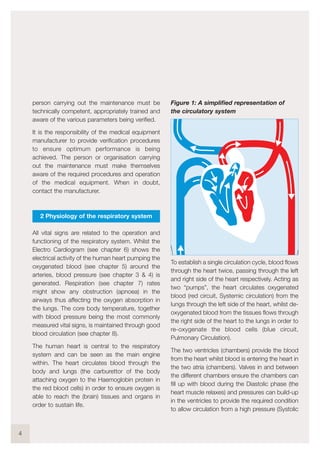
![5G Explained! A High Level Overview [Introduction]](https://cdn.slidesharecdn.com/ss_thumbnails/5gexplainedahighleveloverview-260119165306-cc137a3e-thumbnail.jpg?width=640&height=640&fit=bounds)


