Download as PDF, PPTX


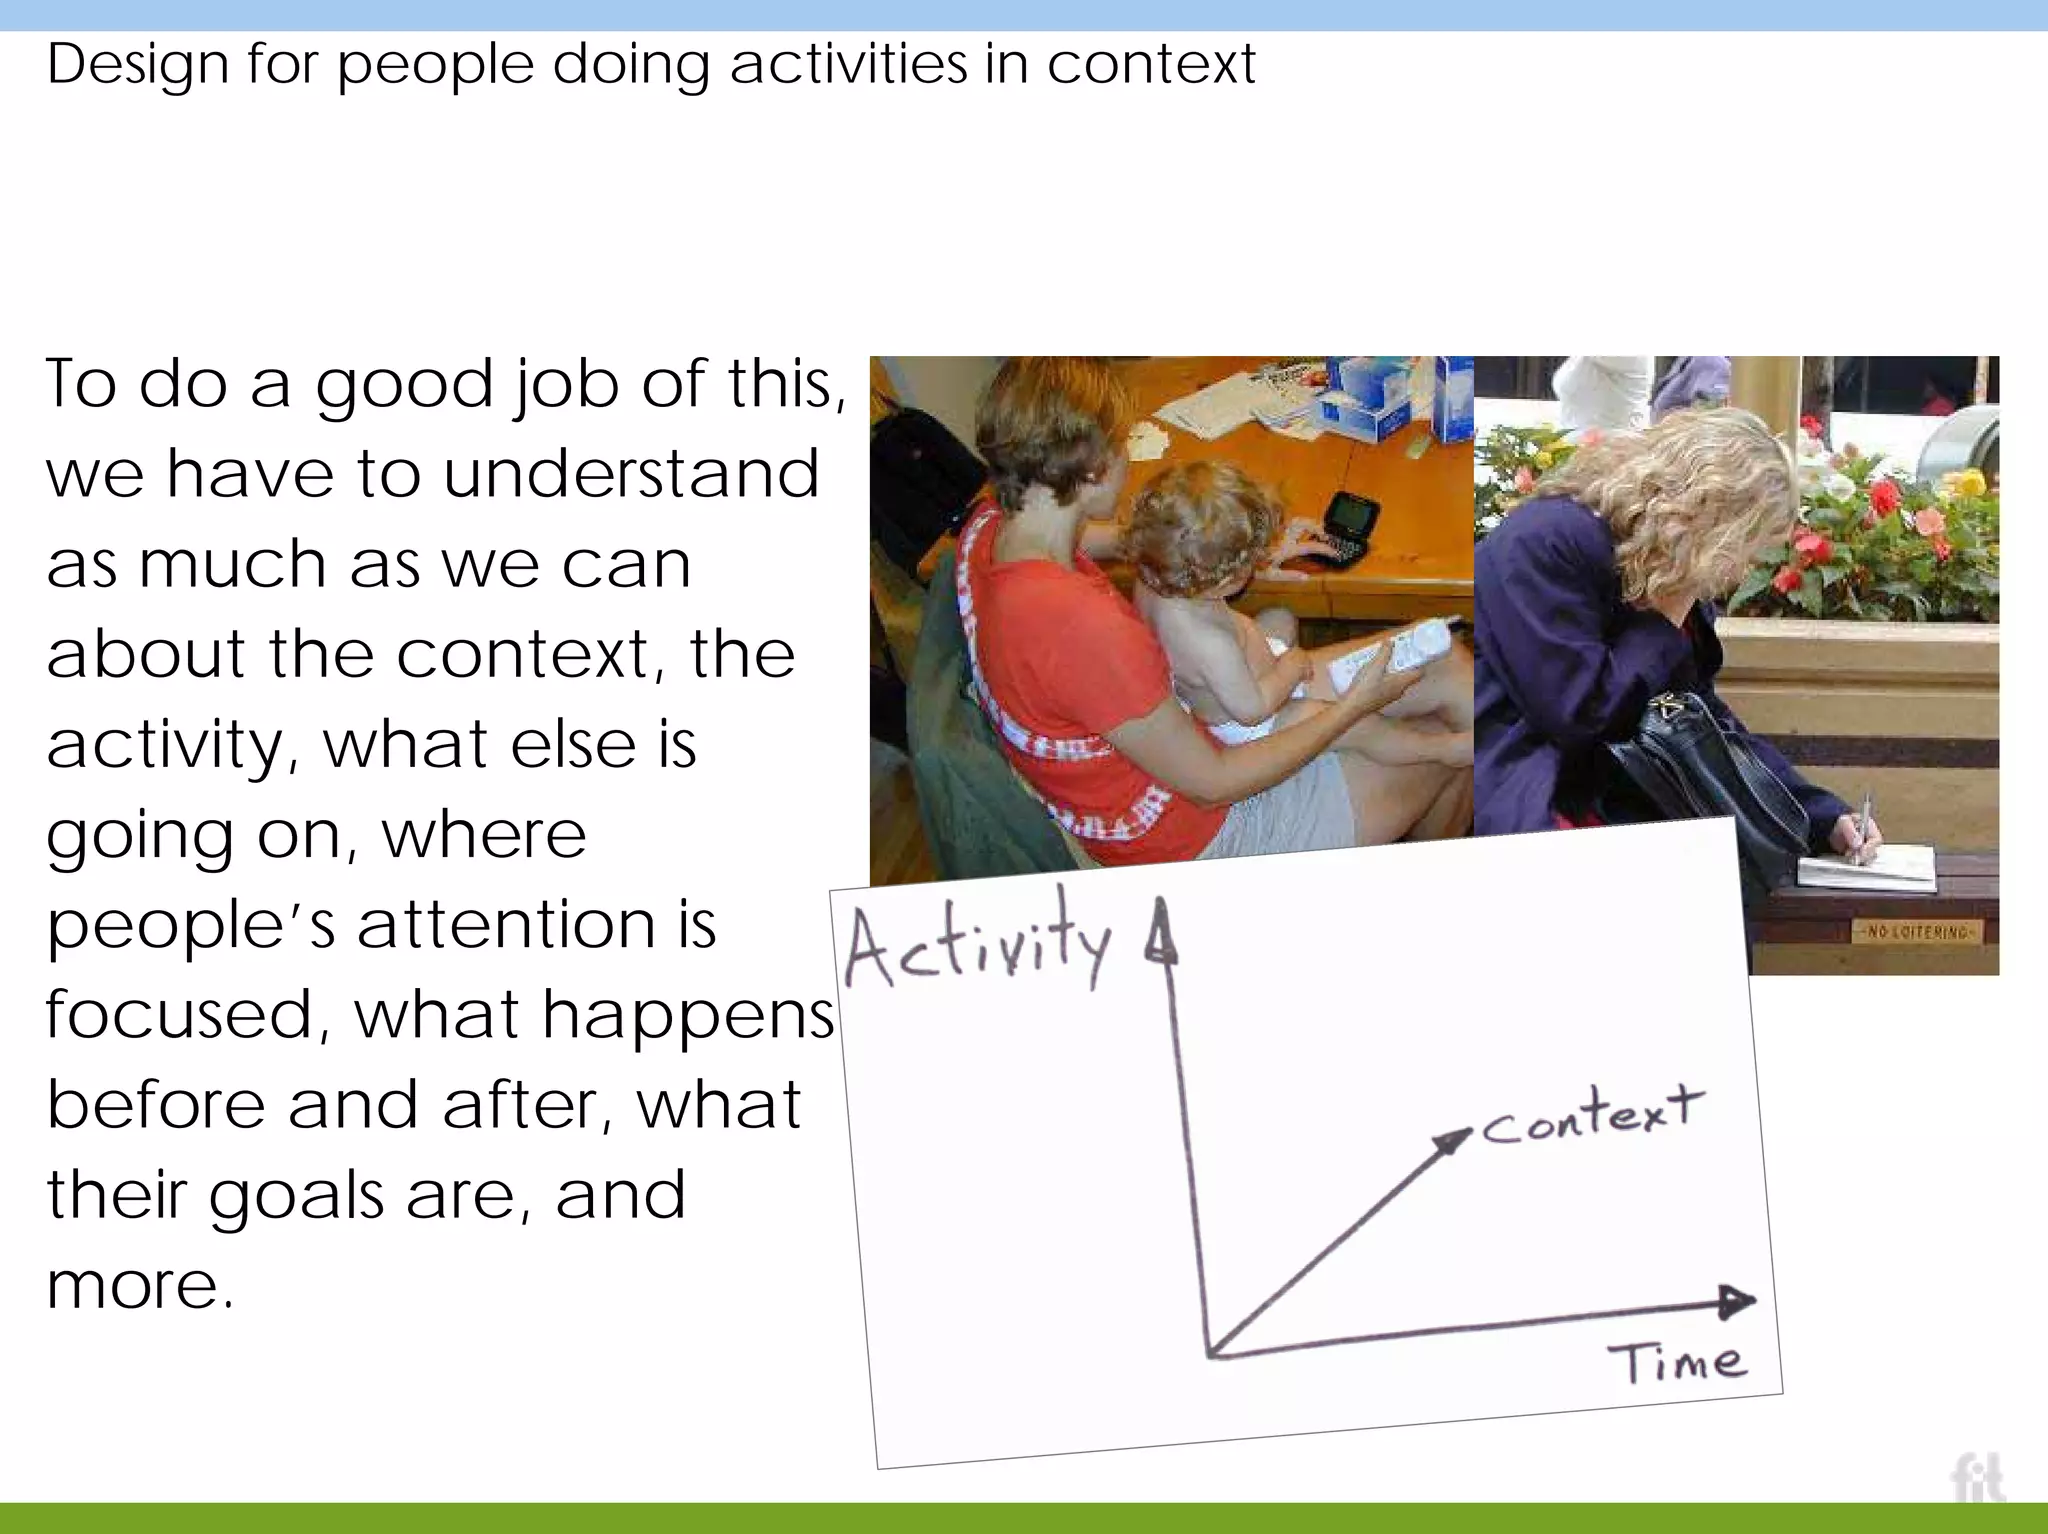


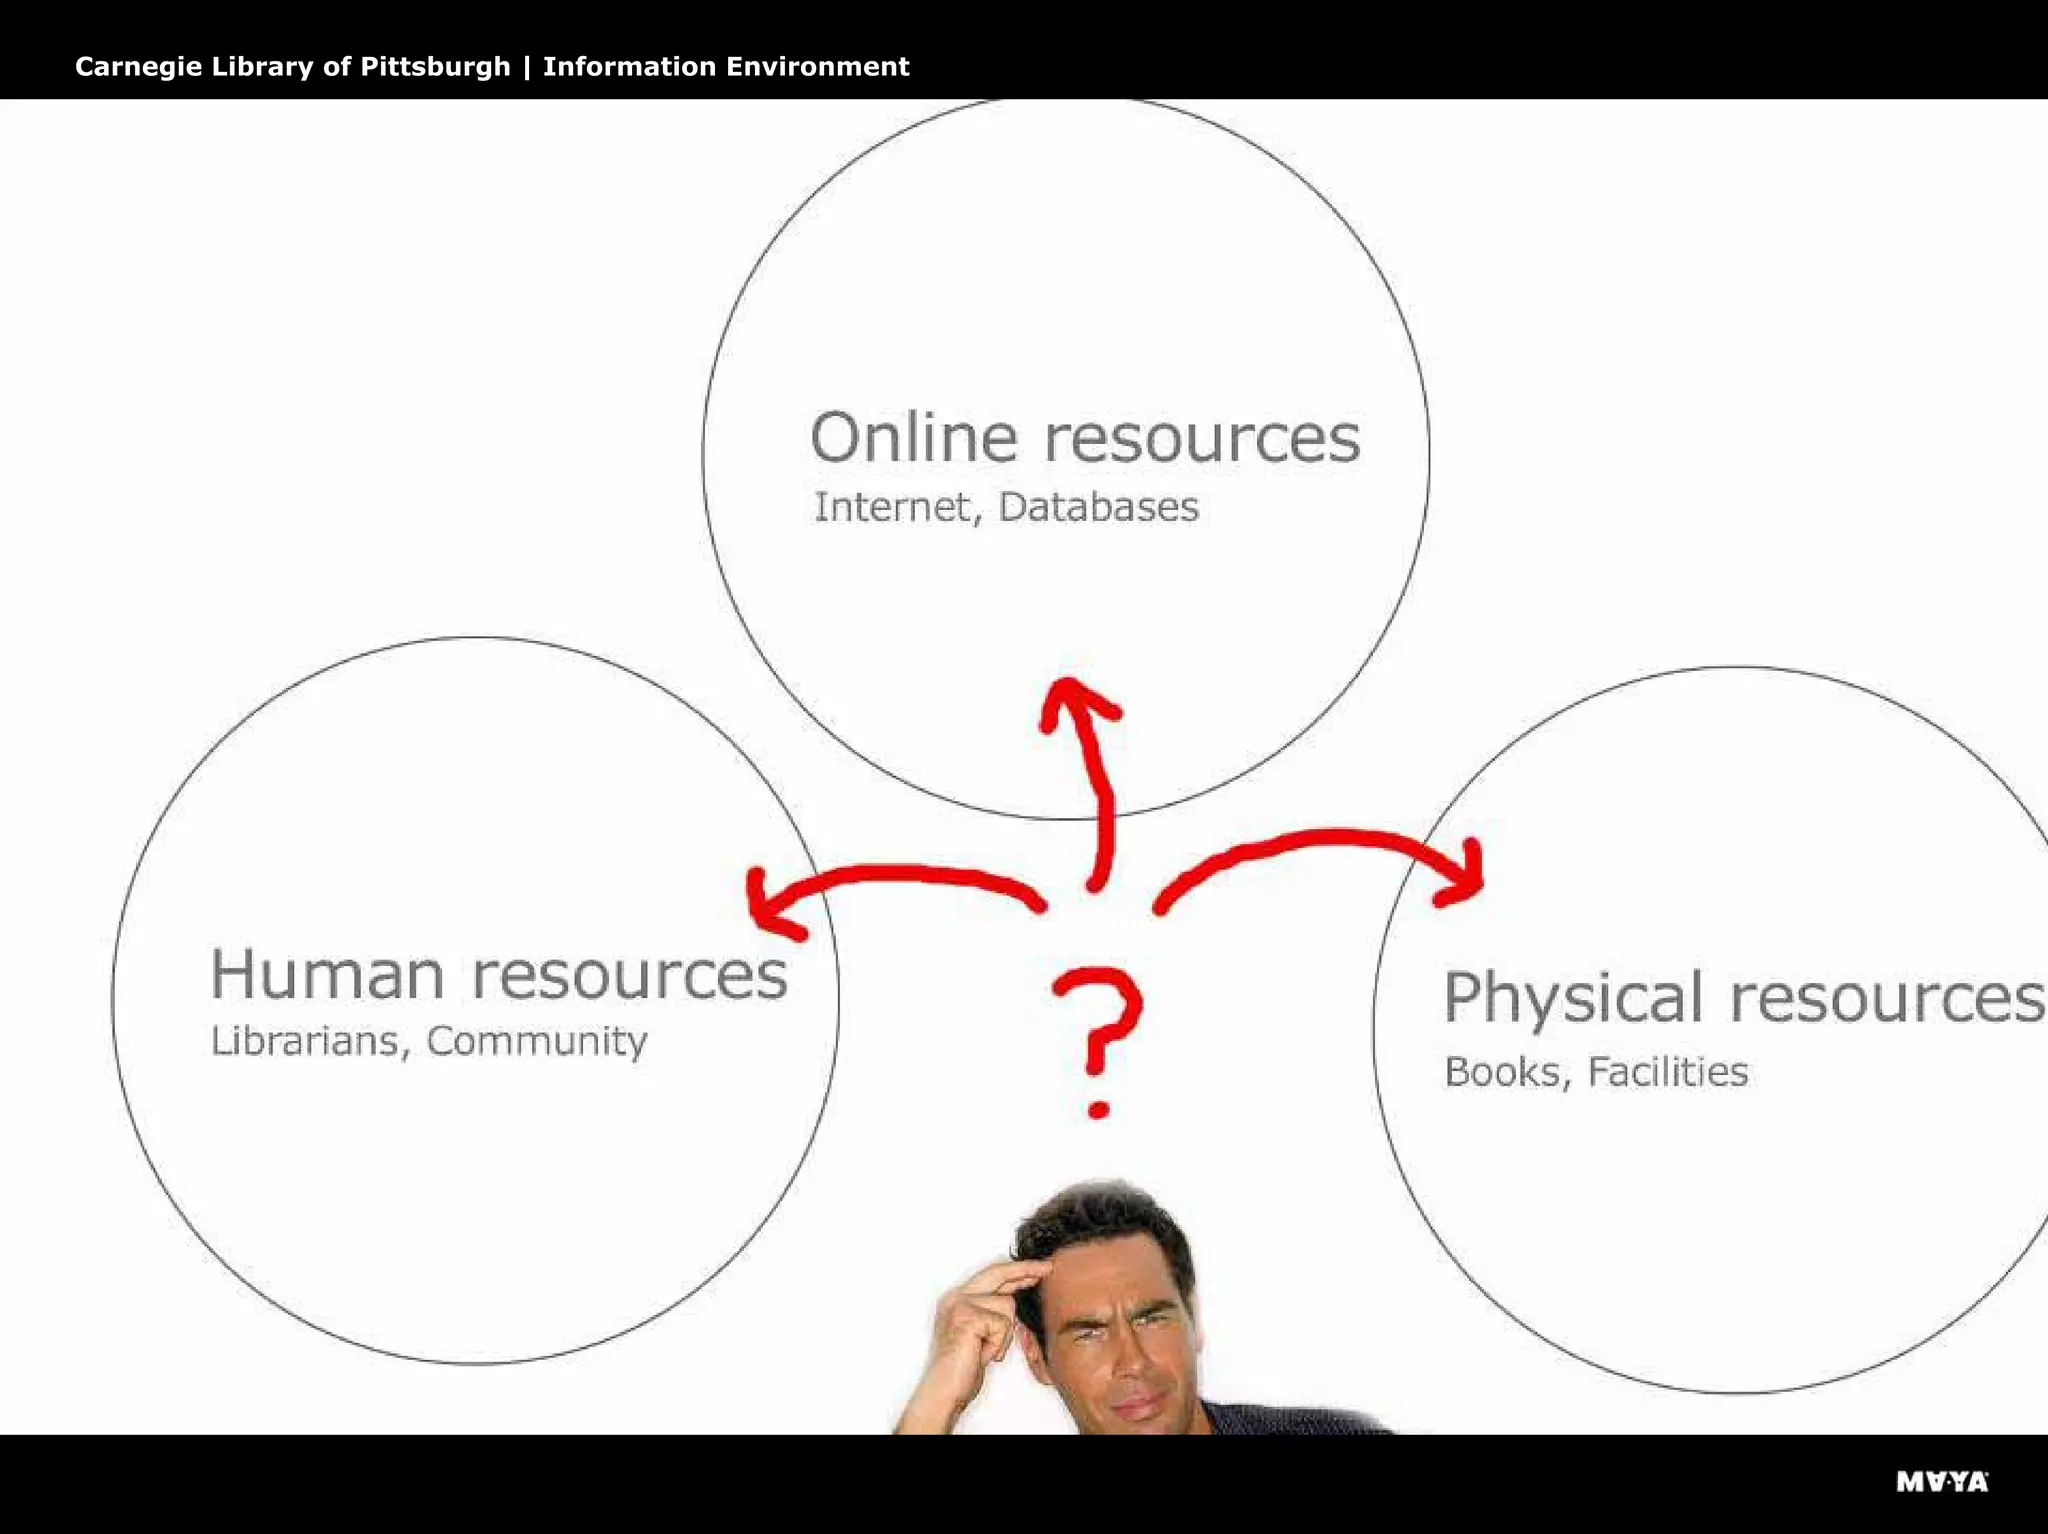


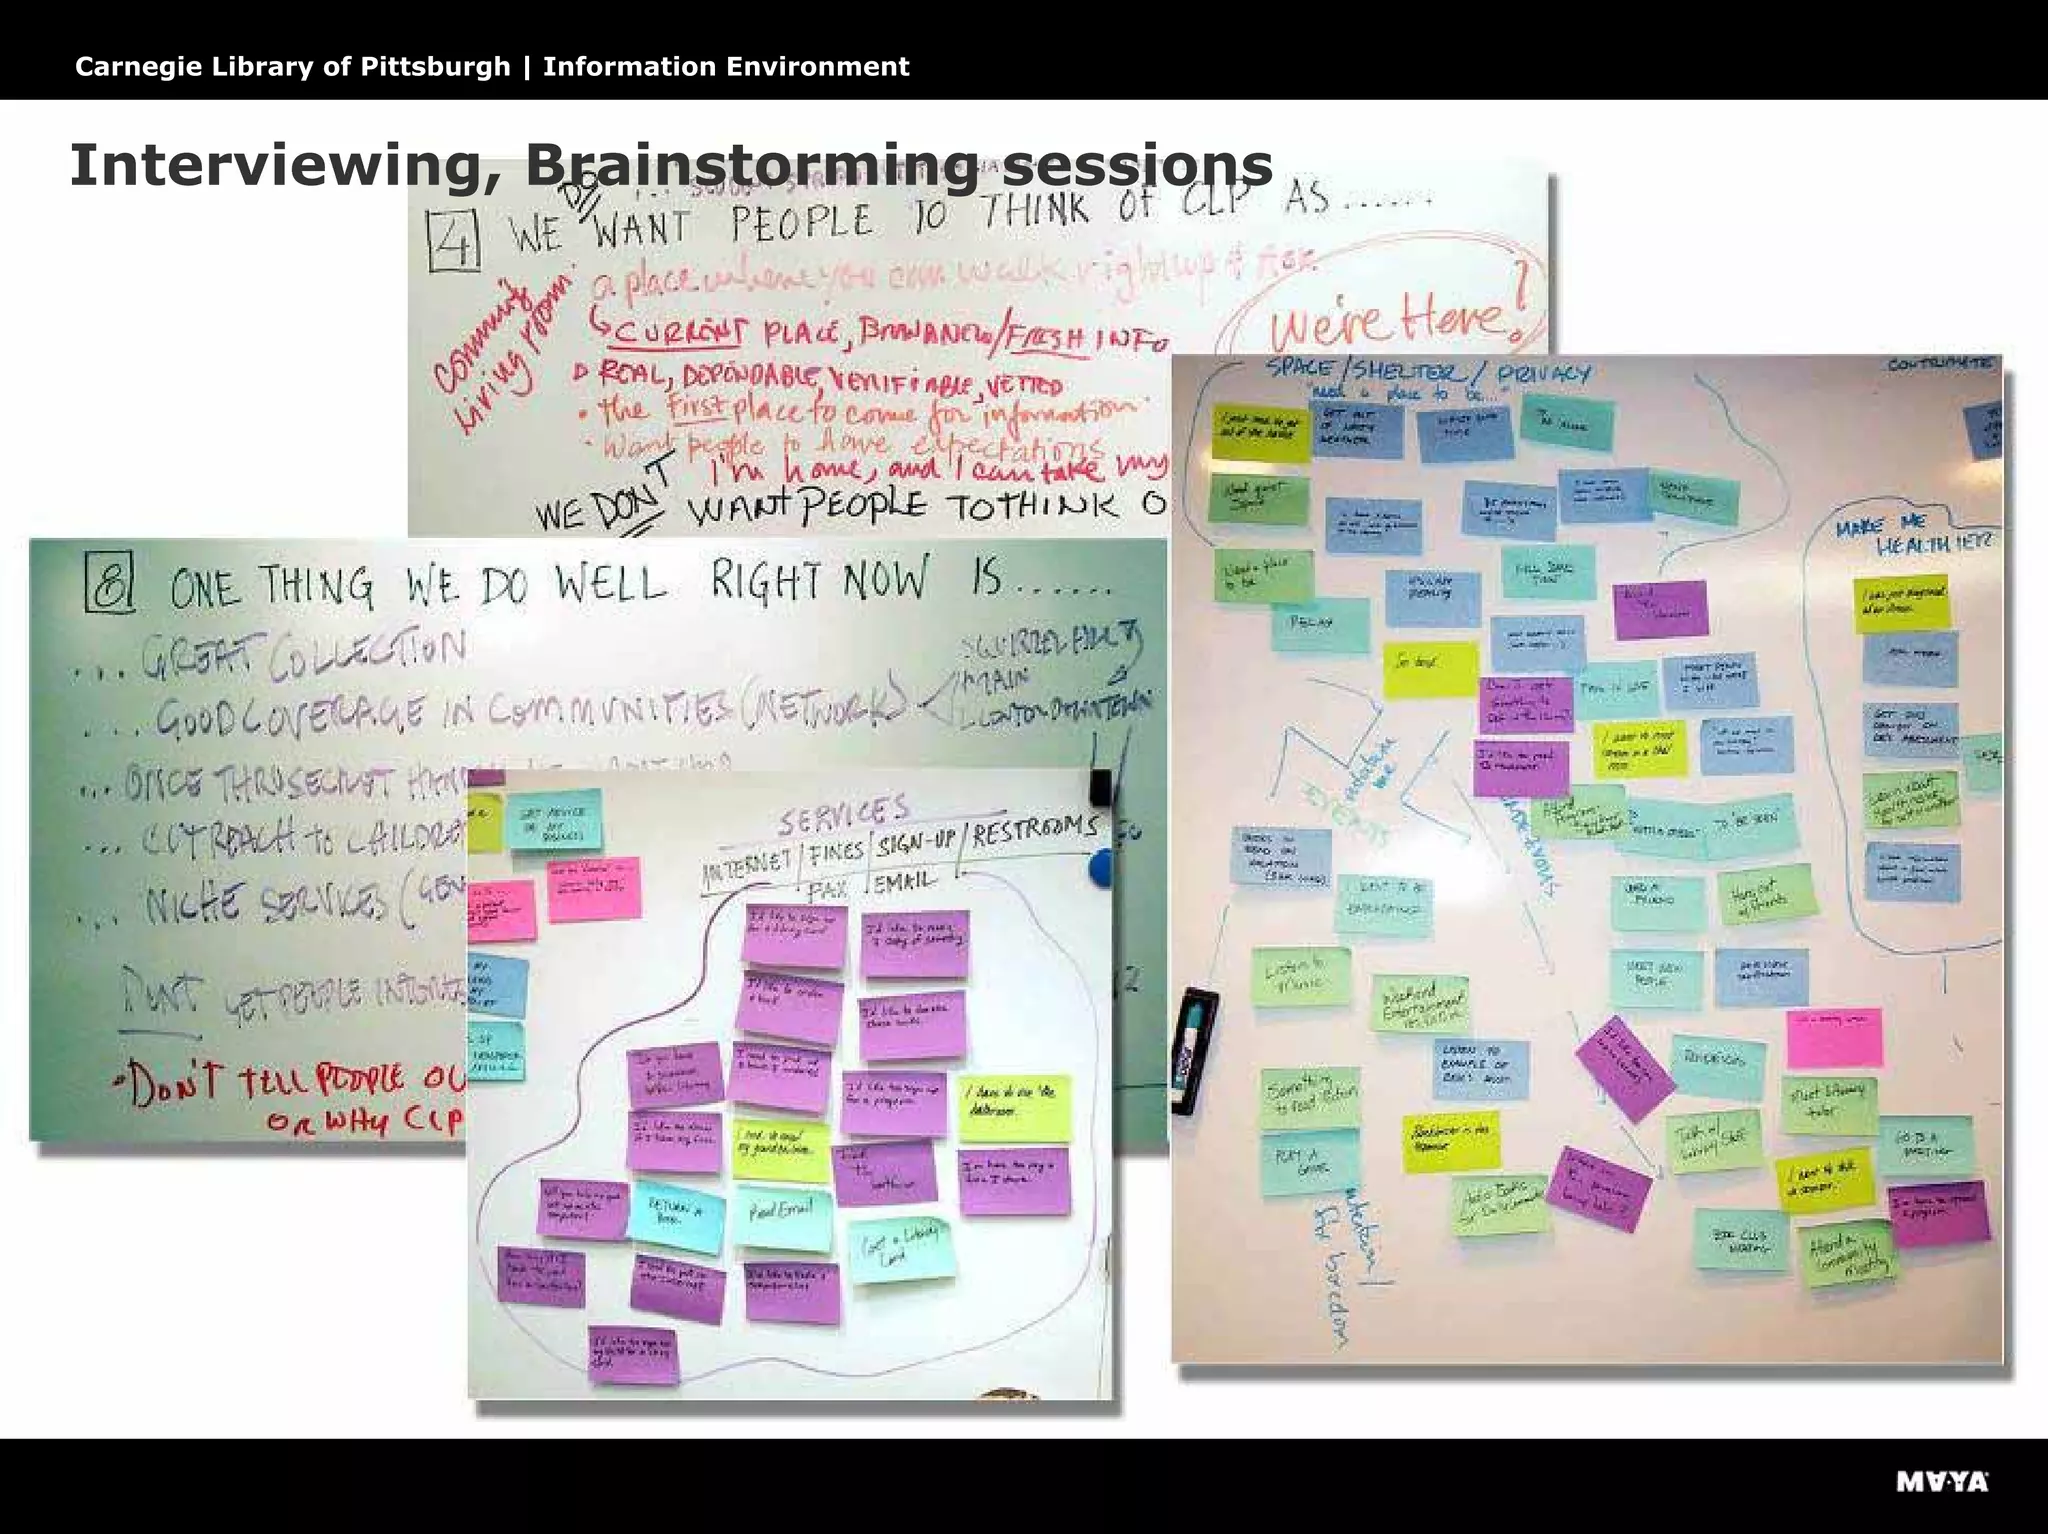


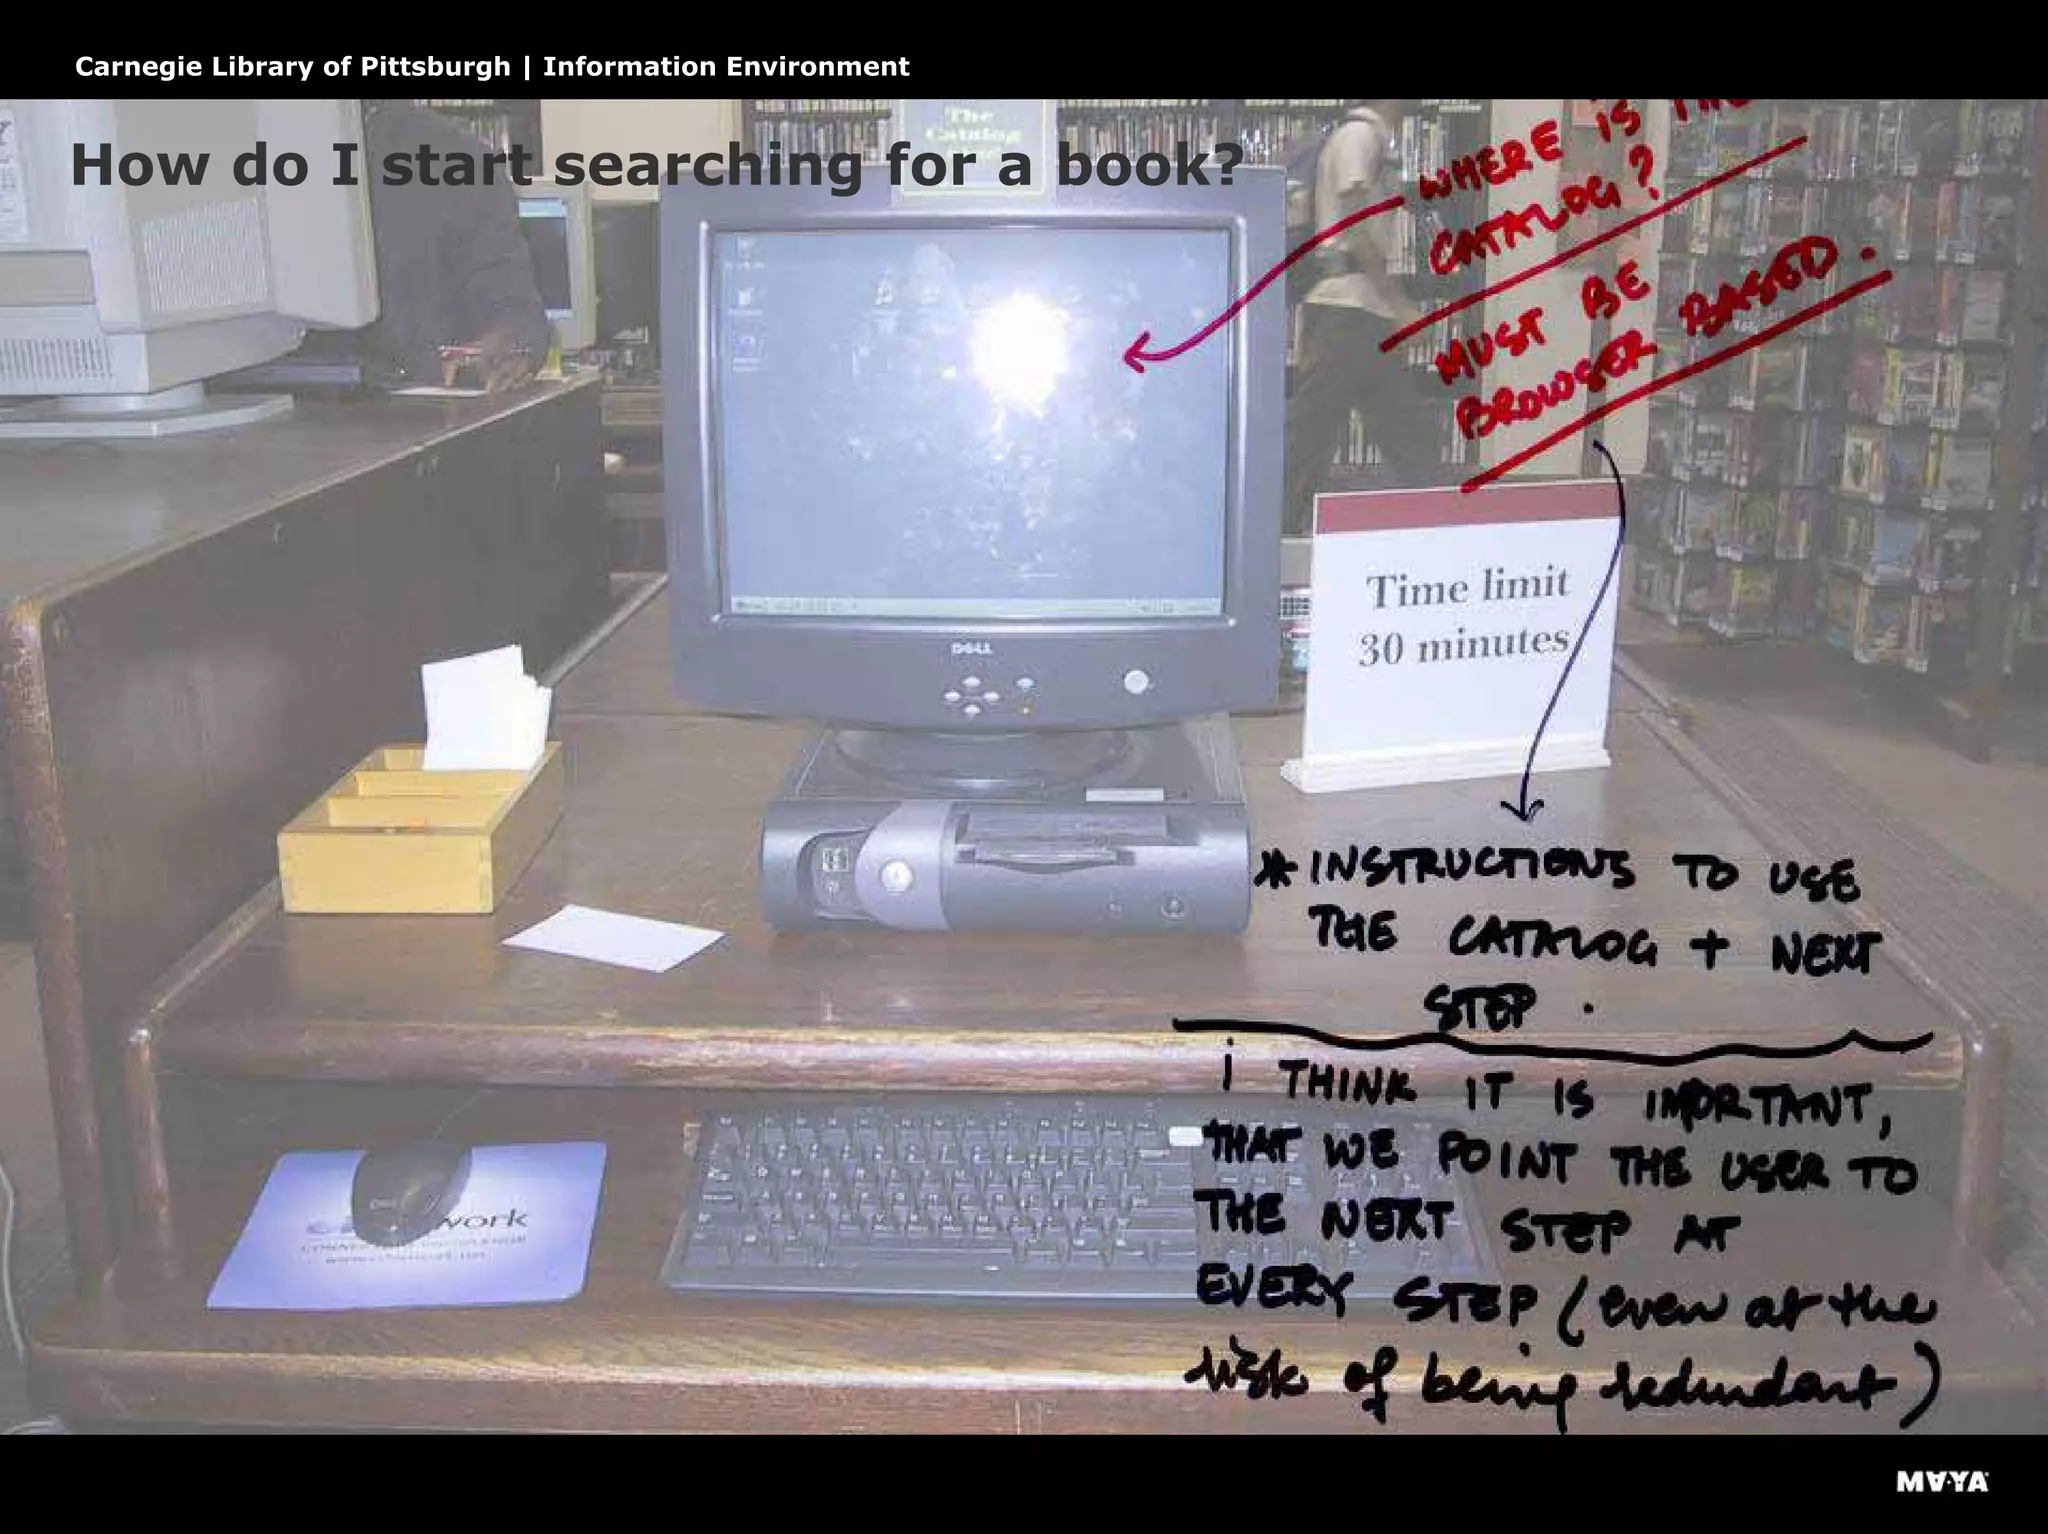
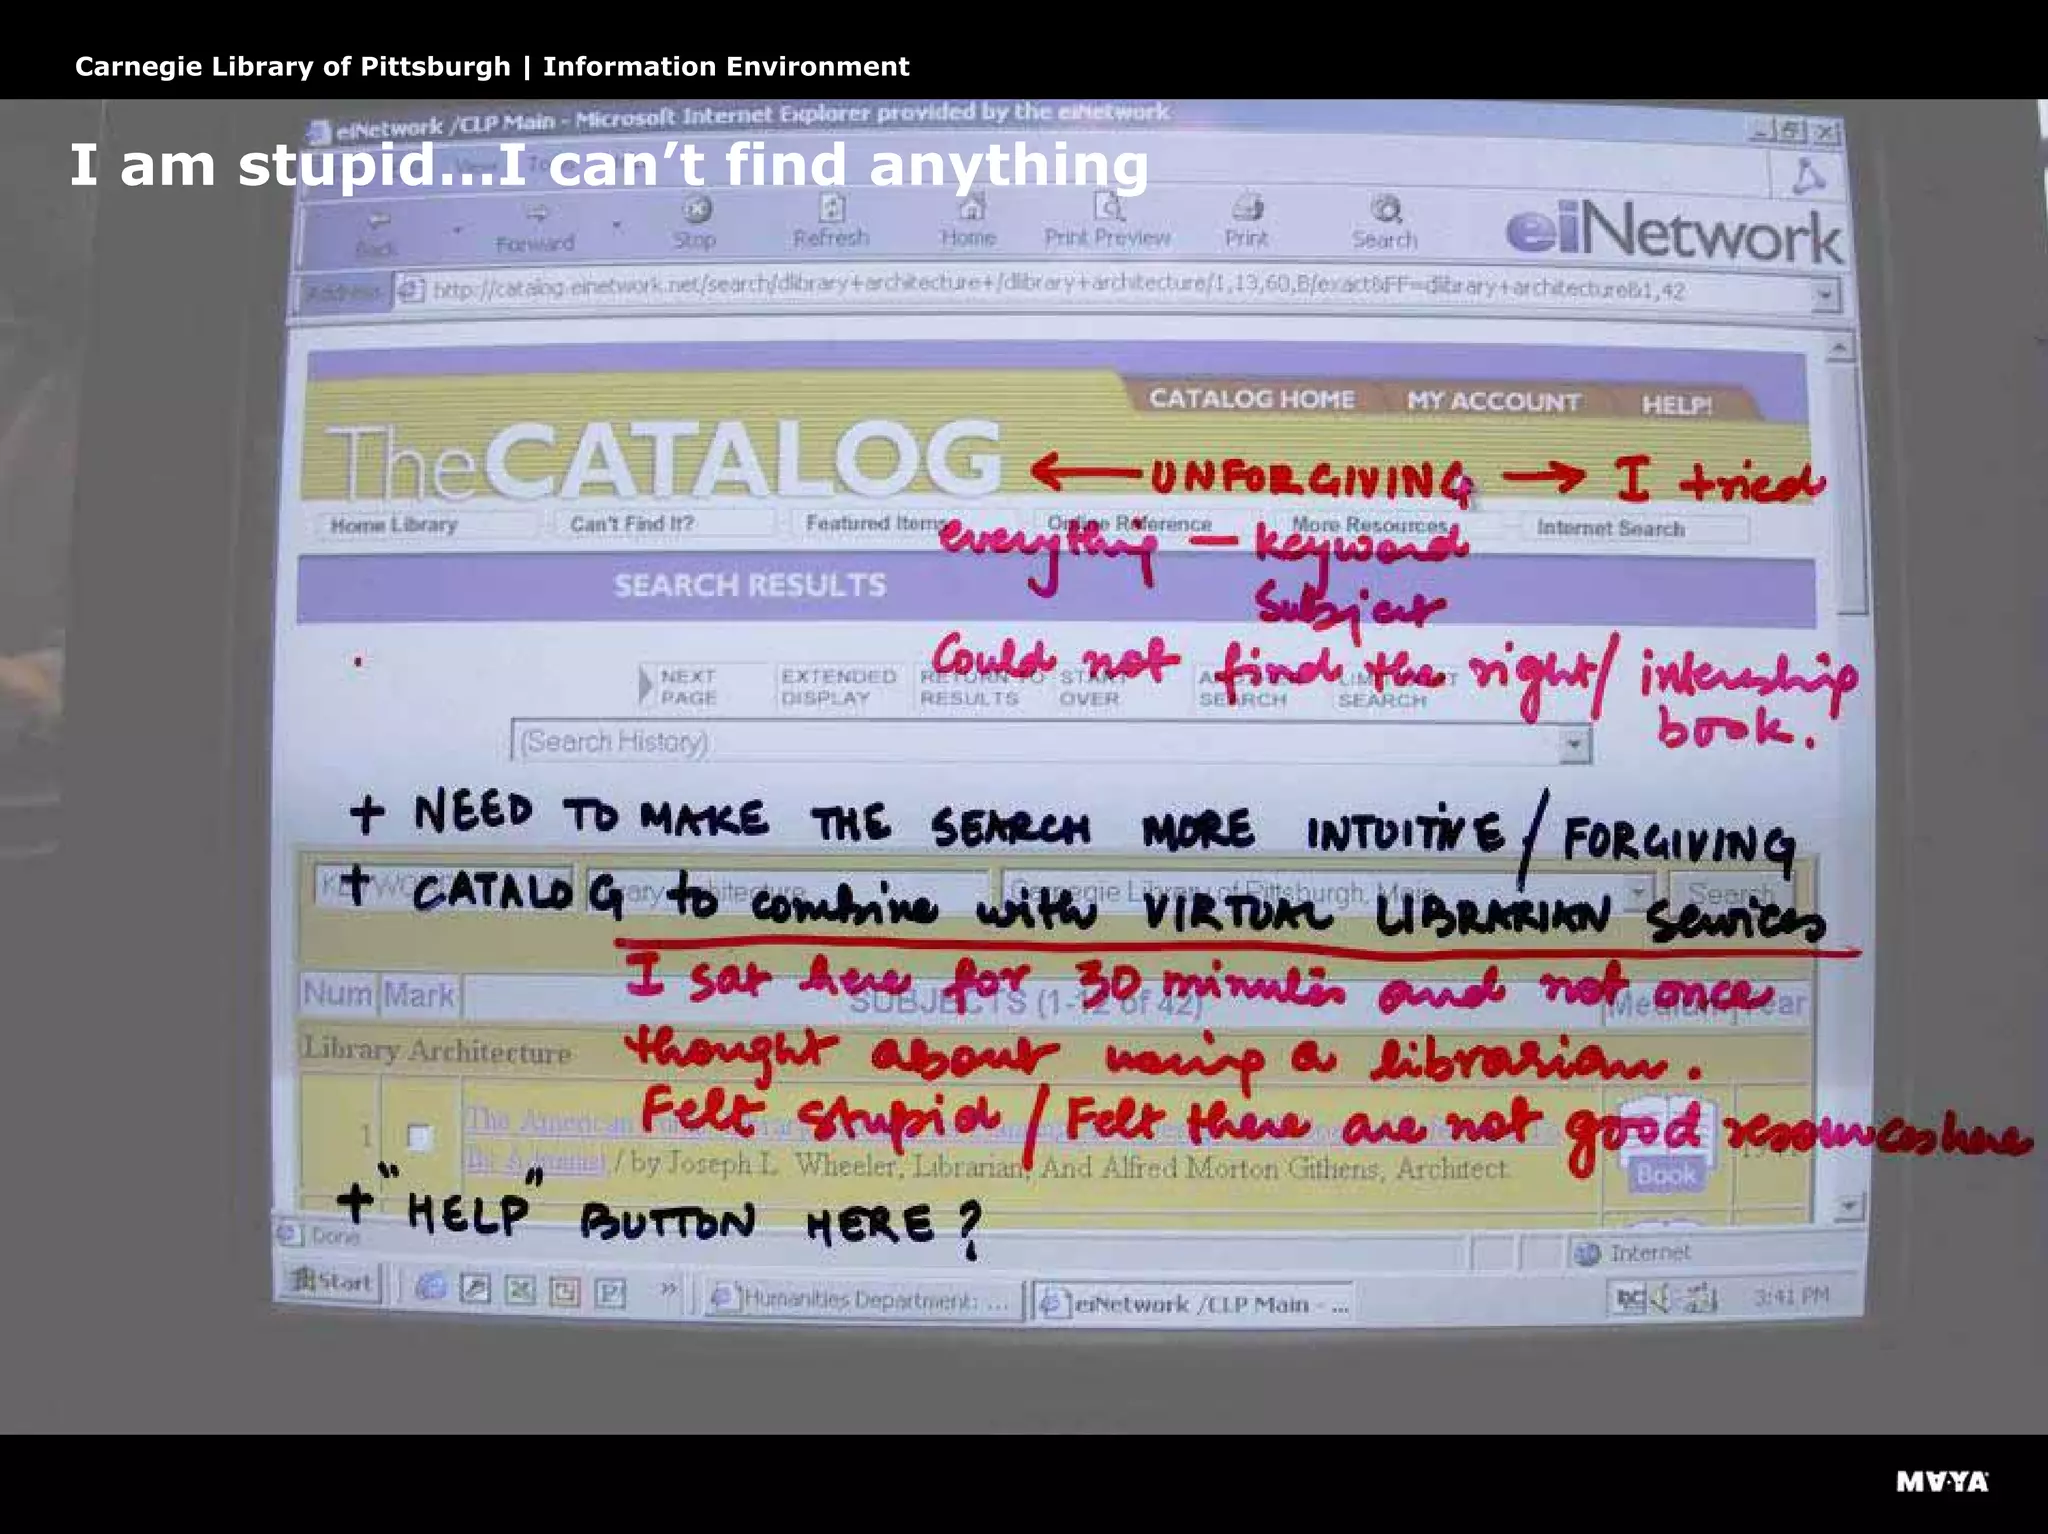

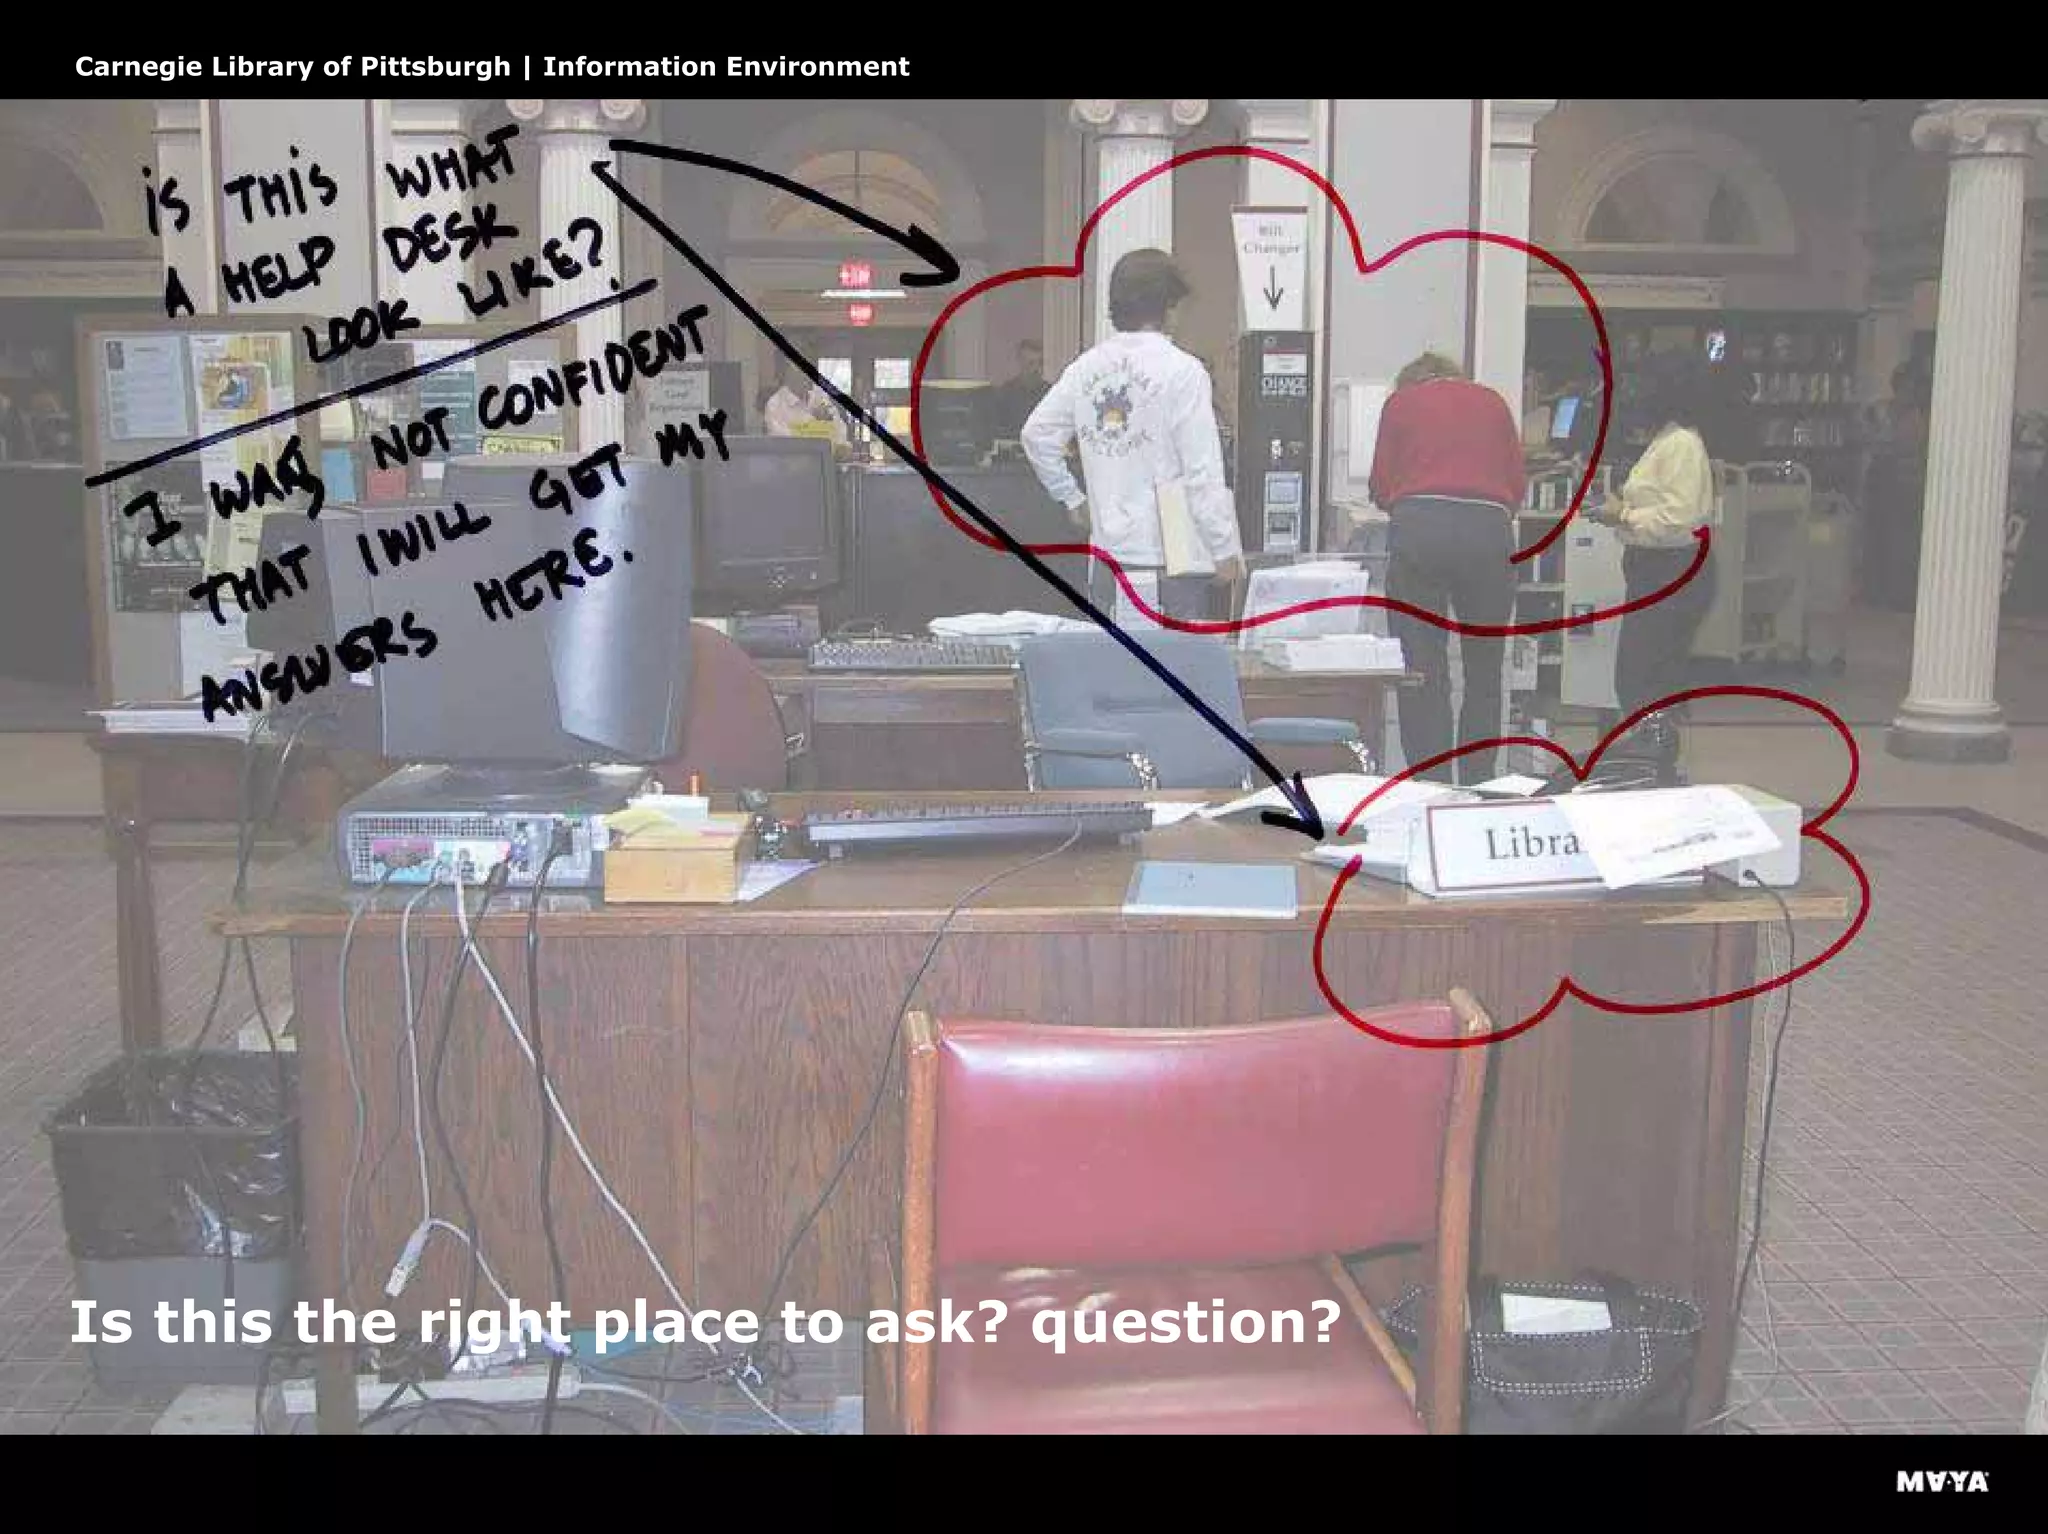

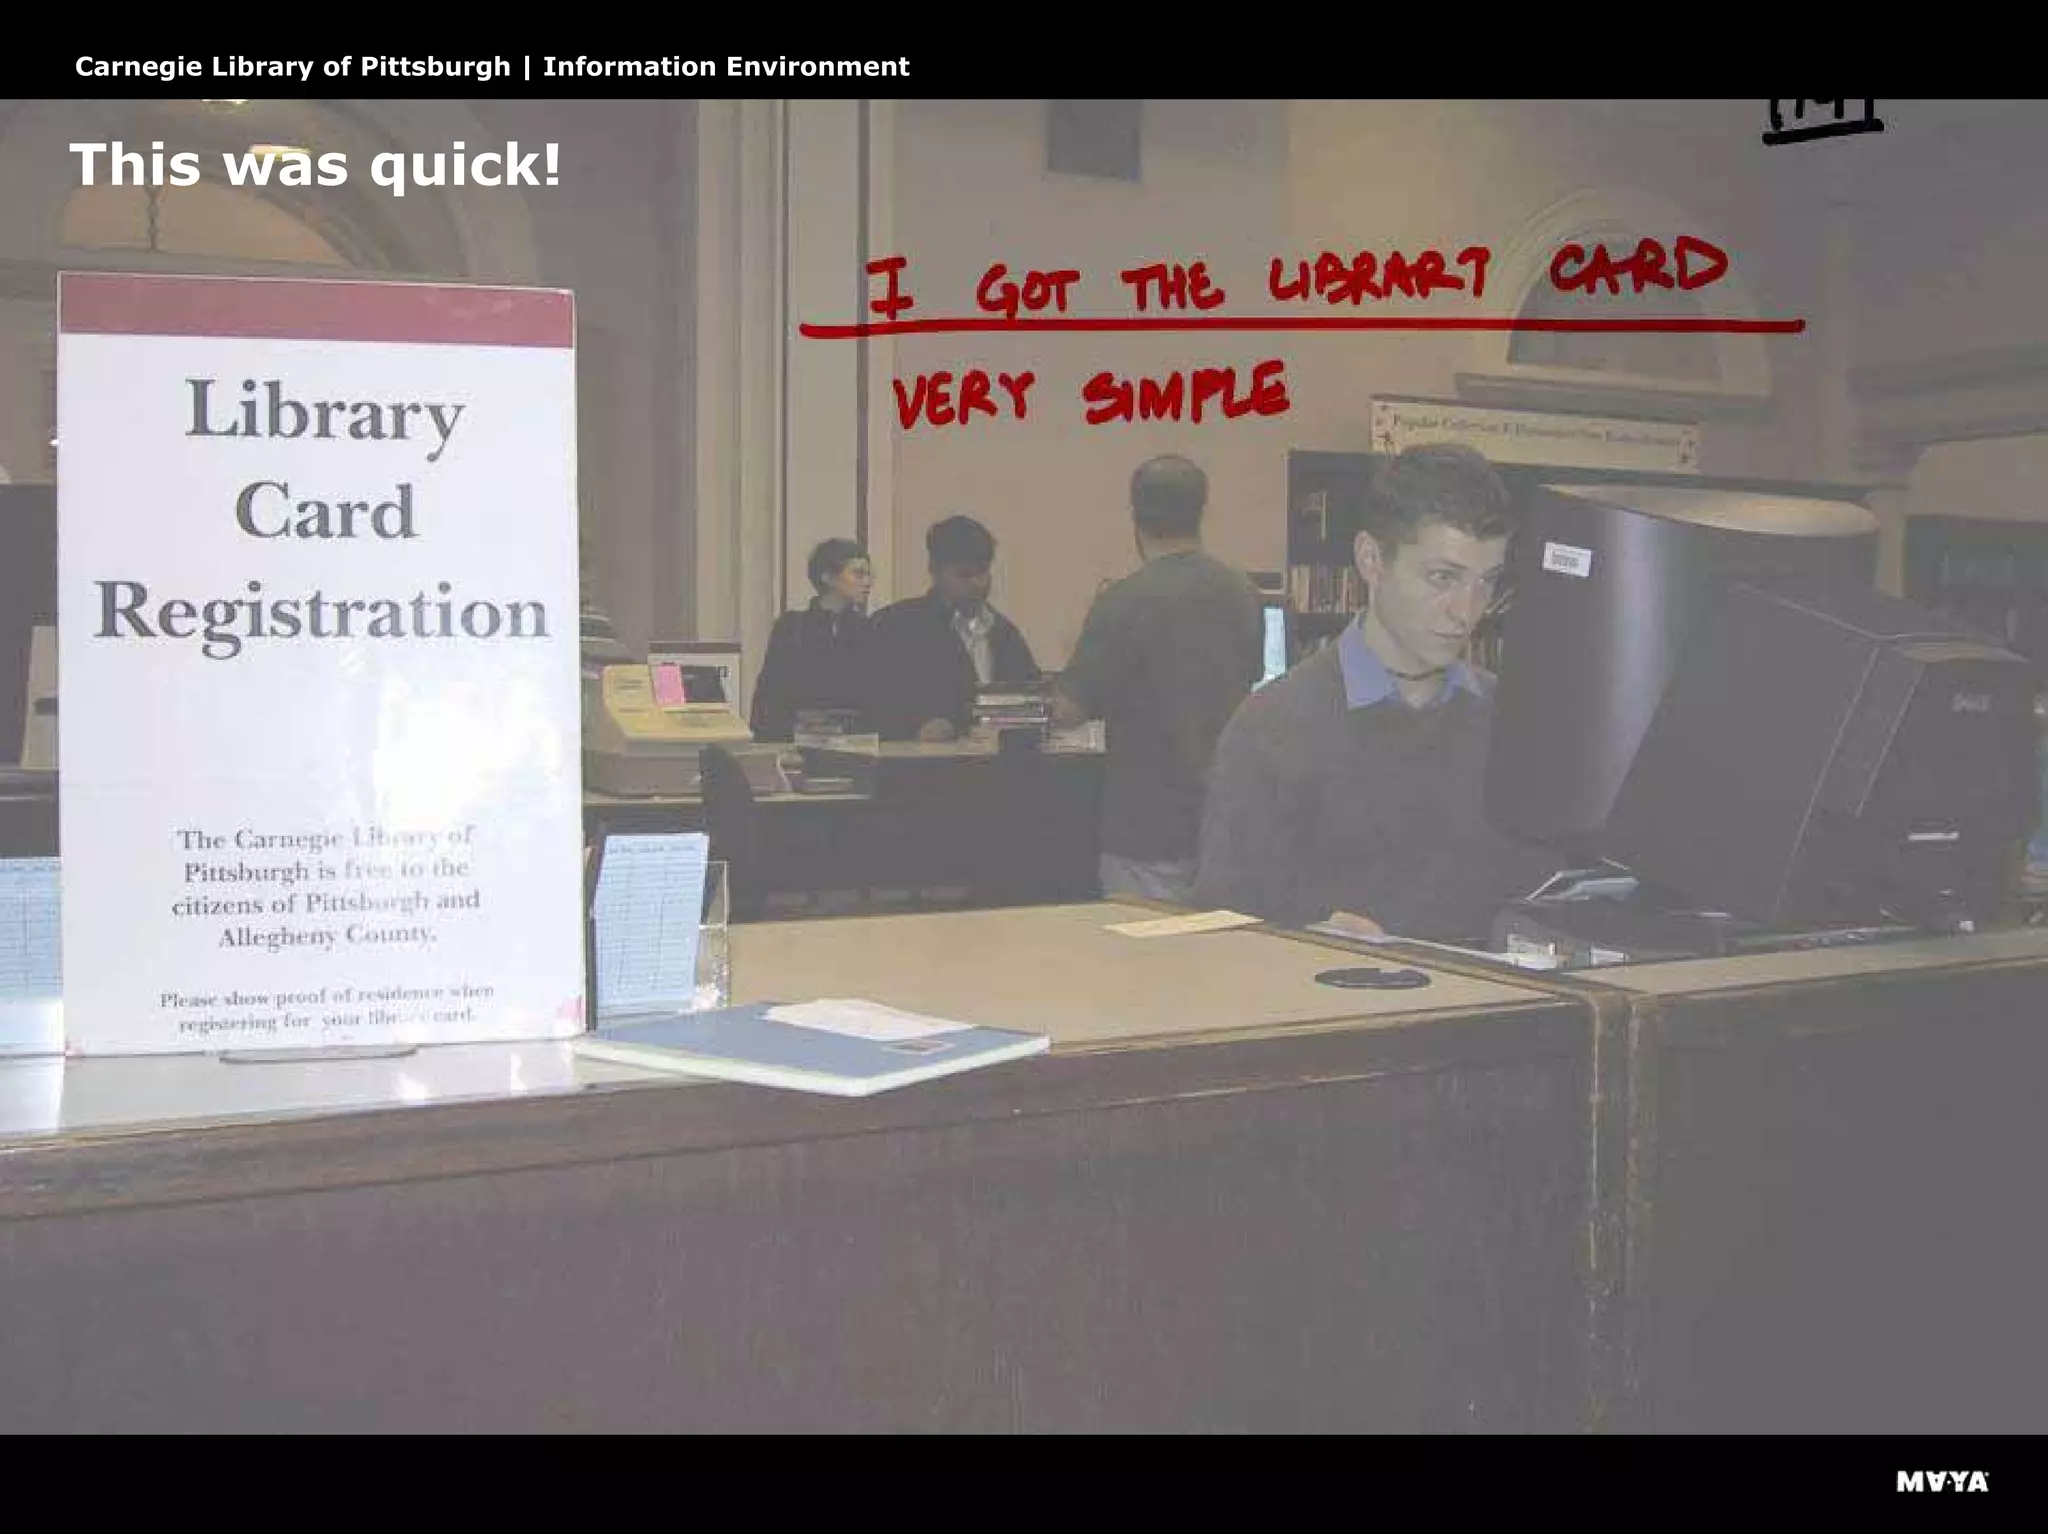
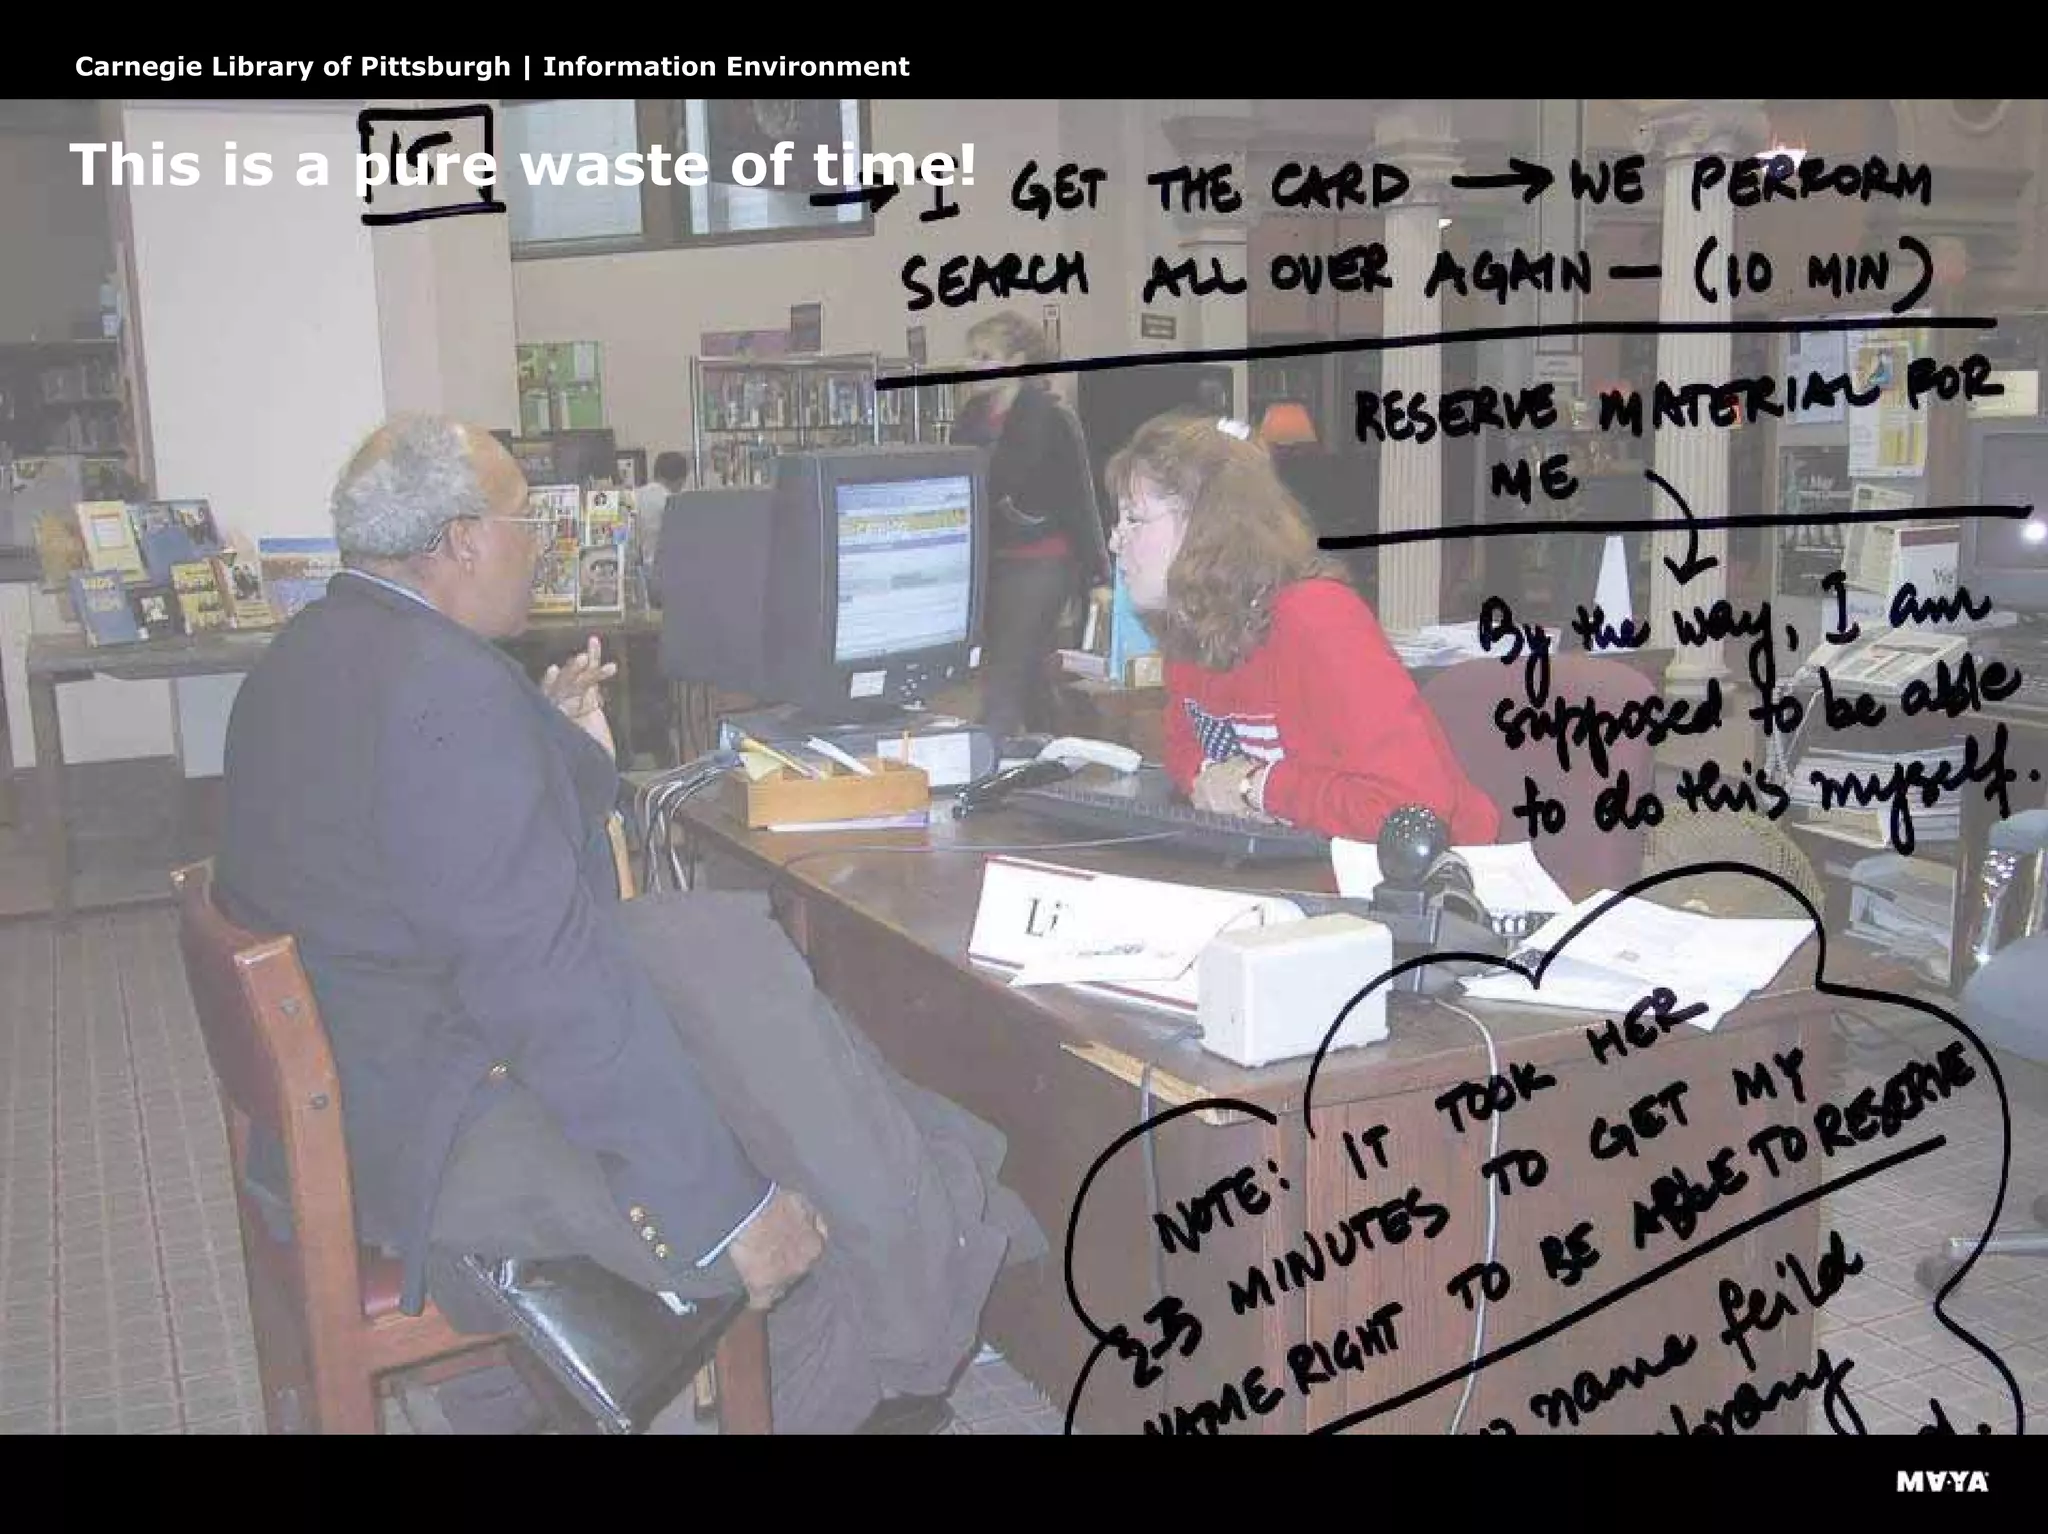
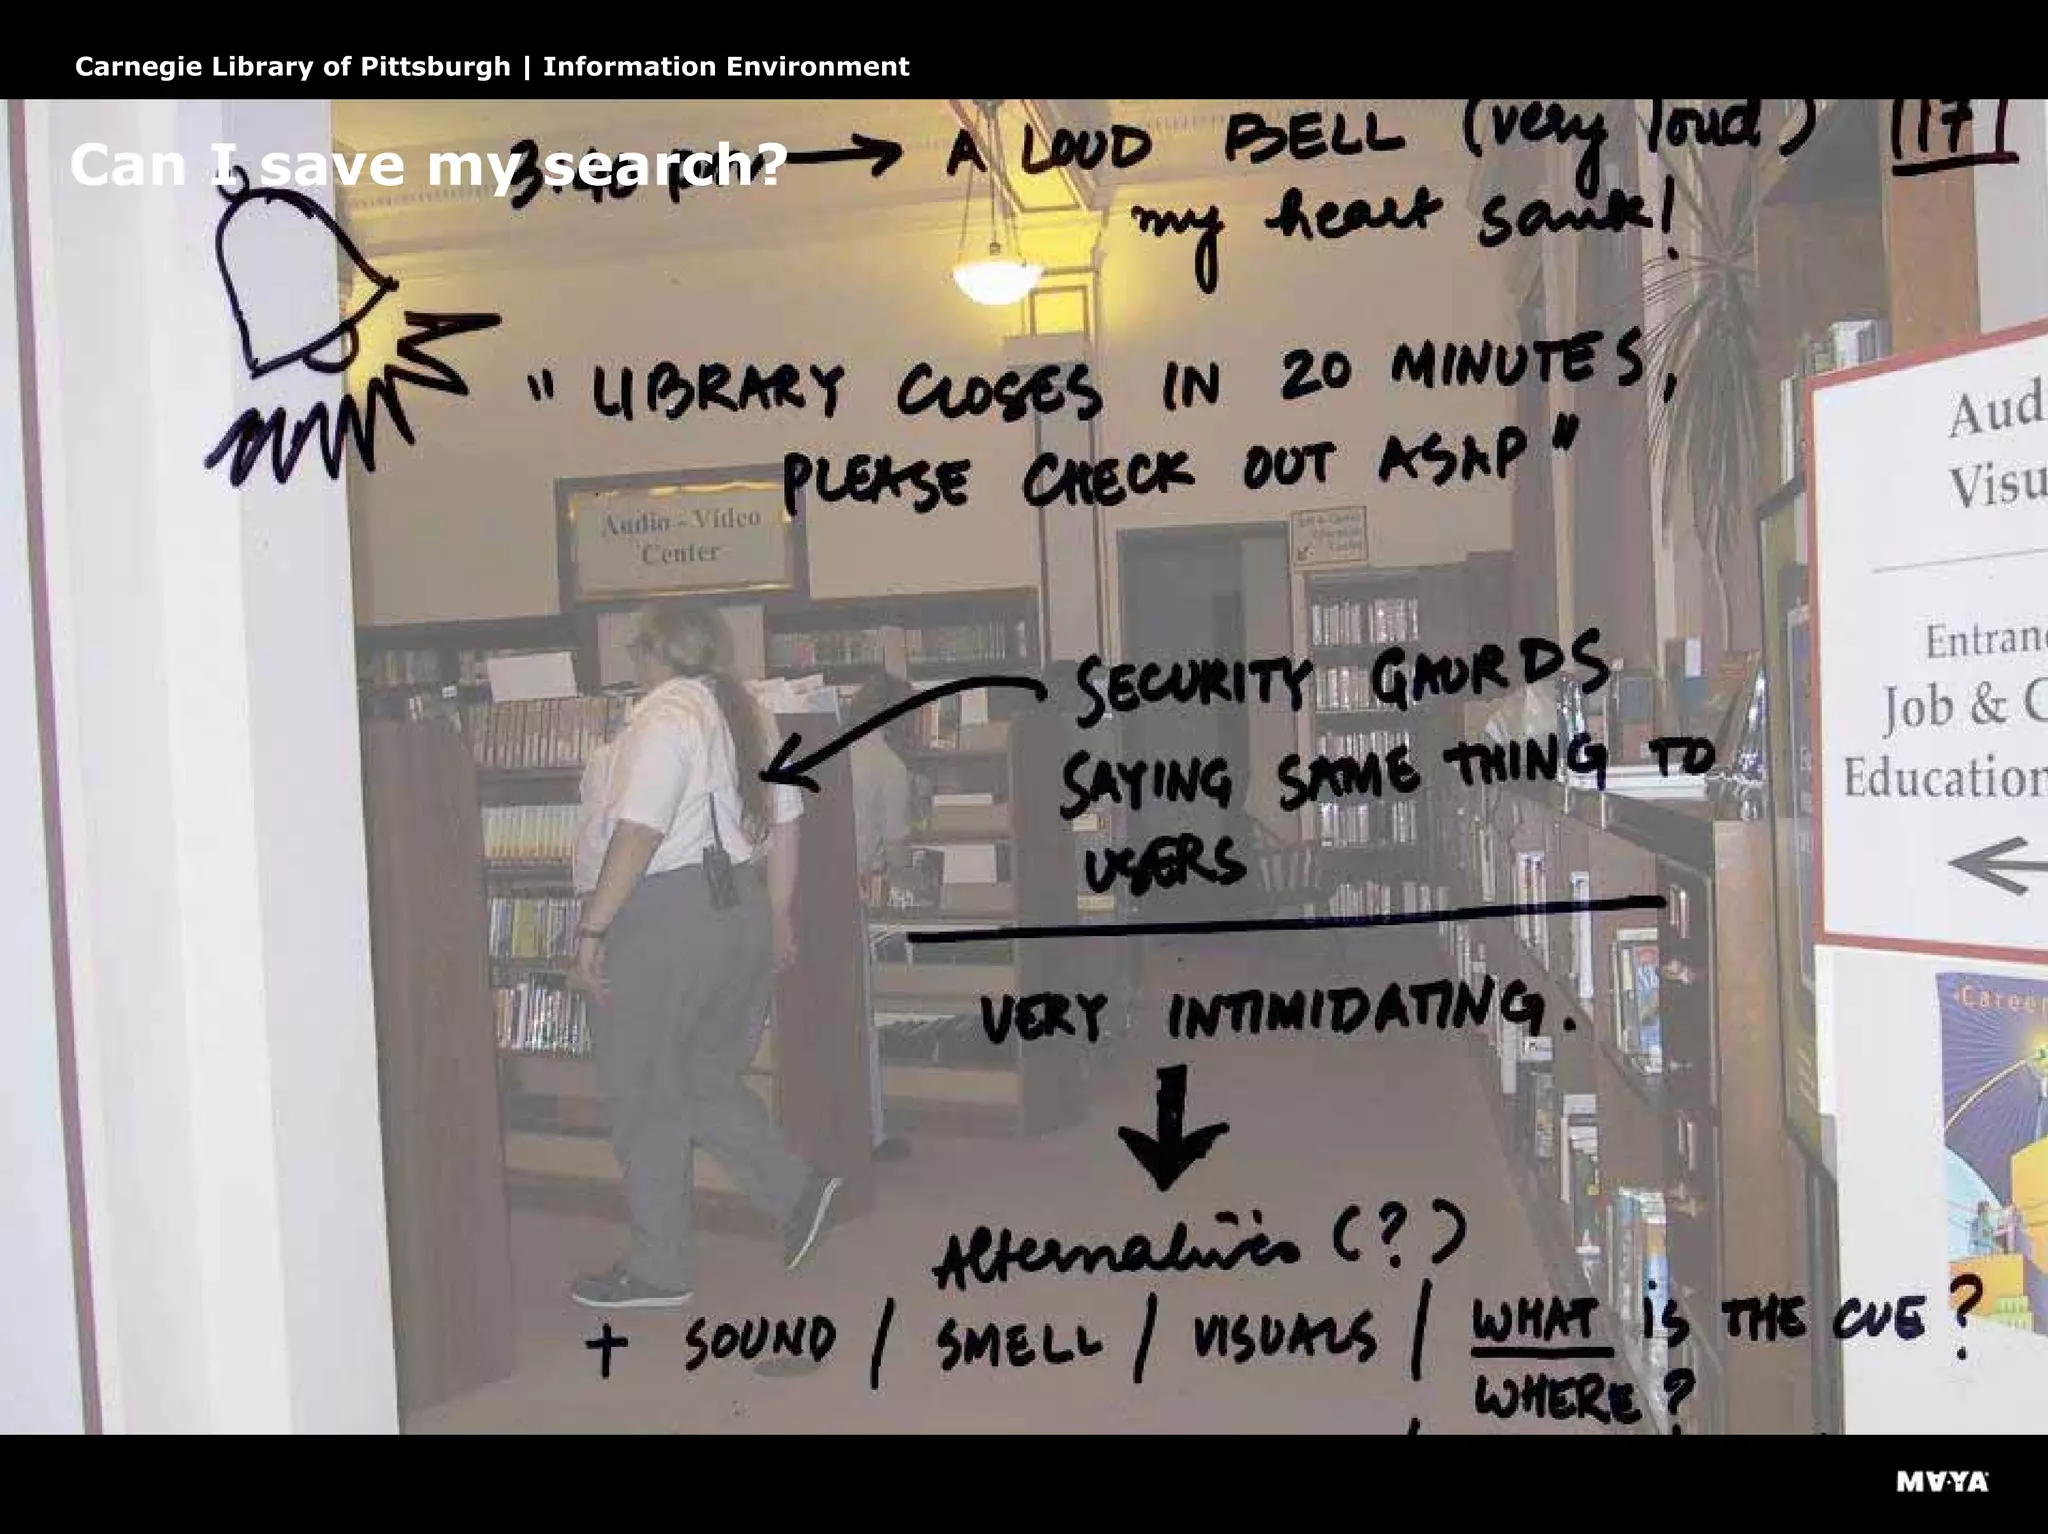


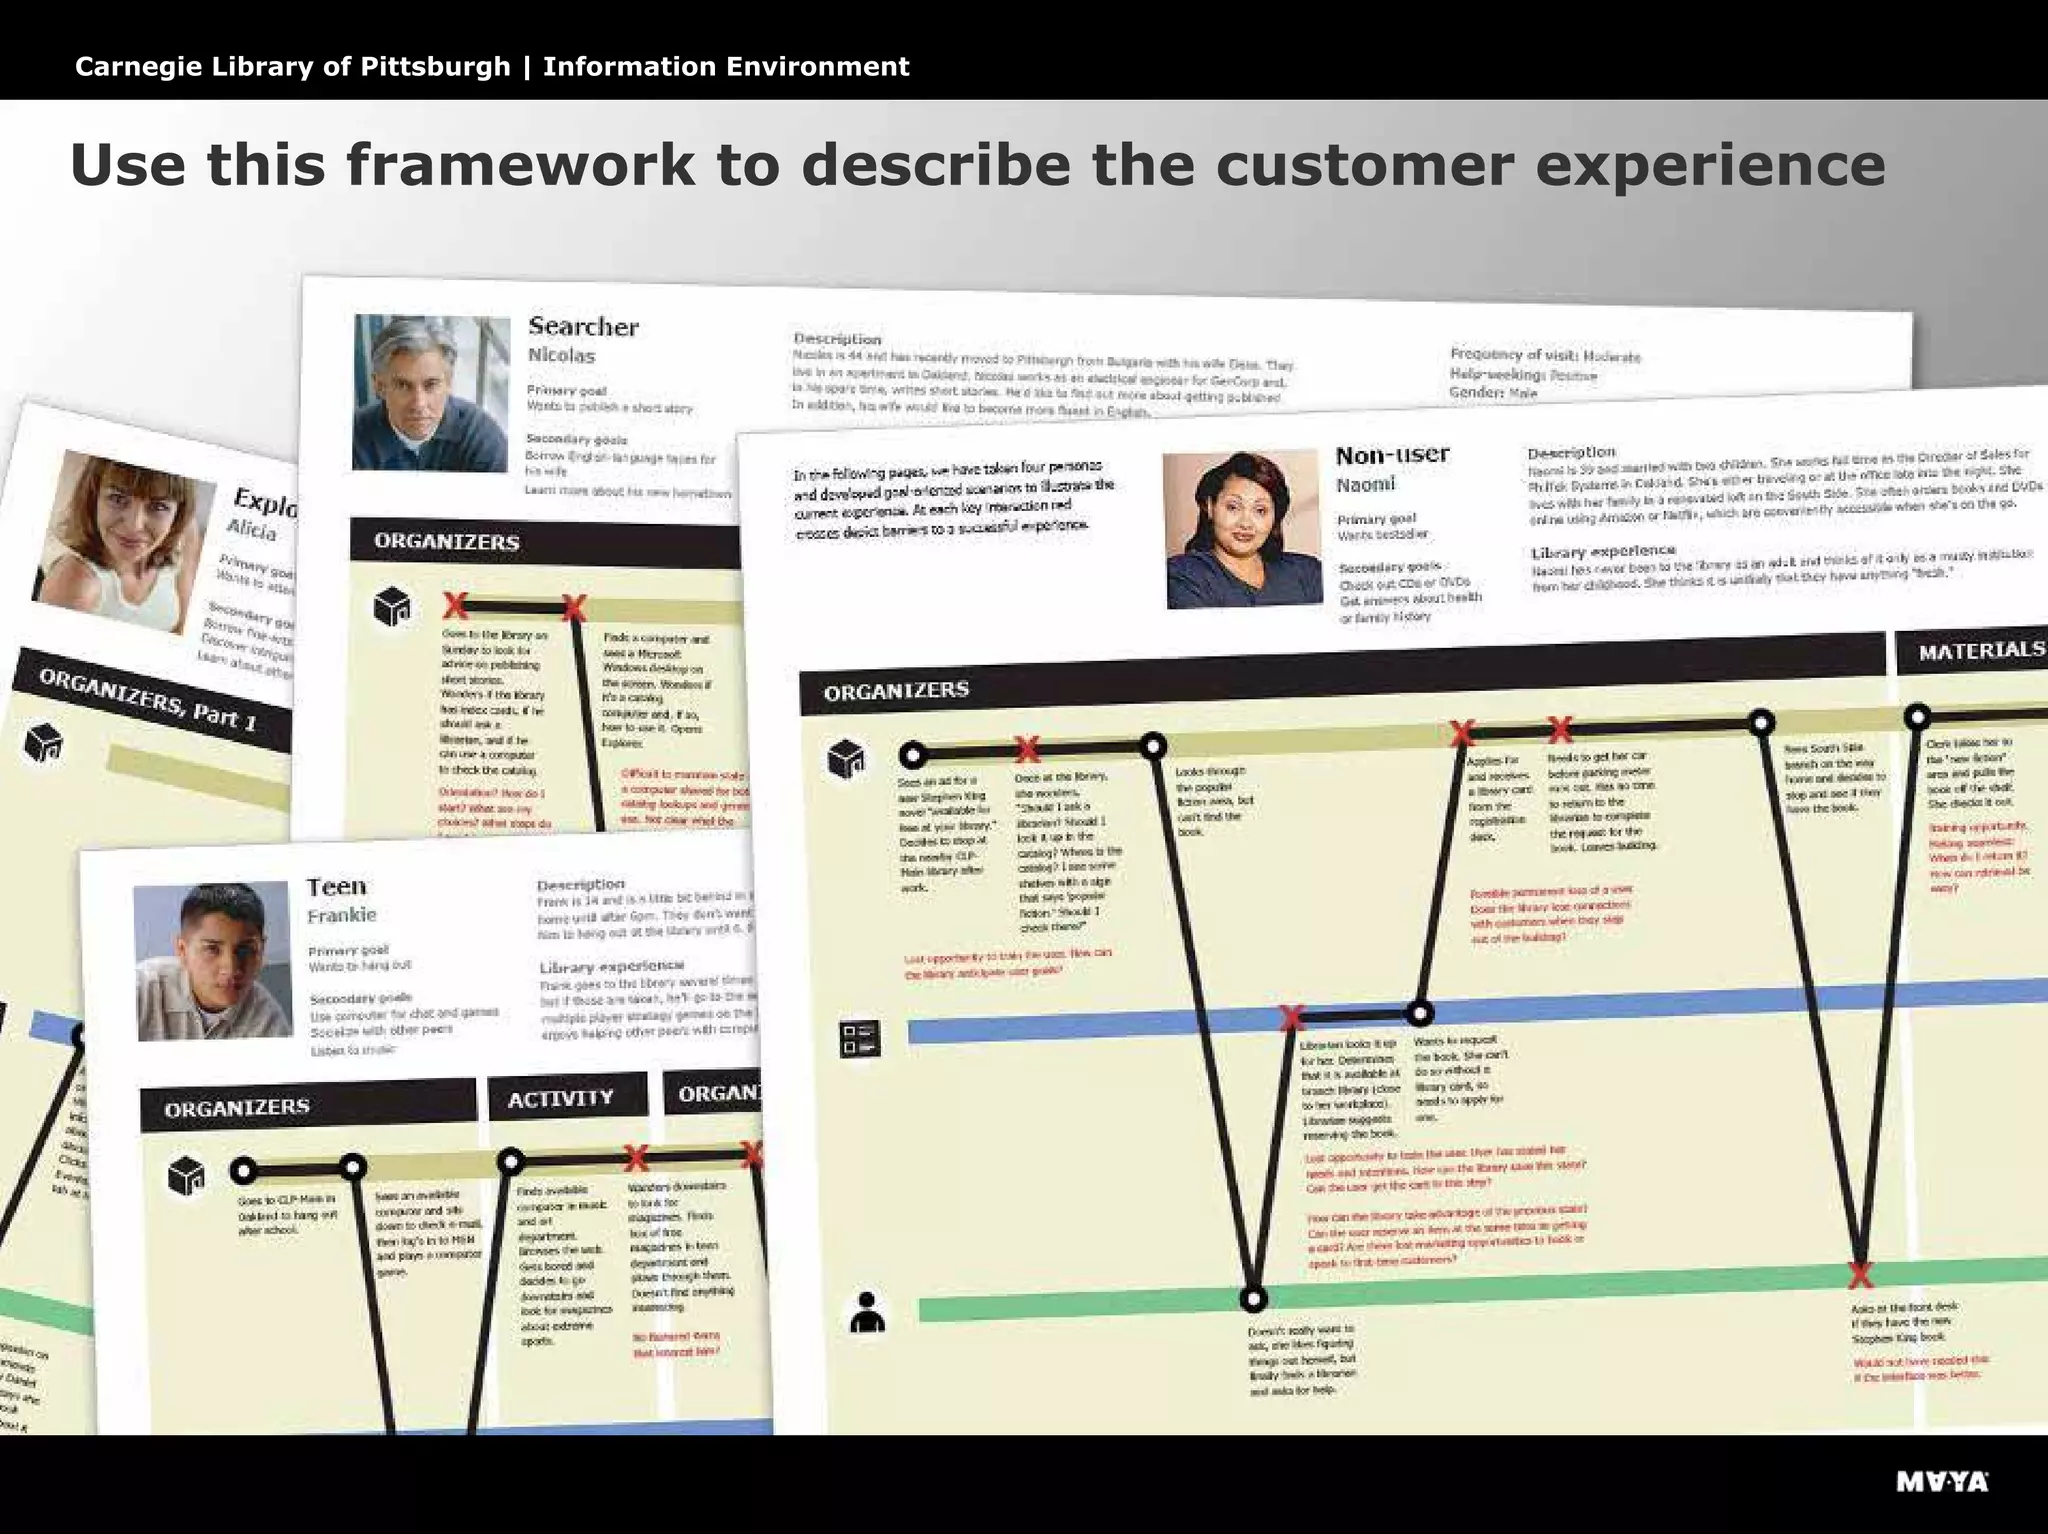
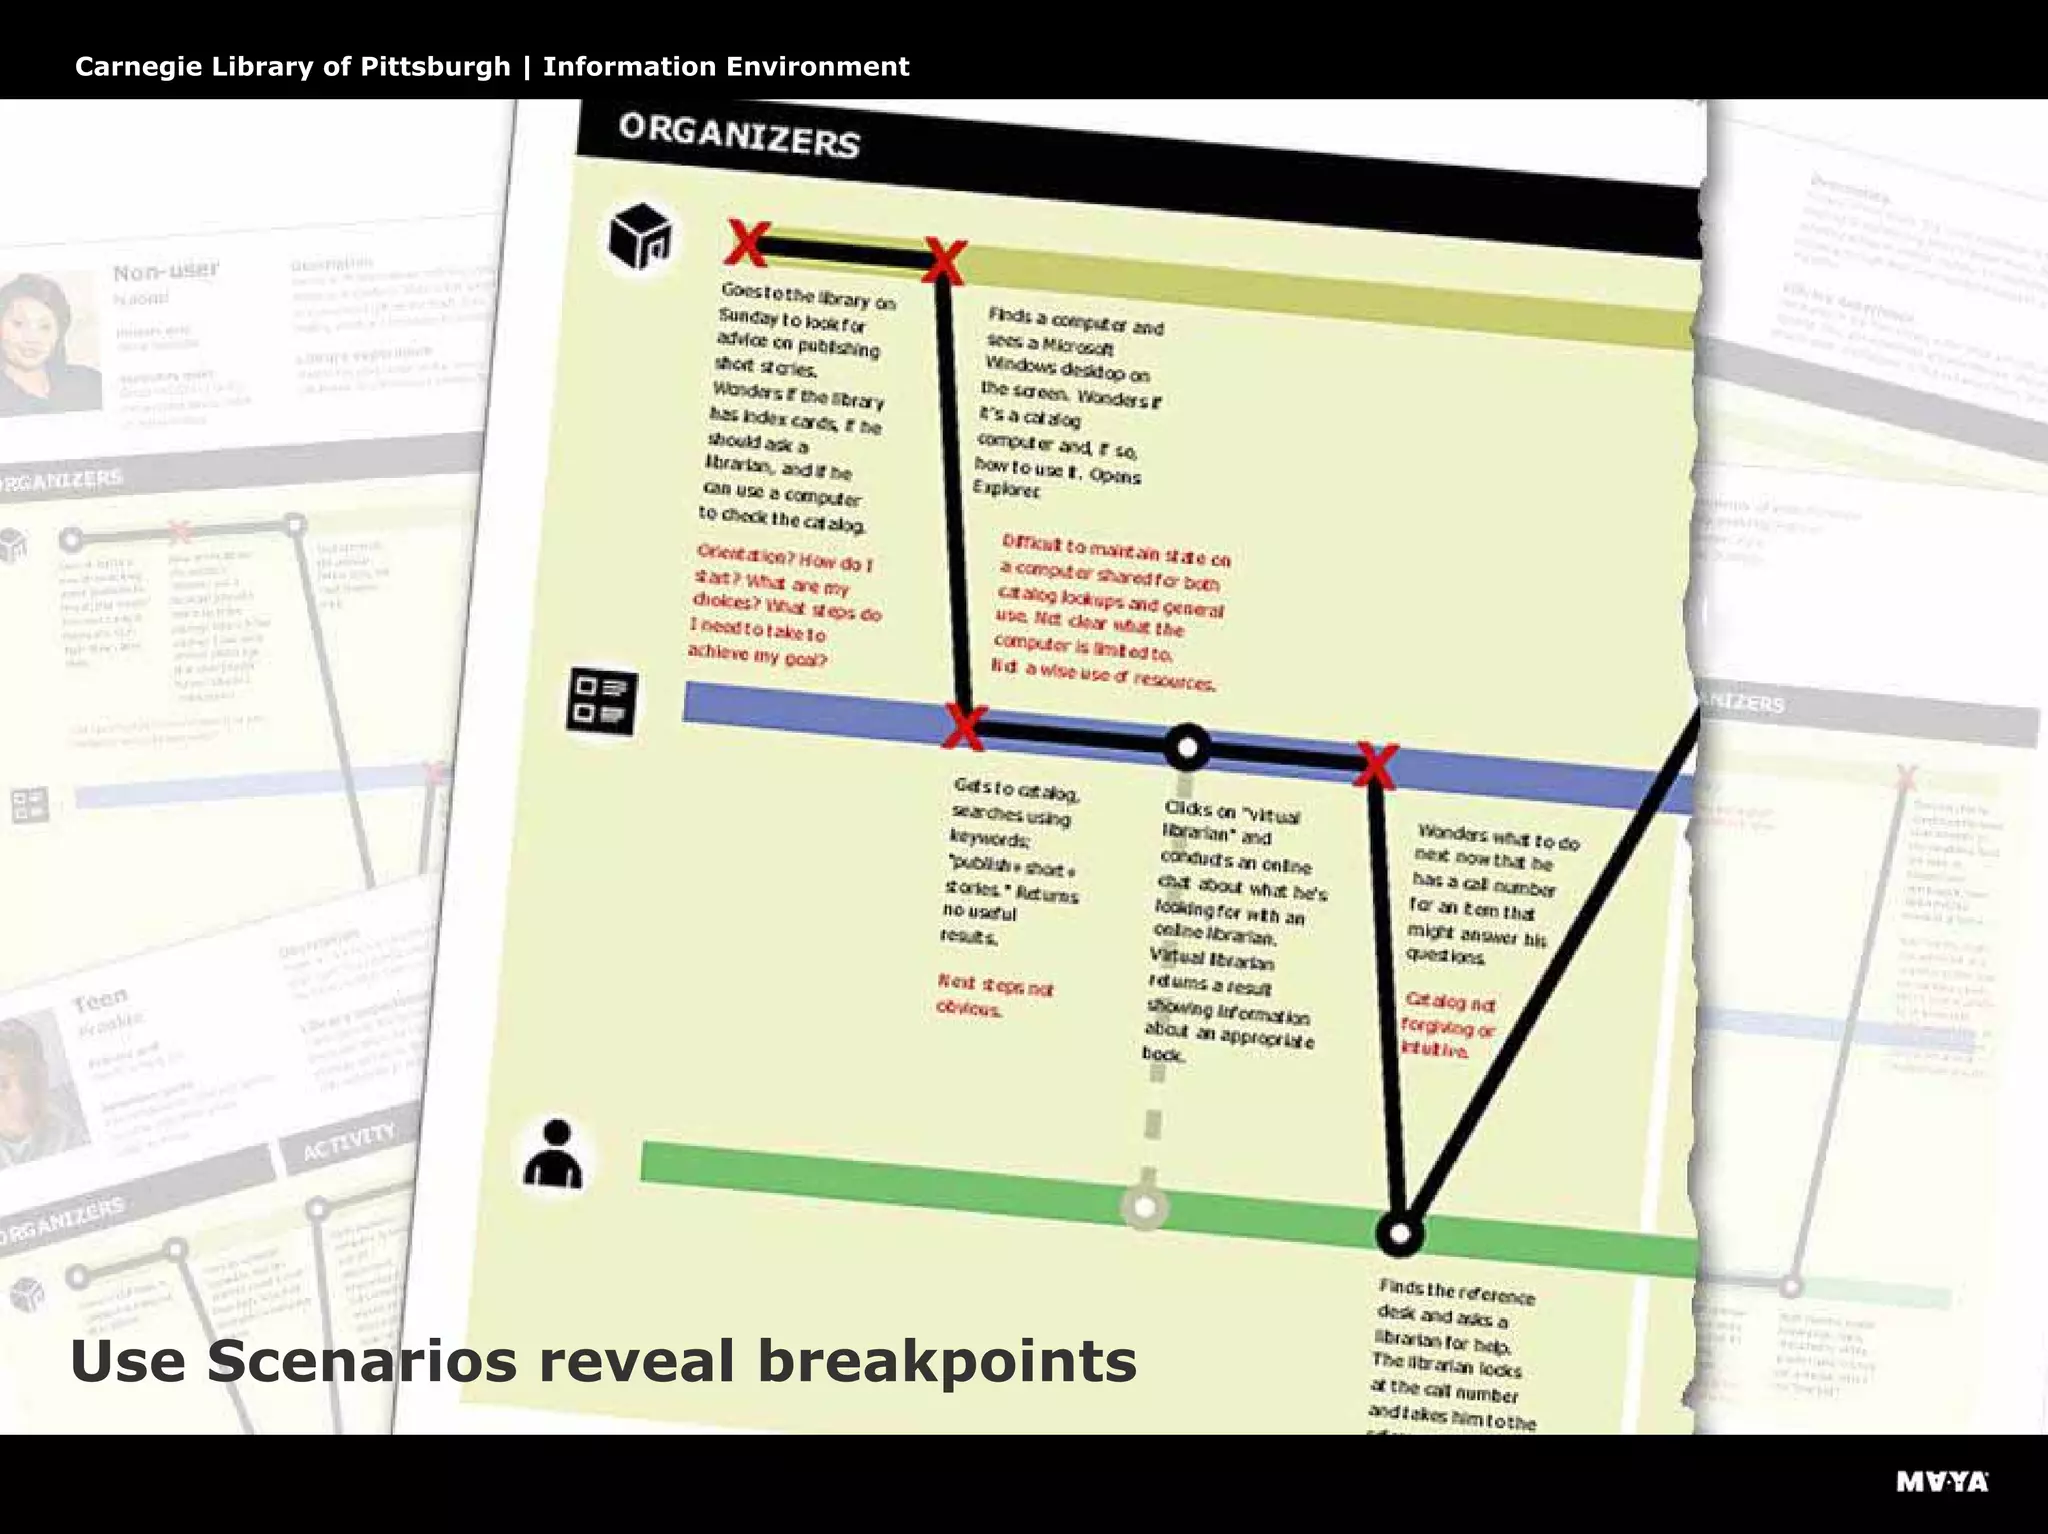


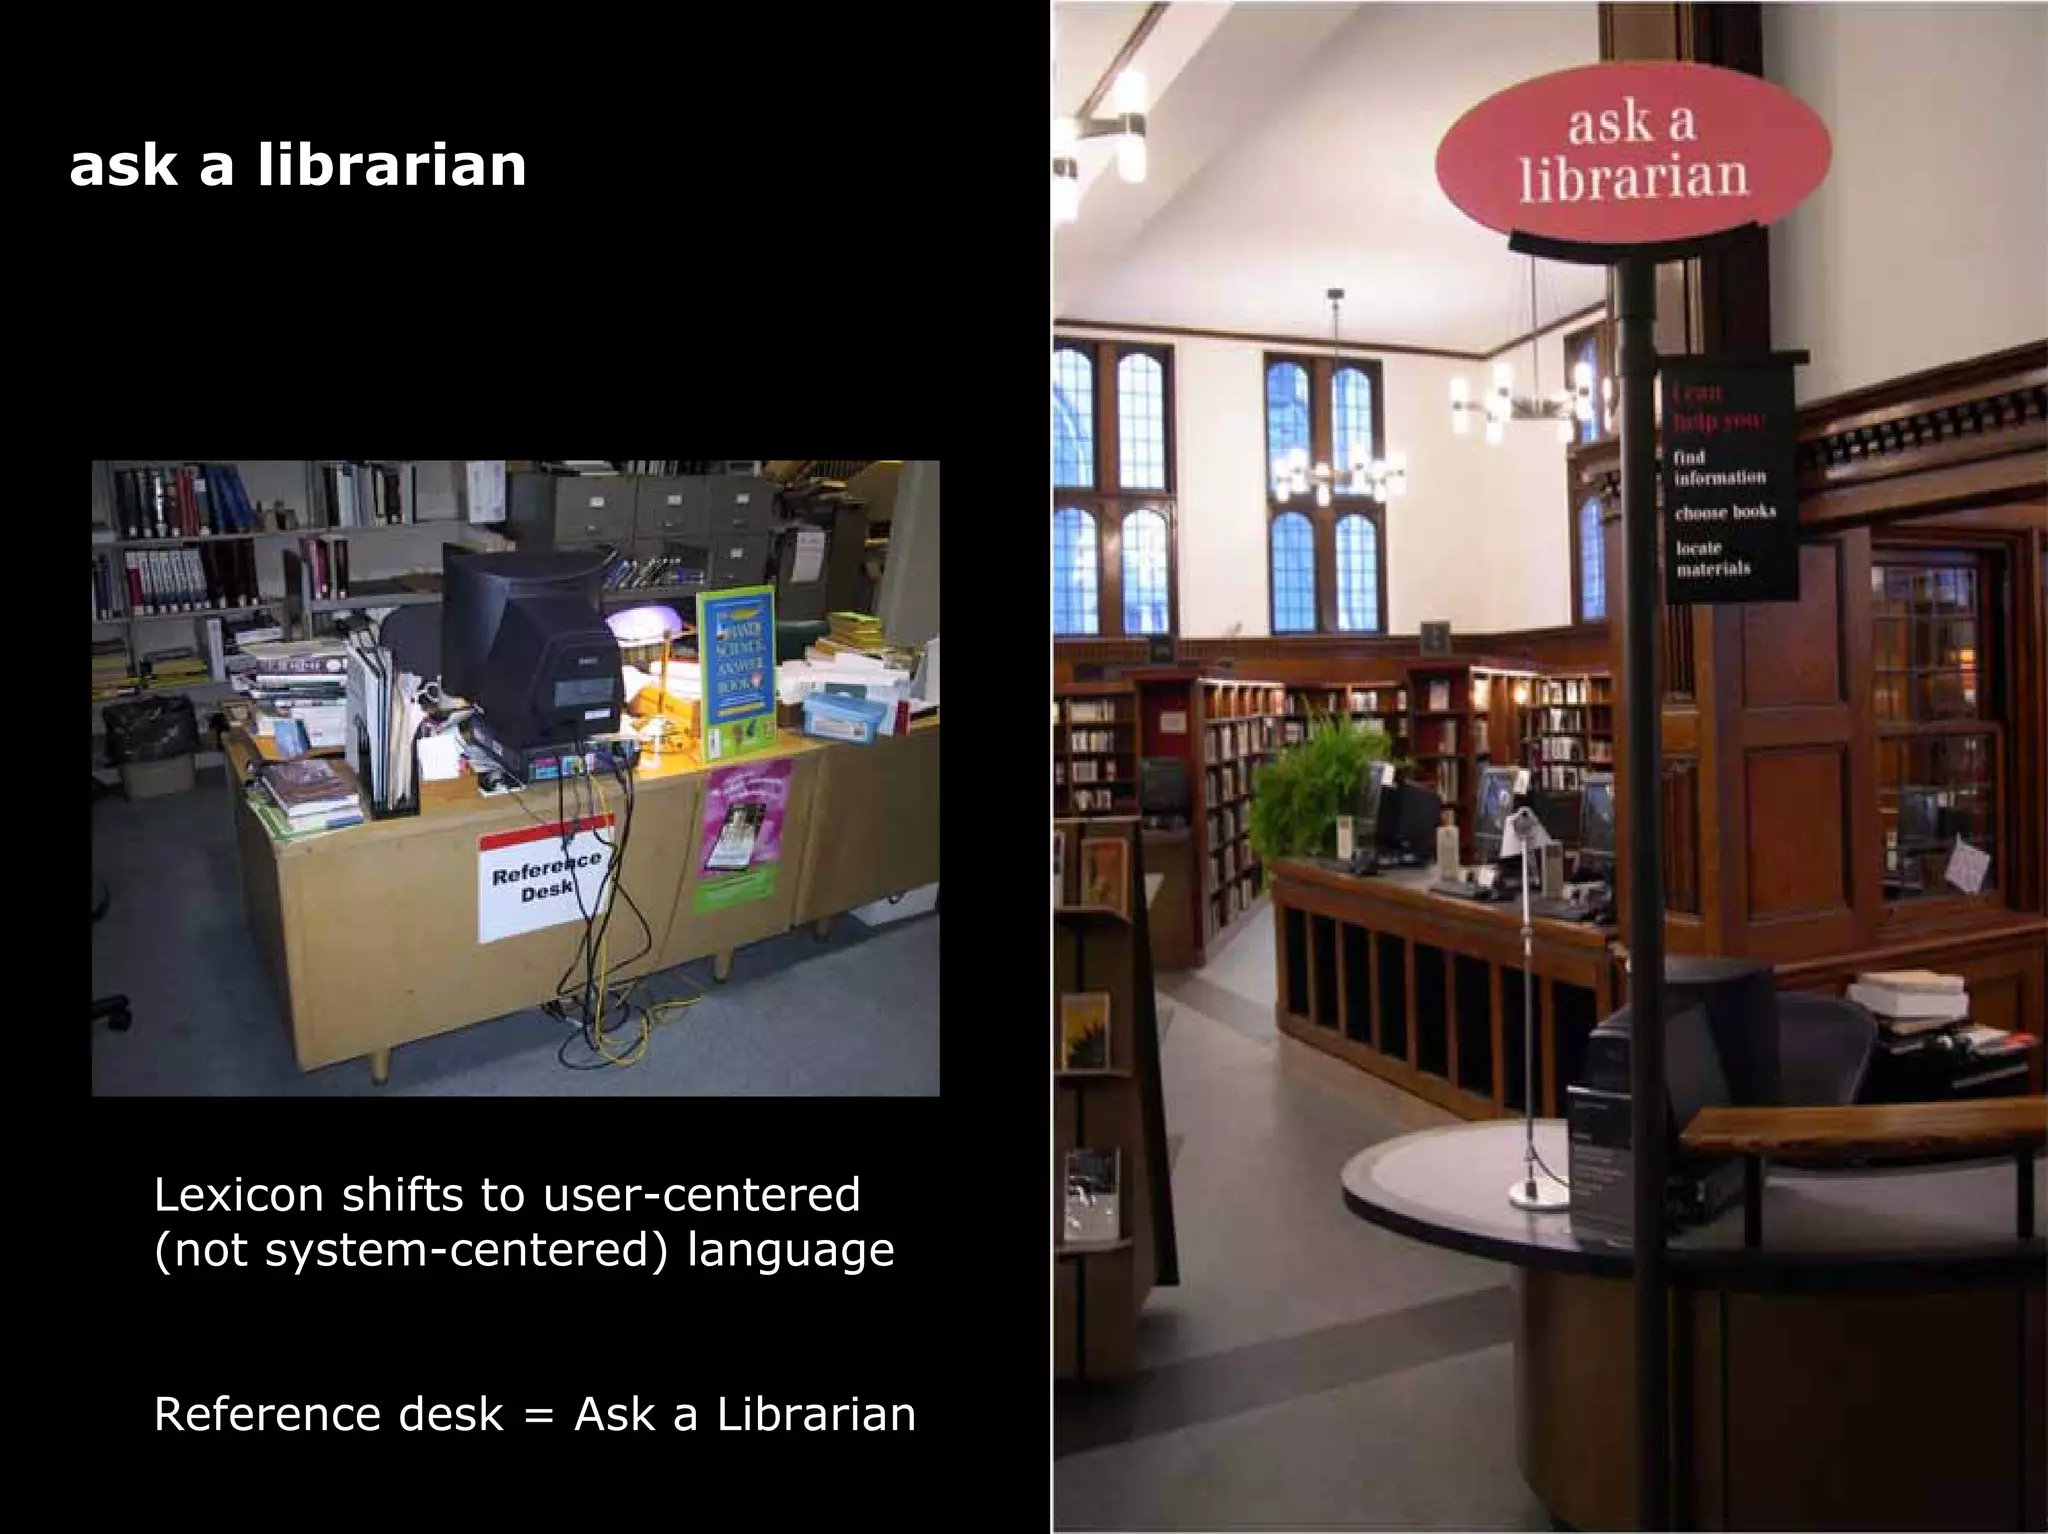
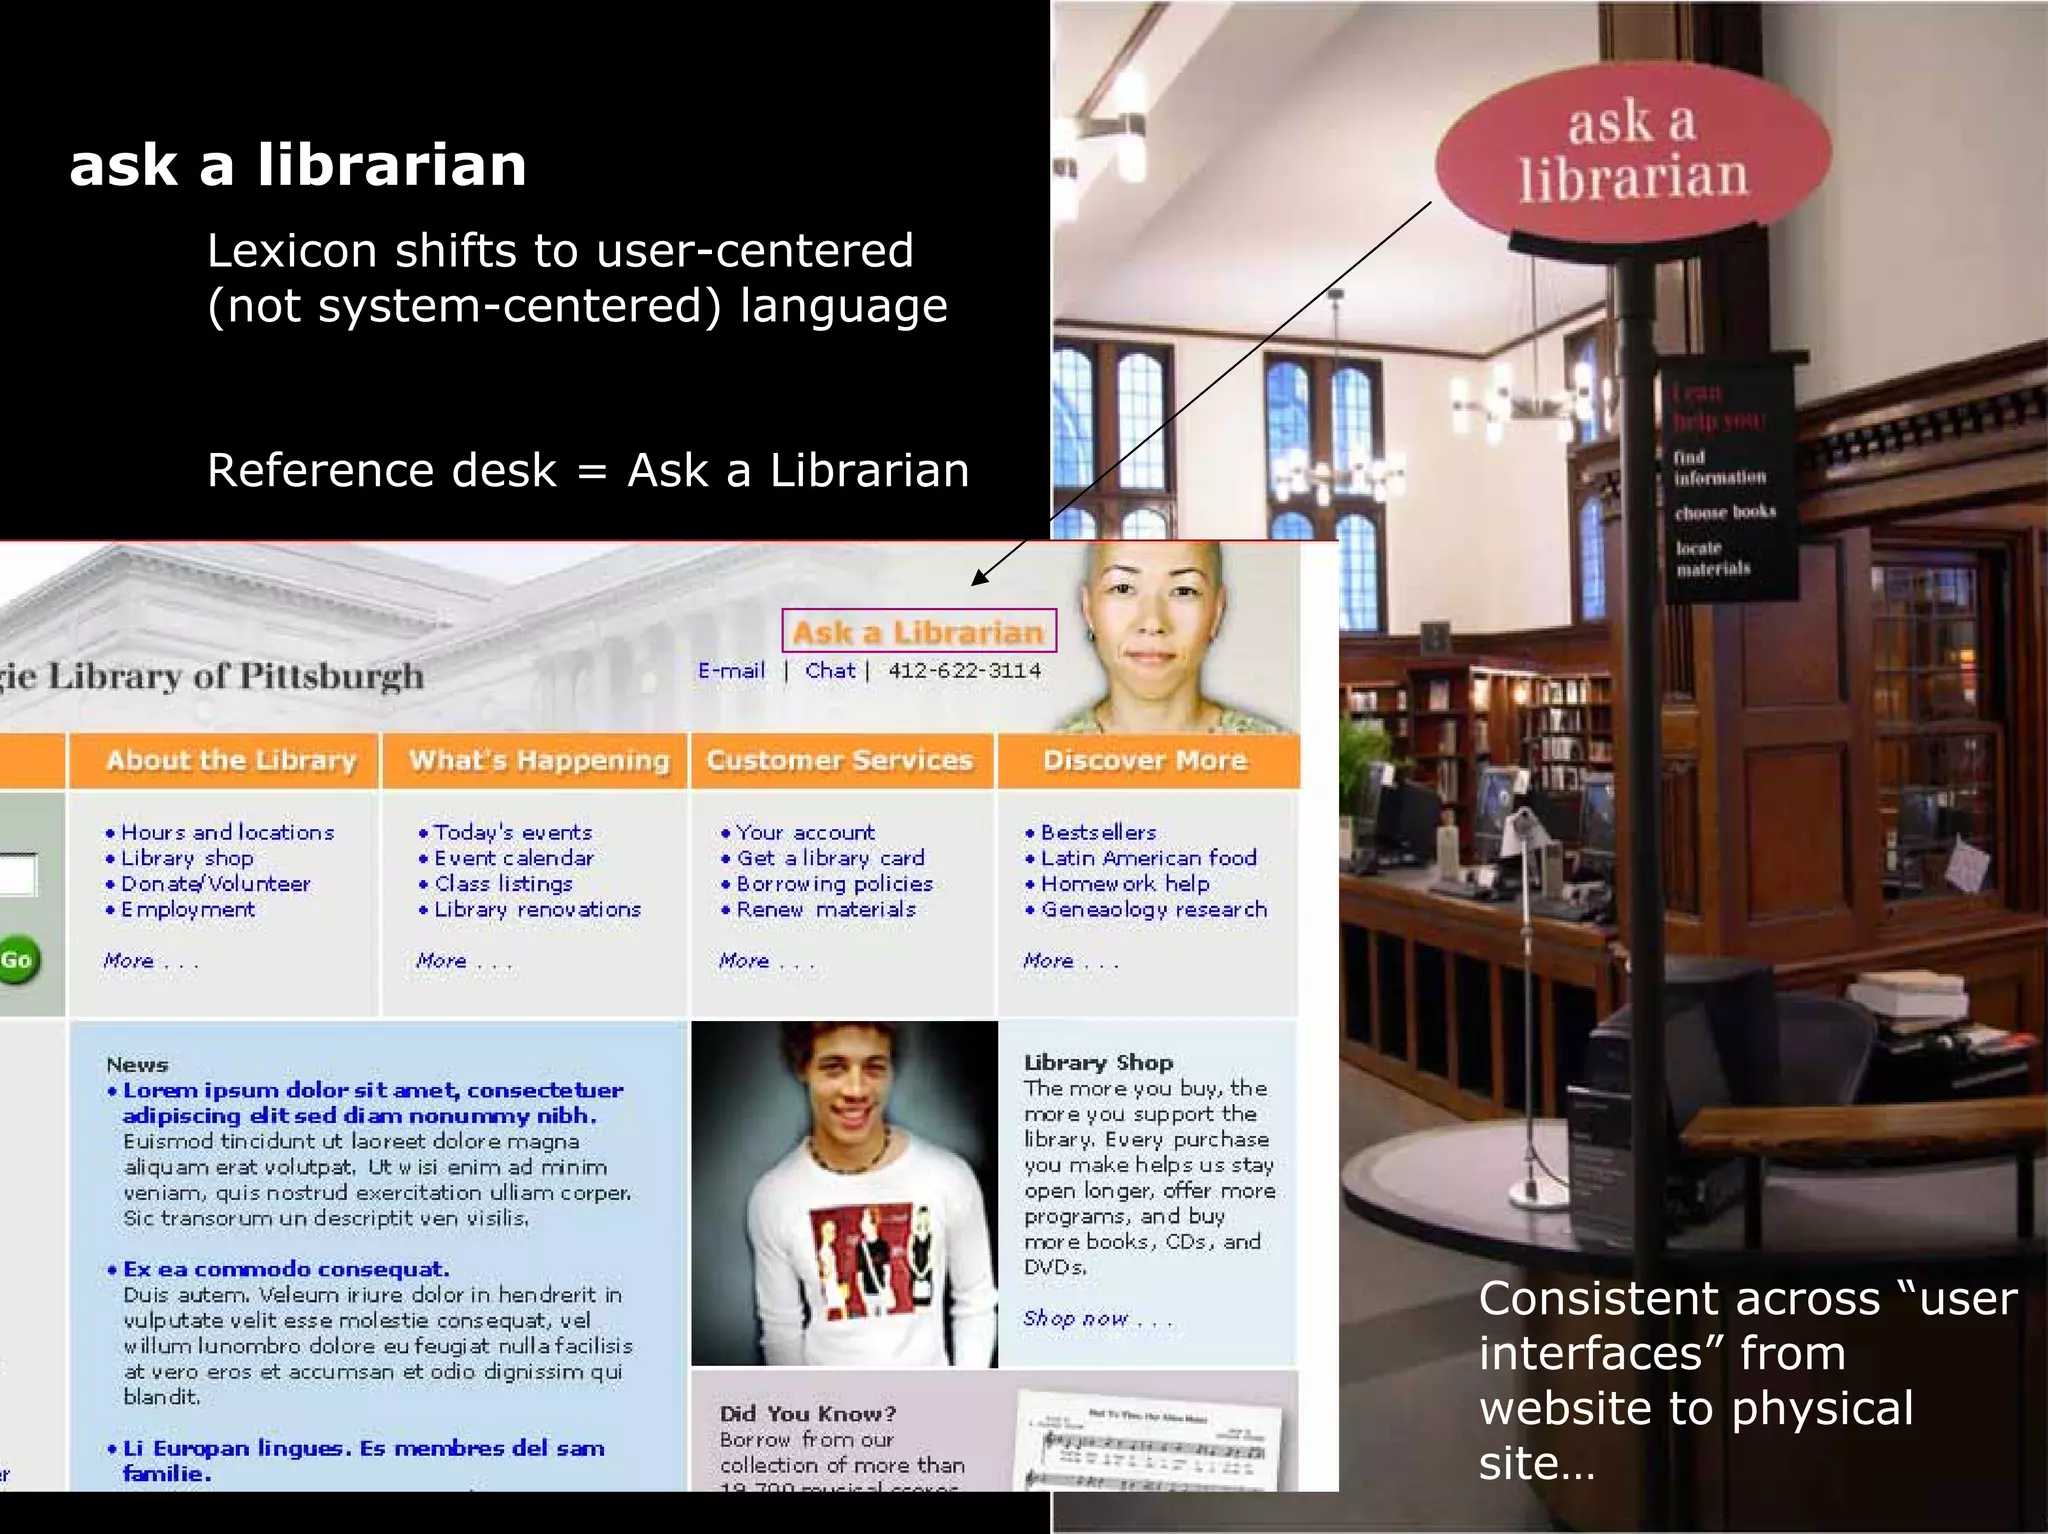


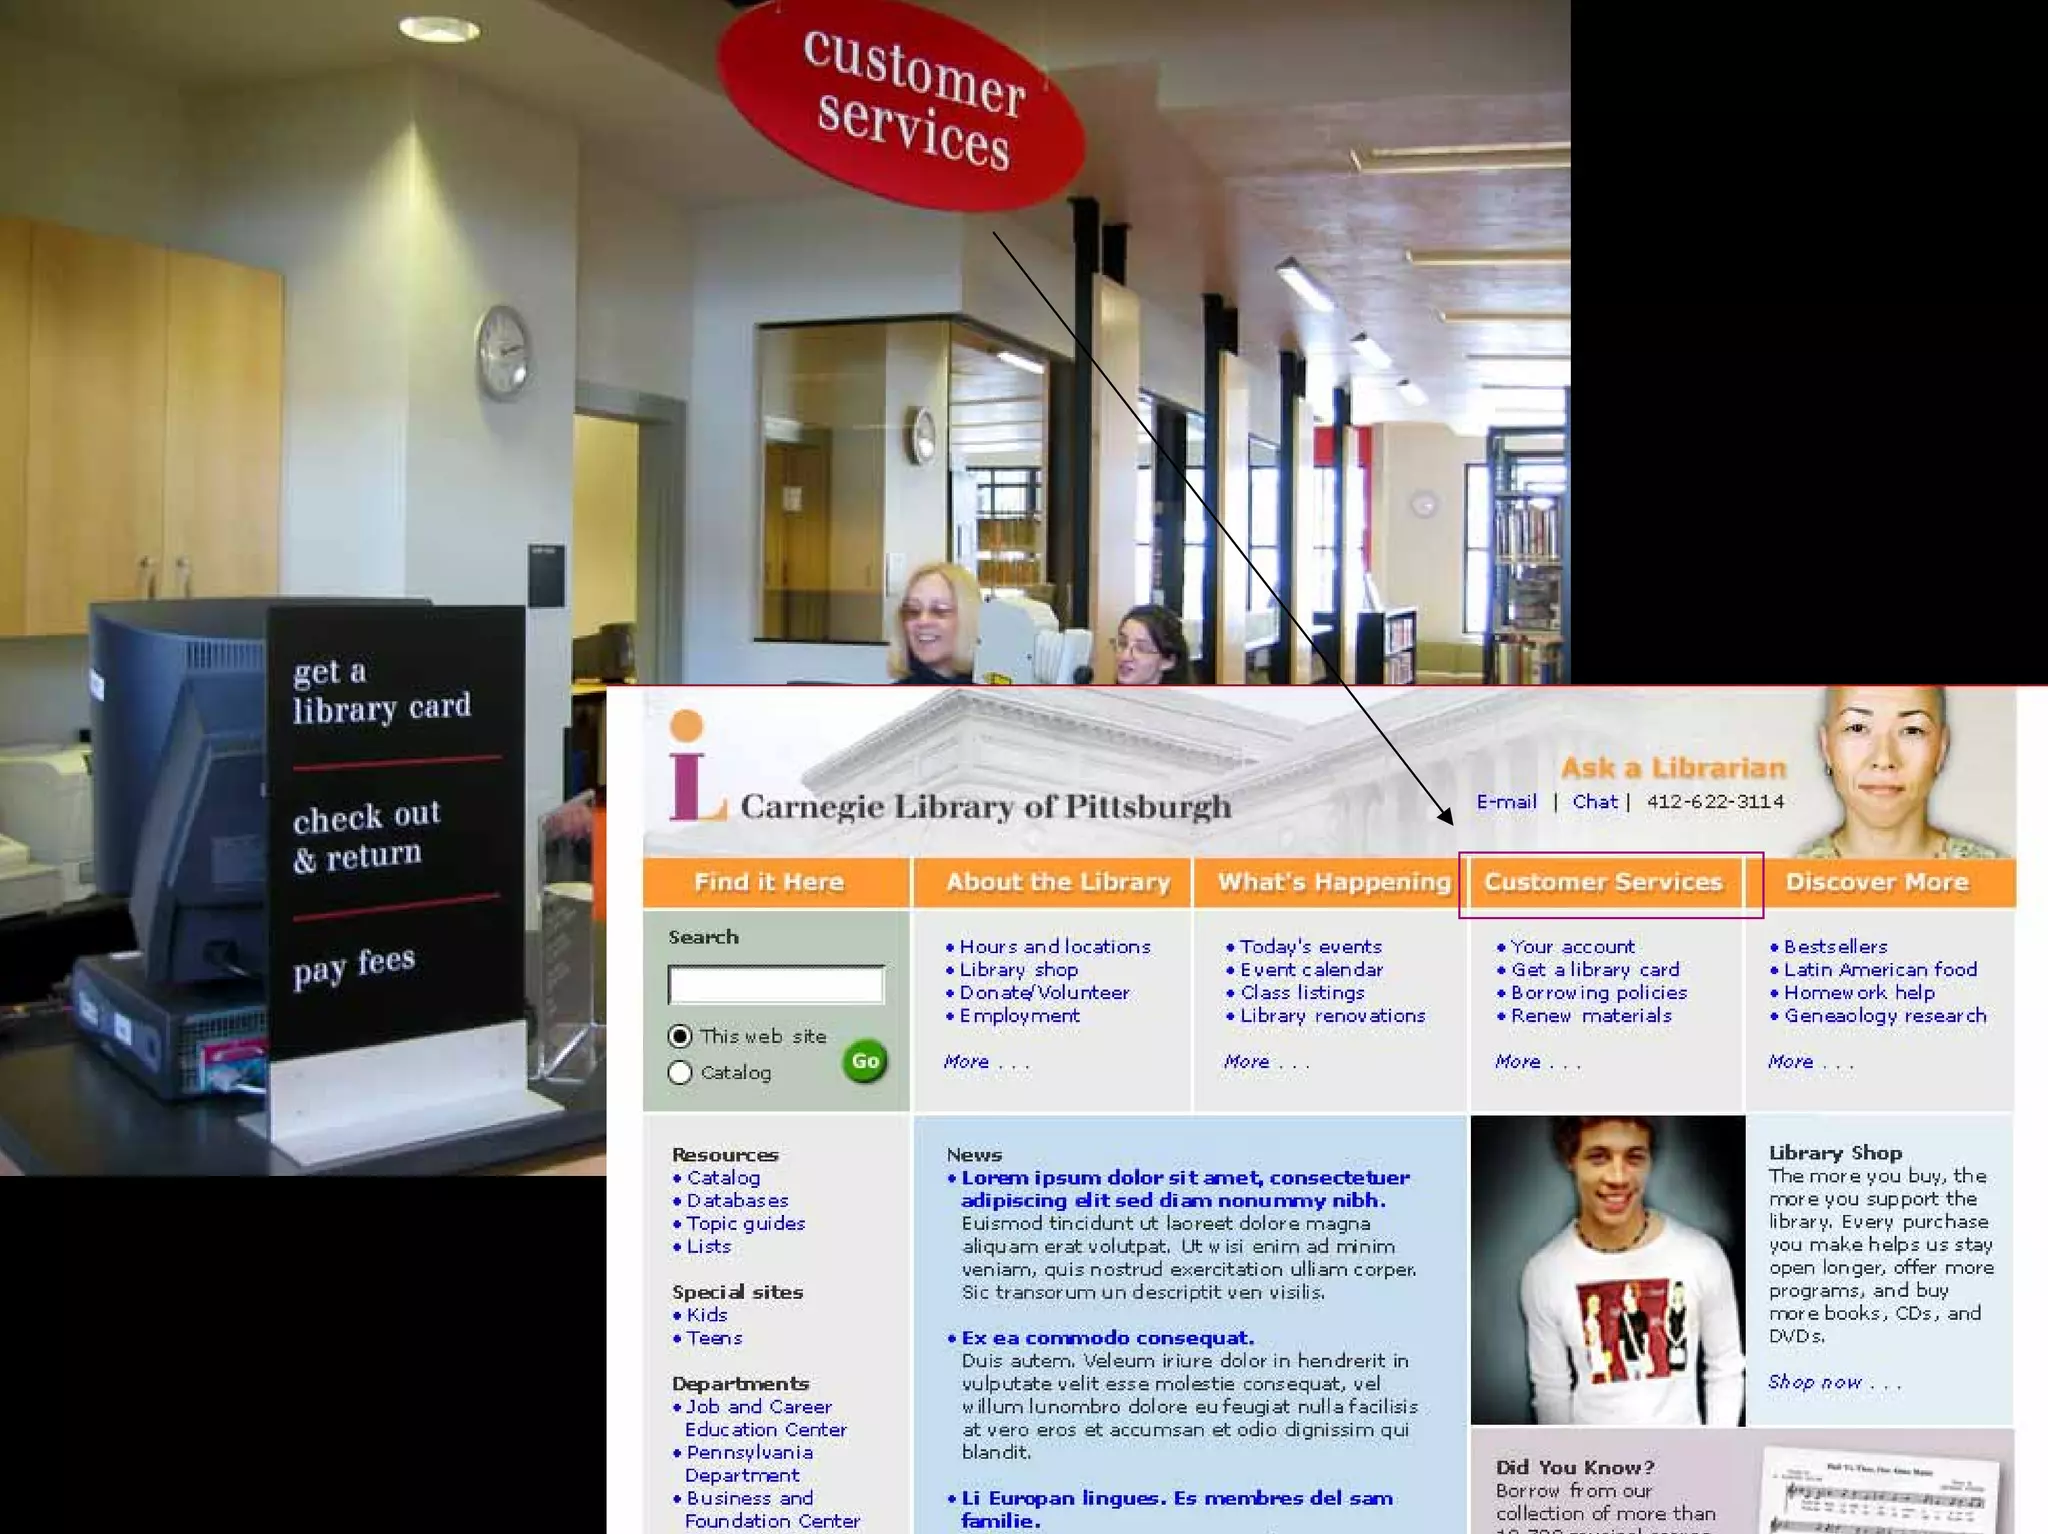
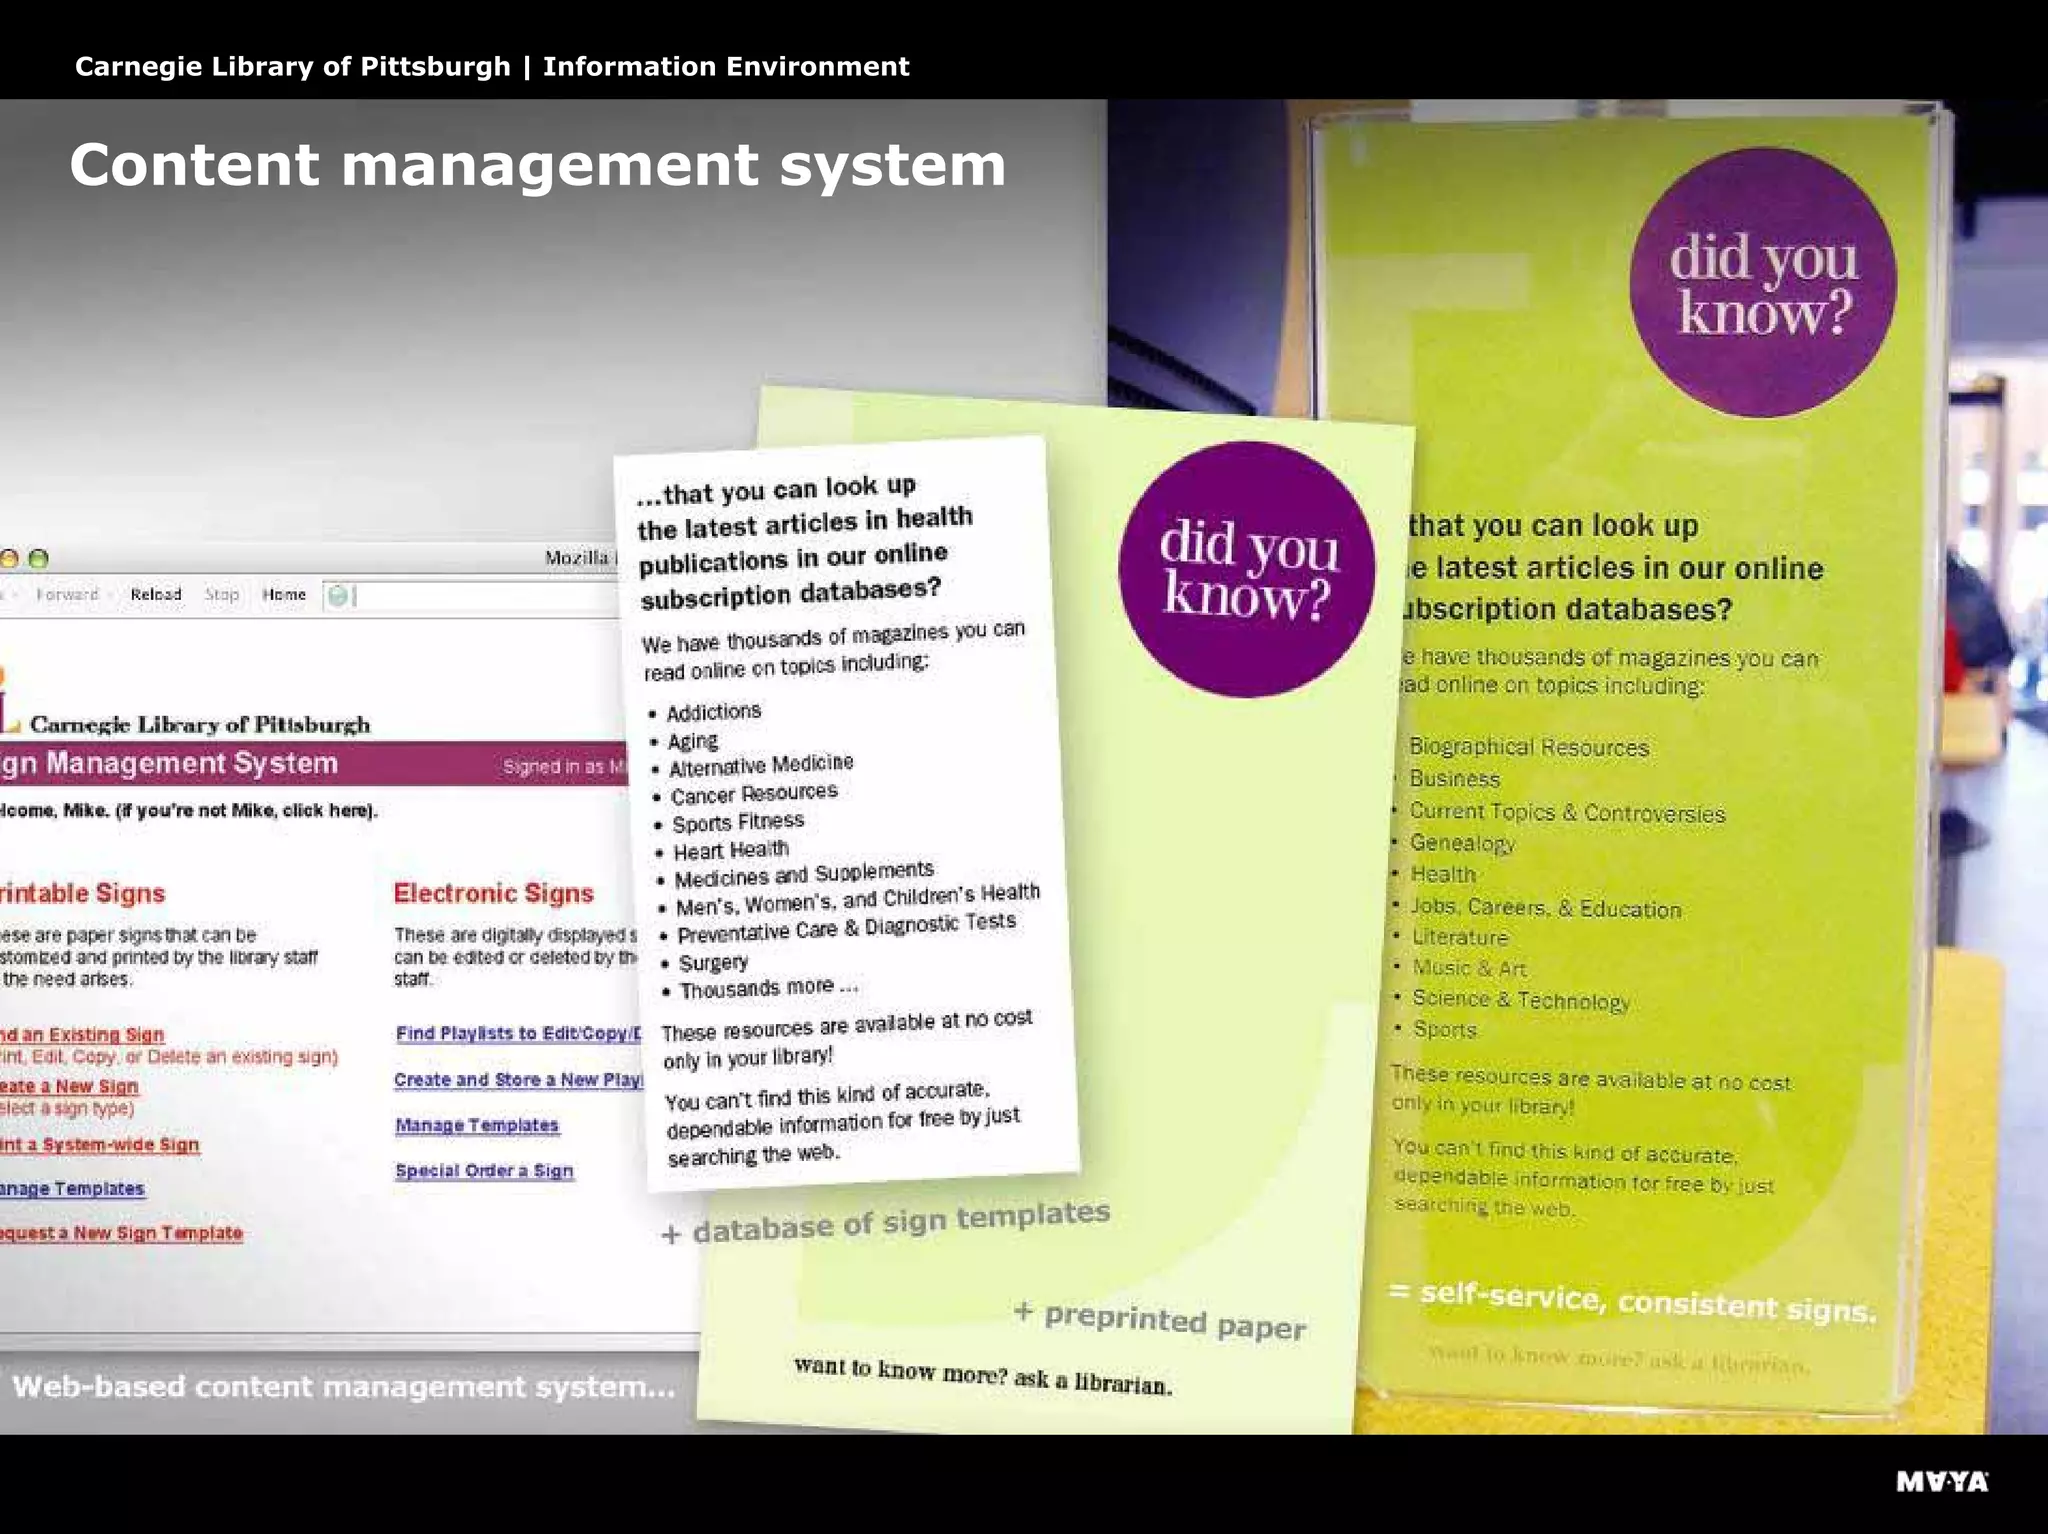

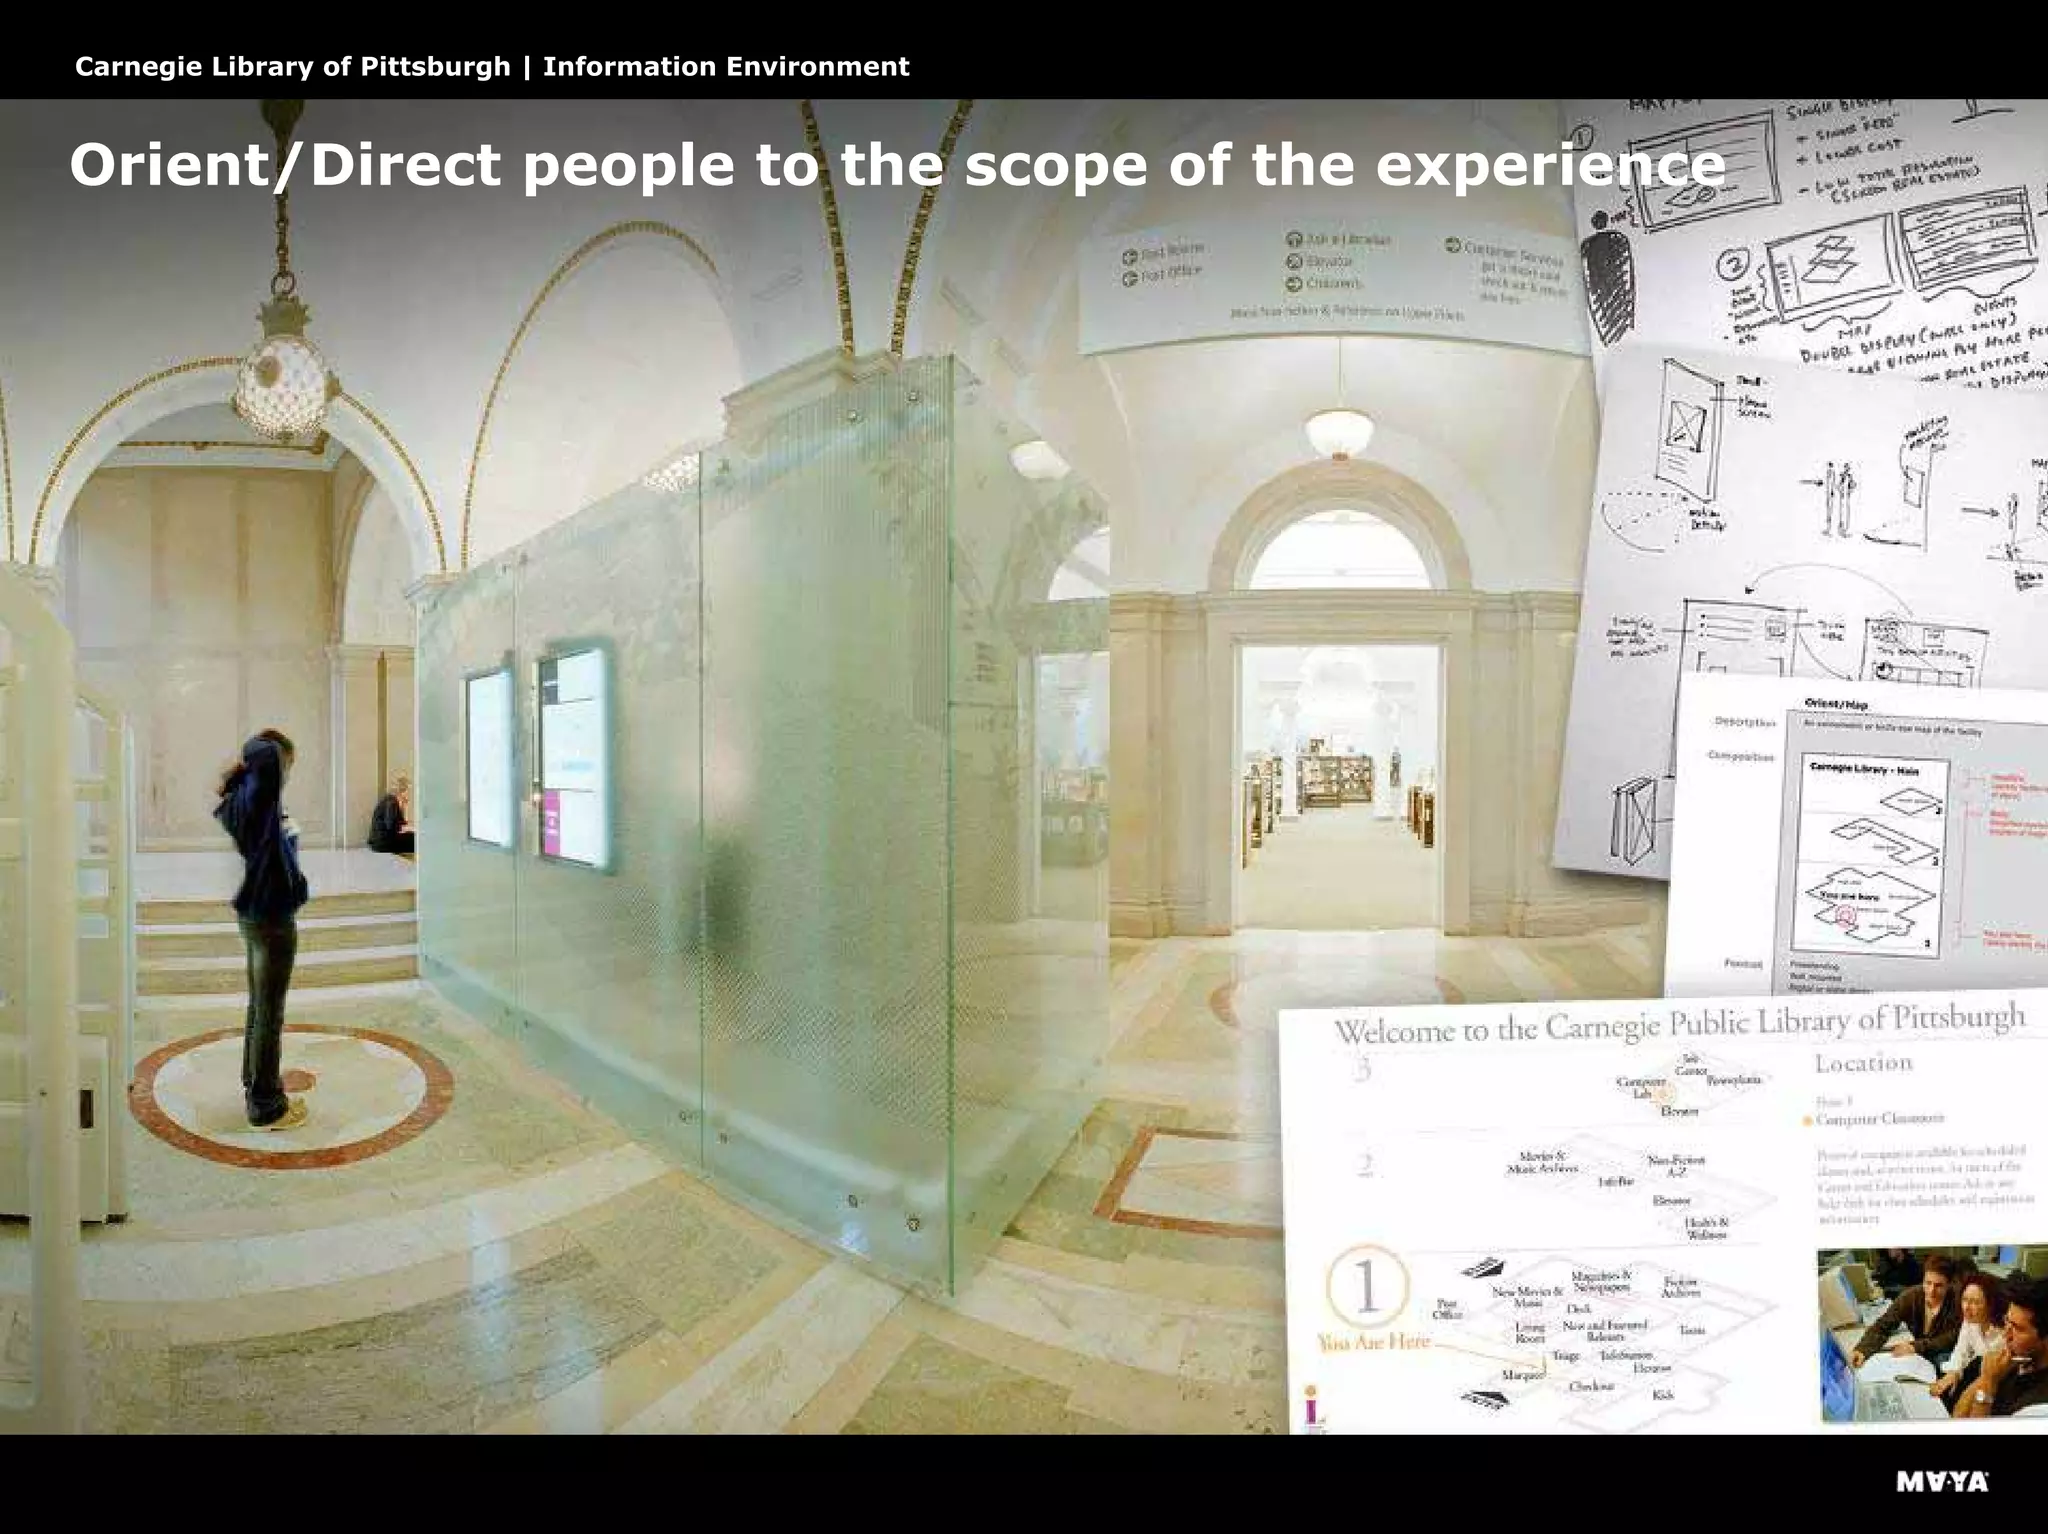

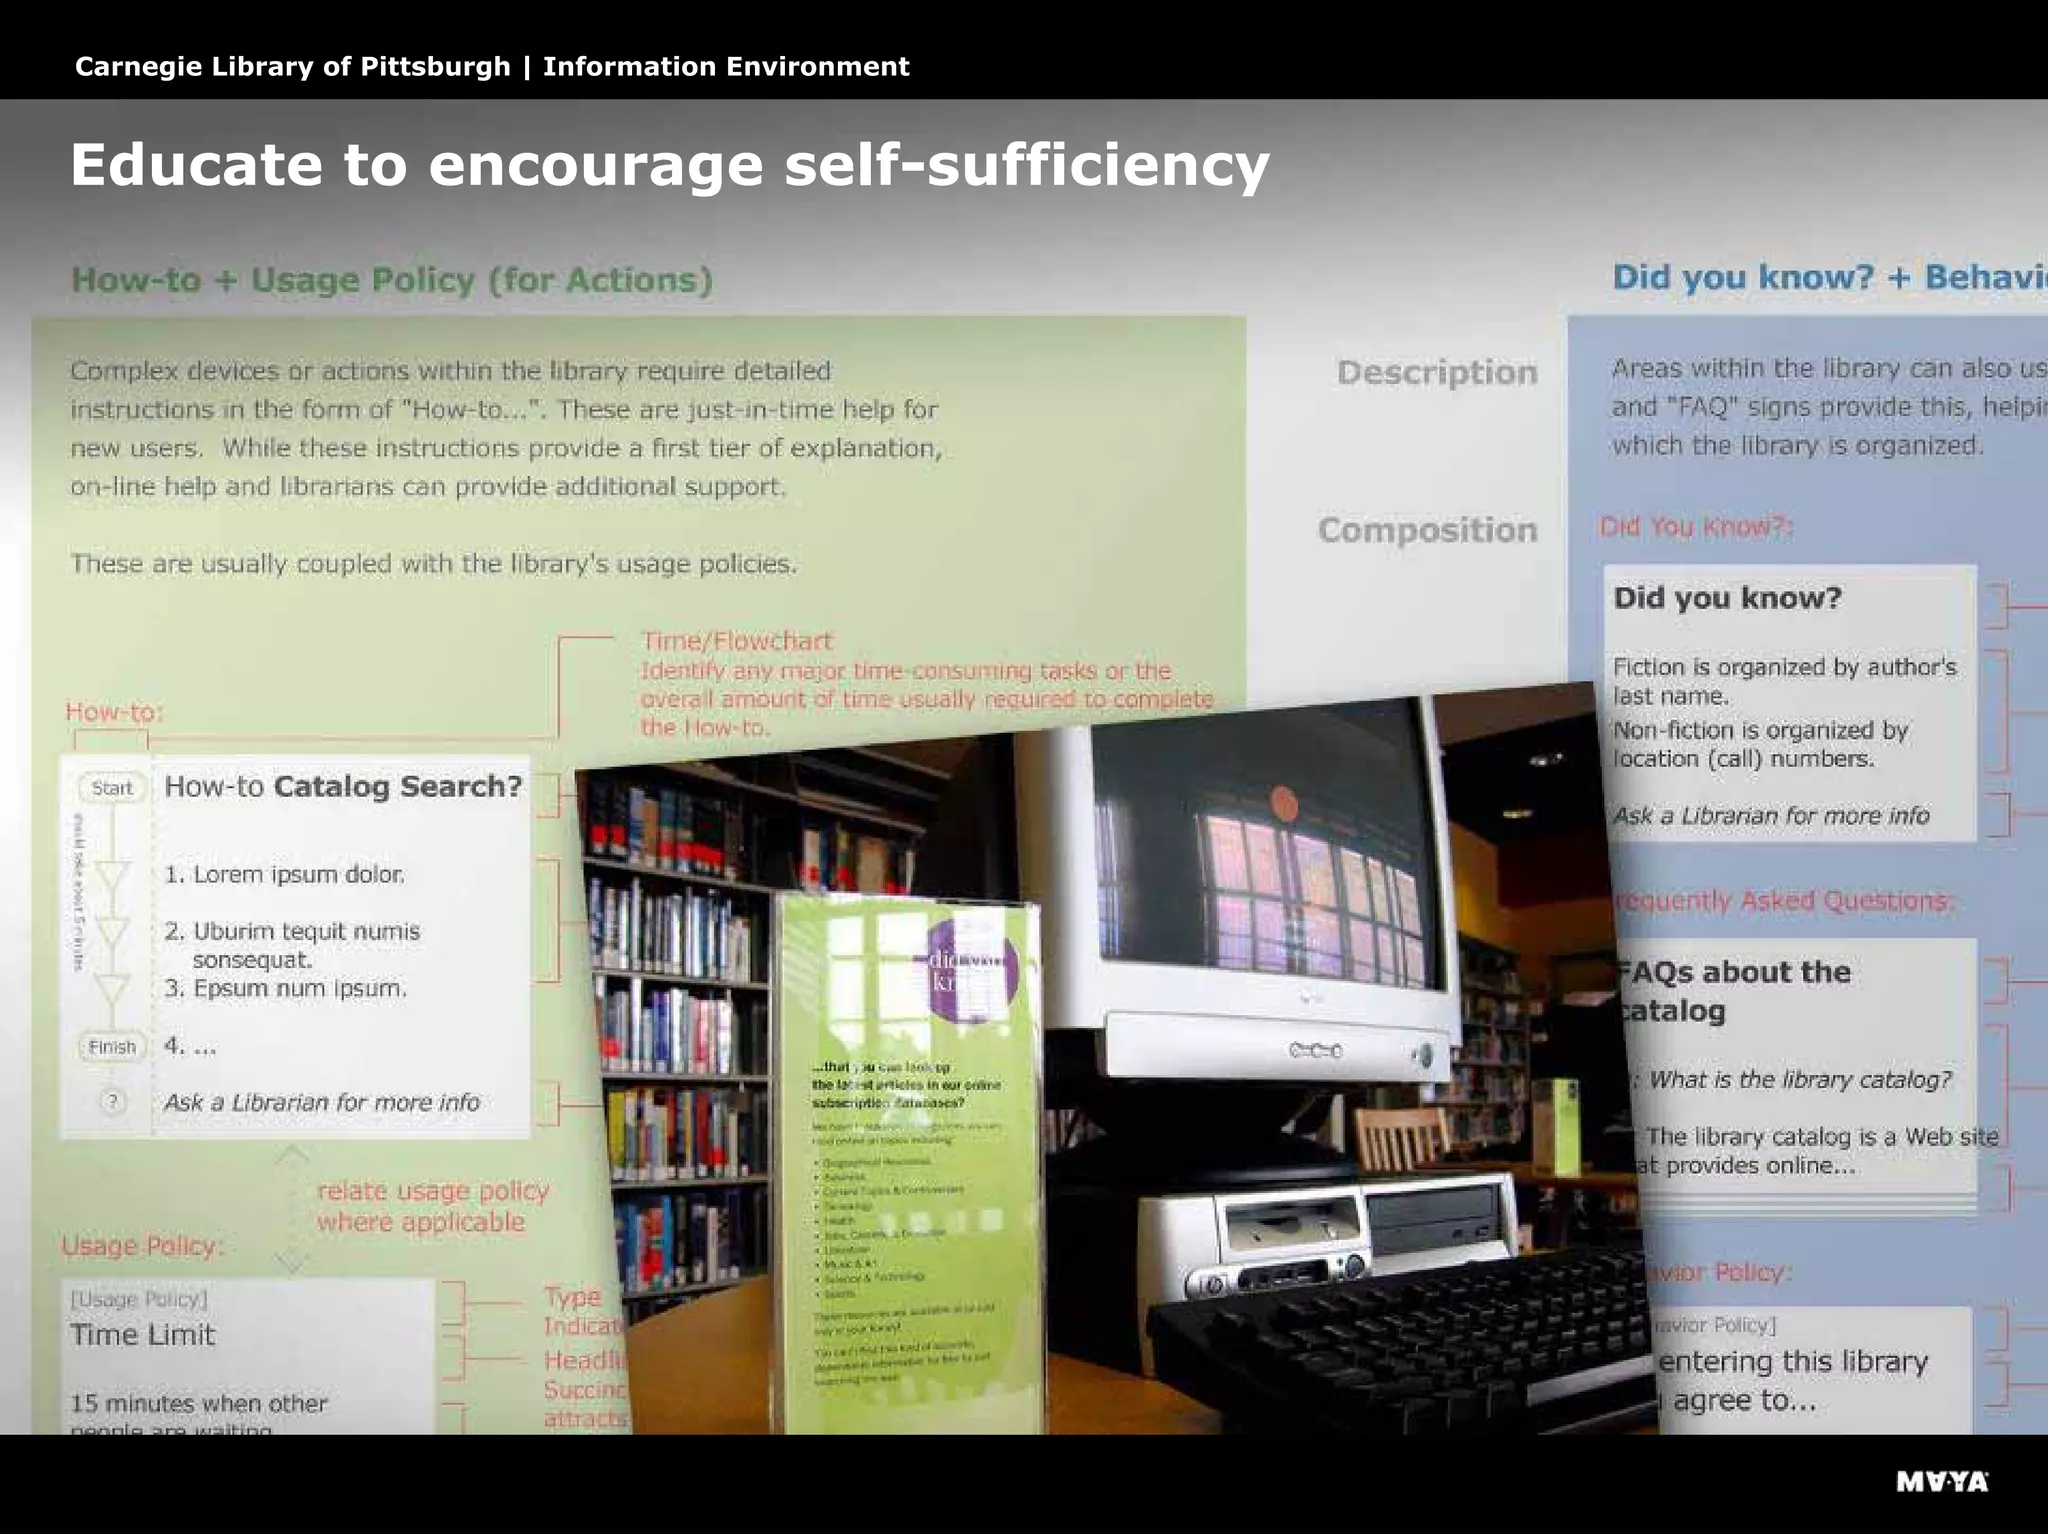


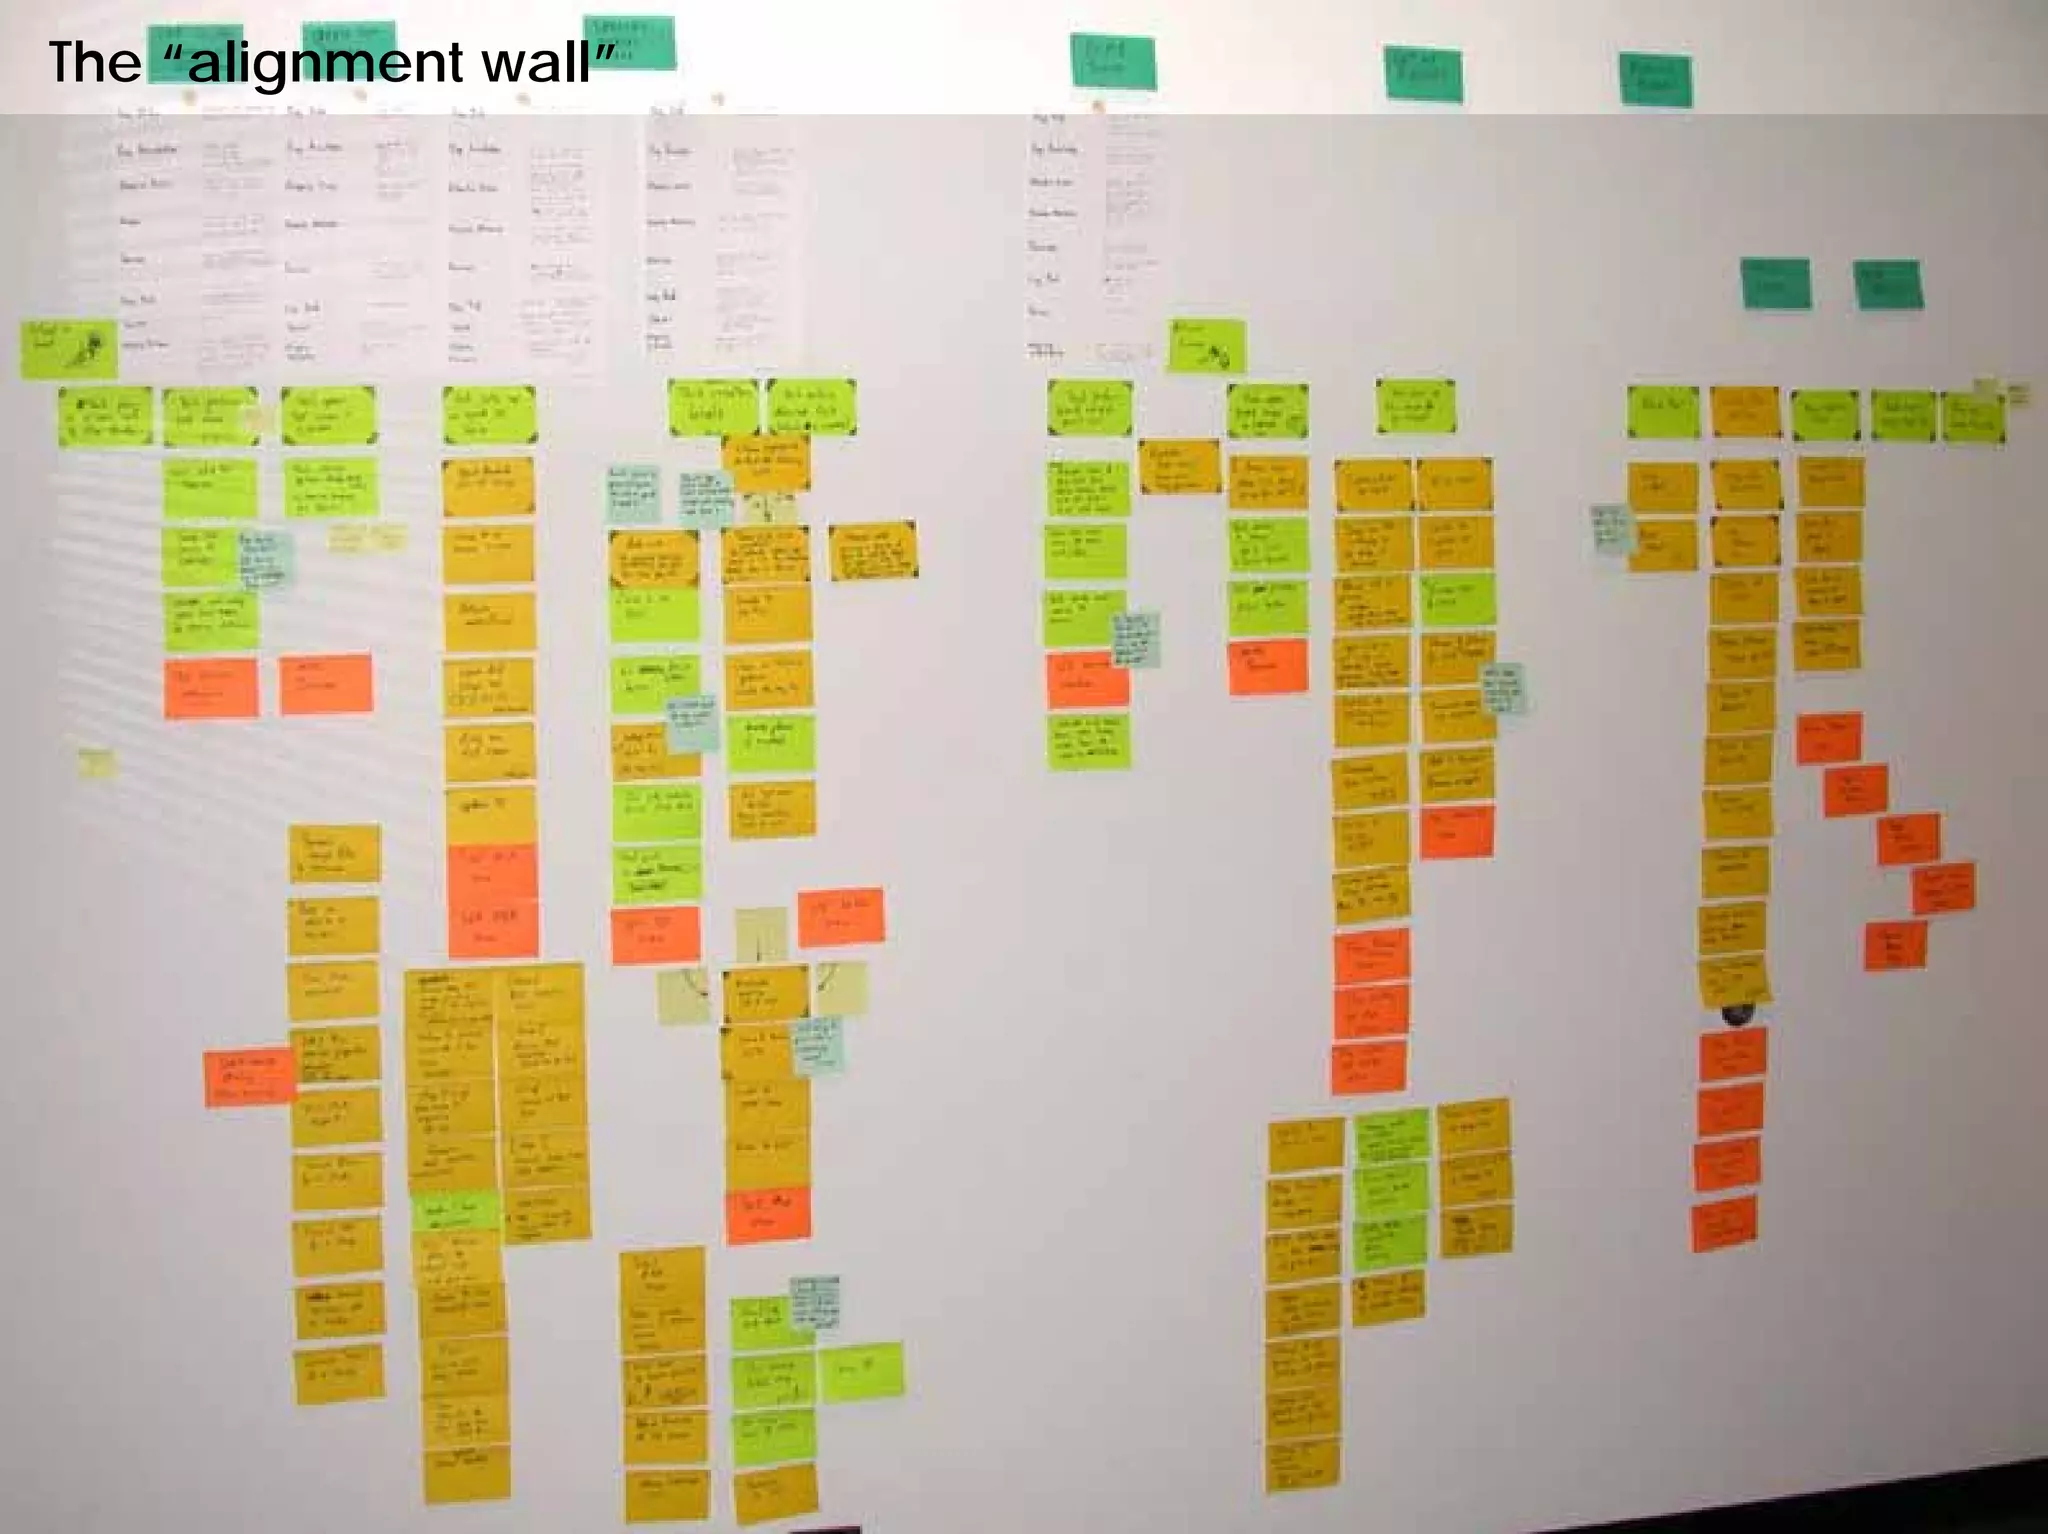
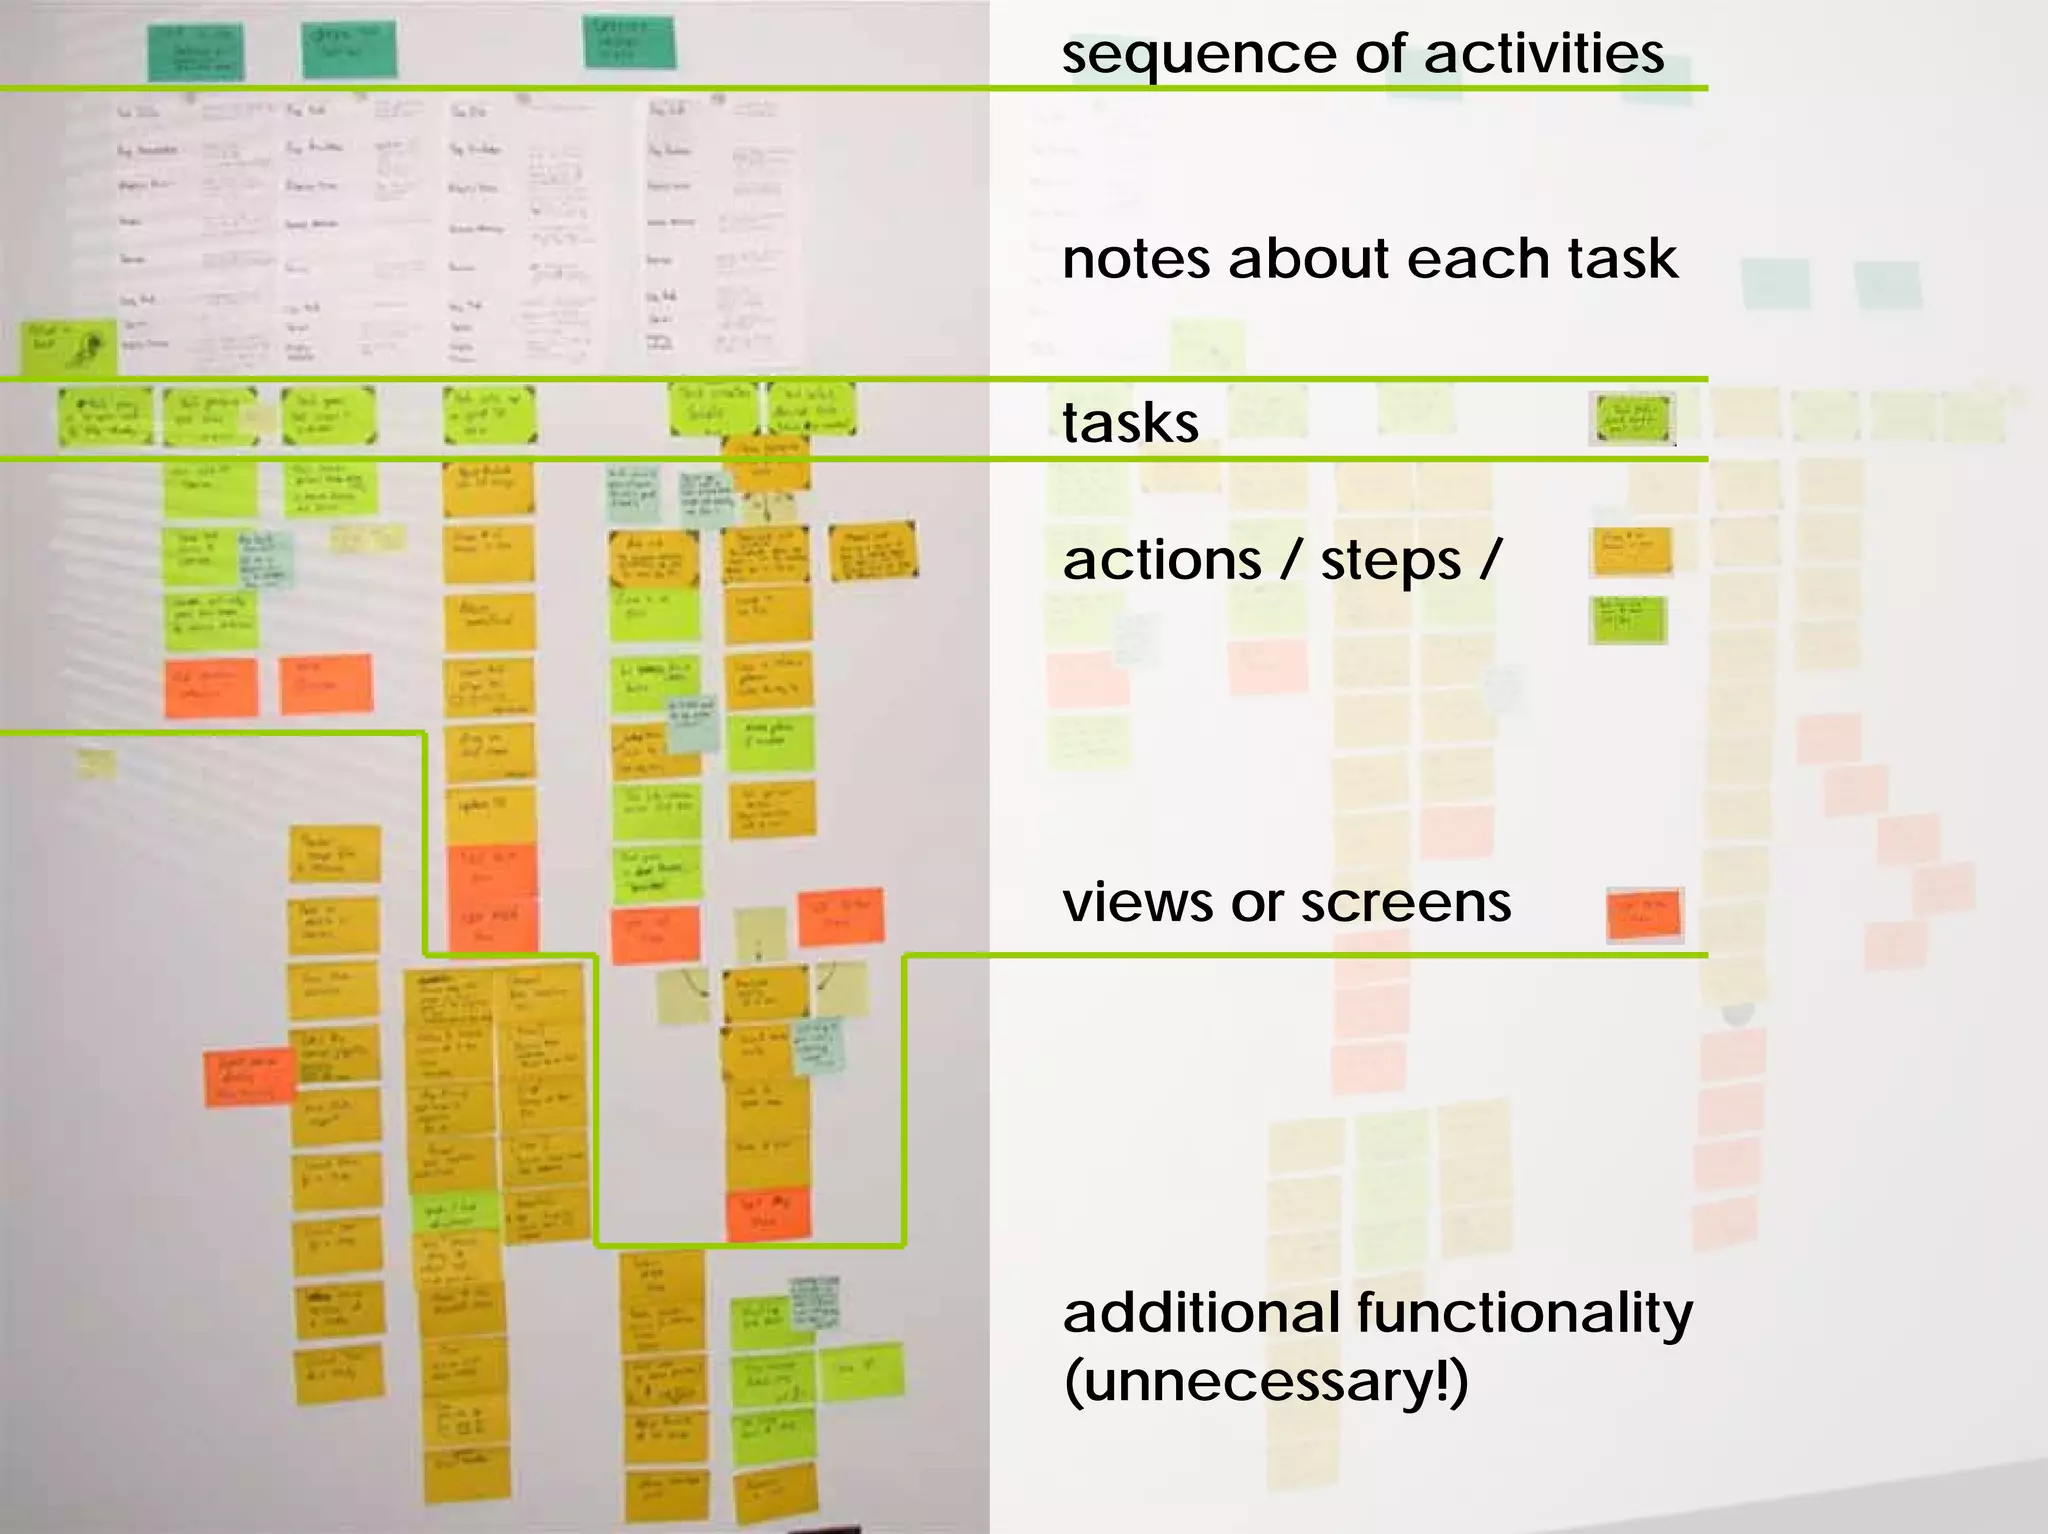


The document presents slides from a talk on designing for experiences, focusing on the Carnegie Library as a case study to illustrate principles of user experience design. It emphasizes the importance of understanding user context, activities, and goals in the design process while introducing various frameworks and tools for effective collaboration. Key recommendations include using rapid prototyping and prioritizing user-centered design to enhance the overall customer experience.


![PowerISO 9.2 Mac Crack + Serial Key Free Download 2026 [Latest] Software.pptx](https://cdn.slidesharecdn.com/ss_thumbnails/software-251207185653-5d5700e6-thumbnail.jpg?width=640&height=640&fit=bounds)


