SlideShare a Scribd company logo
1 of 38
Download to read offline
1
NOνA Muon Flux Measurement Project
as part of the Summer 2011
University of Minnesota
Research Experience for Teachers (RET) Program
and
Physics 5594 – Physics Research
Presented to Dr. Alec Habig
Carl N. Sandness
Hibbing High School
December 22, 2011
2
Historical Considerations
Early proponents of so-called “atmospheric electricity” relied on explanations derived from
Becquerel's discovery of radioactivity, which he developed in1896. Said proponents postulated that
ionized gas molecules originated solely from the decay of radioisotopes and their daughter particles of
terrestrial sources. Early observations of ionized gases of terrestrial origin found that ionization rates
decreased with in increase in altitude, thus confirming the theory. Early measurements of ionized air
by Theodor Wulf using an electrometer found that a higher level of radiation existed at the top of the
Eiffel Tower than at the base; however, his research was not widely accepted by the general
community. In 1911, Domenico Pacini observed simultaneous variations in the rate of ionization over
a lake, the sea and at a depth of 3 m under water and found that the a decrease in ionization was related
to a factor other than terrestrial sources of radioactivity.1
According to most historical references, the true study of Cosmic Rays began in 1912 with V.F.
Hess2
measuring charged particle radiation of extraterrestrial origin from 3 enhanced-accuracy Wulf
electrometers taken to 5300 ft in hot-air balloons.1
His measurements confirmed a four-fold increase in
the rate of ionization compared to ground level. Hess ruled out the sun as a source of cosmic rays by
repeating similar tests during a total solar eclipse and found that there was still a greater level of
ionization at higher altitudes. From 1913-1914, Werner Kolhörster confirmed Hess's results to an
altitude of 9 km for which Hess was subsequently awarded a Nobel Prize in Physics in 1936.
In 1934, Bruno Rossi observed a nearly simultaneous discharge of Geiger counters widely
spaced ultimately leading to measurements that became known as the “East-West Effect,” known today
as the east-west asymmetry owing to the effect of the Earth's magnetic field on trajectories of charged
particles. The next year, Hideki Yukawa predicted an unstable charged particle, then thought to be
equivalent to what we now know to be the muon. In 1937 Pierre Auget, independent to the work of
Rossi, investigated the same coincidence phenomenon and discovered particle showers from high
energy cosmic ray particle interactions at high altitudes that led to secondary interactions developing
3
cascading showers of electrons, photons and muons reaching ground level. That same year, Homi J.
Bhabda defined the probability of scattering positrons by electrons and how primary cosmic rays
interact with the upper atmosphere. In 1947, the pion was discovered from high energy nuclear
reactions, the pion decaying into muons and neutrinos in 26 ns through the use of emulsion plates. In
1948, experiments by Gottlieb and VanAllen showed that the primary cosmic ray is, in fact, composed
of protons, alpha particles and other heavy nuclei. In 1949, Enrico Fermi developed the theory of an
acceleration mechanism for cosmic ray protons whereby the protons become accelerated by “magnetic
clouds in space such as in shock waves around supernovae.”3
In 1954, the Rossi Cosmic Ray Group
from MIT measured ultra-high primary cosmic rays in excess of 1020
eV, surpassing the established
Greissen-Zatsepin-Kuzmin (GZK) cutoff for which cosmic rays were thought not to exceed. In 1957,
Van Allen at the State University of Iowa launched the “Rockoon” (Navy rocket-powered balloon) to
commence the first total cosmic ray survey at an altitude of 126 miles, his measurements determining a
latitude variation of heavy nuclei from primary cosmic radiation.
Muon experiments of the late 1950s through the 1970s focused primarily on measurements of
the solar wind and magnetosphere-related properties of the Earth, coupled to the ability of scientists to
put probes into the now robust Soviet and American space programs. In 1991, at the University of
Utah, an observation was made of an event at 3x10²⁰
eV. In 1992, the IMAX balloon-borne
superconducting magnet spectrometer was launched to measure galactic cosmic ray abundance of
protons, antiprotons, hydrogen and helium isotopes. From the 1980s forward, additional experiments
related to measurements of the solar wind, cosmic microwave background (CMB), solar irradiance and
Sun-Earth interactions. Currently, the Pierre Auger observatory in Argentina, with a detection area of
3000 km2
is exploring cosmic rays in excess of the exa-electronvolt (EeV) range, offering potential
discoveries beyond the Standard Model.2
4
Introduction
Cosmic Rays, especially true of high energy, are presently thought to originate in the blast
waves of supernova remnants, which induce an acceleration of the rays bouncing back and forth in the
magnetic field of the gas cloud. Once possessing sufficient energy, the ray can break free from its
cloud containment. The final speed of the cosmic ray (and therefore the energy) is proportional to the
size of the acceleration region and the magnetic field strength of the nebular cloud. It is thought that
ultra-high speed could have origins in Active Galactic Nuclei (AGN), quasars, gamma-ray bursters,
superstrings, dark matter, strong interaction neutrinos or other defects in the universe.4
Cosmic rays are generally categorized into three main groups.3
First, galactic cosmic rays are
thought to exist outside the solar system and have energies from roughly 100 MeV to 10 GeV,
corresponding to a proton traveling at 0.43c and 0.996c respectively.5
Via measurements of Beryllium-
10 in interstellar space, galactic cosmic rays have been determined to have a lifespan of roughly 10
billion years. The second category includes anomalous cosmic rays, which exist in interstellar space at
the edge of the heliopause of a star. This group is thought to be composed of the gases helium,
nitrogen, oxygen, neon and argon – those typically difficult to ionize. The last source of cosmic rays is
in the form of solar energetic particles which have their origins in solar flares, prominences and other
events.
Research of cosmic rays of the 1 GeV spectrum has revealed a composition of about 85%
protons, 12% alpha particles, 2% electrons and 1% heavier nuclei.2
These cosmic rays strongly interact
with atmospheric gases such as nitrogen and oxygen1
to produce mainly pions (π) but can also produce
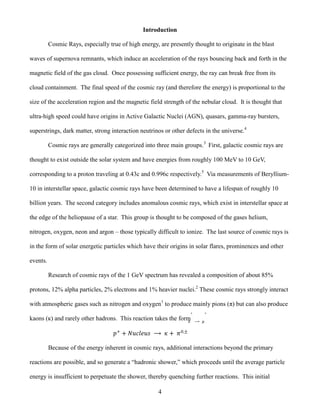
kaons (к) and rarely other hadrons. This reaction takes the form
Because of the energy inherent in cosmic rays, additional interactions beyond the primary
reactions are possible, and so generate a “hadronic shower,” which proceeds until the average particle
energy is insufficient to perpetuate the shower, thereby quenching further reactions. This initial
5
reaction between particles, or the “radiation length,” occurs over a distance of roughly 750 m at
standard temperature and pressure.
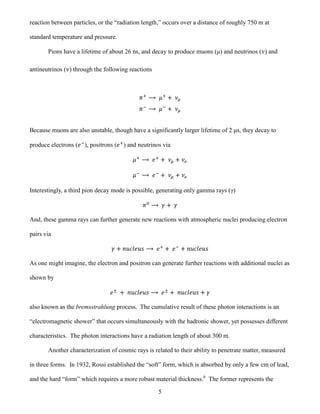
Pions have a lifetime of about 26 ns, and decay to produce muons (μ) and neutrinos ( ) and
antineutrinos ( ) through the following reactions
Because muons are also unstable, though have a significantly larger lifetime of 2 μs, they decay to
produce electrons ( ), positrons ( ) and neutrinos via
Interestingly, a third pion decay mode is possible, generating only gamma rays (γ)
And, these gamma rays can further generate new reactions with atmospheric nuclei producing electron
pairs via
As one might imagine, the electron and positron can generate further reactions with additional nuclei as
shown by
also known as the bremsstrahlung process. The cumulative result of these photon interactions is an
“electromagnetic shower” that occurs simultaneously with the hadronic shower, yet possesses different
characteristics. The photon interactions have a radiation length of about 300 m.
Another characterization of cosmic rays is related to their ability to penetrate matter, measured
in three forms. In 1932, Rossi established the “soft” form, which is absorbed by only a few cm of lead,
and the hard “form” which requires a more robust material thickness.6
The former represents the
6
electromagnetic portion whereas the latter is mostly muons. The third form is thought to be that
produced from electron and muon neutrinos and their antineutrinos. The tau neutrino arises from the
decay of the tau lepton, which is short-lived and also difficult to form due to its larger mass. This
makes the tau neutrino uncommon, and if it is detected it is mostly likely the result of an oscillation
from a muon or an electron neutrino. Detection of neutrinos requires detectors of multiple orders of
magnitude larger than those to detect cosmic ray muons, the existence of this particle being confirmed
by observation and measurement in such projects as Gran Sasso, MINOS, NOVA, SuperK and others.
The process of atmospheric cosmic ray interactions is summarized in Figure 1.
Figure 1. Example of a Cosmic Ray Shower6
7
Apparent energy “losses” of energy in cosmic rays passing through matter varies in form
depending on the species in question.2
These losses influence the depth to which radiation will travel
in a particular medium. The first loss is the average energy loss of radiation through ionization, which
is governed by the Bethe-Bloch equation2
where z is the charge, Z is the atomic number, A is the atomic mass, m is the mass of the hit particle, K
is 30.7 keV·m2
/kg, I is the ionization potential, β is the ratio of v/c, p is the momentum of the incident
particle in GeV , and γ is equal to . It should be noted that this equation is valid
only for 0.05 < βγ < 500.
The second loss is for electrons or positrons, which can lose energy from either ionization (for
those that have low initial energy) or via bremsstrahlung in the Coulombic field of the atom (for those
of high initial energy), so particle proximity to the nucleus is a factor. Losses to ionization follow the
aforementioned calculations. Losses for bremsstrahlung are dependent upon the rate of acceleration,
and the power loss is proportional to its square. Since the field itself is dependent upon nuclear charge,
the probability of an interaction is proportional to the inverse square of the mass. Generally, for
particles such as the muon, the bremsstrahlung loss becomes important for energies of greater than
10000 times the electron. Radiation lengths are inversely proportional to Z and therefore the density of
the material. Example radiation length for selected materials is summarized in Table 1.
Table 1. Radiation Lengths for Electrons and Positrons as a function of material2
Material Radiation Length (m)
Air 300
Water 0.36
Carbon 0.2
Iron 0.02
Lead 0.01
8
A third loss is inherent to the photon as a result of the photoelectric effect. For photons of
energy higher than several keV, Compton scattering is the predominant loss, though for those above 1
MeV, pair production overshadows Compton scattering as described by the following equation
The final loss is that found in hadrons and occurs via ionization and the strong interaction. An
incoming particle thus becomes integrated to the parent nucleus and the formation of secondary
hadrons from its destruction. The distance that a neutron beam will become attenuated to 1/e for a
material is called the collision length, which again depends upon the material as shown in Table 2.
Table 2. Hadronic Collision Lengths as a function of material2
Material Collision Length (m)
Air 750
Water 0.85
Carbon 0.38
Iron 0.17
Lead 0.17
It is evident that ionization lengths for hadronic collision energy losses have a lesser
dependence on the nature of the material through which they pass or its phase as a solid or liquid.
However, this fact may play a role in the selection of material for calorimeter-type detectors.
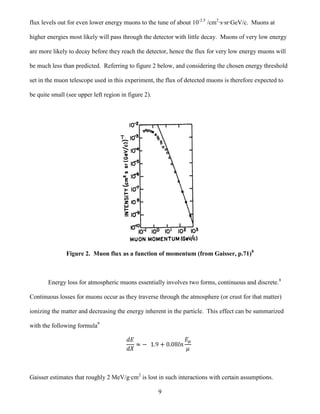
As in any valid scientific endeavor, it is of interest for this experiment to predict what the
incident muon flux might be and then compare the measured value to that which has been predicted.
Based upon the experimental results summarized by Allkofer and Greeder7
and calculations for
predicted muon flux as a function of the muon energy spectrum (figure 2, linear fit to data), it is
possible to predict the energy of an incoming atmospheric muon if one has a measured flux of incident
muons. The deviation of measured values at roughly 10 MeV is noted according to this figure, and the
9
flux levels out for even lower energy muons to the tune of about 10-2.5
/cm2
·s·sr·GeV/c. Muons at
higher energies most likely will pass through the detector with little decay. Muons of very low energy
are more likely to decay before they reach the detector, hence the flux for very low energy muons will
be much less than predicted. Referring to figure 2 below, and considering the chosen energy threshold
set in the muon telescope used in this experiment, the flux of detected muons is therefore expected to
be quite small (see upper left region in figure 2).
Figure 2. Muon flux as a function of momentum (from Gaisser, p.71)8
Energy loss for atmospheric muons essentially involves two forms, continuous and discrete.8
Continuous losses for muons occur as they traverse through the atmosphere (or crust for that matter)
ionizing the matter and decreasing the energy inherent in the particle. This effect can be summarized
with the following formula9
Gaisser estimates that roughly 2 MeV/g·cm2
is lost in such interactions with certain assumptions.
10
Discrete energy losses for muons occur via bremsstrahlung (though for muons, bremsstrahlung is
essentially negligible), electromagnetic interactions with nuclei and direct e+
e-
pair-production.8
The
discrete processes are of primary concern for high-energy muons and for those traveling deep
underground.8
Energy loss for muons underground is a function of the different ranges of muons and therefore the
distribution of energies at certain depths. The general rate of energy loss for muons is calculated8
from
where and 2.5x10⁵
g·cm2
for rock. When the above equation is
equated to the energy loss by bremsstrahlung, a critical energy ( ) is defined. Above this critical
energy, radiative losses are more significant than continuous loss, and the critical energy is found to be
about 500 GeV for muons.8
A general solution8
to the equation above is given by
where E0 is the initial energy of the muon (or beam of muons). From this, it is possible to estimate the
vertical flux of muons at depth X (relative to the surface) via8
where the energy spectrum for the muons could then be calculated8
through
and .8
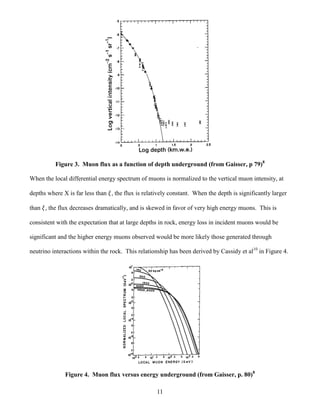
The muon flux as a function of intensity is shown in figure 3.
11
Figure 3. Muon flux as a function of depth underground (from Gaisser, p 79)8
When the local differential energy spectrum of muons is normalized to the vertical muon intensity, at
depths where X is far less than , the flux is relatively constant. When the depth is significantly larger
than , the flux decreases dramatically, and is skewed in favor of very high energy muons. This is
consistent with the expectation that at large depths in rock, energy loss in incident muons would be
significant and the higher energy muons observed would be more likely those generated through
neutrino interactions within the rock. This relationship has been derived by Cassidy et al10
in Figure 4.
Figure 4. Muon flux versus energy underground (from Gaisser, p. 80)8
12
The NOvA site
NOvA is an acronym for the NuMI Off-Axis Neutrino Appearance experiment, a second-
generation long-baseline experiment designed for the determination of electron and muon neutrino
oscillation parameters. The NOvA site is located on St. Louis Country Road 129 about 5.5 miles from
Highway 53 North on Bright Star Road, just off the Ash River Trail in Kabetogama county Minnesota.
Its geographical location places it 14 mrad off-axis from the bulk of the NuMI beam, and at 810 km
from Fermilab, it is perfectly situated for the electron neutrino oscillation appearance.11
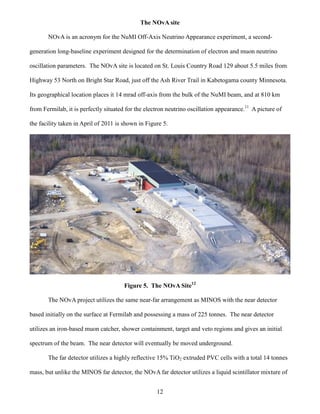
A picture of
the facility taken in April of 2011 is shown in Figure 5.
Figure 5. The NOvA Site12
The NOvA project utilizes the same near-far arrangement as MINOS with the near detector
based initially on the surface at Fermilab and possessing a mass of 225 tonnes. The near detector
utilizes an iron-based muon catcher, shower containment, target and veto regions and gives an initial
spectrum of the beam. The near detector will eventually be moved underground.
The far detector utilizes a highly reflective 15% TiO2 extruded PVC cells with a total 14 tonnes
mass, but unlike the MINOS far detector, the NOvA far detector utilizes a liquid scintillator mixture of
13
mineral oil, 5% pseudocumene and wavelength-shifting compounds PPO and bis-MSB. The far
detector is to be installed in a 60 foot deep concrete-lined cavern that has been excavated from the
granite surface. This ensures a modest level of protection from wide angle and horizontally-oriented
secondary and tertiary particles. To properly mitigate the vertical background events, the detector hall
incorporates a 6 inch layer of barite and a loose granite overlay on top of a thin concrete roof, the
combination of materials effectively equating to a 4-foot thick concrete layer.13
A veto shield to be
installed above the far detector will further enhance the discriminatory process of neutrino-induced
events. A model of the far detector under construction is shown in Figure 6.
Figure 6. NOvA Far Detector13
The focus of this muon telescope project is to gather sufficient measurements of the muon flux
inside and outside of the NOvA far detector building to provide additional information as to naturally-
derived muon flux in the detector. A previous measurement was made by Walter and Marshak14
using a
small table-top muon detector. The present study employs a larger muon telescope with a narrower
solid angle and therefore more precise estimate of muon flux at the NOvA site.
14
Instrumentation
The muon telescope assembly used in our measurements at the NOvA site is pictured in Figure
7. The telescope configuration uses all 4 modules in a vertical orientation. As the telescope is over 9
feet tall assembled, to facilitate the safe operation of this device it was necessary to fabricate a
supporting cradle to hold the 4 modules in place when the assembly was tilted. Wood and hardware
was purchased from Orr Hardware in Orr, MN. The design of the cradle was work of the author with
considerable help from Ron Williams, Scott Sawyer and Larry Salmela of the NOvA facility staff. The
author is grateful for their logistical and practical support in building/dismantling and moving this
assembly throughout the detector hall.
Figure 7. Muon telescope without supports
The modules, fabricated originally from components of Dr. Richard Gran's PhD thesis, is
comprised of a 45.72 ± 0.05 cm x 45.72 ± 0.05 cm x 1.91 ± 0.05 cm plastic scintillator sheet centered
on the bottom of the cubic 55.88 ± 0.05 cm x 55.56 ± 0.05 cm x 28.63 ± 0.05 cm wooden box
constructed from 1/2” plywood secured with deck screws. A 3D model of a module was made using
PTC’s Pro/Engineer Wildfire 3.0 and is shown in Figure 8.
15
Figure 8. Pro/Engineer model of the muon telescope module showing PMT
The inside of the module is lined with a highly reflective fabric that is similar in appearance to
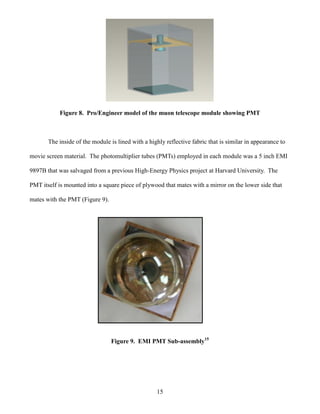
movie screen material. The photomultiplier tubes (PMTs) employed in each module was a 5 inch EMI
9897B that was salvaged from a previous High-Energy Physics project at Harvard University. The
PMT itself is mounted into a square piece of plywood that mates with a mirror on the lower side that
mates with the PMT (Figure 9).
Figure 9. EMI PMT Sub-assembly15
16
This PMT sub-assembly fits into a plywood “shelf” that correctly positions the PMT into the module
such that a plywood lid can be placed on the top of the module, thereby limiting the influx of light. To
further mitigate light entrance, thick black plastic bags was placed over the PMT from above in two
layers, and duct tape was used to seal the bags and cracks in the wooden structure (Figure 10).
Figure 10. Light mitigating procedure for a module15
As shown above, duct tape black electrical tape was used to seal the high-voltage and signal cables that
penetrated this light shielding. The module is completed with a 1/2” plywood cover than matches the
square cross section of the module.
The discriminator/counter was a QuarkNet circuit board16
that Dr. Gran had obtained from
Fermilab for use with the muon telescope and is shown in Figure 11. The card is capable of measuring
single and coincidence measurements, and has both a networking port and GPS capability. The card
was connected via MiniDin 15 cabling to a desktop PC and the 4 channels of the card were connected
via a signal cable to respectively to each module of the telescope array. The DAQ threshold voltage
was optimized via “trim pots” (circled in yellow) and checked using a Fluke 79III rms multimeter.
Figure 11. The QuarkNet DAQ card16
17
High-Voltage was supplied to the modules by way of a 4-channel Bertan Model 380 N 10 kV
power supply mounted in a crate with a cable conversion module and a LeCroy Model 623B octal
analog logic/discriminator/oscillator, shown in Figure 12. The Voltage to each module was optimized
using the same Fluke 79III rms multimeter used in the DAQ optimization, where adjustments to the
high-voltage channels were made by turning the analog rotary switch (circled in yellow).
Figure 12. High-Voltage Power Supply and Discriminator Crate15
The desktop computer utilized, affectionately known as “Tau,” was a 1 GHz Dell Pentium III
running Scientific Linux SL 2.6.18-238.12.1e15. Software used included the muontelescope.sh
program written by Dr. Gran and the KATE data analysis program. This computer was configured
from a networked connection at UMD to a stand-alone mode at NOvA by Dr. Habig, and so the timing
for the measurements was based solely upon the internal clock of the computer. Earlier measurements
of muon interactions with this unit at UMD utilized local network timing.
The manipulated DAQ settings include gate width, tmc delay, seconds, events, singles seconds
and coincidence. The coincidence can be modified to between 1 and 4 modules, where 1 would be for
the “shower” mode and between 2 and 4 for the module telescope mode. The coincidence settings are
used to trigger a count. Seconds and events are used as triggers for the total time of an experimental
run or total number of events preset. The singles seconds instructs the card how often to sample singles
data. The tmc delay allocates a set amount of time in which a coincidence event can occur,
18
proportional to the time it would take a muon to travel from the top layer of scintillator of the muon
telescope to the bottom layer. The gate width is the time after the first trigger in which a successive
event or series of events occurs, and is used in conjunction with the tmc delay to accurately record a
coincidence event. Hence, the DAQ card “discriminates” between events based upon the coincidence
of all four modules, which gives a more defined solid angle and therefore more accurate measure of
flux with the telescope.
19
Calibration Procedures for the DAQ
The QuarkNet DAQ was initially set to 0.050 V in earlier trials but upon assembly at NOvA, it
became clear through errors in output data that the calibrations were incorrect. The high voltage for
each module was adjusted in increments of 10-20 volts through several trials and singles for each
module and coincidences were collected. The optimized values for the modules were 1079 V for alpha,
1026 V for beta, 1252 V for gamma and 1249 V for delta. The threshold values for each channel of the
DAQ card were initially set to 0.050 V and 5 minute trials of 4-module coincidences and singles data
was also collected. This procedure was repeated by increasing the threshold voltage of each channel on
the DAQ by 0.010 V and then collecting singles and coincidence data. Calculating the derivative of the
data and subtracting consecutive singles rates revealed a peak (red diamond) in each data set shown in
Figure 13. Given that this peak corresponds to the muon energy of interest, and given the 4-fold
coincidence necessary for the muon count, it was possible to filter background noise from the data to at
least the first approximation.
Figure 13. Muon flux singles vs. DAQ Threshold Voltage15
0
5
10
15
20
0.05 -
0.06
0.06 -
0.07
0.07 -
0.08
0.08 -
0.09
0.09 -
0.10
0.10 -
0.11
0.11 -
0.12
0.12 -
0.13
ΔSinglesRatehz
Threshold Voltage (V)
Optimization Data for Alpha
0
2
4
6
8
0.05 -
0.06
0.06 -
0.07
0.07 -
0.08
0.08 -
0.09
0.09 -
0.10
0.10 -
0.11
0.11 -
0.12
0.12 -
0.13
ΔSinglesRatehz
Threshold Voltage (V)
Optimization Data for Beta
0
5
10
15
20
0.05 -
0.06
0.06 -
0.07
0.07 -
0.08
0.08 -
0.09
0.09 -
0.10
0.10 -
0.11
0.11 -
0.12
0.12 -
0.13
ΔSinglesRateshz
Threshold Voltage (V)
Optimization Data for Gamma
0
5
10
15
20
25
0.05 -
0.06
0.06-
0.07
0.07 -
0.08
0.08 -
0.09
0.09 -
0.10
0.10 -
0.11
0.11 -
0.12
0.12 -
0.13
ΔSinglesRateshz
Threshold Voltage (V)
Optimization Data for Delta
20
Given the data collected, each channel was set to the optimal thresholds: alpha at 0.095 V, beta
at 0.075 V, gamma at 0.095 V and delta at 0.105 V. These settings gave consistent singles counts
varying less than 1 per minute per channel between all four channels and a coincidence rate of better
than 0.48 per minute or 0.008 per second.
21
Muon Telescope Measurement Locations at NOvA
In order to make reasonable measurements of muon flux in the NOvA far detector hall, it was
decided that a total of 10 flux measurements would be made inside the building: 9 near the centerline
of the hall and 1 outside the rails near the middle of the hall on the east side. The 9 measurements were
broken down into 3 sets at approximately the south, middle and northern portions of the future far
detector installation. At each of these locations, a vertical and +/- 21 degree from vertical measurement
was taken. The indoor measurement locations (in meters) are summarized below in Figure 14 (viz.
dots superimposed on white background). A muon shower measurement was also made near the
southern-most third of the future detector location (small cluster of squares representing the array).
Figure 14. Muon Measurements inside NOvA Far Detector Hall
22
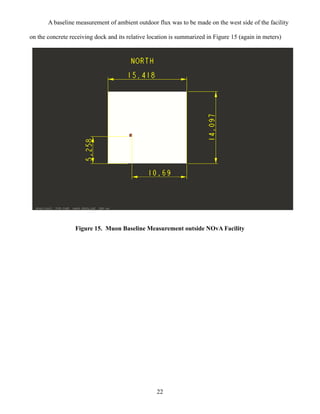
A baseline measurement of ambient outdoor flux was to be made on the west side of the facility
on the concrete receiving dock and its relative location is summarized in Figure 15 (again in meters)
Figure 15. Muon Baseline Measurement outside NOvA Facility
23
Experimental Design
The muon telescope was transferred from UMD Physics to the NOvA site on June 28, 2011 and
assembled on the lowermost level of the NOvA Far Detector Hall. The muontelescope.sh program
installed on Tau was used to run the DAQ and store collected data. To allow for a sufficiently large
data set for each measurement, it was decided that each trial would run for 3 hours (10800 s as set in
the muontelescope program). Zero zenith angle data was collected using the initial DAQ and HV
settings from experiments at UMD at the north, middle and south ends in and also at a +21 degree
angle on the north end. However, from the initial measurements collected, it became clear that there
was a problem with one of the modules, specifically beta, as the data log indicated erroneous code.
Attempts were made to alter that HV settings to achieve better singles rates for each module, however
the rates for each module were vastly different from one another.
Krissie and Travis proceeded to follow a calibration procedure whereby the module HV for each
was set to 1 kV and the DAQ thresholds were adjusted through a 0.050 V to 0.140 V range, and singles
and coincidence data throughout this range were collected. Analysis of the data again indicated that the
thresholds were again widely different. Based on this second data collection, it was found that with
minor adjustments to the HV on alpha, combined with threshold calibrations for the four channels, it
would be possible to optimize the settings for all four modules. The results of this final 5 minute
calibration run are found in Table 3.
Table 3. High-Voltage and Threshold settings for telescope modules in final calibration
Module Threshold Voltage High Voltage Muon Count
Alpha 0.0950 1037 24.0251
Beta 0.075 1026 23.4774
Gamma 0.095 1252 24.1106
Delta 0.105 1249 23.5176
4 module coincidence 0.487437
24
Given project time constraints for facility, personnel, movement of the instrument and workday
efficiency, it was decided that new trials at 2 hours would provide a sufficiently large data set while still
maintaining a reasonably low uncertainty in muon flux measurement. Utilizing the optimized settings
from Table 3, data was collected in the telescope mode using the muontelescope.sh program inside the
rails of the Far Detector Hall at 3 locations: the north end just under the cutoff for the roof shielding
vertically, approximately midway south, and at the end of the hall near the south wall at the orientations
of vertical, plus 21 degrees (defined as westward) and minus 21 degress (eastward) as shown in Figure
11. Coincidence was set to four, singles rates to 100 seconds, gate width to 10 and tmc delay to 6.
Gate width and tmc delay are measured in “clock ticks,” so multiplying by 24 ns/tick results in a gate
width of 240 ns and a tmc delay of 144 ns.
The electromagnetic shower measurement was performed as planned using the “shower”
program pre-installed on Tau. For the shower arrangement, the modules were assembled in a square
pattern, 6 feet apart measured from the edge of each module with the computer cart in the middle of the
larger square. In this mode, the gate width was changed to 150 and tmc delay to 50. It was expected
that the rate of accidental coincidences in shower mode would be minimal and would not factor greatly
into the measurements obtained.
An additional measurement of zenith was taken outside the rails on the east wall near the
middle of the detector hall and to gauge atmospheric background outside of the NOvA building, a
measurement of muon flux in telescope mode was made on the concrete pad in the receiving dock area.
25
Data Analysis
As mentioned previously, the data compiled for the experiment was stored on Tau. Given the
limitations of the controller card, only 100 s of data can be collected in any one interval, so repeated
intervals of 100 s appear in each data log file. The data collected is in the form of a text file, a portion
of which is shown below in Figure 16.
pctime 1310479873 62391 Tue Jul 12 09:11:13 2011ST
ST 0003 2351 0061 2720 0 0 0 0 00000000 32 5535 006E5100 000A013F
DS
DS S0=00001123 S1=000010FD S2=00001163 S3=00001198 S4=0000003B S5=00000000
EEB1C0A9 BF 01 00 01 00 01 00 01 00000000 0 0 0 0 8 +0000
EEB1C0AA 01 00 2C 01 26 38 21 3D 00000000 0 0 0 0 8 +0000
EEB1C0AB 01 2F 01 2F 00 01 00 01 00000000 0 0 0 0 8 +0000
Figure 16. Sample data log from muon telescope measurements
The first line indicates the use of internal computer clock time followed by the date and local
time. The fourth line gives “singles” rates, which represent the interaction of muons with an individual
scintillator sheet, designated by S. There are 6 channels on the QuarkNet DAQ card. Channels 1-4
correspond to each of the four modules in the muontelescope, the first channel, Alpha, is S0. The
numerical result for each channel is expressed in hexadecimal, which is a base-16 (common to digital
electronics) system utilizing the numerals 0-9 and letters a-f representing the numbers 10 through 15
respectively.17
For example, the hexadecimal indicated for S1 is 000010FD, which corresponds to
4349 hits (1 x 163
+ 0 x 162
+ 15 x 161
+ 13 x 160
). Channel 5 is used to represent coincidences set to
predetermined parameters in muontelescope.sh. For this particular run, there were 59 coincidences
between the 4 modules of the muon telescope.
Starting with the fifth line, hexadecimal code starts each line and indicates incident times
relative to the starting time for each 100 s interval. Coincidences can be drawn from the code anytime
there is a registered hit on all 4 channels within the gate closure time, which is the time set by the DAQ
card to allow for the recognition of a true coincidence event. In the case of the QuarkNet DAQ card,
this gate time is 100 ns, which means that a muon striking the first scintillator has less than 100 ns to
reach the bottom scintillator in order for a true coincidence to be recorded.
26
The Solid Angle of the Muon Telescope
The effective viewing area of any observational instrument is limited by its cross-sectional area
and its length. Mathematicians and scientists refer to this narrowed viewing field as the solid angle of
the instrument. The solid angle is defined18
as the two-dimensional angle in three dimensional space
that an object subtends at a point. In simpler terms, it refers to the magnitude of an object seen from a
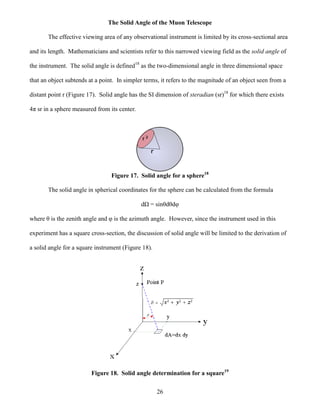
distant point r (Figure 17). Solid angle has the SI dimension of steradian (sr)18
for which there exists
4π sr in a sphere measured from its center.
Figure 17. Solid angle for a sphere18
The solid angle in spherical coordinates for the sphere can be calculated from the formula
dΩ = sinθdθdφ
where θ is the zenith angle and φ is the azimuth angle. However, since the instrument used in this
experiment has a square cross-section, the discussion of solid angle will be limited to the derivation of
a solid angle for a square instrument (Figure 18).
Figure 18. Solid angle determination for a square19
27
For the muon telescope, it can be easier to view the solid angle by the differential area (dA)
equated to the projection of this area divided by the square of the distance R.19
In this case, the distance
R from point P has a projected area of
dA = dAcosθ =
and the solid angle becomes
dΩ = = =
The calculation of the solid angle was attempted using Wolfram Mathematica 7.0.20
The calculations
proved difficult and the solution outputs for this calculation had 3 errors in the integrations, mainly
with an output of imaginary roots.
A second method was employed to determine the solid angle of the telescope using Monte Carlo
methods, which has origins in Buffon's needle experiment, Fermi's unpublished neutron diffusion and,
most notably, Von Neumann and Ulam's work at Los Alamos in radiation shielding experiments. A
simple example21
of Monte Carlo applied to mathematics is the determination of the numerical value of
pi. First, a square is drawn and a circle inside the square such that the edges of the circle are tangent to
the sides of the square. Next, uniformly spread small objects within the circle and the square. Then, a
ratio is taken of the number of objects inside the circle alone as compared to the total number of
objects. By way of geometry, this latter ratio is equivalent to pi/4, so multiplying by 4 will yield an
estimate of pi. The more objects used, the better the estimation.
The Monte Carlo method for determining the solid angle of an instrument such as the muon
telescope has been attempted by O'Brien22
, and it has been used in several recent experiments involving
radiation dosimetry.23,24
The algorithm for the Monte Carlo method in solid angle determination is to
assign randomly chosen numbers to simulate the coordinates of a muon interaction with a scintillator
plane and then whether or not the simulated muon is likely to encounter a second scintillator plane
based upon the original particle trajectory and the statistical likelihood that it can hit a secondary plane.
If this is repeated enough times, a ratio of those hitting both planes compared to the total will make a
28
ratio that is proportional to some fraction of the solid angle. Multiplying through by this fraction will
yield an estimate for the solid angle of the telescope. The Monte Carlo Code for this experiment,
developed by Travis Olson and Krisse Nosbisch is found in Appendix A, and the value of the solid
angle acceptance obtained for the muon telescope using this code is 88.4 ± 0.36 cm2
·sr.15
29
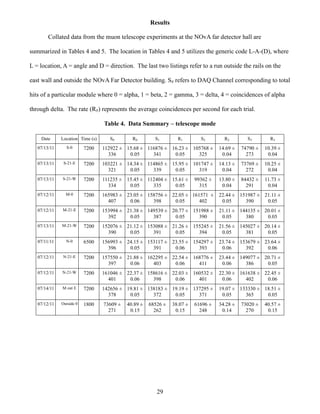
Results
Collated data from the muon telescope experiments at the NOvA far detector hall are
summarized in Tables 4 and 5. The location in Tables 4 and 5 utilizes the generic code L-A-(D), where
L = location, A = angle and D = direction. The last two listings refer to a run outside the rails on the
east wall and outside the NOvA Far Detector building. S# refers to DAQ Channel corresponding to total
hits of a particular module where 0 = alpha, 1 = beta, 2 = gamma, 3 = delta, 4 = coincidences of alpha
through delta. The rate (R#) represents the average coincidences per second for each trial.
Table 4. Data Summary – telescope mode
Date Location Time (s) S0 R0 S1 R1 S2 R2 S3 R3
07/13/11 S-0 7200 112922 ±
336
15.68 ±
0.05
116876 ±
341
16.23 ±
0.05
105768 ±
325
14.69 ±
0.04
74790 ±
273
10.39 ±
0.04
07/13/11 S-21-E 7200 103221 ±
321
14.34 ±
0.05
114865 ±
339
15.95 ±
0.05
101747 ±
319
14.13 ±
0.04
73769 ±
272
10.25 ±
0.04
07/13/11 S-21-W 7200 111235 ±
334
15.45 ±
0.05
112404 ±
335
15.61 ±
0.05
99362 ±
315
13.80 ±
0.04
84432 ±
291
11.73 ±
0.04
07/12/11 M-0 7200 165983 ±
407
23.05 ±
0.06
158756 ±
398
22.05 ±
0.05
161571 ±
402
22.44 ±
0.05
151987 ±
390
21.11 ±
0.05
07/12/11 M-21-E 7200 153994 ±
392
21.38 ±
0.05
149539 ±
387
20.77 ±
0.05
151988 ±
390
21.11 ±
0.05
144135 ±
380
20.01 ±
0.05
07/13/11 M-21-W 7200 152076 ±
390
21.12 ±
0.05
153088 ±
391
21.26 ±
0.05
155245 ±
394
21.56 ±
0.05
145027 ±
381
20.14 ±
0.05
07/11/11 N-0 6500 156993 ±
396
24.15 ±
0.05
153117 ±
391
23.55 ±
0.06
154297 ±
393
23.74 ±
0.06
153679 ±
392
23.64 ±
0.06
07/12/11 N-21-E 7200 157550 ±
397
21.88 ±
0.06
162295 ±
403
22.54 ±
0.06
168776 ±
411
23.44 ±
0.06
149077 ±
386
20.71 ±
0.05
07/12/11 N-21-W 7200 161046 ±
401
22.37 ±
0.06
158616 ±
398
22.03 ±
0.06
160532 ±
401
22.30 ±
0.06
161638 ±
402
22.45 ±
0.06
07/14/11 M out E 7200 142656 ±
378
19.81 ±
0.05
138183 ±
372
19.19 ±
0.05
137295 ±
371
19.07 ±
0.05
133330 ±
365
18.51 ±
0.05
07/12/11 Outside 0 1800 73609 ±
271
40.89 ±
0.15
68526 ±
262
38.07 ±
0.15
61696 ±
248
34.28 ±
0.14
73020 ±
270
40.57 ±
0.15
30
Table 5. Data Summary – shower mode
Date Location Time
(s)
S0 R0 S1 R1 S2 R2 S3 R3
07/14/11 M-0-N 7200 149057
± 386
20.70 ±
0.05
132845
± 364
18.45
± 0.05
138692 ±
372
19.26 ±
0.05
152901 ±
391
21.24 ±
0.05
07/21/11 UMD 10800 419394
± 648
38.83 ±
0.06
438878
± 662
40.64
± 0.06
467513 ±
684
43.29 ±
0.06
473122 ±
688
43.81 ±
0.06
31
Error Determination
The rate of accidental coincidence for this experiment15
was calculated from Raccepted = 4T3
RoR1R2R3,
where T is the tmc time delay. Accordingly, the average error for four-fold coincidences in each trial is
listed in Table 6. As an example, using values from Table 4 for S0, the accidental rate of coincidence
was determined to be 6.68 x 10²³
, a full 22 orders of magnitude less than the measured rate of
coincidence, therefore effectively negating accidental coincidences from the calculations of muon flux.
This miniscule level of coincidence is also true of the other measured fluxes in Tables 6 and 7.
Table 6. Calculated Error for Telescope mode trials
Location Coincidences Coincidence rate (s-1
) Flux (1/cm2
/sr/s) x 10-3
S-0 1616 ± 40 0.224 ± .004 2.53 ± 0.046
S-21-E 1384 ± 37 0.192 ± .005 2.17 ± 0.067
S-21-W 1673 ± 41 0.232 ± .005 2.62 ± 0.056
M-0 3245 ± 57 0.451 ± .009 5.10 ± 0.10
M-21-E 2688 ± 52 0.373 ± .007 4.22 ± 0.081
M-21-W 2812 ± 53 0.391 ± .008 4.42 ± 0.092
N-0 3091 ± 56 0.475 ± .009 5.37 ± 0.10
N-21-E 2860 ± 53 0.397 ± .008 4.49 ± 0.094
N-21-W 2824 ± 53 0.392 ± .008 4.43 ± 0.098
M out E 3211 ± 57 0.446 ± .009 5.05 ± 0.010
Outside 0 1004 ± 32 0.66 ± .021 7.46 ± 0.11
Standard sea
level25
8.2
Table 7. Calculated Error for Electromagnetic Show Measurement
Location Electromagnetic Showers Electromagnetic Shower Rate (s-1
)
M-0 20 ± 4.5 0.0028 ± 0.0006
UMD outside 130 ± 11.4 0.0120 ± 0.001
32
The values derived in Tables 5 and 6 suggests that the data collection methods were, for the
most part, less than 1% for a one sigma distribution. Errors inherent in this experiment include
uncertainty in measurement of the detector dimensions (smaller contribution), the detector hall (larger
contribution due to lack of rigidity of measuring tape) and data collection using the DAQ device. The
fiducial volume of the detector is larger than that of Alex Walter's, yet smaller the the NOvA far
detector will be, therefore verification of the data with the NOvA far detector will prove invaluable in a
more precise flux measurement.
Discussion
The measured flux outside of the NOvA facility is less than the standard value listed in Table 6
due to the threshold value of 35.05 MeV used in this experiment. An equation to best describe this
difference was not found, but the difference observed reflects the expected result as the incident muons
may decay before causing the necessary four-fold coincidence and therefore not be counted.
Measurements of muon flux at the south end of the NOvA detector hall revealed a 50.4 ± 1.3%
decrease when compared to the center of the detector hall and even less than that measured at the north
end of the detector hall. The barite layer is obviously the first reason for such a deficit, but it is thought
that the thick concrete wall adjacent to the measurement site at the south end as well as overhead
ductwork may have contributed to this observation. Measurements on the east and west walls are
likewise smaller due to the same shielding effects. The north end of the detector hall had the highest
measured flux in large part due to the “gap” in shielding of the overhead barite and lesser overhead
infrastructure.
When tilted to 21˚ from vertical either east or west, there was a general decrease in flux due to
the angular dependence of muon intensity. The flux in the westerly direction was for the most part
greater than the east, a verification of the aforementioned East-West effect.
There is no definite standard for the electromagnetic shower measurements, and so the results of
the shower mode in this experiment verify the fact that the barite and facility construction materials
33
will eliminate most of the electromagnetic flux from the future measurements of muons in the NOvA
far detector once installed and collecting data.
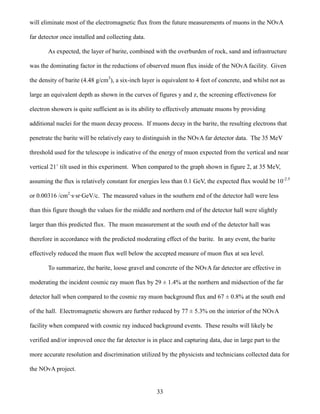
As expected, the layer of barite, combined with the overburden of rock, sand and infrastructure
was the dominating factor in the reductions of observed muon flux inside of the NOvA facility. Given
the density of barite (4.48 g/cm3
), a six-inch layer is equivalent to 4 feet of concrete, and whilst not as
large an equivalent depth as shown in the curves of figures y and z, the screening effectiveness for
electron showers is quite sufficient as is its ability to effectively attenuate muons by providing
additional nuclei for the muon decay process. If muons decay in the barite, the resulting electrons that
penetrate the barite will be relatively easy to distinguish in the NOvA far detector data. The 35 MeV
threshold used for the telescope is indicative of the energy of muon expected from the vertical and near
vertical 21˚ tilt used in this experiment. When compared to the graph shown in figure 2, at 35 MeV,
assuming the flux is relatively constant for energies less than 0.1 GeV, the expected flux would be 10-2.5
or 0.00316 /cm2
·s·sr·GeV/c. The measured values in the southern end of the detector hall were less
than this figure though the values for the middle and northern end of the detector hall were slightly
larger than this predicted flux. The muon measurement at the south end of the detector hall was
therefore in accordance with the predicted moderating effect of the barite. In any event, the barite
effectively reduced the muon flux well below the accepted measure of muon flux at sea level.
To summarize, the barite, loose gravel and concrete of the NOvA far detector are effective in
moderating the incident cosmic ray muon flux by 29 ± 1.4% at the northern and midsection of the far
detector hall when compared to the cosmic ray muon background flux and 67 ± 0.8% at the south end
of the hall. Electromagnetic showers are further reduced by 77 ± 5.3% on the interior of the NOvA
facility when compared with cosmic ray induced background events. These results will likely be
verified and/or improved once the far detector is in place and capturing data, due in large part to the
more accurate resolution and discrimination utilized by the physicists and technicians collected data for
the NOvA project.
34
On a personal note, it was a great honor for me to work with Dr. Habig, Dr. Gran, Travis Olsen
and Krissie Nosbisch on this summer project. I feel that this research has enhanced my understanding
of the origin, behavior, measurement of and analysis of data generated by cosmic ray muons. It is my
intent and hope to continue this study with my own students at Hibbing High School through the
construction and operation of and subsequent analysis of data collected by simple muon detectors such
as those utilized by QuarkNET and WALTA.
35
References
1. http://www.wikipedia.org/wiki/cosmic_rays accessed June 23, 2011.
2. Bettini, Alessandro (2008). Introduction to Elementary Particle Physics. Cambridge
University Press, Cambridge, UK.
3. http://helios.gsfc.nasa.gov/history.html accessed June 23, 2011.
4. http://imagine.gs.fc.nasa.gov/docs/science/know_l1.cosmic_rays.html accessed June 23, 2011.
5. http://srl.caltech.edu/personnel/dick/cos_encyc.html R.A. Mewaldt accessed June 23, 2011.
6. http://keyhole.web.cern.ch/keyhole/detectors/cosmic_rays.jpg
7. Allkofer, O.C. and Grieder, P.K.F. (1984). Cosmic Rays on Earth. Physics Data.
Faschinformationszentrum, Karlsruhe, Nr. 25-1 in T.K. Gaisser (1990).
8. Gaisser, Thomas K. (1990) Cosmic Rays and Particle Physics. Cambridge University Press,
Cambridge UK. 279 pp.
9. Rosenthal, I.L. (1968) Sov. Phys. Uspekhi, 11, 49.
10. Cassidy G.L., Keuffel, J.W., and Thomson, J.A. (1973) Phys. Rev. D7, 2022 in T.K. Gaiser
(1990)
11. http://www.hep.umn.edu/nova/overview/
12. The NOvA Technical Design Report – NovA Collaboration (Ayres, D.S. et al). FERMILAB-
DESIGN_2007-01.
13. image accessed from http://www-nova.fnal.gov/images_v2/graphics/Overall-View-Looking-
SW-med.jpg on July 20, 2011.
14. Walter, A., Marshak, M. Cosmic Ray Flux at NOνA Far Detector Building
15. Cosmic Ray Shielding at NOvA – NOvA Collaboration (Ayres, D.S. et al). NOVA-doc-6617
16. Hansen, S; T. Jordan, T. Kiper, D. Claes, G. Snow, H, Berns, T.H. Burnett, R. Gran, R.J. Wilkes.
Low-cost data acquisition card for school-network cosmic ray detectors. Nuclear Science,
IEEE Transactions on, vol. 51, no. 3, pp. 926-930, June 2004.
17. http://en.wikipedia.org/wiki/Hexadecimal accessed July 20, 2011.
18. http://en.wikipedia.org/wiki/Solid_angle accessed July 20, 2011.
19. http://web.utk.edu/~rpevey/NE406/lesson2.htm downloaded July 20, 2011.
20. www.wolfram.com
21. Kalos, M.H. and Whitlock, P.A. (2008) Monte Carlo Methods, 2nd
ed. Weinheim: Wiley-
Blackwell.
22. O'Brien, S. (2006) Determining the Solid Angle of Two Detectors using Monte Carlo Methods.
http://acadine.physics.jmu.edu/group/technical_notes/Solid_angle_latex/solid_angle.pdf
accessed July 19, 2011.
23. Whitcher, R.(2002) Calculation of the Average Solid Angle Subtended by a Detector to Source
in a Parallel Plane by a Monte Carlo Method. Radiat Prot Dosimetry 102 (4): 365-369.
24. Whitcher, R. (2006) A Monte Carlo method to calculate the average solid angle subtended by a
right cylinder to a source that is circular or rectangular, plane or thick, at any position and
orientation. Radiat Prot Dosimetry 118(4): 459-474.
25. Rossi, Bruno. "Interpretation of Cosmic Ray Phenomena." Reviews of Modern Physics, vol.20,
no.3 1948
36
Appendix A: LINUX Monte Carlo Program Solid Angle Determination
by UMD Physics Student Travis Olson
// a program to determine the projected area and solid angle of a particle
// detector using monte carlo methodes
// by Travis Olson 07/22/11
#include<iostream>
#include<cstdlib>
#include<math.h>
#include<fstream>
#include<ctime>
#include<iomanip>
using namespace std;
int main()
{
// randomly generated variable
double x_rand,y_rand,theta,phi,CosTheta;
//user imput variables
long int events;
long double x_dim,y_dim,height;
// location on other plate variables
long double x_loc, y_loc, hyp;
//variables for checking whether or not an event is good
int x_pass,y_pass,total_pass;
//pi
double pi=3.14159265;
// totals for cosine theta and phi
long double TotCosTheta=0;
// averages for cosine thetai
long double AvgCosTheta;
// store the projected area
long double area=0;
//ratio of passed to failed
long double PassRatio,ctr_PassRatio;
// seeding the random number generator
srand(time(0));
// request and read inputs for the dimensions and number of trials
cout<<"n How many events do you want to use to measure? n";
cin>>events;
cout<<"n What is the x dimension of the detector? n";
cin>>x_dim;
cout<<"n What is the y dimension of the detector? n";
cin>>y_dim;
cout<<"n What is the distance between the top and botton plate of the detector? n";
cin>>height;
// check to see if the dimensions and number of trials makes sense
// if not yell at the user
if(events<=0)
{
cout<<"n Enter at least 1 for the number of events. n";
}
else if (x_dim<=0)
{
cout<<"n Enter a value greater than 0 for the x dimension. n";
}
else if (y_dim<=0)
{
37
cout<<"n Enter a value greater than 0 for the y dimension. n";
}
else if (height<0)
{
cout<<"n Enter a value of at least 0 for the height. n";
}
else
{
// initialize total good events variable
total_pass=0;
//loop to generate events number of trials
for(int i=0; i<events; i++)
{
//initialize test variables
x_pass=0;
y_pass=0;
//generate randnum number for x and y locations
// and for the theta and phi angles
x_rand=(static_cast<double>(rand())/(RAND_MAX/x_dim));
y_rand=(static_cast<double>(rand())/(RAND_MAX/y_dim));
CosTheta=static_cast<double>(rand())/RAND_MAX;
phi=(static_cast<double>(rand())/(RAND_MAX/(2*pi)));
theta=acos(CosTheta);
//calculate the location on the other plate with the variables
hyp=height/CosTheta;
x_loc=hyp*sin(theta)*cos(phi)+x_rand;
y_loc=hyp*sin(theta)*sin(phi)+y_rand;
// check to see if its a good event
if (x_loc>=0 && x_loc<=x_dim)
{
x_pass++;
}
if (y_loc>=0 && y_loc<=y_dim)
{
y_pass++;
}
if (x_pass==1 && y_pass==1)
{
// if good increment total passed and total cosine of theta
total_pass++;
TotCosTheta+=CosTheta;
}
}
//compute averages and pass ratio
PassRatio=1.0*total_pass/events;
// cout<<total_pass<<"n";
// cout<<PassRatio<<"n";
AvgCosTheta=TotCosTheta/events;
//cout<<AvgCosTheta<<"n";
//compute projected area
area=AvgCosTheta*x_dim*y_dim*PassRatio*2*pi;
//read out projected area and solid angle
cout<<"The projected area is "<<(area)<<"n";
cout<<"The solid angle is "<<PassRatio*2*pi<<"n";
// stream raw data and results
ofstream data("projected_area_data.txt",ios::app);
data<<"total number of trials: t";
data<<events<<'n';
data<<"total number of good events: t";
data<<total_pass<<'n';
38
data<<"x dimension: t";
data<<x_dim<<'n';
data<<"y dimension: t";
data<<y_dim<<'n';
data<<"the seperation between the plates t";
data<<height<<'n';
data<<"average cosine of theta: t";
data<<AvgCosTheta<<'n';
data<<"solid angle: t";
data<<PassRatio*2*pi<<'n';
data<<"projected area t";
data<<area<<endl;
}
}
// it takes about 1 minute to do 100,000,000 trials

More Related Content

What's hot

Observation of Bose–Einstein condensates in an Earth-orbiting research lab
Observation of Bose–Einstein condensates in an Earth-orbiting research labObservation of Bose–Einstein condensates in an Earth-orbiting research lab
Observation of Bose–Einstein condensates in an Earth-orbiting research labSérgio Sacani
 
GIS,Electron,Electromagnetic energy,radiation,Orbit,Types of Orbit
GIS,Electron,Electromagnetic energy,radiation,Orbit,Types of OrbitGIS,Electron,Electromagnetic energy,radiation,Orbit,Types of Orbit
GIS,Electron,Electromagnetic energy,radiation,Orbit,Types of OrbitThomas Ayalew
 
GIS,Electron,Electromagnetic energy,radiation,Orbit,Types of Orbit
GIS,Electron,Electromagnetic energy,radiation,Orbit,Types of OrbitGIS,Electron,Electromagnetic energy,radiation,Orbit,Types of Orbit
GIS,Electron,Electromagnetic energy,radiation,Orbit,Types of OrbitThomas Ayalew
 
Lattice Energy LLC - HESS Collaboration reports evidence for PeV cosmic rays ...
Lattice Energy LLC - HESS Collaboration reports evidence for PeV cosmic rays ...Lattice Energy LLC - HESS Collaboration reports evidence for PeV cosmic rays ...
Lattice Energy LLC - HESS Collaboration reports evidence for PeV cosmic rays ...Lewis Larsen
 
Andy Stine's Thesis--Neutron Star Models
Andy Stine's Thesis--Neutron Star ModelsAndy Stine's Thesis--Neutron Star Models
Andy Stine's Thesis--Neutron Star ModelsAndy Stine
 
Astronomy - State of the Art - Life in the Universe
Astronomy - State of the Art - Life in the UniverseAstronomy - State of the Art - Life in the Universe
Astronomy - State of the Art - Life in the UniverseChris Impey
 
Hollow earth, contrails & global warming calculations lecture
Hollow earth, contrails & global warming calculations lectureHollow earth, contrails & global warming calculations lecture
Hollow earth, contrails & global warming calculations lectureMarcus 2012
 
Space Weather and Solar Flare Activity Research at Suffolk County Community C...
Space Weather and Solar Flare Activity Research at Suffolk County Community C...Space Weather and Solar Flare Activity Research at Suffolk County Community C...
Space Weather and Solar Flare Activity Research at Suffolk County Community C...Thomas Madigan
 
NEW HOT-to-COOL COSMOLOGY: Amazing Progress Yet Greater Questions
NEW HOT-to-COOL COSMOLOGY: Amazing Progress Yet Greater QuestionsNEW HOT-to-COOL COSMOLOGY: Amazing Progress Yet Greater Questions
NEW HOT-to-COOL COSMOLOGY: Amazing Progress Yet Greater QuestionsPaul H. Carr
 
Dwarf galaxies with_optical_signatures_of_active_massive_black_holes
Dwarf galaxies with_optical_signatures_of_active_massive_black_holesDwarf galaxies with_optical_signatures_of_active_massive_black_holes
Dwarf galaxies with_optical_signatures_of_active_massive_black_holesSérgio Sacani
 
Bonding in the Nucleus of an Atom
Bonding in the Nucleus of an AtomBonding in the Nucleus of an Atom
Bonding in the Nucleus of an Atomiosrjce
 
Using the milk_way_satellites_to_study_interactions_between_cold_dark_matter_...
Using the milk_way_satellites_to_study_interactions_between_cold_dark_matter_...Using the milk_way_satellites_to_study_interactions_between_cold_dark_matter_...
Using the milk_way_satellites_to_study_interactions_between_cold_dark_matter_...Sérgio Sacani
 

What's hot (19)

Eps hep2015 014 (1)
Eps hep2015 014 (1)Eps hep2015 014 (1)
Eps hep2015 014 (1)
 
Radioactivity
RadioactivityRadioactivity
Radioactivity
 
Observation of Bose–Einstein condensates in an Earth-orbiting research lab
Observation of Bose–Einstein condensates in an Earth-orbiting research labObservation of Bose–Einstein condensates in an Earth-orbiting research lab
Observation of Bose–Einstein condensates in an Earth-orbiting research lab
 
GIS,Electron,Electromagnetic energy,radiation,Orbit,Types of Orbit
GIS,Electron,Electromagnetic energy,radiation,Orbit,Types of OrbitGIS,Electron,Electromagnetic energy,radiation,Orbit,Types of Orbit
GIS,Electron,Electromagnetic energy,radiation,Orbit,Types of Orbit
 
GIS,Electron,Electromagnetic energy,radiation,Orbit,Types of Orbit
GIS,Electron,Electromagnetic energy,radiation,Orbit,Types of OrbitGIS,Electron,Electromagnetic energy,radiation,Orbit,Types of Orbit
GIS,Electron,Electromagnetic energy,radiation,Orbit,Types of Orbit
 
E4 - Cosmology
E4 - CosmologyE4 - Cosmology
E4 - Cosmology
 
Lattice Energy LLC - HESS Collaboration reports evidence for PeV cosmic rays ...
Lattice Energy LLC - HESS Collaboration reports evidence for PeV cosmic rays ...Lattice Energy LLC - HESS Collaboration reports evidence for PeV cosmic rays ...
Lattice Energy LLC - HESS Collaboration reports evidence for PeV cosmic rays ...
 
Mc2521062109
Mc2521062109Mc2521062109
Mc2521062109
 
Solar energy
Solar energySolar energy
Solar energy
 
Andy Stine's Thesis--Neutron Star Models
Andy Stine's Thesis--Neutron Star ModelsAndy Stine's Thesis--Neutron Star Models
Andy Stine's Thesis--Neutron Star Models
 
Astronomy - State of the Art - Life in the Universe
Astronomy - State of the Art - Life in the UniverseAstronomy - State of the Art - Life in the Universe
Astronomy - State of the Art - Life in the Universe
 
1965 newsletter murmur of a bang
1965 newsletter murmur of a bang1965 newsletter murmur of a bang
1965 newsletter murmur of a bang
 
Hollow earth, contrails & global warming calculations lecture
Hollow earth, contrails & global warming calculations lectureHollow earth, contrails & global warming calculations lecture
Hollow earth, contrails & global warming calculations lecture
 
D3
D3D3
D3
 
Space Weather and Solar Flare Activity Research at Suffolk County Community C...
Space Weather and Solar Flare Activity Research at Suffolk County Community C...Space Weather and Solar Flare Activity Research at Suffolk County Community C...
Space Weather and Solar Flare Activity Research at Suffolk County Community C...
 
NEW HOT-to-COOL COSMOLOGY: Amazing Progress Yet Greater Questions
NEW HOT-to-COOL COSMOLOGY: Amazing Progress Yet Greater QuestionsNEW HOT-to-COOL COSMOLOGY: Amazing Progress Yet Greater Questions
NEW HOT-to-COOL COSMOLOGY: Amazing Progress Yet Greater Questions
 
Dwarf galaxies with_optical_signatures_of_active_massive_black_holes
Dwarf galaxies with_optical_signatures_of_active_massive_black_holesDwarf galaxies with_optical_signatures_of_active_massive_black_holes
Dwarf galaxies with_optical_signatures_of_active_massive_black_holes
 
Bonding in the Nucleus of an Atom
Bonding in the Nucleus of an AtomBonding in the Nucleus of an Atom
Bonding in the Nucleus of an Atom
 
Using the milk_way_satellites_to_study_interactions_between_cold_dark_matter_...
Using the milk_way_satellites_to_study_interactions_between_cold_dark_matter_...Using the milk_way_satellites_to_study_interactions_between_cold_dark_matter_...
Using the milk_way_satellites_to_study_interactions_between_cold_dark_matter_...
 

Similar to RET 2011 Paper_FINAL CS

Jovian lightning whistles a new tune
Jovian lightning whistles a new tuneJovian lightning whistles a new tune
Jovian lightning whistles a new tuneSérgio Sacani
 
High Energy Astrophysics Dissertation
High Energy Astrophysics DissertationHigh Energy Astrophysics Dissertation
High Energy Astrophysics DissertationAlexander Booth
 
The future of the universe and humanity
The future of the universe and humanityThe future of the universe and humanity
The future of the universe and humanityFernando Alcoforado
 
The future of universe, sun, earth and humanity
The future of universe, sun, earth and humanityThe future of universe, sun, earth and humanity
The future of universe, sun, earth and humanityFernando Alcoforado
 
NEUTRON STARS - UNIQUE COMPACT OBJECTS OF THEIR OWN
NEUTRON STARS - UNIQUE COMPACT OBJECTS OF THEIR OWNNEUTRON STARS - UNIQUE COMPACT OBJECTS OF THEIR OWN
NEUTRON STARS - UNIQUE COMPACT OBJECTS OF THEIR OWNIJRST Journal
 
Light - The Electromagnetic Spectrum
Light - The Electromagnetic SpectrumLight - The Electromagnetic Spectrum
Light - The Electromagnetic SpectrumVictor Andrei Bodiut
 
Universe and the Solar System (Lesson 1).pptx
Universe and the Solar System (Lesson 1).pptxUniverse and the Solar System (Lesson 1).pptx
Universe and the Solar System (Lesson 1).pptxJoenelRubino3
 
Space weather and potential impact on earth’s climate dec 19 10 v2
Space weather and potential impact on earth’s climate dec 19 10 v2Space weather and potential impact on earth’s climate dec 19 10 v2
Space weather and potential impact on earth’s climate dec 19 10 v2Poramate Minsiri
 
X-Ray Luminous Supernovae: Threats to Terrestrial Biospheres
X-Ray Luminous Supernovae: Threats to Terrestrial BiospheresX-Ray Luminous Supernovae: Threats to Terrestrial Biospheres
X-Ray Luminous Supernovae: Threats to Terrestrial BiospheresSérgio Sacani
 
Big bang cosmology
Big bang cosmologyBig bang cosmology
Big bang cosmologySabiq Hafidz
 

Similar to RET 2011 Paper_FINAL CS (20)

Jovian lightning whistles a new tune
Jovian lightning whistles a new tuneJovian lightning whistles a new tune
Jovian lightning whistles a new tune
 
High Energy Astrophysics Dissertation
High Energy Astrophysics DissertationHigh Energy Astrophysics Dissertation
High Energy Astrophysics Dissertation
 
Accelerating Universe
Accelerating Universe Accelerating Universe
Accelerating Universe
 
D3
D3D3
D3
 
The future of the universe and humanity
The future of the universe and humanityThe future of the universe and humanity
The future of the universe and humanity
 
ANTIRADIATION
ANTIRADIATIONANTIRADIATION
ANTIRADIATION
 
The future of universe, sun, earth and humanity
The future of universe, sun, earth and humanityThe future of universe, sun, earth and humanity
The future of universe, sun, earth and humanity
 
Big Bang
Big BangBig Bang
Big Bang
 
NEUTRON STARS - UNIQUE COMPACT OBJECTS OF THEIR OWN
NEUTRON STARS - UNIQUE COMPACT OBJECTS OF THEIR OWNNEUTRON STARS - UNIQUE COMPACT OBJECTS OF THEIR OWN
NEUTRON STARS - UNIQUE COMPACT OBJECTS OF THEIR OWN
 
BASICS OF COSMOLOGY
BASICS OF COSMOLOGYBASICS OF COSMOLOGY
BASICS OF COSMOLOGY
 
Light - The Electromagnetic Spectrum
Light - The Electromagnetic SpectrumLight - The Electromagnetic Spectrum
Light - The Electromagnetic Spectrum
 
The Big Bang theory
The Big Bang theoryThe Big Bang theory
The Big Bang theory
 
Universe and the Solar System (Lesson 1).pptx
Universe and the Solar System (Lesson 1).pptxUniverse and the Solar System (Lesson 1).pptx
Universe and the Solar System (Lesson 1).pptx
 
ADVANCED NUCLEAR PHYSICS
ADVANCED NUCLEAR PHYSICSADVANCED NUCLEAR PHYSICS
ADVANCED NUCLEAR PHYSICS
 
Light
LightLight
Light
 
Black hole
Black holeBlack hole
Black hole
 
The New Theory of Everything.
The New Theory of Everything.The New Theory of Everything.
The New Theory of Everything.
 
Space weather and potential impact on earth’s climate dec 19 10 v2
Space weather and potential impact on earth’s climate dec 19 10 v2Space weather and potential impact on earth’s climate dec 19 10 v2
Space weather and potential impact on earth’s climate dec 19 10 v2
 
X-Ray Luminous Supernovae: Threats to Terrestrial Biospheres
X-Ray Luminous Supernovae: Threats to Terrestrial BiospheresX-Ray Luminous Supernovae: Threats to Terrestrial Biospheres
X-Ray Luminous Supernovae: Threats to Terrestrial Biospheres
 
Big bang cosmology
Big bang cosmologyBig bang cosmology
Big bang cosmology
 

RET 2011 Paper_FINAL CS

  • 1. 1 NOνA Muon Flux Measurement Project as part of the Summer 2011 University of Minnesota Research Experience for Teachers (RET) Program and Physics 5594 – Physics Research Presented to Dr. Alec Habig Carl N. Sandness Hibbing High School December 22, 2011
  • 2. 2 Historical Considerations Early proponents of so-called “atmospheric electricity” relied on explanations derived from Becquerel's discovery of radioactivity, which he developed in1896. Said proponents postulated that ionized gas molecules originated solely from the decay of radioisotopes and their daughter particles of terrestrial sources. Early observations of ionized gases of terrestrial origin found that ionization rates decreased with in increase in altitude, thus confirming the theory. Early measurements of ionized air by Theodor Wulf using an electrometer found that a higher level of radiation existed at the top of the Eiffel Tower than at the base; however, his research was not widely accepted by the general community. In 1911, Domenico Pacini observed simultaneous variations in the rate of ionization over a lake, the sea and at a depth of 3 m under water and found that the a decrease in ionization was related to a factor other than terrestrial sources of radioactivity.1 According to most historical references, the true study of Cosmic Rays began in 1912 with V.F. Hess2 measuring charged particle radiation of extraterrestrial origin from 3 enhanced-accuracy Wulf electrometers taken to 5300 ft in hot-air balloons.1 His measurements confirmed a four-fold increase in the rate of ionization compared to ground level. Hess ruled out the sun as a source of cosmic rays by repeating similar tests during a total solar eclipse and found that there was still a greater level of ionization at higher altitudes. From 1913-1914, Werner Kolhörster confirmed Hess's results to an altitude of 9 km for which Hess was subsequently awarded a Nobel Prize in Physics in 1936. In 1934, Bruno Rossi observed a nearly simultaneous discharge of Geiger counters widely spaced ultimately leading to measurements that became known as the “East-West Effect,” known today as the east-west asymmetry owing to the effect of the Earth's magnetic field on trajectories of charged particles. The next year, Hideki Yukawa predicted an unstable charged particle, then thought to be equivalent to what we now know to be the muon. In 1937 Pierre Auget, independent to the work of Rossi, investigated the same coincidence phenomenon and discovered particle showers from high energy cosmic ray particle interactions at high altitudes that led to secondary interactions developing
  • 3. 3 cascading showers of electrons, photons and muons reaching ground level. That same year, Homi J. Bhabda defined the probability of scattering positrons by electrons and how primary cosmic rays interact with the upper atmosphere. In 1947, the pion was discovered from high energy nuclear reactions, the pion decaying into muons and neutrinos in 26 ns through the use of emulsion plates. In 1948, experiments by Gottlieb and VanAllen showed that the primary cosmic ray is, in fact, composed of protons, alpha particles and other heavy nuclei. In 1949, Enrico Fermi developed the theory of an acceleration mechanism for cosmic ray protons whereby the protons become accelerated by “magnetic clouds in space such as in shock waves around supernovae.”3 In 1954, the Rossi Cosmic Ray Group from MIT measured ultra-high primary cosmic rays in excess of 1020 eV, surpassing the established Greissen-Zatsepin-Kuzmin (GZK) cutoff for which cosmic rays were thought not to exceed. In 1957, Van Allen at the State University of Iowa launched the “Rockoon” (Navy rocket-powered balloon) to commence the first total cosmic ray survey at an altitude of 126 miles, his measurements determining a latitude variation of heavy nuclei from primary cosmic radiation. Muon experiments of the late 1950s through the 1970s focused primarily on measurements of the solar wind and magnetosphere-related properties of the Earth, coupled to the ability of scientists to put probes into the now robust Soviet and American space programs. In 1991, at the University of Utah, an observation was made of an event at 3x10²⁰ eV. In 1992, the IMAX balloon-borne superconducting magnet spectrometer was launched to measure galactic cosmic ray abundance of protons, antiprotons, hydrogen and helium isotopes. From the 1980s forward, additional experiments related to measurements of the solar wind, cosmic microwave background (CMB), solar irradiance and Sun-Earth interactions. Currently, the Pierre Auger observatory in Argentina, with a detection area of 3000 km2 is exploring cosmic rays in excess of the exa-electronvolt (EeV) range, offering potential discoveries beyond the Standard Model.2
  • 4. 4 Introduction Cosmic Rays, especially true of high energy, are presently thought to originate in the blast waves of supernova remnants, which induce an acceleration of the rays bouncing back and forth in the magnetic field of the gas cloud. Once possessing sufficient energy, the ray can break free from its cloud containment. The final speed of the cosmic ray (and therefore the energy) is proportional to the size of the acceleration region and the magnetic field strength of the nebular cloud. It is thought that ultra-high speed could have origins in Active Galactic Nuclei (AGN), quasars, gamma-ray bursters, superstrings, dark matter, strong interaction neutrinos or other defects in the universe.4 Cosmic rays are generally categorized into three main groups.3 First, galactic cosmic rays are thought to exist outside the solar system and have energies from roughly 100 MeV to 10 GeV, corresponding to a proton traveling at 0.43c and 0.996c respectively.5 Via measurements of Beryllium- 10 in interstellar space, galactic cosmic rays have been determined to have a lifespan of roughly 10 billion years. The second category includes anomalous cosmic rays, which exist in interstellar space at the edge of the heliopause of a star. This group is thought to be composed of the gases helium, nitrogen, oxygen, neon and argon – those typically difficult to ionize. The last source of cosmic rays is in the form of solar energetic particles which have their origins in solar flares, prominences and other events. Research of cosmic rays of the 1 GeV spectrum has revealed a composition of about 85% protons, 12% alpha particles, 2% electrons and 1% heavier nuclei.2 These cosmic rays strongly interact with atmospheric gases such as nitrogen and oxygen1 to produce mainly pions (π) but can also produce kaons (к) and rarely other hadrons. This reaction takes the form Because of the energy inherent in cosmic rays, additional interactions beyond the primary reactions are possible, and so generate a “hadronic shower,” which proceeds until the average particle energy is insufficient to perpetuate the shower, thereby quenching further reactions. This initial
  • 5. 5 reaction between particles, or the “radiation length,” occurs over a distance of roughly 750 m at standard temperature and pressure. Pions have a lifetime of about 26 ns, and decay to produce muons (μ) and neutrinos ( ) and antineutrinos ( ) through the following reactions Because muons are also unstable, though have a significantly larger lifetime of 2 μs, they decay to produce electrons ( ), positrons ( ) and neutrinos via Interestingly, a third pion decay mode is possible, generating only gamma rays (γ) And, these gamma rays can further generate new reactions with atmospheric nuclei producing electron pairs via As one might imagine, the electron and positron can generate further reactions with additional nuclei as shown by also known as the bremsstrahlung process. The cumulative result of these photon interactions is an “electromagnetic shower” that occurs simultaneously with the hadronic shower, yet possesses different characteristics. The photon interactions have a radiation length of about 300 m. Another characterization of cosmic rays is related to their ability to penetrate matter, measured in three forms. In 1932, Rossi established the “soft” form, which is absorbed by only a few cm of lead, and the hard “form” which requires a more robust material thickness.6 The former represents the
  • 6. 6 electromagnetic portion whereas the latter is mostly muons. The third form is thought to be that produced from electron and muon neutrinos and their antineutrinos. The tau neutrino arises from the decay of the tau lepton, which is short-lived and also difficult to form due to its larger mass. This makes the tau neutrino uncommon, and if it is detected it is mostly likely the result of an oscillation from a muon or an electron neutrino. Detection of neutrinos requires detectors of multiple orders of magnitude larger than those to detect cosmic ray muons, the existence of this particle being confirmed by observation and measurement in such projects as Gran Sasso, MINOS, NOVA, SuperK and others. The process of atmospheric cosmic ray interactions is summarized in Figure 1. Figure 1. Example of a Cosmic Ray Shower6
  • 7. 7 Apparent energy “losses” of energy in cosmic rays passing through matter varies in form depending on the species in question.2 These losses influence the depth to which radiation will travel in a particular medium. The first loss is the average energy loss of radiation through ionization, which is governed by the Bethe-Bloch equation2 where z is the charge, Z is the atomic number, A is the atomic mass, m is the mass of the hit particle, K is 30.7 keV·m2 /kg, I is the ionization potential, β is the ratio of v/c, p is the momentum of the incident particle in GeV , and γ is equal to . It should be noted that this equation is valid only for 0.05 < βγ < 500. The second loss is for electrons or positrons, which can lose energy from either ionization (for those that have low initial energy) or via bremsstrahlung in the Coulombic field of the atom (for those of high initial energy), so particle proximity to the nucleus is a factor. Losses to ionization follow the aforementioned calculations. Losses for bremsstrahlung are dependent upon the rate of acceleration, and the power loss is proportional to its square. Since the field itself is dependent upon nuclear charge, the probability of an interaction is proportional to the inverse square of the mass. Generally, for particles such as the muon, the bremsstrahlung loss becomes important for energies of greater than 10000 times the electron. Radiation lengths are inversely proportional to Z and therefore the density of the material. Example radiation length for selected materials is summarized in Table 1. Table 1. Radiation Lengths for Electrons and Positrons as a function of material2 Material Radiation Length (m) Air 300 Water 0.36 Carbon 0.2 Iron 0.02 Lead 0.01
  • 8. 8 A third loss is inherent to the photon as a result of the photoelectric effect. For photons of energy higher than several keV, Compton scattering is the predominant loss, though for those above 1 MeV, pair production overshadows Compton scattering as described by the following equation The final loss is that found in hadrons and occurs via ionization and the strong interaction. An incoming particle thus becomes integrated to the parent nucleus and the formation of secondary hadrons from its destruction. The distance that a neutron beam will become attenuated to 1/e for a material is called the collision length, which again depends upon the material as shown in Table 2. Table 2. Hadronic Collision Lengths as a function of material2 Material Collision Length (m) Air 750 Water 0.85 Carbon 0.38 Iron 0.17 Lead 0.17 It is evident that ionization lengths for hadronic collision energy losses have a lesser dependence on the nature of the material through which they pass or its phase as a solid or liquid. However, this fact may play a role in the selection of material for calorimeter-type detectors. As in any valid scientific endeavor, it is of interest for this experiment to predict what the incident muon flux might be and then compare the measured value to that which has been predicted. Based upon the experimental results summarized by Allkofer and Greeder7 and calculations for predicted muon flux as a function of the muon energy spectrum (figure 2, linear fit to data), it is possible to predict the energy of an incoming atmospheric muon if one has a measured flux of incident muons. The deviation of measured values at roughly 10 MeV is noted according to this figure, and the
  • 9. 9 flux levels out for even lower energy muons to the tune of about 10-2.5 /cm2 ·s·sr·GeV/c. Muons at higher energies most likely will pass through the detector with little decay. Muons of very low energy are more likely to decay before they reach the detector, hence the flux for very low energy muons will be much less than predicted. Referring to figure 2 below, and considering the chosen energy threshold set in the muon telescope used in this experiment, the flux of detected muons is therefore expected to be quite small (see upper left region in figure 2). Figure 2. Muon flux as a function of momentum (from Gaisser, p.71)8 Energy loss for atmospheric muons essentially involves two forms, continuous and discrete.8 Continuous losses for muons occur as they traverse through the atmosphere (or crust for that matter) ionizing the matter and decreasing the energy inherent in the particle. This effect can be summarized with the following formula9 Gaisser estimates that roughly 2 MeV/g·cm2 is lost in such interactions with certain assumptions.
  • 10. 10 Discrete energy losses for muons occur via bremsstrahlung (though for muons, bremsstrahlung is essentially negligible), electromagnetic interactions with nuclei and direct e+ e- pair-production.8 The discrete processes are of primary concern for high-energy muons and for those traveling deep underground.8 Energy loss for muons underground is a function of the different ranges of muons and therefore the distribution of energies at certain depths. The general rate of energy loss for muons is calculated8 from where and 2.5x10⁵ g·cm2 for rock. When the above equation is equated to the energy loss by bremsstrahlung, a critical energy ( ) is defined. Above this critical energy, radiative losses are more significant than continuous loss, and the critical energy is found to be about 500 GeV for muons.8 A general solution8 to the equation above is given by where E0 is the initial energy of the muon (or beam of muons). From this, it is possible to estimate the vertical flux of muons at depth X (relative to the surface) via8 where the energy spectrum for the muons could then be calculated8 through and .8 The muon flux as a function of intensity is shown in figure 3.
  • 11. 11 Figure 3. Muon flux as a function of depth underground (from Gaisser, p 79)8 When the local differential energy spectrum of muons is normalized to the vertical muon intensity, at depths where X is far less than , the flux is relatively constant. When the depth is significantly larger than , the flux decreases dramatically, and is skewed in favor of very high energy muons. This is consistent with the expectation that at large depths in rock, energy loss in incident muons would be significant and the higher energy muons observed would be more likely those generated through neutrino interactions within the rock. This relationship has been derived by Cassidy et al10 in Figure 4. Figure 4. Muon flux versus energy underground (from Gaisser, p. 80)8
  • 12. 12 The NOvA site NOvA is an acronym for the NuMI Off-Axis Neutrino Appearance experiment, a second- generation long-baseline experiment designed for the determination of electron and muon neutrino oscillation parameters. The NOvA site is located on St. Louis Country Road 129 about 5.5 miles from Highway 53 North on Bright Star Road, just off the Ash River Trail in Kabetogama county Minnesota. Its geographical location places it 14 mrad off-axis from the bulk of the NuMI beam, and at 810 km from Fermilab, it is perfectly situated for the electron neutrino oscillation appearance.11 A picture of the facility taken in April of 2011 is shown in Figure 5. Figure 5. The NOvA Site12 The NOvA project utilizes the same near-far arrangement as MINOS with the near detector based initially on the surface at Fermilab and possessing a mass of 225 tonnes. The near detector utilizes an iron-based muon catcher, shower containment, target and veto regions and gives an initial spectrum of the beam. The near detector will eventually be moved underground. The far detector utilizes a highly reflective 15% TiO2 extruded PVC cells with a total 14 tonnes mass, but unlike the MINOS far detector, the NOvA far detector utilizes a liquid scintillator mixture of
  • 13. 13 mineral oil, 5% pseudocumene and wavelength-shifting compounds PPO and bis-MSB. The far detector is to be installed in a 60 foot deep concrete-lined cavern that has been excavated from the granite surface. This ensures a modest level of protection from wide angle and horizontally-oriented secondary and tertiary particles. To properly mitigate the vertical background events, the detector hall incorporates a 6 inch layer of barite and a loose granite overlay on top of a thin concrete roof, the combination of materials effectively equating to a 4-foot thick concrete layer.13 A veto shield to be installed above the far detector will further enhance the discriminatory process of neutrino-induced events. A model of the far detector under construction is shown in Figure 6. Figure 6. NOvA Far Detector13 The focus of this muon telescope project is to gather sufficient measurements of the muon flux inside and outside of the NOvA far detector building to provide additional information as to naturally- derived muon flux in the detector. A previous measurement was made by Walter and Marshak14 using a small table-top muon detector. The present study employs a larger muon telescope with a narrower solid angle and therefore more precise estimate of muon flux at the NOvA site.
  • 14. 14 Instrumentation The muon telescope assembly used in our measurements at the NOvA site is pictured in Figure 7. The telescope configuration uses all 4 modules in a vertical orientation. As the telescope is over 9 feet tall assembled, to facilitate the safe operation of this device it was necessary to fabricate a supporting cradle to hold the 4 modules in place when the assembly was tilted. Wood and hardware was purchased from Orr Hardware in Orr, MN. The design of the cradle was work of the author with considerable help from Ron Williams, Scott Sawyer and Larry Salmela of the NOvA facility staff. The author is grateful for their logistical and practical support in building/dismantling and moving this assembly throughout the detector hall. Figure 7. Muon telescope without supports The modules, fabricated originally from components of Dr. Richard Gran's PhD thesis, is comprised of a 45.72 ± 0.05 cm x 45.72 ± 0.05 cm x 1.91 ± 0.05 cm plastic scintillator sheet centered on the bottom of the cubic 55.88 ± 0.05 cm x 55.56 ± 0.05 cm x 28.63 ± 0.05 cm wooden box constructed from 1/2” plywood secured with deck screws. A 3D model of a module was made using PTC’s Pro/Engineer Wildfire 3.0 and is shown in Figure 8.
  • 15. 15 Figure 8. Pro/Engineer model of the muon telescope module showing PMT The inside of the module is lined with a highly reflective fabric that is similar in appearance to movie screen material. The photomultiplier tubes (PMTs) employed in each module was a 5 inch EMI 9897B that was salvaged from a previous High-Energy Physics project at Harvard University. The PMT itself is mounted into a square piece of plywood that mates with a mirror on the lower side that mates with the PMT (Figure 9). Figure 9. EMI PMT Sub-assembly15
  • 16. 16 This PMT sub-assembly fits into a plywood “shelf” that correctly positions the PMT into the module such that a plywood lid can be placed on the top of the module, thereby limiting the influx of light. To further mitigate light entrance, thick black plastic bags was placed over the PMT from above in two layers, and duct tape was used to seal the bags and cracks in the wooden structure (Figure 10). Figure 10. Light mitigating procedure for a module15 As shown above, duct tape black electrical tape was used to seal the high-voltage and signal cables that penetrated this light shielding. The module is completed with a 1/2” plywood cover than matches the square cross section of the module. The discriminator/counter was a QuarkNet circuit board16 that Dr. Gran had obtained from Fermilab for use with the muon telescope and is shown in Figure 11. The card is capable of measuring single and coincidence measurements, and has both a networking port and GPS capability. The card was connected via MiniDin 15 cabling to a desktop PC and the 4 channels of the card were connected via a signal cable to respectively to each module of the telescope array. The DAQ threshold voltage was optimized via “trim pots” (circled in yellow) and checked using a Fluke 79III rms multimeter. Figure 11. The QuarkNet DAQ card16
  • 17. 17 High-Voltage was supplied to the modules by way of a 4-channel Bertan Model 380 N 10 kV power supply mounted in a crate with a cable conversion module and a LeCroy Model 623B octal analog logic/discriminator/oscillator, shown in Figure 12. The Voltage to each module was optimized using the same Fluke 79III rms multimeter used in the DAQ optimization, where adjustments to the high-voltage channels were made by turning the analog rotary switch (circled in yellow). Figure 12. High-Voltage Power Supply and Discriminator Crate15 The desktop computer utilized, affectionately known as “Tau,” was a 1 GHz Dell Pentium III running Scientific Linux SL 2.6.18-238.12.1e15. Software used included the muontelescope.sh program written by Dr. Gran and the KATE data analysis program. This computer was configured from a networked connection at UMD to a stand-alone mode at NOvA by Dr. Habig, and so the timing for the measurements was based solely upon the internal clock of the computer. Earlier measurements of muon interactions with this unit at UMD utilized local network timing. The manipulated DAQ settings include gate width, tmc delay, seconds, events, singles seconds and coincidence. The coincidence can be modified to between 1 and 4 modules, where 1 would be for the “shower” mode and between 2 and 4 for the module telescope mode. The coincidence settings are used to trigger a count. Seconds and events are used as triggers for the total time of an experimental run or total number of events preset. The singles seconds instructs the card how often to sample singles data. The tmc delay allocates a set amount of time in which a coincidence event can occur,
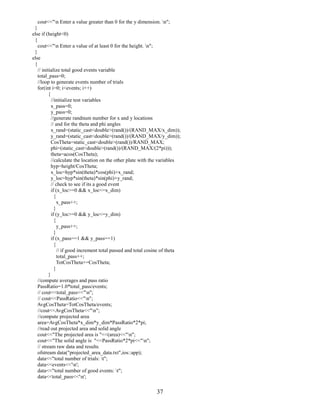
  • 18. 18 proportional to the time it would take a muon to travel from the top layer of scintillator of the muon telescope to the bottom layer. The gate width is the time after the first trigger in which a successive event or series of events occurs, and is used in conjunction with the tmc delay to accurately record a coincidence event. Hence, the DAQ card “discriminates” between events based upon the coincidence of all four modules, which gives a more defined solid angle and therefore more accurate measure of flux with the telescope.
  • 19. 19 Calibration Procedures for the DAQ The QuarkNet DAQ was initially set to 0.050 V in earlier trials but upon assembly at NOvA, it became clear through errors in output data that the calibrations were incorrect. The high voltage for each module was adjusted in increments of 10-20 volts through several trials and singles for each module and coincidences were collected. The optimized values for the modules were 1079 V for alpha, 1026 V for beta, 1252 V for gamma and 1249 V for delta. The threshold values for each channel of the DAQ card were initially set to 0.050 V and 5 minute trials of 4-module coincidences and singles data was also collected. This procedure was repeated by increasing the threshold voltage of each channel on the DAQ by 0.010 V and then collecting singles and coincidence data. Calculating the derivative of the data and subtracting consecutive singles rates revealed a peak (red diamond) in each data set shown in Figure 13. Given that this peak corresponds to the muon energy of interest, and given the 4-fold coincidence necessary for the muon count, it was possible to filter background noise from the data to at least the first approximation. Figure 13. Muon flux singles vs. DAQ Threshold Voltage15 0 5 10 15 20 0.05 - 0.06 0.06 - 0.07 0.07 - 0.08 0.08 - 0.09 0.09 - 0.10 0.10 - 0.11 0.11 - 0.12 0.12 - 0.13 ΔSinglesRatehz Threshold Voltage (V) Optimization Data for Alpha 0 2 4 6 8 0.05 - 0.06 0.06 - 0.07 0.07 - 0.08 0.08 - 0.09 0.09 - 0.10 0.10 - 0.11 0.11 - 0.12 0.12 - 0.13 ΔSinglesRatehz Threshold Voltage (V) Optimization Data for Beta 0 5 10 15 20 0.05 - 0.06 0.06 - 0.07 0.07 - 0.08 0.08 - 0.09 0.09 - 0.10 0.10 - 0.11 0.11 - 0.12 0.12 - 0.13 ΔSinglesRateshz Threshold Voltage (V) Optimization Data for Gamma 0 5 10 15 20 25 0.05 - 0.06 0.06- 0.07 0.07 - 0.08 0.08 - 0.09 0.09 - 0.10 0.10 - 0.11 0.11 - 0.12 0.12 - 0.13 ΔSinglesRateshz Threshold Voltage (V) Optimization Data for Delta
  • 20. 20 Given the data collected, each channel was set to the optimal thresholds: alpha at 0.095 V, beta at 0.075 V, gamma at 0.095 V and delta at 0.105 V. These settings gave consistent singles counts varying less than 1 per minute per channel between all four channels and a coincidence rate of better than 0.48 per minute or 0.008 per second.
  • 21. 21 Muon Telescope Measurement Locations at NOvA In order to make reasonable measurements of muon flux in the NOvA far detector hall, it was decided that a total of 10 flux measurements would be made inside the building: 9 near the centerline of the hall and 1 outside the rails near the middle of the hall on the east side. The 9 measurements were broken down into 3 sets at approximately the south, middle and northern portions of the future far detector installation. At each of these locations, a vertical and +/- 21 degree from vertical measurement was taken. The indoor measurement locations (in meters) are summarized below in Figure 14 (viz. dots superimposed on white background). A muon shower measurement was also made near the southern-most third of the future detector location (small cluster of squares representing the array). Figure 14. Muon Measurements inside NOvA Far Detector Hall
  • 22. 22 A baseline measurement of ambient outdoor flux was to be made on the west side of the facility on the concrete receiving dock and its relative location is summarized in Figure 15 (again in meters) Figure 15. Muon Baseline Measurement outside NOvA Facility
  • 23. 23 Experimental Design The muon telescope was transferred from UMD Physics to the NOvA site on June 28, 2011 and assembled on the lowermost level of the NOvA Far Detector Hall. The muontelescope.sh program installed on Tau was used to run the DAQ and store collected data. To allow for a sufficiently large data set for each measurement, it was decided that each trial would run for 3 hours (10800 s as set in the muontelescope program). Zero zenith angle data was collected using the initial DAQ and HV settings from experiments at UMD at the north, middle and south ends in and also at a +21 degree angle on the north end. However, from the initial measurements collected, it became clear that there was a problem with one of the modules, specifically beta, as the data log indicated erroneous code. Attempts were made to alter that HV settings to achieve better singles rates for each module, however the rates for each module were vastly different from one another. Krissie and Travis proceeded to follow a calibration procedure whereby the module HV for each was set to 1 kV and the DAQ thresholds were adjusted through a 0.050 V to 0.140 V range, and singles and coincidence data throughout this range were collected. Analysis of the data again indicated that the thresholds were again widely different. Based on this second data collection, it was found that with minor adjustments to the HV on alpha, combined with threshold calibrations for the four channels, it would be possible to optimize the settings for all four modules. The results of this final 5 minute calibration run are found in Table 3. Table 3. High-Voltage and Threshold settings for telescope modules in final calibration Module Threshold Voltage High Voltage Muon Count Alpha 0.0950 1037 24.0251 Beta 0.075 1026 23.4774 Gamma 0.095 1252 24.1106 Delta 0.105 1249 23.5176 4 module coincidence 0.487437
  • 24. 24 Given project time constraints for facility, personnel, movement of the instrument and workday efficiency, it was decided that new trials at 2 hours would provide a sufficiently large data set while still maintaining a reasonably low uncertainty in muon flux measurement. Utilizing the optimized settings from Table 3, data was collected in the telescope mode using the muontelescope.sh program inside the rails of the Far Detector Hall at 3 locations: the north end just under the cutoff for the roof shielding vertically, approximately midway south, and at the end of the hall near the south wall at the orientations of vertical, plus 21 degrees (defined as westward) and minus 21 degress (eastward) as shown in Figure 11. Coincidence was set to four, singles rates to 100 seconds, gate width to 10 and tmc delay to 6. Gate width and tmc delay are measured in “clock ticks,” so multiplying by 24 ns/tick results in a gate width of 240 ns and a tmc delay of 144 ns. The electromagnetic shower measurement was performed as planned using the “shower” program pre-installed on Tau. For the shower arrangement, the modules were assembled in a square pattern, 6 feet apart measured from the edge of each module with the computer cart in the middle of the larger square. In this mode, the gate width was changed to 150 and tmc delay to 50. It was expected that the rate of accidental coincidences in shower mode would be minimal and would not factor greatly into the measurements obtained. An additional measurement of zenith was taken outside the rails on the east wall near the middle of the detector hall and to gauge atmospheric background outside of the NOvA building, a measurement of muon flux in telescope mode was made on the concrete pad in the receiving dock area.
  • 25. 25 Data Analysis As mentioned previously, the data compiled for the experiment was stored on Tau. Given the limitations of the controller card, only 100 s of data can be collected in any one interval, so repeated intervals of 100 s appear in each data log file. The data collected is in the form of a text file, a portion of which is shown below in Figure 16. pctime 1310479873 62391 Tue Jul 12 09:11:13 2011ST ST 0003 2351 0061 2720 0 0 0 0 00000000 32 5535 006E5100 000A013F DS DS S0=00001123 S1=000010FD S2=00001163 S3=00001198 S4=0000003B S5=00000000 EEB1C0A9 BF 01 00 01 00 01 00 01 00000000 0 0 0 0 8 +0000 EEB1C0AA 01 00 2C 01 26 38 21 3D 00000000 0 0 0 0 8 +0000 EEB1C0AB 01 2F 01 2F 00 01 00 01 00000000 0 0 0 0 8 +0000 Figure 16. Sample data log from muon telescope measurements The first line indicates the use of internal computer clock time followed by the date and local time. The fourth line gives “singles” rates, which represent the interaction of muons with an individual scintillator sheet, designated by S. There are 6 channels on the QuarkNet DAQ card. Channels 1-4 correspond to each of the four modules in the muontelescope, the first channel, Alpha, is S0. The numerical result for each channel is expressed in hexadecimal, which is a base-16 (common to digital electronics) system utilizing the numerals 0-9 and letters a-f representing the numbers 10 through 15 respectively.17 For example, the hexadecimal indicated for S1 is 000010FD, which corresponds to 4349 hits (1 x 163 + 0 x 162 + 15 x 161 + 13 x 160 ). Channel 5 is used to represent coincidences set to predetermined parameters in muontelescope.sh. For this particular run, there were 59 coincidences between the 4 modules of the muon telescope. Starting with the fifth line, hexadecimal code starts each line and indicates incident times relative to the starting time for each 100 s interval. Coincidences can be drawn from the code anytime there is a registered hit on all 4 channels within the gate closure time, which is the time set by the DAQ card to allow for the recognition of a true coincidence event. In the case of the QuarkNet DAQ card, this gate time is 100 ns, which means that a muon striking the first scintillator has less than 100 ns to reach the bottom scintillator in order for a true coincidence to be recorded.
  • 26. 26 The Solid Angle of the Muon Telescope The effective viewing area of any observational instrument is limited by its cross-sectional area and its length. Mathematicians and scientists refer to this narrowed viewing field as the solid angle of the instrument. The solid angle is defined18 as the two-dimensional angle in three dimensional space that an object subtends at a point. In simpler terms, it refers to the magnitude of an object seen from a distant point r (Figure 17). Solid angle has the SI dimension of steradian (sr)18 for which there exists 4π sr in a sphere measured from its center. Figure 17. Solid angle for a sphere18 The solid angle in spherical coordinates for the sphere can be calculated from the formula dΩ = sinθdθdφ where θ is the zenith angle and φ is the azimuth angle. However, since the instrument used in this experiment has a square cross-section, the discussion of solid angle will be limited to the derivation of a solid angle for a square instrument (Figure 18). Figure 18. Solid angle determination for a square19
  • 27. 27 For the muon telescope, it can be easier to view the solid angle by the differential area (dA) equated to the projection of this area divided by the square of the distance R.19 In this case, the distance R from point P has a projected area of dA = dAcosθ = and the solid angle becomes dΩ = = = The calculation of the solid angle was attempted using Wolfram Mathematica 7.0.20 The calculations proved difficult and the solution outputs for this calculation had 3 errors in the integrations, mainly with an output of imaginary roots. A second method was employed to determine the solid angle of the telescope using Monte Carlo methods, which has origins in Buffon's needle experiment, Fermi's unpublished neutron diffusion and, most notably, Von Neumann and Ulam's work at Los Alamos in radiation shielding experiments. A simple example21 of Monte Carlo applied to mathematics is the determination of the numerical value of pi. First, a square is drawn and a circle inside the square such that the edges of the circle are tangent to the sides of the square. Next, uniformly spread small objects within the circle and the square. Then, a ratio is taken of the number of objects inside the circle alone as compared to the total number of objects. By way of geometry, this latter ratio is equivalent to pi/4, so multiplying by 4 will yield an estimate of pi. The more objects used, the better the estimation. The Monte Carlo method for determining the solid angle of an instrument such as the muon telescope has been attempted by O'Brien22 , and it has been used in several recent experiments involving radiation dosimetry.23,24 The algorithm for the Monte Carlo method in solid angle determination is to assign randomly chosen numbers to simulate the coordinates of a muon interaction with a scintillator plane and then whether or not the simulated muon is likely to encounter a second scintillator plane based upon the original particle trajectory and the statistical likelihood that it can hit a secondary plane. If this is repeated enough times, a ratio of those hitting both planes compared to the total will make a
  • 28. 28 ratio that is proportional to some fraction of the solid angle. Multiplying through by this fraction will yield an estimate for the solid angle of the telescope. The Monte Carlo Code for this experiment, developed by Travis Olson and Krisse Nosbisch is found in Appendix A, and the value of the solid angle acceptance obtained for the muon telescope using this code is 88.4 ± 0.36 cm2 ·sr.15
  • 29. 29 Results Collated data from the muon telescope experiments at the NOvA far detector hall are summarized in Tables 4 and 5. The location in Tables 4 and 5 utilizes the generic code L-A-(D), where L = location, A = angle and D = direction. The last two listings refer to a run outside the rails on the east wall and outside the NOvA Far Detector building. S# refers to DAQ Channel corresponding to total hits of a particular module where 0 = alpha, 1 = beta, 2 = gamma, 3 = delta, 4 = coincidences of alpha through delta. The rate (R#) represents the average coincidences per second for each trial. Table 4. Data Summary – telescope mode Date Location Time (s) S0 R0 S1 R1 S2 R2 S3 R3 07/13/11 S-0 7200 112922 ± 336 15.68 ± 0.05 116876 ± 341 16.23 ± 0.05 105768 ± 325 14.69 ± 0.04 74790 ± 273 10.39 ± 0.04 07/13/11 S-21-E 7200 103221 ± 321 14.34 ± 0.05 114865 ± 339 15.95 ± 0.05 101747 ± 319 14.13 ± 0.04 73769 ± 272 10.25 ± 0.04 07/13/11 S-21-W 7200 111235 ± 334 15.45 ± 0.05 112404 ± 335 15.61 ± 0.05 99362 ± 315 13.80 ± 0.04 84432 ± 291 11.73 ± 0.04 07/12/11 M-0 7200 165983 ± 407 23.05 ± 0.06 158756 ± 398 22.05 ± 0.05 161571 ± 402 22.44 ± 0.05 151987 ± 390 21.11 ± 0.05 07/12/11 M-21-E 7200 153994 ± 392 21.38 ± 0.05 149539 ± 387 20.77 ± 0.05 151988 ± 390 21.11 ± 0.05 144135 ± 380 20.01 ± 0.05 07/13/11 M-21-W 7200 152076 ± 390 21.12 ± 0.05 153088 ± 391 21.26 ± 0.05 155245 ± 394 21.56 ± 0.05 145027 ± 381 20.14 ± 0.05 07/11/11 N-0 6500 156993 ± 396 24.15 ± 0.05 153117 ± 391 23.55 ± 0.06 154297 ± 393 23.74 ± 0.06 153679 ± 392 23.64 ± 0.06 07/12/11 N-21-E 7200 157550 ± 397 21.88 ± 0.06 162295 ± 403 22.54 ± 0.06 168776 ± 411 23.44 ± 0.06 149077 ± 386 20.71 ± 0.05 07/12/11 N-21-W 7200 161046 ± 401 22.37 ± 0.06 158616 ± 398 22.03 ± 0.06 160532 ± 401 22.30 ± 0.06 161638 ± 402 22.45 ± 0.06 07/14/11 M out E 7200 142656 ± 378 19.81 ± 0.05 138183 ± 372 19.19 ± 0.05 137295 ± 371 19.07 ± 0.05 133330 ± 365 18.51 ± 0.05 07/12/11 Outside 0 1800 73609 ± 271 40.89 ± 0.15 68526 ± 262 38.07 ± 0.15 61696 ± 248 34.28 ± 0.14 73020 ± 270 40.57 ± 0.15
  • 30. 30 Table 5. Data Summary – shower mode Date Location Time (s) S0 R0 S1 R1 S2 R2 S3 R3 07/14/11 M-0-N 7200 149057 ± 386 20.70 ± 0.05 132845 ± 364 18.45 ± 0.05 138692 ± 372 19.26 ± 0.05 152901 ± 391 21.24 ± 0.05 07/21/11 UMD 10800 419394 ± 648 38.83 ± 0.06 438878 ± 662 40.64 ± 0.06 467513 ± 684 43.29 ± 0.06 473122 ± 688 43.81 ± 0.06
  • 31. 31 Error Determination The rate of accidental coincidence for this experiment15 was calculated from Raccepted = 4T3 RoR1R2R3, where T is the tmc time delay. Accordingly, the average error for four-fold coincidences in each trial is listed in Table 6. As an example, using values from Table 4 for S0, the accidental rate of coincidence was determined to be 6.68 x 10²³ , a full 22 orders of magnitude less than the measured rate of coincidence, therefore effectively negating accidental coincidences from the calculations of muon flux. This miniscule level of coincidence is also true of the other measured fluxes in Tables 6 and 7. Table 6. Calculated Error for Telescope mode trials Location Coincidences Coincidence rate (s-1 ) Flux (1/cm2 /sr/s) x 10-3 S-0 1616 ± 40 0.224 ± .004 2.53 ± 0.046 S-21-E 1384 ± 37 0.192 ± .005 2.17 ± 0.067 S-21-W 1673 ± 41 0.232 ± .005 2.62 ± 0.056 M-0 3245 ± 57 0.451 ± .009 5.10 ± 0.10 M-21-E 2688 ± 52 0.373 ± .007 4.22 ± 0.081 M-21-W 2812 ± 53 0.391 ± .008 4.42 ± 0.092 N-0 3091 ± 56 0.475 ± .009 5.37 ± 0.10 N-21-E 2860 ± 53 0.397 ± .008 4.49 ± 0.094 N-21-W 2824 ± 53 0.392 ± .008 4.43 ± 0.098 M out E 3211 ± 57 0.446 ± .009 5.05 ± 0.010 Outside 0 1004 ± 32 0.66 ± .021 7.46 ± 0.11 Standard sea level25 8.2 Table 7. Calculated Error for Electromagnetic Show Measurement Location Electromagnetic Showers Electromagnetic Shower Rate (s-1 ) M-0 20 ± 4.5 0.0028 ± 0.0006 UMD outside 130 ± 11.4 0.0120 ± 0.001
  • 32. 32 The values derived in Tables 5 and 6 suggests that the data collection methods were, for the most part, less than 1% for a one sigma distribution. Errors inherent in this experiment include uncertainty in measurement of the detector dimensions (smaller contribution), the detector hall (larger contribution due to lack of rigidity of measuring tape) and data collection using the DAQ device. The fiducial volume of the detector is larger than that of Alex Walter's, yet smaller the the NOvA far detector will be, therefore verification of the data with the NOvA far detector will prove invaluable in a more precise flux measurement. Discussion The measured flux outside of the NOvA facility is less than the standard value listed in Table 6 due to the threshold value of 35.05 MeV used in this experiment. An equation to best describe this difference was not found, but the difference observed reflects the expected result as the incident muons may decay before causing the necessary four-fold coincidence and therefore not be counted. Measurements of muon flux at the south end of the NOvA detector hall revealed a 50.4 ± 1.3% decrease when compared to the center of the detector hall and even less than that measured at the north end of the detector hall. The barite layer is obviously the first reason for such a deficit, but it is thought that the thick concrete wall adjacent to the measurement site at the south end as well as overhead ductwork may have contributed to this observation. Measurements on the east and west walls are likewise smaller due to the same shielding effects. The north end of the detector hall had the highest measured flux in large part due to the “gap” in shielding of the overhead barite and lesser overhead infrastructure. When tilted to 21˚ from vertical either east or west, there was a general decrease in flux due to the angular dependence of muon intensity. The flux in the westerly direction was for the most part greater than the east, a verification of the aforementioned East-West effect. There is no definite standard for the electromagnetic shower measurements, and so the results of the shower mode in this experiment verify the fact that the barite and facility construction materials
  • 33. 33 will eliminate most of the electromagnetic flux from the future measurements of muons in the NOvA far detector once installed and collecting data. As expected, the layer of barite, combined with the overburden of rock, sand and infrastructure was the dominating factor in the reductions of observed muon flux inside of the NOvA facility. Given the density of barite (4.48 g/cm3 ), a six-inch layer is equivalent to 4 feet of concrete, and whilst not as large an equivalent depth as shown in the curves of figures y and z, the screening effectiveness for electron showers is quite sufficient as is its ability to effectively attenuate muons by providing additional nuclei for the muon decay process. If muons decay in the barite, the resulting electrons that penetrate the barite will be relatively easy to distinguish in the NOvA far detector data. The 35 MeV threshold used for the telescope is indicative of the energy of muon expected from the vertical and near vertical 21˚ tilt used in this experiment. When compared to the graph shown in figure 2, at 35 MeV, assuming the flux is relatively constant for energies less than 0.1 GeV, the expected flux would be 10-2.5 or 0.00316 /cm2 ·s·sr·GeV/c. The measured values in the southern end of the detector hall were less than this figure though the values for the middle and northern end of the detector hall were slightly larger than this predicted flux. The muon measurement at the south end of the detector hall was therefore in accordance with the predicted moderating effect of the barite. In any event, the barite effectively reduced the muon flux well below the accepted measure of muon flux at sea level. To summarize, the barite, loose gravel and concrete of the NOvA far detector are effective in moderating the incident cosmic ray muon flux by 29 ± 1.4% at the northern and midsection of the far detector hall when compared to the cosmic ray muon background flux and 67 ± 0.8% at the south end of the hall. Electromagnetic showers are further reduced by 77 ± 5.3% on the interior of the NOvA facility when compared with cosmic ray induced background events. These results will likely be verified and/or improved once the far detector is in place and capturing data, due in large part to the more accurate resolution and discrimination utilized by the physicists and technicians collected data for the NOvA project.
  • 34. 34 On a personal note, it was a great honor for me to work with Dr. Habig, Dr. Gran, Travis Olsen and Krissie Nosbisch on this summer project. I feel that this research has enhanced my understanding of the origin, behavior, measurement of and analysis of data generated by cosmic ray muons. It is my intent and hope to continue this study with my own students at Hibbing High School through the construction and operation of and subsequent analysis of data collected by simple muon detectors such as those utilized by QuarkNET and WALTA.
  • 35. 35 References 1. http://www.wikipedia.org/wiki/cosmic_rays accessed June 23, 2011. 2. Bettini, Alessandro (2008). Introduction to Elementary Particle Physics. Cambridge University Press, Cambridge, UK. 3. http://helios.gsfc.nasa.gov/history.html accessed June 23, 2011. 4. http://imagine.gs.fc.nasa.gov/docs/science/know_l1.cosmic_rays.html accessed June 23, 2011. 5. http://srl.caltech.edu/personnel/dick/cos_encyc.html R.A. Mewaldt accessed June 23, 2011. 6. http://keyhole.web.cern.ch/keyhole/detectors/cosmic_rays.jpg 7. Allkofer, O.C. and Grieder, P.K.F. (1984). Cosmic Rays on Earth. Physics Data. Faschinformationszentrum, Karlsruhe, Nr. 25-1 in T.K. Gaisser (1990). 8. Gaisser, Thomas K. (1990) Cosmic Rays and Particle Physics. Cambridge University Press, Cambridge UK. 279 pp. 9. Rosenthal, I.L. (1968) Sov. Phys. Uspekhi, 11, 49. 10. Cassidy G.L., Keuffel, J.W., and Thomson, J.A. (1973) Phys. Rev. D7, 2022 in T.K. Gaiser (1990) 11. http://www.hep.umn.edu/nova/overview/ 12. The NOvA Technical Design Report – NovA Collaboration (Ayres, D.S. et al). FERMILAB- DESIGN_2007-01. 13. image accessed from http://www-nova.fnal.gov/images_v2/graphics/Overall-View-Looking- SW-med.jpg on July 20, 2011. 14. Walter, A., Marshak, M. Cosmic Ray Flux at NOνA Far Detector Building 15. Cosmic Ray Shielding at NOvA – NOvA Collaboration (Ayres, D.S. et al). NOVA-doc-6617 16. Hansen, S; T. Jordan, T. Kiper, D. Claes, G. Snow, H, Berns, T.H. Burnett, R. Gran, R.J. Wilkes. Low-cost data acquisition card for school-network cosmic ray detectors. Nuclear Science, IEEE Transactions on, vol. 51, no. 3, pp. 926-930, June 2004. 17. http://en.wikipedia.org/wiki/Hexadecimal accessed July 20, 2011. 18. http://en.wikipedia.org/wiki/Solid_angle accessed July 20, 2011. 19. http://web.utk.edu/~rpevey/NE406/lesson2.htm downloaded July 20, 2011. 20. www.wolfram.com 21. Kalos, M.H. and Whitlock, P.A. (2008) Monte Carlo Methods, 2nd ed. Weinheim: Wiley- Blackwell. 22. O'Brien, S. (2006) Determining the Solid Angle of Two Detectors using Monte Carlo Methods. http://acadine.physics.jmu.edu/group/technical_notes/Solid_angle_latex/solid_angle.pdf accessed July 19, 2011. 23. Whitcher, R.(2002) Calculation of the Average Solid Angle Subtended by a Detector to Source in a Parallel Plane by a Monte Carlo Method. Radiat Prot Dosimetry 102 (4): 365-369. 24. Whitcher, R. (2006) A Monte Carlo method to calculate the average solid angle subtended by a right cylinder to a source that is circular or rectangular, plane or thick, at any position and orientation. Radiat Prot Dosimetry 118(4): 459-474. 25. Rossi, Bruno. "Interpretation of Cosmic Ray Phenomena." Reviews of Modern Physics, vol.20, no.3 1948
  • 36. 36 Appendix A: LINUX Monte Carlo Program Solid Angle Determination by UMD Physics Student Travis Olson // a program to determine the projected area and solid angle of a particle // detector using monte carlo methodes // by Travis Olson 07/22/11 #include<iostream> #include<cstdlib> #include<math.h> #include<fstream> #include<ctime> #include<iomanip> using namespace std; int main() { // randomly generated variable double x_rand,y_rand,theta,phi,CosTheta; //user imput variables long int events; long double x_dim,y_dim,height; // location on other plate variables long double x_loc, y_loc, hyp; //variables for checking whether or not an event is good int x_pass,y_pass,total_pass; //pi double pi=3.14159265; // totals for cosine theta and phi long double TotCosTheta=0; // averages for cosine thetai long double AvgCosTheta; // store the projected area long double area=0; //ratio of passed to failed long double PassRatio,ctr_PassRatio; // seeding the random number generator srand(time(0)); // request and read inputs for the dimensions and number of trials cout<<"n How many events do you want to use to measure? n"; cin>>events; cout<<"n What is the x dimension of the detector? n"; cin>>x_dim; cout<<"n What is the y dimension of the detector? n"; cin>>y_dim; cout<<"n What is the distance between the top and botton plate of the detector? n"; cin>>height; // check to see if the dimensions and number of trials makes sense // if not yell at the user if(events<=0) { cout<<"n Enter at least 1 for the number of events. n"; } else if (x_dim<=0) { cout<<"n Enter a value greater than 0 for the x dimension. n"; } else if (y_dim<=0) {
  • 37. 37 cout<<"n Enter a value greater than 0 for the y dimension. n"; } else if (height<0) { cout<<"n Enter a value of at least 0 for the height. n"; } else { // initialize total good events variable total_pass=0; //loop to generate events number of trials for(int i=0; i<events; i++) { //initialize test variables x_pass=0; y_pass=0; //generate randnum number for x and y locations // and for the theta and phi angles x_rand=(static_cast<double>(rand())/(RAND_MAX/x_dim)); y_rand=(static_cast<double>(rand())/(RAND_MAX/y_dim)); CosTheta=static_cast<double>(rand())/RAND_MAX; phi=(static_cast<double>(rand())/(RAND_MAX/(2*pi))); theta=acos(CosTheta); //calculate the location on the other plate with the variables hyp=height/CosTheta; x_loc=hyp*sin(theta)*cos(phi)+x_rand; y_loc=hyp*sin(theta)*sin(phi)+y_rand; // check to see if its a good event if (x_loc>=0 && x_loc<=x_dim) { x_pass++; } if (y_loc>=0 && y_loc<=y_dim) { y_pass++; } if (x_pass==1 && y_pass==1) { // if good increment total passed and total cosine of theta total_pass++; TotCosTheta+=CosTheta; } } //compute averages and pass ratio PassRatio=1.0*total_pass/events; // cout<<total_pass<<"n"; // cout<<PassRatio<<"n"; AvgCosTheta=TotCosTheta/events; //cout<<AvgCosTheta<<"n"; //compute projected area area=AvgCosTheta*x_dim*y_dim*PassRatio*2*pi; //read out projected area and solid angle cout<<"The projected area is "<<(area)<<"n"; cout<<"The solid angle is "<<PassRatio*2*pi<<"n"; // stream raw data and results ofstream data("projected_area_data.txt",ios::app); data<<"total number of trials: t"; data<<events<<'n'; data<<"total number of good events: t"; data<<total_pass<<'n';
  • 38. 38 data<<"x dimension: t"; data<<x_dim<<'n'; data<<"y dimension: t"; data<<y_dim<<'n'; data<<"the seperation between the plates t"; data<<height<<'n'; data<<"average cosine of theta: t"; data<<AvgCosTheta<<'n'; data<<"solid angle: t"; data<<PassRatio*2*pi<<'n'; data<<"projected area t"; data<<area<<endl; } } // it takes about 1 minute to do 100,000,000 trials