1. The Movement of Energy
The "cause" of weather
Weather is caused by the movement or transfer of energy. Energy is transferred wherever there is
a temperature difference between two objects. There are three main ways energy can be
transferred: radiation, conduction and convection.
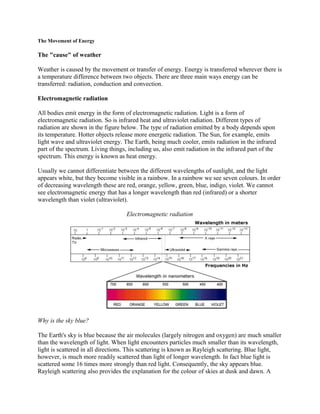
Electromagnetic radiation
All bodies emit energy in the form of electromagnetic radiation. Light is a form of
electromagnetic radiation. So is infrared heat and ultraviolet radiation. Different types of
radiation are shown in the figure below. The type of radiation emitted by a body depends upon
its temperature. Hotter objects release more energetic radiation. The Sun, for example, emits
light wave and ultraviolet energy. The Earth, being much cooler, emits radiation in the infrared
part of the spectrum. Living things, including us, also emit radiation in the infrared part of the
spectrum. This energy is known as heat energy.
Usually we cannot differentiate between the different wavelengths of sunlight, and the light
appears white, but they become visible in a rainbow. In a rainbow we see seven colours. In order
of decreasing wavelength these are red, orange, yellow, green, blue, indigo, violet. We cannot
see electromagnetic energy that has a longer wavelength than red (infrared) or a shorter
wavelength than violet (ultraviolet).
Electromagnetic radiation
Why is the sky blue?
The Earth's sky is blue because the air molecules (largely nitrogen and oxygen) are much smaller
than the wavelength of light. When light encounters particles much smaller than its wavelength,
light is scattered in all directions. This scattering is known as Rayleigh scattering. Blue light,
however, is much more readily scattered than light of longer wavelength. In fact blue light is
scattered some 16 times more strongly than red light. Consequently, the sky appears blue.
Rayleigh scattering also provides the explanation for the colour of skies at dusk and dawn. A
2. setting or rising Sun appears red because the blue light has been scattered away from the direct
sunlight.
Occasionally, other colours of the sky can be seen. These are caused by the scattering of light by
particles much bigger than air molecules, sometimes larger than the wavelength of light. Dust
particles, from natural or man-made pollution, can be many times larger than air molecules but
still small enough to not fall out to the ground. If the dust particles are much larger than the
wavelength of light, the scattered light will be neutral in colour, for example white or gray. By
the same principle water molecules in clouds are sufficiently large to scatter all wavelengths
equally. Therefore the scattered light contains all wavelengths and clouds appear white.
If the dust particles are of approximately the same size as the wavelength of light, all sorts of
interesting scattering phenomena may happen. This happens here on Earth from time to time,
particularly in desert areas, where the sky may appear white, brown, or some other colour.
Transfer of radiation: absorption
The transfer of radiation may be accomplished by direct absorption by the cooler object of
energy emitted by the warmer one. Food placed under a grill absorbs energy radiated from the
heating elements. Similarly, the Earth absorbs energy emitted from the Sun. How much the
cooler object heats up depends upon the nature of that object. Certain materials like rock require
much less energy to raise their temperature than others, such as water. That is to say, water has a
larger heat capacity than rock (about 5 times larger).
Transfer of radiation: reflection and scattering
Transfer of radiation can occur in other ways besides absorption. Certain material bodies, for
example glass or pure air, are transparent to visible radiation (light), allowing the energy to pass
straight through without absorption. This is not the case for infrared radiation, which is trapped
(absorbed) by glass and certain greenhouse gases. Other material bodies neither absorb nor allow
3. through radiation, but reflect it back. Light surfaces such as snow and ice are good reflectors of
visible radiation. Dust in the atmosphere scatters radiation. The blue of the sky is due to the
scattering of the blue part of visible light from the Sun by air molecules, the reds and yellows of
sunset are due to scattering by dust particles.
Conduction
Transfer of energy can also be made by conduction, if two objects are in contact. A heating
element of a kettle heats its water by conduction of energy. Metal is a good conductor, as is
water. Air is a poor conductor of energy and therefore acts as a good insulator, as, for example,
between the outer and inner skins of a cavity wall house, or between the human body and outside
air by air spaces between fibres of clothing.
Convection
Convection of energy involves the movement of the body storing the energy. Clearly, convection
can only occur in fluids - liquids and gases. Both air and water act as convecting agents for the
transfer of energy. Because air is a poor conductor of energy, convection is a major process of
energy movement in the Earth's atmosphere. In the atmosphere, convection occurs when a
shallow layer of air in contact with a hot surface warms by conduction, acquires buoyancy
(warmer air is less dense than colder air), and rises, taking with it the energy that it stores.
Movement of radiation in the atmosphere
In a weather context, energy radiated from the Sun is distributed at the Earth by absorption,
conduction, convection, reflection and scattering. The Sun radiates energy at a rate which, for
practical purposes, is unchanging. Most of this radiation is visible light and ultra - violet energy.
At the outer limit of the Earth's atmosphere, the radiation received is 1370 watts per square
metre. This is called the solar constant. Passing through the atmosphere it is depleted in various
ways.
Air in an atmosphere free from clouds and pollution absorbs very little solar radiation, which
passes through to the Earth's surface. Here, some of the radiation is absorbed and some is
reflected. The absorbed part heats the surface, causing its temperature to rise. The Earth's surface
also emits energy, but because it is much cooler than the Sun, it does so in the infrared part of the
spectrum. This is heat energy. Often, the Sun's energy is called short-wave radiation, whilst
radiation from the Earth's surface is called long-wave radiation. The more energetic the radiation,
the shorter its wavelength. Thus hotter objects emit shorter wavelength radiation.
The greenhouse effect
Whilst the air allows short-wave light to pass through to the Earth's surface, certain gases in the
atmosphere impede the passage of the long - wave heat energy by absorbing it. Water vapour and
carbon dioxide are particularly effective at absorbing the long-wave heat radiation. This warms
the air, which in turn radiates some of the energy back to the Earth's surface and some to space.
4. Thus, the atmosphere, by trapping some of the outgoing radiation, keeps the Earth's surface
warmer than it would otherwise be.
This warming effect is called the "greenhouse effect" because it is the same process as that which
occurs in a greenhouse on a sunny day. The glass is transparent to short-wave radiation but
absorbs the outgoing long-wave radiation, causing a rise in temperature inside the greenhouse.
Water vapour and carbon dioxide are called "greenhouse gases". Other greenhouse gases include
methane and CFCs from aerosol cans.
The greenhouse effect
Convection in the atmosphere
Heat energy in the atmosphere is also transferred by convection as described above, with the
heating and ascension of surface air. Such convection processes in a large part dominate the
world weather, including the production of rain and snow, thunderstorms, hurricanes and frontal
systems. How many of these weather phenomena originate will be the topic of the following
lessons in this section.
Atmospheric Effects on Incoming Solar Radiation
Three atmospheric processes modify the solar radiation passing through our
atmosphere destined to the Earth's surface. These processes act on the radiation when
it interacts with gases and suspended particles found in the atmosphere. The process
of scattering occurs when small particles and gas molecules diffuse part of the
incoming solar radiation in random directions without any alteration to the
wavelength of the electromagnetic energy (Figure 7f-1). Scattering does, however,
reduce the amount of incoming radiation reaching the Earth's surface. A significant
proportion of scattered shortwave solar radiation is redirected back to space. The
amount of scattering that takes place is dependent on two factors: wavelength of the
5. incoming radiation and the size of the scattering particle or gas molecule. In the
Earth's atmosphere, the presence of a large number of particles with a size of about
0.5 microns results in shorter wavelengths being preferentially scattered. This factor
also causes our sky to look blue because this color corresponds to those wavelengths
that are best diffused. If scattering did not occur in our atmosphere the daylight sky
would be black.
Figure 7f-1: The process of atmospheric scattering causes rays
of sunlight to be redirected to a new direction after hitting a
particle in the atmosphere. In this illustration, we see how
three particles send light rays off into three different
directions. Scattering does not change the striking light ray's
wavelength or intensity.
If intercepted, some gases and particles in the atmosphere have the ability to absorb
incoming insolation (Figure 7f-2). Absorption is defined as a process in which solar
6. radiation is retained by a substance and converted into heat energy. The creation of
heat energy also causes the substance to emit its own radiation. In general, the
absorption of solar radiation by substances in the Earth's atmosphere results in
temperatures that get no higher than 1800° Celsius. According to Wien's Law, bodies
with temperatures at this level or lower would emit their radiation in the longwave
band. Further, this emission of radiation is in all directions so a sizable proportion of
this energy is lost to space.
Figure 7f-2: Atmospheric absorption. In this process, sunlight is
absorbed by an atmospheric particle, transferred into heat
energy, and then converted into longwave radiation emissions
that come from the particle.
7. The final process in the atmosphere that modifies incoming solar radiation is
reflection (Figure 7f-3). Reflection is a process where sunlight is redirect by 180°
after it strikes an atmospheric particle. This redirection causes a 100% loss of the
insolation. Most of the reflection in our atmosphere occurs in clouds when light is
intercepted by particles of liquid and frozen water. The reflectivity of a cloud can
range from 40 to 90%.
Figure 7f-3: Atmospheric reflection. In this process, the solar
radiation striking an atmospheric particle is redirected back to
space unchanged.
8. Sunlight reaching the Earth's surface unmodified by any of the above atmospheric
processes is termed direct solar radiation. Solar radiation that reaches the Earth's
surface after it was altered by the process of scattering is called diffused solar
radiation. Not all of the direct and diffused radiation available at the Earth's surface is
used to do work (photosynthesis, creation of sensible heat, evaporation, etc.). As in
the atmosphere, some of the radiation received at the Earth's surface is redirected back
to space by reflection. The following image describes the spatial pattern of surface
reflectivity as measured for the year 1987.
Figure 7f-4: Annual (1987) reflectivity of the Earth's surface.
(Image produced by the CoVis Greenhouse Effect Visualizer).
The reflectivity or albedo of the Earth's surface varies with the type of material that
covers it. For example, fresh snow can reflect up to 95% of the insolation that reaches
it surface. Some other surface type reflectivities are:
· Dry sand 35 to 45%
· Broadleaf deciduous forest 5 to 10%
· Needleleaf confierous forest 10 to 20%
· Grass type vegetation 15 to 25%
9. Reflectivity of the surface is often described by the term surface albedo. The Earth's
average albedo, reflectance from both the atmosphere and the surface, is about 30%.
Figure 7f-5 describes the modification of solar radiation by atmospheric and surface
processes for the whole Earth over a period of one year. Of all the sunlight that passes
through the atmosphere annually, only 51% is available at the Earth's surface to do
work. This energy is used to heat the Earth's surface and lower atmosphere, melt and
evaporate water, and run photosynthesis in plants. Of the other 49%, 4% is reflected
back to space by the Earth's surface, 26% is scattered or reflected to space by clouds
and atmospheric particles, and 19% is absorbed by atmospheric gases, particles, and
clouds.
Figure 7f-5: Global modification of incoming solar radiation by
atmospheric and surface processes.
10. Satellite structure and operation
Satellites are built for a broad variety of missions, so each one is different.
However, just as any motor-driven vehicle has a chassis, an engine, fuel tanks and steering systems, all
satellites share the same basic structure and organization.
The core element is the platform or bus, which
accommodates the mission payload and all the
equipment needed to operate it. In particular, the
bus provides the systems for acquiring
measurements, communicating, sending and
receiving commands, and performing management
and housekeeping operations. It is usually a very
rigid truss structure designed to withstand the
accelerations and vibrations generated during
launch.
Word watch
What is a satellite?
Literally, a satellite is a celestial object orbiting a
larger body in periodic fashion as a result of
gravitational attraction. Since the beginning of
the space adventure, we have made a distinction
between natural satellites like the Moon and
artificial satellites. However, the term satellite
used alone is now commonly used to describe
the man-made variety.
Altimetry satellite JASON-1. Credits: CNES
Depending on its mission, a satellite may carry a number of instruments, for example to acquire
imagery, record data, and transmit and receive radio signals. It generates its own power from solar
11. panels.
An Earth satellite generally orbits at an altitude of between 450 and 36,000 km. Its motion is sustained
naturally by gravitational attraction. However, it also has its own propulsion system for orbital
manoeuvres, which in some cases may include boosting the satellite to its final orbit.
All these systems are controlled by an onboard computer that manages all the equipment and Radar
(Microwave) Remote Sensing
Page 1 of 3
RADAR stands for "RAdio Detection And Ranging". By virtue of sending out pulses of microwave electromagnetic
radiation this type of instrument can be classified as an "active sensor" - it measures the time between pulses and
their reflected components to determine distance. Different pulse intervals, different wavelengths, different geometry
and polarizations can be combined to roughness characteristics of the earth surface.
Radar wavelengths range between less than 1 millimeter to 1 meter.
All photos can be called images but not all images should be called photos - images that are acquired digitally are
usually not referred to as photographs ... there is no such thing as a radar photograph!
Radar uses relative long wavelengths which allows these systems to "see" through clouds, smoke, and some
vegetation. Also, being an active system, it can be operated day or night. There are disadvantages, such as the non-unique
spectral properties of the returned radar signal. Unlike infrared data that help us to identify different minerals or
vegetation types from reflected sunlight, radar only shows the difference in the surface roughness and geometry and
moisture content of the ground (the complex dielectric constant). Radar and infrared sensors are complimentary
instruments and are often used together to study the same types of earth surfaces.
Color Aerial Photography vs Processed Radar Imagery
12. .
Color Photography vs Radar Derived DEM (Digital Elevation Model)
.
Unlike instruments that look straight down (i.e. Aerial Cameras and nadir pointing satellite sensors), radar data are
collected looking off to the side. Because radar measures the time that it takes for the signals to go from the antenna
to the ground and back, this angled perspective is a necessity because this causes there to be a delay between the
parts of the returned pulse that are farthest from the antenna and the parts that are closest. This very small delay is
measured with very high precision, these measurements are filtered using complex functions for removing noise and
then these time measurements are converted to a distance for every location in the radar swath and viola we have a
map of the surface topography.
Cameras capture reflected visible wavelengths.
Radar captures emitted microwave wavelengths that are bounced back to the antenna.
.
13. Plan Position Indicator - the kind of radar used by air traffic controllers is not considered an "imaging radar"
Radar was originally developed in the 1950s, the first airborne system was called SLAR (Side-Looking Airborne
Radar) and was used for improving the resolution for military reconnaissance, early airborne radar systems were
limited by the physical size of the antenna however. Later, SAR (Synthetic Aperture Radar), was developed and are
widely used in many countries for civilian applications.
San Francisco (1950's acquired by an early SLAR system)
Types of Imaging Radar
SLAR (Side-Looking Airborne Radar)
- develop by guess who in the 1950's
- airborne, fixed antenna width, sends one pulse at a time and measures what gets scattered back
- resolution determined by wavelength and antenna size (narrow antenna width = higher resolution)
SAR (Synthetic Aperture Radar)
- also developed by those responsible for SLAR, but this configuration is not dependent on the physical antenna size
although to achieve higher resolution the receiving antenna components and transmitter components need to be
separated.
- "synthesizes" a very broad antenna by sending multiple pulses
Radar resolution has two components; the "range" resolution and the "azimuth" resolution. These are determined by,
among other factors, the width of the synthesized antenna (which is dictated by the pulse interval) and the wavelength.
. .
Next Page
14. The diagrams below illustrate some of the common terms used to describe the geometry of a radar
image. Most
important are the "look angle", the angle at which the radar pulse hits the surface, and the interval
between pulses.
Radar images show surfaces that bounce back the radar pulse (called "radar backscatter"), the bright areas are strong
reflectors (such as buildings in an urban area, or a bolder field in the desert), while dark parts of the image represent
surfaces that reflect very little or no energy (such as a frozen lake or oil film on the ocean). The amount of backscatter
varies as a function of incidence angle, surface roughness and soil moisture (depending on the wavelength).
A smooth surface acts like a mirror when the angle is small, but with angles greater than 20 degrees the amount of
backscatter sharply declines because the signal bounces off the surface away from the antenna. The opposite is true
for a rough surface. At steep angles (incidence angle less than 20 degrees), most of the emitted pulse is scattered in
random directions so that the total backscatter measured by the antenna is lower than from a smooth surface at the
same angle. By changing the incidence angle and comparing how the backscatter changes with different angles it is
possible to map different types of surfaces (such as smooth vs. rough lava).
Backscatter for different incidence
angles.
Corner reflectors amplify backscatter, particularly in urban areas, "double
bounce" "triple bounce".
15. Oil film from natural oil seeps off the coast from
UCSB. (shorter wavelength)
Strong response from metal, see the oil
rigs? (longer wavelength)
Open pit Copper mine.
Angkor, Cambodia
Jungle Temple
Using different combinations of wavelength and incidence angle, the characteristics of the recorded backscatter can
be compared and interpreted. Acquiring a detailed dataset with the necessary calibration field work and
measurements is an ordeal to plan and execute but with a good dataset radar imagery can reveal characteristics of
the landslide that visible and infrared imagery cannot.
. .
The assumption is that different vegetation types (e.g., desert, grasslands, forests or frozen tundra) will all have
different backscatter signatures. In addition, the basic reflectivity of the soil, called the "dielectric constant" will change
depending on the amount of water and organic matter that the soil contains. Dry soil has a low dielectric constant, so
that little radar energy will be reflected. Saturated soil will have a high dielectric and will be a strong reflector. Moist
and partially frozen soils will have intermediate values.
16. .
Short wavelength radar (3 cm) will be reflected from the tops of trees. Long wavelength radar (24 cm) data will
normally go down to the ground and be reflected back. Intermediate wavelengths (6 cm) will sometimes experience
multiple scattering events between the canopy, the branches and the ground. By acquiring multiple wavelength, multi
directional radar imagery of a forested area it is possible to discern information about the canopy structure and
estimate above ground boimass.
. .
SAR transmits pulses of microwaves and measures the strength and the time delay of the energy that is scattered
back to the antenna.
Next Page
. .
SAR concept of "synthetic aperture" comes from processing techniques that can simulate a much larger antenna size.
The SAR instrument used by the Shuttle Radar Topography Mission (SRTM) consist of a 197 foot long mast with a 28
ft receiver, the biggest such object ever deployed in space. With this long distance between receiver and transmitter
the triangulation of the signals is potentially much more accurate.
17. The spaceborne SAR flew aboard two space shuttle flights in April and October, 1994. The unique perspective of
space and the advanced capabilities of this Spaceborne Imaging Radar-C and X-Band Synthetic Aperture Radar (SIR-C/
X-SAR) Mission have allowed scientists to explore our planet in a way that has not yet been possible. Data from
SIR-C/X-SAR and other international SAR systems such as the European Space Agency's Remote Sensing Satellites
(ERS-1/2), Japan's Earth Resources Satellite (JERS-1), and Canada's Radarsat are currently being used for studies
of ecology, hydrology, oceanography, geology, ice sheets, glaciers, icebergs and for archeological exploration.
Ecological applications of SAR include land cover classification, above-ground woody plant biomass measurement,
wetland inundation delineation, crop identification and monitoring. SAR data have also been used for malaria risk
mapping in tropical regions by providing imagery that shows the spatial and temporal distribution of flooding.
Hydrologic applications of SAR include measuring snow condition and snow pack thickness, which is used for
estimating runoff and water supply. Oceanographers are using SAR data to study surface and internal waves,
wave/current interactions, arctic sea-ice motions and for monitoring shipping lanes for icebergs. SAR data are also
being used by geologists in studies of past climates and volcanic/earthquake hazards.
Seasat image of wave patterns (not clouds!) off the coast of Southern California
The longer L-band and P-band radar wavelengths have the useful capability of being able to see beneath the surface.
SIR-C/X-SAR obtained data of the Sahara Desert that showed braided channels and paleodrainages beneath the
surface, this was a complete surprise to the scientists and engineers involved because although is was theoretically
possible they did not anticipate being able to see more than several meters into the surface. The important property of
this part of the world is that there is no moisture (very low dielectric), even at depth, so the waves can propagate
through the sand, bounce off the solid bedrock and then back out again.
18. These images are from a region of North Africa's Sahara Desert near Kufra Oasis in southeast Libya.
.
Volcano, earthquake, floods, fires, landslides and other natural hazard investigations benefit greatly from a unique
capability of SAR called "interferometry" which uses coordinated measurements obtained at slightly different angles
acquired in sequence along a flight line. These measurements combined to produce distance and surface heights.
Combining one interferometric data pair with a third measurement, obtained at a different time, allows for very precise
measurements to be made. This technique, known as differential interferometry, has enormous potential for mapping
changes in topography on the order of a centimeter and for mapping subtle shifts in earth's crust in areas of active
faulting.
High-resolution maps of topography and topographic change generated from SAR interferometry are also extremely
valuable for studies of ice sheets and glaciers. Over 75% of the world's fresh water is presently locked-up in ice and
snow.
Yellowstone Radar Image
19. While the general retreat of mountain glaciers globally is believed responsible for approximately ¼-½ of the current 2
millimeter-per-year increase in sea level, the other sources are unknown. Radar provides a means of regionally
monitoring the health of the ice sheets which can be used to assess the threat of sea level rise.
San Fransisco sea level rise map, Bangladesh sea level rise projection
Another emerging area for SAR study is archeology. For example, a SIR-C image of the region around the site of the
lost city of Ubar in southern Oman, on the Arabian Peninsula. The ancient city was discovered in 1992 with the aid of
remote sensing data, it is believed that Ubar was a desert outpost and existed from about 2800 B.C. to about 300 A.D.
The actual site of the fortress of the lost city of Uba is too small to be detected in the image, but the linear tracks
leading to the site appeared prominently due to the propensity of radar to resolve linear features.
Topography of Nigeria and Venezuela, notice the linears.
.
The End | Back
The spatial resolution of a sensor can be defined as the area of ground imaged by one pixel. High
spatial resolution means each pixel represents a small square of ground, so it is easy to identify tiny
features in an image. Spectral resolution is the width of the regions of the electromagnetic spectrum
that a sensor will detect. High spectral resolution allows material identification through a
characterization of its spectrum. spatial Resolution depends on space while temporal resolution
depends on time.